

Crypto World
Why Bitcoin’s Next Big Move Hinges on $60K and $82K According to Coinbase Institutional’s GEX Report

TLDR:
- Coinbase Institutional’s GEX report identifies $60,000 as the thickest BTC support zone in current market structure.
- Negative gamma between $60K and $70K could accelerate Bitcoin’s downside beyond what discretionary buyers anticipate.
- Positive gamma from $85K to $90K points to a slow, choppy grind rather than a sharp breakout for Bitcoin.
- The report favors call spreads over outright calls above $82K, reducing theta bleed during uncertain market conditions.
Gamma Exposure (GEX) is now part of Coinbase Institutional’s latest Bitcoin analysis report. The report combines options market data with key support and resistance levels. It identifies $60,000 and $82,000 as critical price zones for BTC.
The findings suggest that negative gamma could accelerate downside moves, while positive gamma above $85,000 may slow upside momentum. Traders are urged to adjust their strategies based on these dynamics.
Negative Gamma Raises Downside Risk Below $70K
Coinbase Institutional’s report introduces GEX as a tool that turns the options market into a hidden liquidity layer. It helps traders decide between range trades and breakout strategies. The metric tracks how options dealers hedge their positions when Bitcoin’s price shifts.
Gamma measures how quickly an option’s price sensitivity changes as BTC moves. When dealers are short gamma, they tend to buy as prices rise and sell as prices fall. This behavior can turn small price moves into sharper, faster trends.
The report shows a pronounced negative gamma band concentrated between $60,000 and $70,000. That setup means any move toward $60,000 could accelerate beyond what typical buyers expect. Liquidation-style cascades become more likely in this zone.
Support near $60,000 remains the thickest demand cluster in the current price structure. However, the GEX data advises against buying the initial selloff. Traders are better positioned to enter only after a confirmed reclaim of that level.
Positive Gamma Between $85K and $90K Signals a Slow Grind
Above $82,000, the gamma picture shifts toward stabilization. A breach and hold above $82,000 would suggest that supply at that level has been absorbed. From there, BTC would likely move toward the next liquidity bands higher up.
The $85,000 to $90,000 range carries meaningful positive gamma. In positive gamma zones, dealers sell into strength and buy into weakness. That pattern tends to reduce volatility and create a slow, choppy upward grind.
Because of this chop risk, the report favors call spreads over outright calls in an $82,000 breakout scenario. Call spreads retain convexity while cutting theta bleed during a grind. That trade structure fits an environment where the macro catalyst remains unclear.
For traders managing existing long portfolios, protective put spreads offer a cleaner hedge if $60,000 fails. Bear put spreads are preferred over outright short positions, given the elevated risk of sharp reversals.
The report concludes that the $82,000 level remains the key gate that must open before any sustained upside becomes probable.


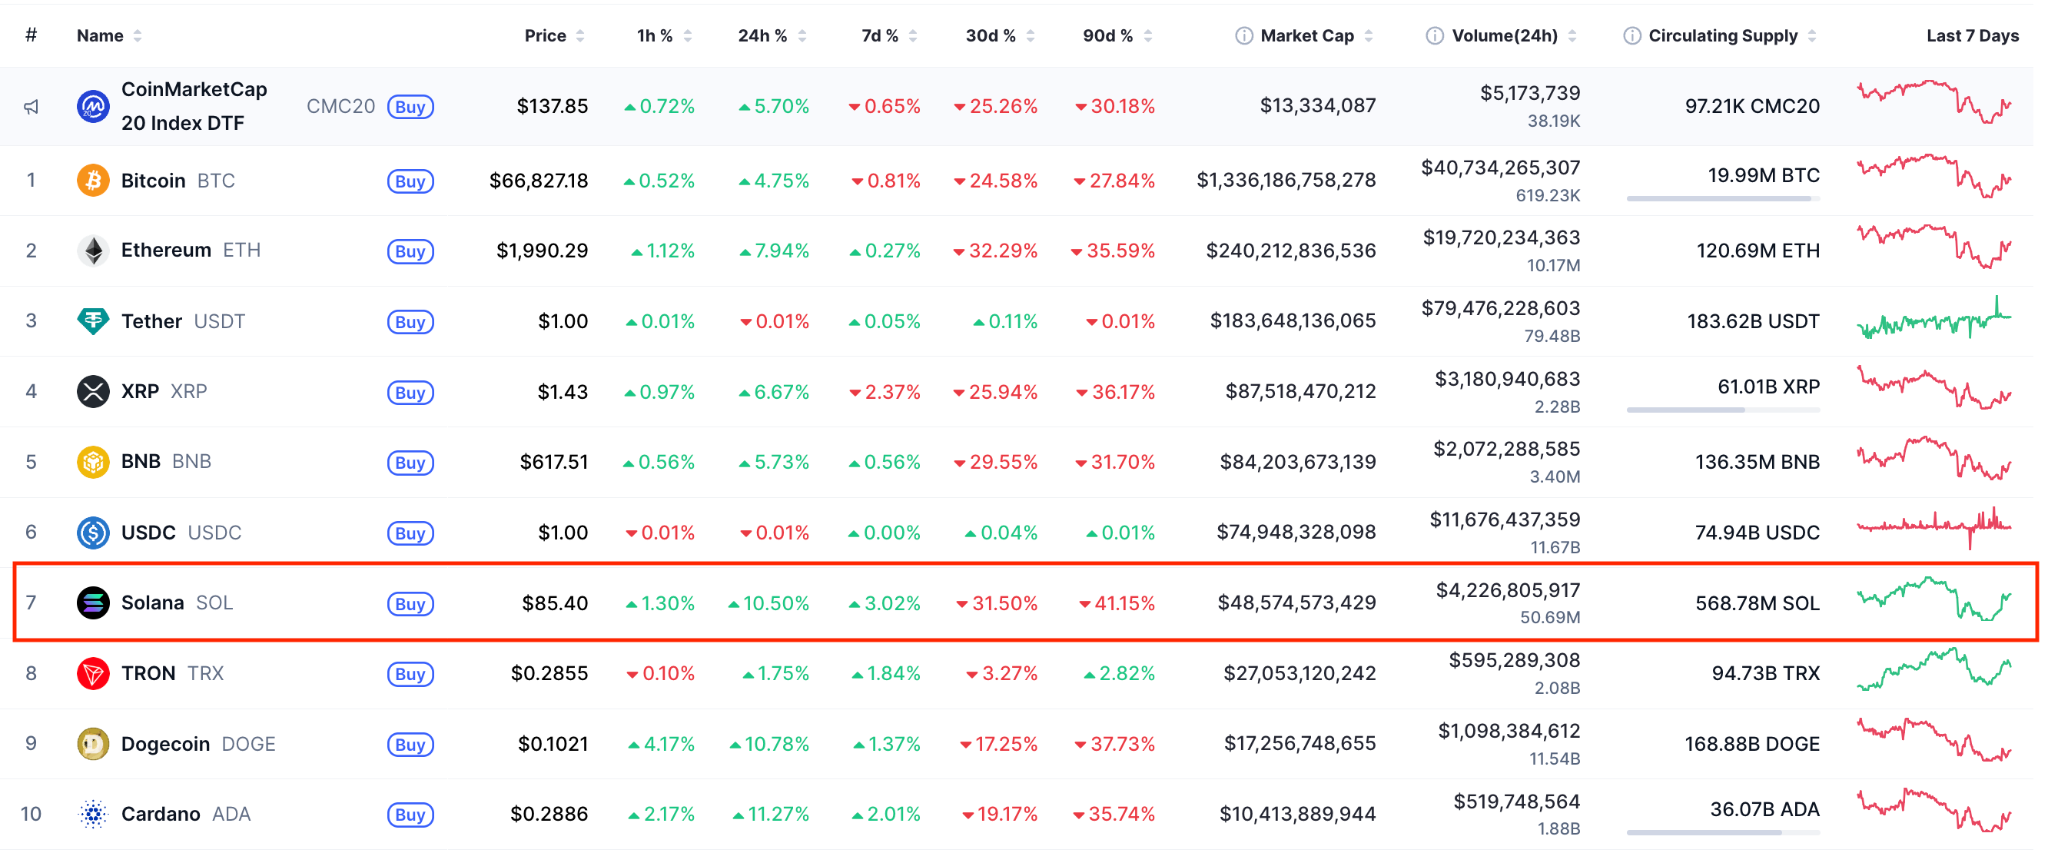
Solana’s SOL (SOL) has rallied 10% over the past 24 hours, rising to an intraday high of $86 on Wednesday.
The recovery was accompanied by a leap in futures activity, with SOL’s open interest rising by more than 5% to $5.27 billion.
Analysts are now focusing on the short-term technical setup and fundamental indicators that may signal a major turning point for SOL.
Key takeaways:
-
SOL price has risen 10% in 24 hours, fueled by bullishness in the broader market and Solana ETF inflows.
-
Solana’s symmetrical triangle breakout targets $110 SOL price.
SOL recovers with the crypto market
The SOL/USD pair rose as much as 13.6% to $86 on Wednesday from a two-week low of $75 on Tuesday, amid a marketwide recovery.
Bitcoin (BTC), the market leader, was trading at $66,800 at the time of writing, up 5% over the 24 hours. Second-placed Ether (ETH) has gained about 8% on the day to trade just above $1,990. XRP (XRP) has also posted significant daily gains among the top 10 cryptocurrencies, up 6% over the same period.
As a result, the global crypto market capitalization is up 4% on the day to $2.28 trillion on Wednesday.

Solana’s surge today is accompanied by significant short liquidations totaling $15.4 million over the last 24 hours, signaling intense demand-side pressure.
The buyers were also US-based spot Solana ETFs, which have recorded $40 million in net inflows since Feb. 9.

The growing demand-side pressure that could push SOL prices higher when coupled with increased inflows from global Solana investment products and buying by whales.

SOL’s symmetrical triangle breakout targets $110
Data from TradingView shows SOL price breaking above a symmetrical triangle on the six-hour time frame, as shown in the chart below.
The price needs to close above the 100-day simple moving average (SMA) at $86 to sustain the upward momentum.
The measured target of the prevailing pattern, calculated by adding the height of the triangle to the breakout point, is $110, coinciding with the 50-day SMA. This represents a 28.5% rally from the current levels.

As Cointelegraph reported, a daily candlestick close above the 20-day EMA, currently at $88, would open the way for a rise toward $95 and later to $117.
Glassnode’s realized price distribution data for Solana shows limited historical buying activity above $85, suggesting that the bulls could easily break this resistance.
In other words, there are relatively few SOL holders with a cost basis above this zone, reducing the chances of sellers stepping in decisively until the price reaches higher supply zones.
The next significant resistance sits at $115, where approximately 22 million SOL were previously acquired.

This article does not contain investment advice or recommendations. Every investment and trading move involves risk, and readers should conduct their own research when making a decision. While we strive to provide accurate and timely information, Cointelegraph does not guarantee the accuracy, completeness, or reliability of any information in this article. This article may contain forward-looking statements that are subject to risks and uncertainties. Cointelegraph will not be liable for any loss or damage arising from your reliance on this information.

European investors are getting a new route to crypto-linked yields through a regulated vehicle that ties traditional finance to a Bitcoin treasury. 21Shares has unveiled STRC NA, an investment product that provides exposure to Strategy’s preferred stock as a gateway to the economics of Strategy’s Bitcoin reserves. The plan is to list this ETP on Euronext Amsterdam this Thursday, offering access to a dividend that is backed by Strategy’s Bitcoin treasury and designed to be accessible via standard brokerage accounts. Strategy’s Bitcoin inventory remains sizable, reflecting what the issuer terms the world’s largest public holding of the digital asset. This move marks a notable expansion in the ETP issuer’s lineup, signaling growing institutional appeal for yield-bearing, crypto-linked Securities in Europe.
Key takeaways
- 21Shares is launching the STRC NA ETP on Euronext Amsterdam, providing European investors with a regulated conduit to Strategy’s crypto-linked equity.
- The ETP’s dividend is variable, targeting an annualized rate of about 11.25% and is backed by Strategy’s Bitcoin treasury.
- Strategy’s treasury reportedly holds 717,722 BTC, valued at roughly $47 billion at current prices, anchoring the ETP’s cash-flow potential.
- STRC NA represents 21Shares’ first equity-linked product, expanding beyond its crypto-only ETP lineup and moving into crypto-backed corporate securities.
- Alongside STRC NA, 21Shares has recently launched the Spot SUI ETF (TSUI) in the United States, listing on Nasdaq and broadening the firm’s regulated crypto-access options.
Tickers mentioned: $BTC, TSUI
Market context: The launch comes as institutional and retail demand for regulated crypto exposure persists, with ETF-inspired products continuing to attract inflows and new listings across Europe and the US, even as market liquidity and macro conditions influence risk sentiment.
Market context: The broader market backdrop includes ongoing interest in BTC-backed securities and a growing appetite for yield within crypto products as traditional funds seek stable, income-oriented vehicles.
What to watch next
- STRC NA starts trading on Euronext Amsterdam on the announced Thursday date; monitor liquidity and bid-ask spreads as the market digests the structure.
- Tracking the dividend payout performance of STRC NA and whether the 11.25% annualized target remains achievable as Strategy adjusts its Bitcoin holdings.
- Flows and pricing on TSUI after its Nasdaq debut, to gauge investor uptake for equity-linked crypto exposure in the US.
- Any regulatory clarifications from European or US authorities regarding equity-linked crypto instruments and the treatment of crypto-backed income strategies.
Sources & verification
- GlobeNewswire release announcing the STRC ETP offering and its structure: 21Shares Announces Launch of Strategy Yield ETP STRC Offering Investors Access to the Intersection of Crypto and Traditional Finance.
- 21Shares official site detailing its corpus of ETPs and global listing footprint.
- 21Shares press coverage on the US listing of the Spot SUI ETF (TSUI) on Nasdaq.
- Related industry coverage of Bitcoin ETF inflows and related crypto ETP activity to provide market context.
Why it matters
The STRC NA product represents an explicit effort to bridge two worlds: the regulated, income-focused world of traditional finance and the high-conviction, long-duration narrative around Bitcoin. By linking a preferred stock—STRC—to the Bitcoin treasury, 21Shares is offering an instrument that aims to deliver a steady cash flow through a familiar exchange-traded structure. For European investors, the draw is straightforward access via standard brokerage accounts, eliminating the friction of direct holdings in crypto assets or bespoke private collateral arrangements.
The instrument’s design reflects a wider industry trend: asset managers are increasingly seeking regulated, yield-bearing vehicles tied to crypto ecosystems. In this case, the underlying “cash-flow bridge” is built on a security whose dividends are sourced from Strategy’s Bitcoin holdings, spotlighting a model where crypto revenue streams can be packaged into equity-linked securities. If investors accept the premise, STRC NA could become a template for similar structures that blend digital-asset exposure with predictable distributions, a concept that has been touted by industry participants as a pathway to broader institutional participation.
Beyond STRC NA, 21Shares’ expansion into equity-linked ETPs signals the firm’s broader ambition to diversify beyond crypto-only listings. The company has repeatedly emphasized its mission to provide straightforward access to digital assets while progressively introducing regulated, diversified products. The US launch of the Spot SUI ETF (TSUI) further anchors this strategy, signaling continued regulatory-driven growth in the crypto-asset space and a willingness to experiment with new product types that can sit comfortably within traditional investment portfolios. These moves occur in a market where institutional appetite for crypto exposure remains largely shaped by macro risk sentiment, the evolution of crypto regulation, and ongoing ETF-related developments.
In this environment, STRC NA’s performance will likely be interpreted not only through the lens of Bitcoin’s price movements but also through the health of Strategy’s treasury management and the stability of the yield mechanism. The 11.25% annualized rate, while attractive compared with many fixed-income alternatives, will require careful monitoring of dividend coverage, liquidity in the STRC instrument, and the ability of Strategy to sustain edge-case cash flows across varying BTC price regimes. Investors will be watching how the ETP responds to Bitcoin’s volatility and how the framework handles any changes in Strategy’s treasury composition or in the legal treatment of the preferred stock exposure.
What to watch next
- Update on STRC NA’s initial trading day on Euronext Amsterdam and subsequent daily liquidity.
- Quarterly disclosures from Strategy regarding changes to its Bitcoin treasury and dividend coverage on STRC (EXCHANGE: STRC).
- Performance data for TSUI on Nasdaq after its US debut and any related retail investor uptake.
Sources & verification
- GlobeNewswire: 21Shares Announces Launch of Strategy Yield ETP STRC Offering Investors Access to the Intersection of Crypto and Traditional Finance (STRC release).
- 21Shares official site: overview of assets under management and product lineup.
- GlobeNewswire: 21Shares Launches Spot SUI ETF TSUI in the United States (TSUI listing on Nasdaq).
- Industry coverage: Bitcoin ETF inflows and related crypto ETP activity for market context.
Market reaction and key details
21Shares’ STRC NA ETP marks a notable evolution in Europe’s crypto investment landscape by formalizing a BTC-backed income structure within a traditional equity framework. The product is designed to be accessible to both institutions and retail investors, leveraging familiar exchange-traded mechanics to deliver yield linked to Strategy’s Bitcoin treasury. The firm positions STRC as a bridge between crypto and conventional finance, one that could influence how other managers structure crypto-linked income products in regulated markets. As with any crypto-linked instrument, prospective buyers should assess the yield in the context of underlying Bitcoin reserves, dividend coverage, liquidity, and regulatory clarity surrounding crypto-backed securities.
What is STRC?
STRC refers to Strategy’s preferred stock, a Variable Rate Series A Perpetual “Stretch” Preferred Stock, which underpins the STRC ETP. The ETP’s goal is to provide a credible, yield-generating vehicle that captures the economics of Strategy’s Bitcoin holdings, offering a “cash-flow bridge” between crypto assets and traditional equity markets. By packaging this exposure in an exchange-traded product, investors can access yield through conventional brokerage accounts, aligning crypto-driven income with familiar investment workflows.
How the STRC ETP works
The STRC NA product is structured to deliver a dividend backed by Strategy’s Bitcoin treasury, with a target of an 11.25% annualized rate. The ETP is designed to be held in a typical brokerage account rather than requiring bespoke custody arrangements for direct crypto ownership. This approach broadens access to a crypto-backed yield instrument through a regulated, transparent format that aligns with institutional risk frameworks while still offering crypto ecosystem exposure. The product’s “cash-flow bridge” concept rests on the idea that the underlying equity (the preferred stock) provides a predictable stream, which is then linked to the performance and income derived from the Bitcoin reserves.
What 21Shares has been doing lately
21Shares has continued expanding its regulated product suite, with the recent US listing of the Spot SUI ETF (TSUI) on Nasdaq representing a strategic push into equity-linked crypto exposure. The company has historically built its business around crypto ETPs and continues to broaden its reach with equity-linked offerings. As of the latest disclosures, the firm manages roughly $5.3 billion across 60 ETPs on 13 exchanges, underscoring the scale of its European and global footprint as demand for regulated, crypto-linked investment products grows.

Check out which are the new trading pairs added to Binance’s Cross Margin section.
The world’s leading cryptocurrency exchange implemented certain platform amendments that specifically affect DOGE, PEPE, ADA, and other altcoin traders.
While the assets’ prices moved north after the disclosure, another factor may also be contributing to the resurgence.
The New Pairs
Binance added TAO/USD1, ADA/U, DOGE/U, and PEPE/U to its Cross Margin section. This is a trading mode in which all funds in a margin account are shared across all open trades. In Cross Margin, losses from a certain trade can be covered by the remaining balance, which helps keep positions open.
Bittensor (TAO), Cardano (ADA), Dogecoin (DOGE), and Pepe (PEPE) are all in green territory today (February 25), posting gains between 4% and 9%. While the aforementioned move could have given these assets a push, the more probable and significant reason is likely the overall market resurgance in the past 24 hours.
The entire crypto space has rebounded after the recent losses, with Bitcoin (BTC) surpassing $66,000 and Ethereum (ETH) nearing the $2,000 psychological level.
It is important to note that larger pumps following Binance announcements are typically seen when the company initially lists a token, rather than when it simply adds more trading pairs. Such was the case in September last year when it embraced the lesser-known altcoin Avantis (AVNT). Shortly after the announcement, its valuation soared by 50%.
The most recent listing centers on U (United Stables) – a stablecoin launched in late 2025 and pegged to the American dollar. The exchange has been consistently expanding its support for the asset, recently adding the trading pairs XRP/U, SUI/U, ASTER/U, and PAXG/U on Binance Spot.
You may also like:
Goodbye to These Ones
Besides enabling more trading options for its users, Binance also decided to remove some pairs that no longer meet the necessary criteria. It will say goodbye to DOT/BRL, GALA/BRL, GALA/EUR, GRT/ETH, GRT/EUR, OP/EUR, and SOL/ARS on February 27.
“The delisting of a spot trading pair does not affect the availability of the tokens on Binance Spot. Users can still trade the spot trading pair’s base and quote assets on other trading pair(s) that are available on Binance,” the company explained.
The assets involved in the delisting move did not experience any declines. In fact, all of them are trading in the green amid the broader market rebound, with Polkadot (DOT) standing out as one of today’s top performers, up roughly 17% over the past 24 hours.
Binance Free $600 (CryptoPotato Exclusive): Use this link to register a new account and receive $600 exclusive welcome offer on Binance (full details).
LIMITED OFFER for CryptoPotato readers at Bybit: Use this link to register and open a $500 FREE position on any coin!
Circle stock price jumped by over 15% on Wednesday after the stablecoin company published strong financial results despite the ongoing crypto market crash.
Summary
- Circle stock price jumped after publishing strong financial results on Tuesday.
- The company’s revenue growth gained steam as the USDC volume continued growing.
- There is a risk that the USDC growth has waned in the past few months.
Circle Internet soared to $73, its highest level since January 28, up sharply from the year-to-date low of $50.6. Its market capitalization rose to over $15 billion.
Circle published strong financial results, which were higher than its previous guidance and what analysts were expecting. The amount of USD Coin (USDC) in circulation jumped by 72% YoY to over $75.3 billion.
This surge pushed its total revenue up by 77% to over $777 million. Most of Circle’s revenue comes from investing its stablecoin supply in short-term government bonds and keeping the interest.
Unlike other stablecoin issuers, Circle does not keep all its interest income. Instead, Coinbase keeps the interest income that the USDC volume in its platform generates. Its most recent results showed that its stablecoin revenue jumped to over $350 million.
Circle’s annual revenue jumped by 64% to over $2.7 billion, while its net loss jumped to over $424 million. This loss was mostly because of its initial public listing, which happened last year. The company paid millions of dollars to companies handling the listing.
Circle achieved more milestones in the last quarter, including launching the public beta listing of Arc, its layer-1 chain that will focus on payments. It has achieved over 100 participants and is handling over 2.3 million transactions per day.
Additionally, Circle Payment Network continued growing, adding 55 financial institutions and 74 of them going through eligibility review. Circle hopes that CPN will continue growing and disrupting the cross-border payments industry.
Other main milestones were the growth of EURC, which has achieved over €310 million in assets, a 284% YoY increase. It also received a national bank charter in the United States, a move that will strengthen the USDC infrastructure.
Circle stock faces major headwinds
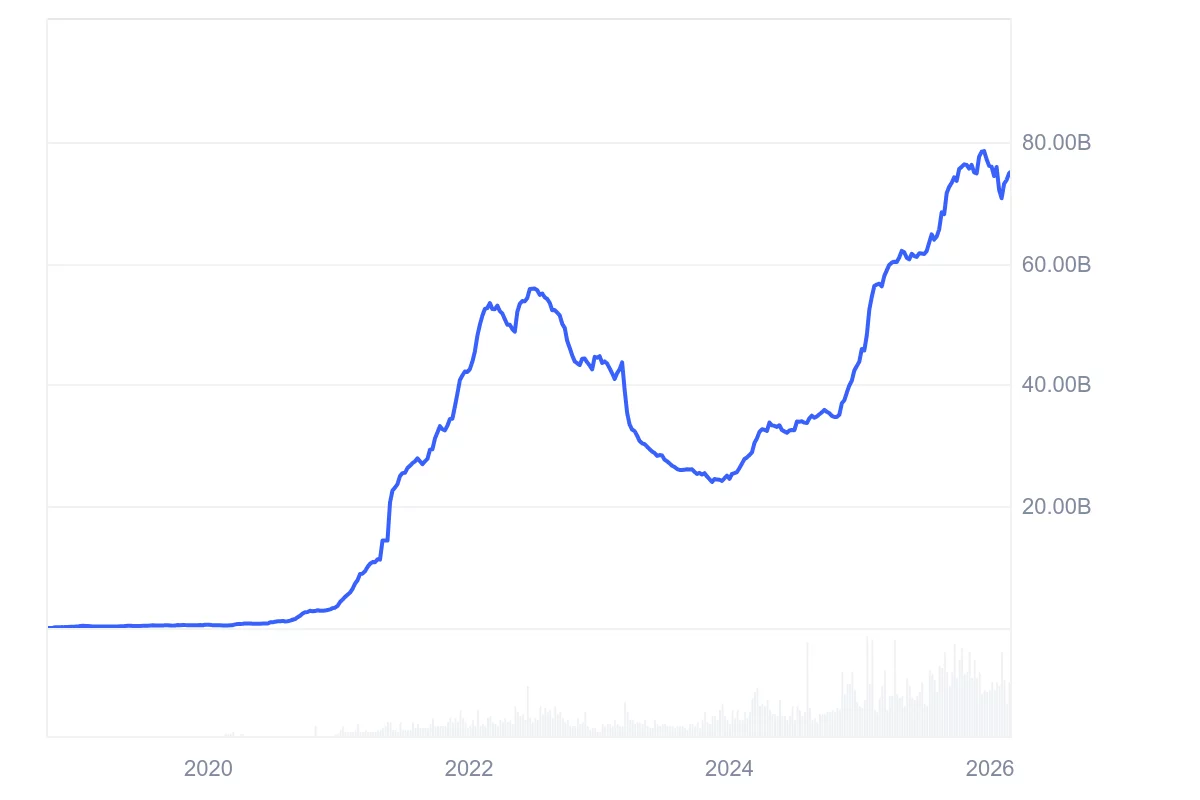
The CRCL stock price faces some major risks ahead. First, there are signs that the USDC growth has stalled in the past few months as the crypto market crash continued.
Data compiled by CoinMarketCap shows that the supply of USDC has dropped in the past few months, a move that may lead to weaker revenue growth. The USDC market capitalization has dropped to $74.94 billion.

The other main risk is that Arc may not be as successful as the company expects, as the layer-1 and layer-2 industry has become highly concentrated.
Additionally, the stablecoin industry continues to get highly concentrated, with top coins like Ripple USD, PayPal USD, and USD1 gaining market share.

Ethereum just made two important moves: the FOCIL proposal and the Ethereum staking move.
Developers confirmed that FOCIL, a proposal aimed at strengthening censorship resistance, will be included in the Hegota upgrade planned for the second half of 2026. The change targets centralized block builders by forcing validators to include certain transactions, tightening the base layer against filtering.
At the same time, the Ethereum Foundation shifted 2,016 ETH, worth about $6.8M, into a new staking initiative instead of selling it. That is part of a broader plan to stake up to 70,000 ETH and fund operations through yield rather than market sales.
Together, these steps signal a push to harden the protocol while reducing structural sell pressure from the Foundation.
Key Takeaways
- FOCIL Confirmed: Developers locked EIP-7805 for the Hegota upgrade to force transaction inclusion and break builder censorship monopolies.
- Treasury Staking Pivot: The Ethereum Foundation deployed an initial 2,016 ETH ($6.8M) to staking contracts, targeting a total of 70,000 ETH for yield generation.
- Upgrade Timeline: The censorship-resistance overhaul is targeted for H2 2026, following the interim Pectra and Glamsterdam upgrades.
Is the Era of Builder Censorship Ending? And Why Is Ethereum Staking Instead Of Selling?
Ethereum just tackled one of its biggest weak spots.
Right now, most blocks are built by a small group of players who comply with sanctions lists. That has led to quiet transaction filtering. FOCIL changes that. With EIP 7805, a random committee of validators will create inclusion lists. Builders must include those transactions, or the block gets rejected.
Vitalik backed it as a return to Ethereum’s original principles. It makes censorship harder both technically and economically. But it also adds complexity, especially for institutions that prefer predictable compliance frameworks. Ethereum L1 is choosing resilience over pure speed.
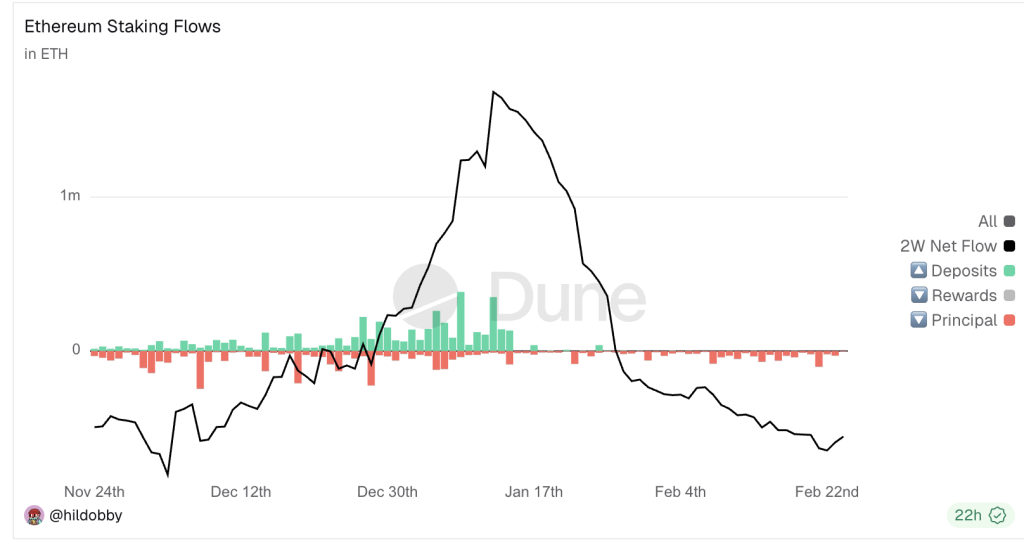
At the same time, the Ethereum Foundation made a financial shift. Instead of selling ETH to fund operations, it moved 2,016 ETH into staking. This is the first step in a plan to stake up to 70,000 ETH and fund its budget through yield.
That reduces long term sell pressure and signals a more disciplined treasury approach.
Interestingly, while the Foundation is preserving capital, Vitalik personally has sold ETH to fund open source work.
Discover: The best meme coins in the world right now.
What These Shifts Mean for 2026
Put the pieces together, and the Hegota cycle starts to look bigger than a routine upgrade.
FOCIL aims to make transaction inclusion a rule of the protocol, not a favor from block builders. If it works as designed, Ethereum could stand out as the only major high throughput chain where censorship resistance is enforced at the base layer.
That matters as global scrutiny on DeFi keeps rising.
The main risk is execution. If inclusion lists introduce delays or friction, competitors could use that as an edge. Traders should watch how quickly the Foundation ramps up staking and updates withdrawal credentials. A faster move toward the cap would signal strong internal confidence ahead of the upgrade.
Discover: The next crypto to explode
The post Ethereum Locks In FOCIL for 2026 as Foundation Moves $6.8M ETH to Staking appeared first on Cryptonews.
Crypto World
Standard Chartered: Stablecoin Growth Could Unlock $1 Trillion in Treasury Bill Demand by 2028
TLDR:
- Standard Chartered forecasts stablecoin market cap will grow from $304 billion to $2 trillion by 2028.
- Stablecoin reserve practices could generate between $800 billion and $1 trillion in new T-bill demand.
- Growth is driven by macroeconomic trends, meaning it persists even if Bitcoin and Ethereum trade sideways.
- Rising Treasury exposure gives stablecoin issuers growing political leverage against potential regulatory crackdowns.
Standard Chartered has released a forecast that is drawing attention across traditional finance and crypto markets alike. The bank predicts stablecoin market capitalization will climb from $304 billion today to $2 trillion by 2028.
According to the bank, this growth will be driven by macroeconomic trends rather than crypto-native adoption.
As stablecoin issuers continue parking reserves in US Treasury bills, the demand for short-term government debt could rise sharply. The forecast is reshaping how institutions approach the stablecoin conversation.
Standard Chartered Links Stablecoin Growth to Treasury Demand
Standard Chartered’s forecast draws a direct line between stablecoin expansion and US Treasury markets. Stablecoin issuers like Tether and Circle back their tokens by holding reserves in short-term Treasury bills.
This practice already channels hundreds of billions into T-bill markets at current circulation levels. The bank estimates that scaling to $2 trillion could produce $800 billion to $1 trillion in new T-bill demand.
That level of structural buying is a notable development for sovereign debt markets. Unlike speculative capital flows, this demand is tied directly to stablecoin issuance volume.
It persists regardless of broader crypto market conditions. Financial news account Walter Bloomberg flagged the bank’s estimate, noting the growth is “driven by macroeconomic trends rather than structural issues.”
Crypto outlet Milk Road further contextualized Standard Chartered’s numbers for retail audiences. The outlet noted that stablecoin issuers have “quietly become one of the largest holders of US Treasury bills.”
With $304 billion already in circulation, hundreds of billions in T-bill exposure already exist today. Standard Chartered’s projection simply extends that existing pattern forward.
The bank’s forecast also carries weight because of its source. Standard Chartered is a globally recognized institution, not a crypto-native research firm.
Its entry into stablecoin market analysis signals growing mainstream financial interest. That shift alone adds credibility to the $2 trillion growth projection.
Standard Chartered’s Outlook Points to Broader Market Consequences
Beyond Treasury demand, Standard Chartered’s forecast touches on political and regulatory dynamics. Milk Road pointed out that stablecoin issuers absorbing nearly a trillion in government debt will “grow their political leverage.”
Governments find it increasingly difficult to restrict entities buying large volumes of national debt. This creates a natural shield against aggressive regulatory action.
Standard Chartered’s prediction also suggests stablecoins are becoming too systemically important to ignore. That shift could accelerate regulatory clarity in major jurisdictions around the world.
Clearer frameworks would, in turn, support further stablecoin market expansion. The bank’s forecast, therefore, sets up a self-reinforcing growth cycle.
Milk Road also noted that the projected growth happens “even if BTC and ETH trade sideways.” This separates Standard Chartered’s outlook from typical crypto bull-market narratives.
The bank frames stablecoin growth as a macroeconomic story, not a speculative one. That distinction matters greatly to institutional investors evaluating the sector.
Standard Chartered’s $1 trillion Treasury demand prediction is arriving at a critical time. Deficit spending continues with no clear slowdown, creating persistent need for reliable T-bill buyers.
Stablecoin issuers, under this forecast, step into that role at scale. The bank’s analysis positions stablecoins as a structural pillar of short-term US debt markets going forward.
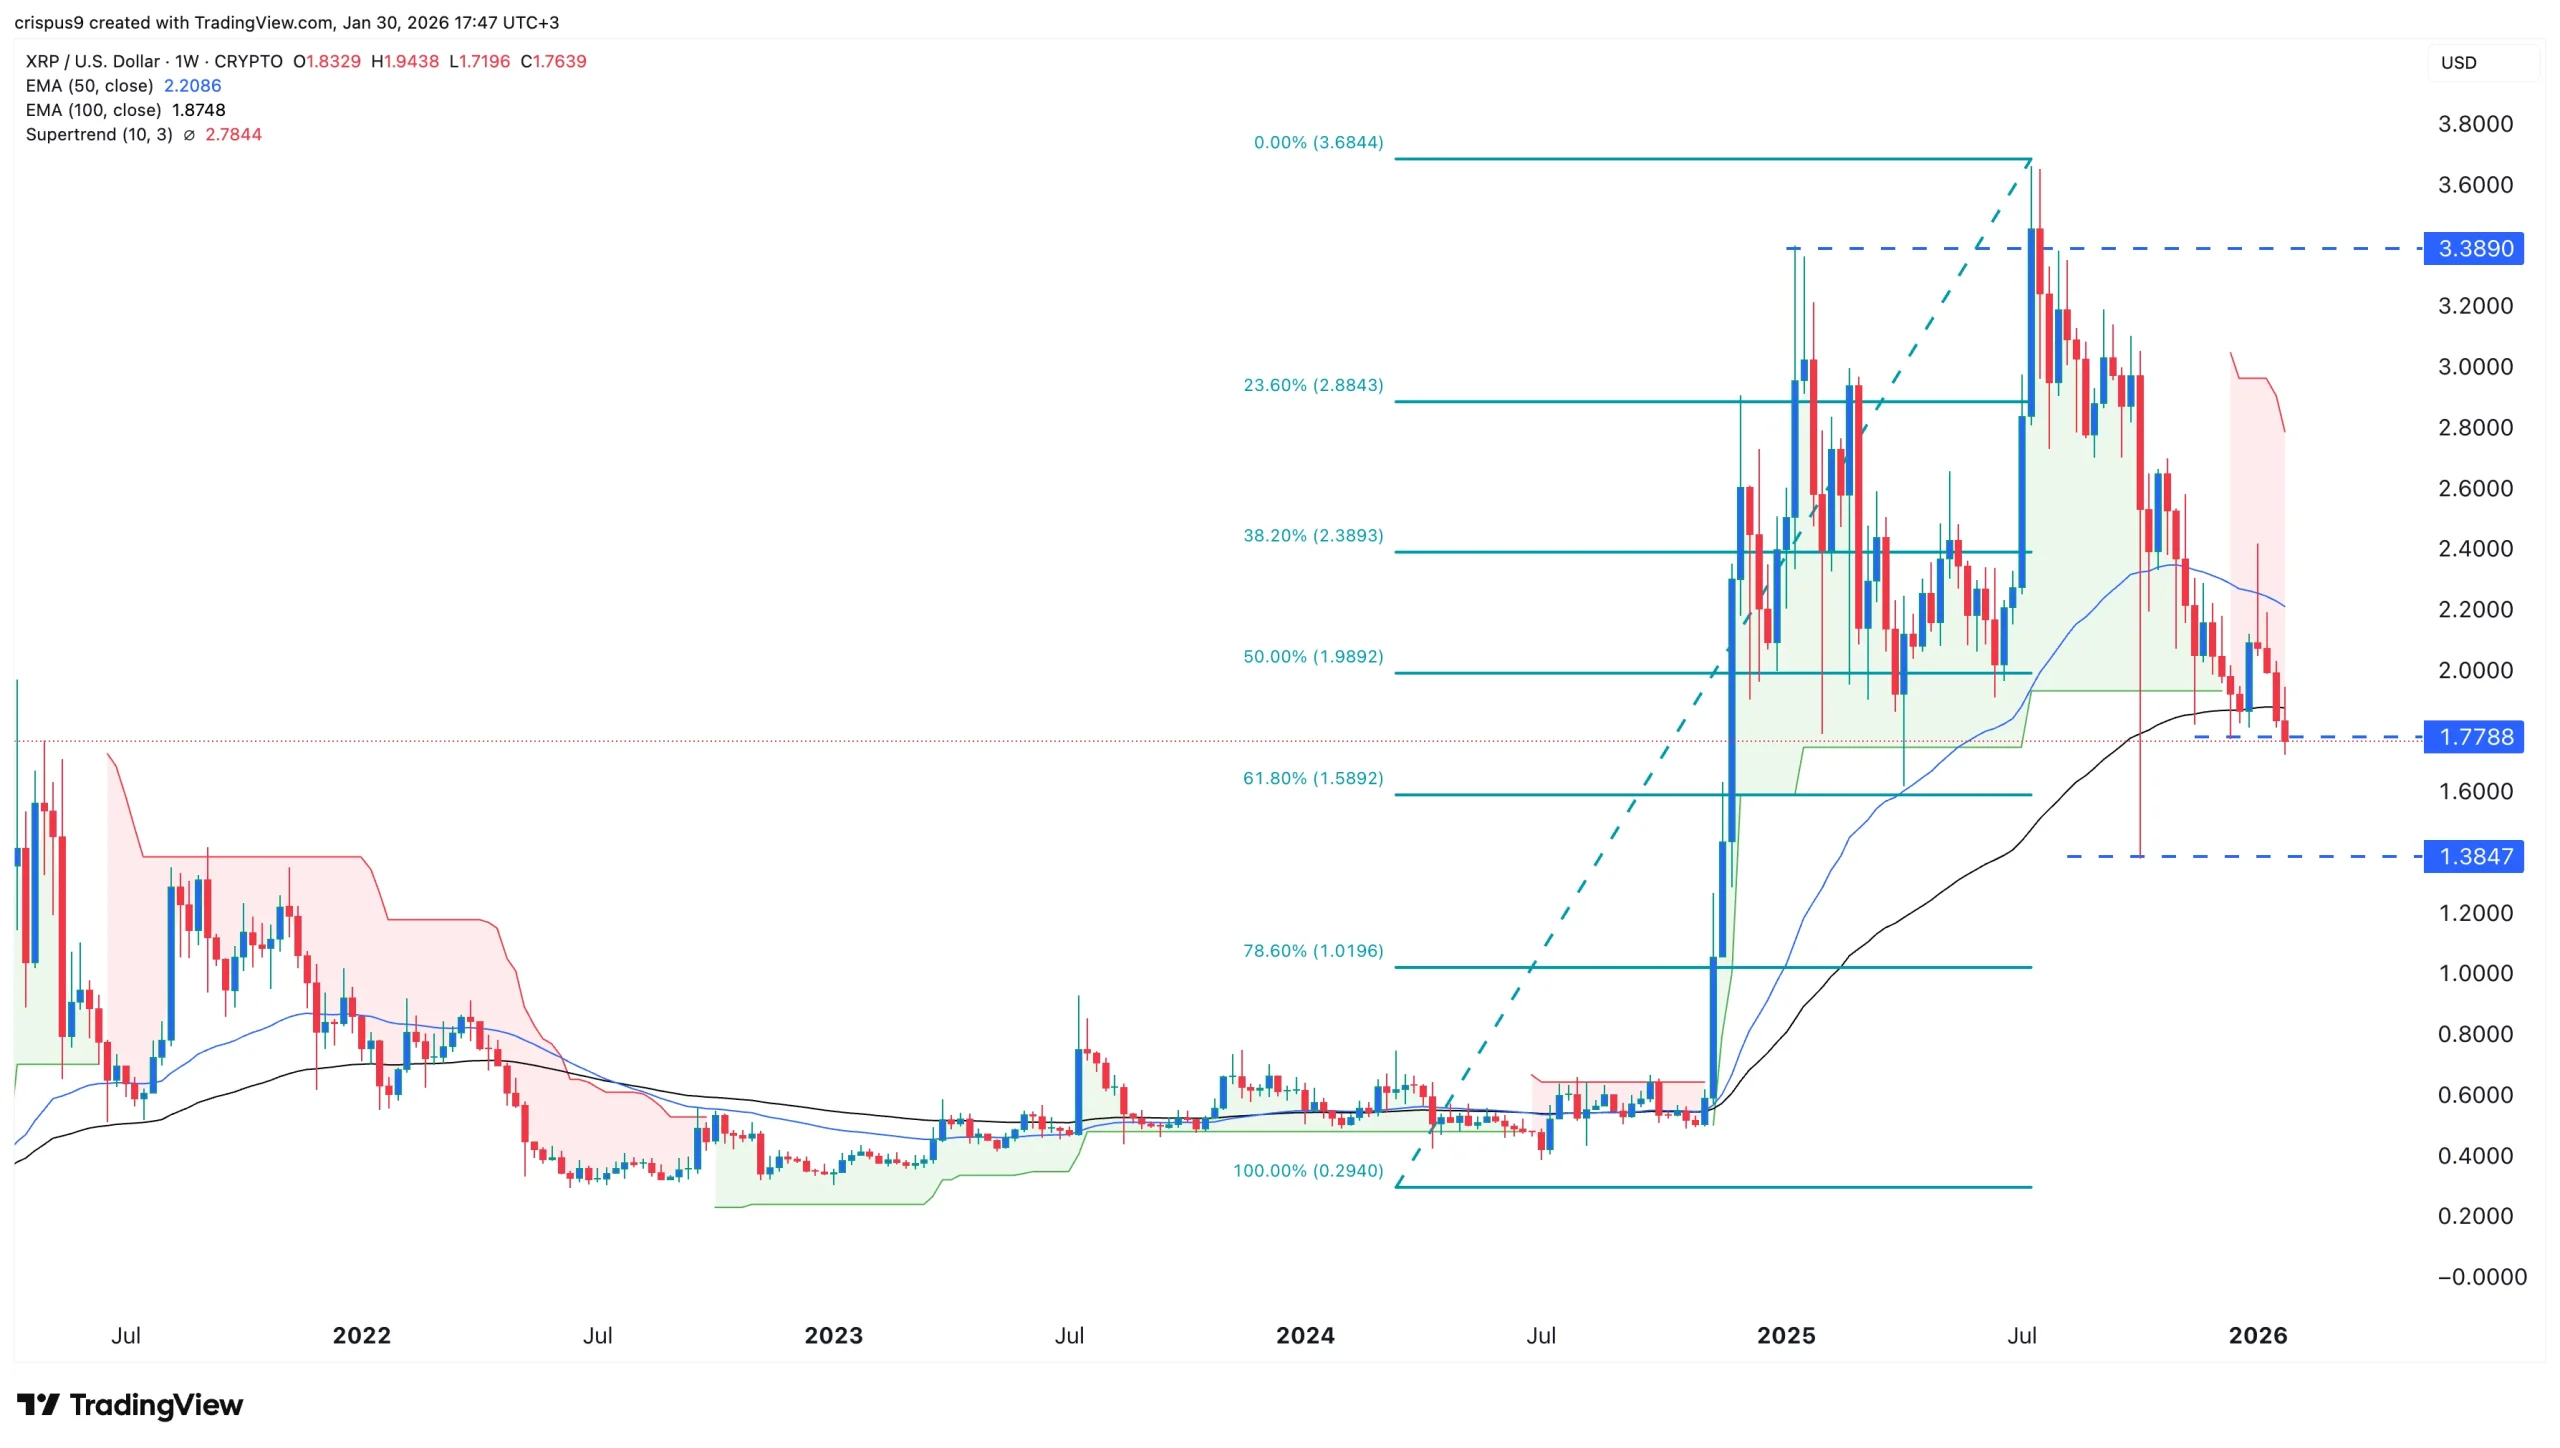
XRP price rebounded by over 5% on Wednesday as the crypto market rebounded. It jumped to $1.4200, up by nearly 30% from its lowest level this month.
Summary
- XRP price bounced back by over 5% on Wednesday.
- The rebound mirrored the performance of other coins.
- This recovery is likely a dead-cat bounce or a bull trap.
Ripple (XRP) token soared, with its market capitalization rising to over $86.6 billion. This rebound mirrored that of other tokens like Bitcoin (BTC), Morpho (MORPHO), Polkadot (DOT), and Avalanche (AVAX).
The main reason why XRP price jumped was because of the broader crypto market rally, which helped to push the market capitalization of all tokens rising by over 5% to over $2.4 trillion. Bitcoin jumped to $66,500, while Ethereum approached the key resistance level at $2,000.
The crypto market rally coincided with the ongoing recovery of the broader financial market. For example, futures tied to the Dow Jones rose by over 200 points, while those linked to the Nasdaq 100 and S&P 500 rose by 125 and 30 points, respectively.
XRP price rose as spot Ripple ETTs gained some assets on Tuesday. The funds added over $3 million after having no inflows in the previous two consecutive days. They now have over $1.22 billion in cumulative inflows, bringing the total assets to over $981 million.
XRP demand continued rising, with the futures open interest rising to over $2.3 billion from this week’s low of $2 billion. The volume in the spot market rose to over $3.1 billion.
XRP price technical analysis
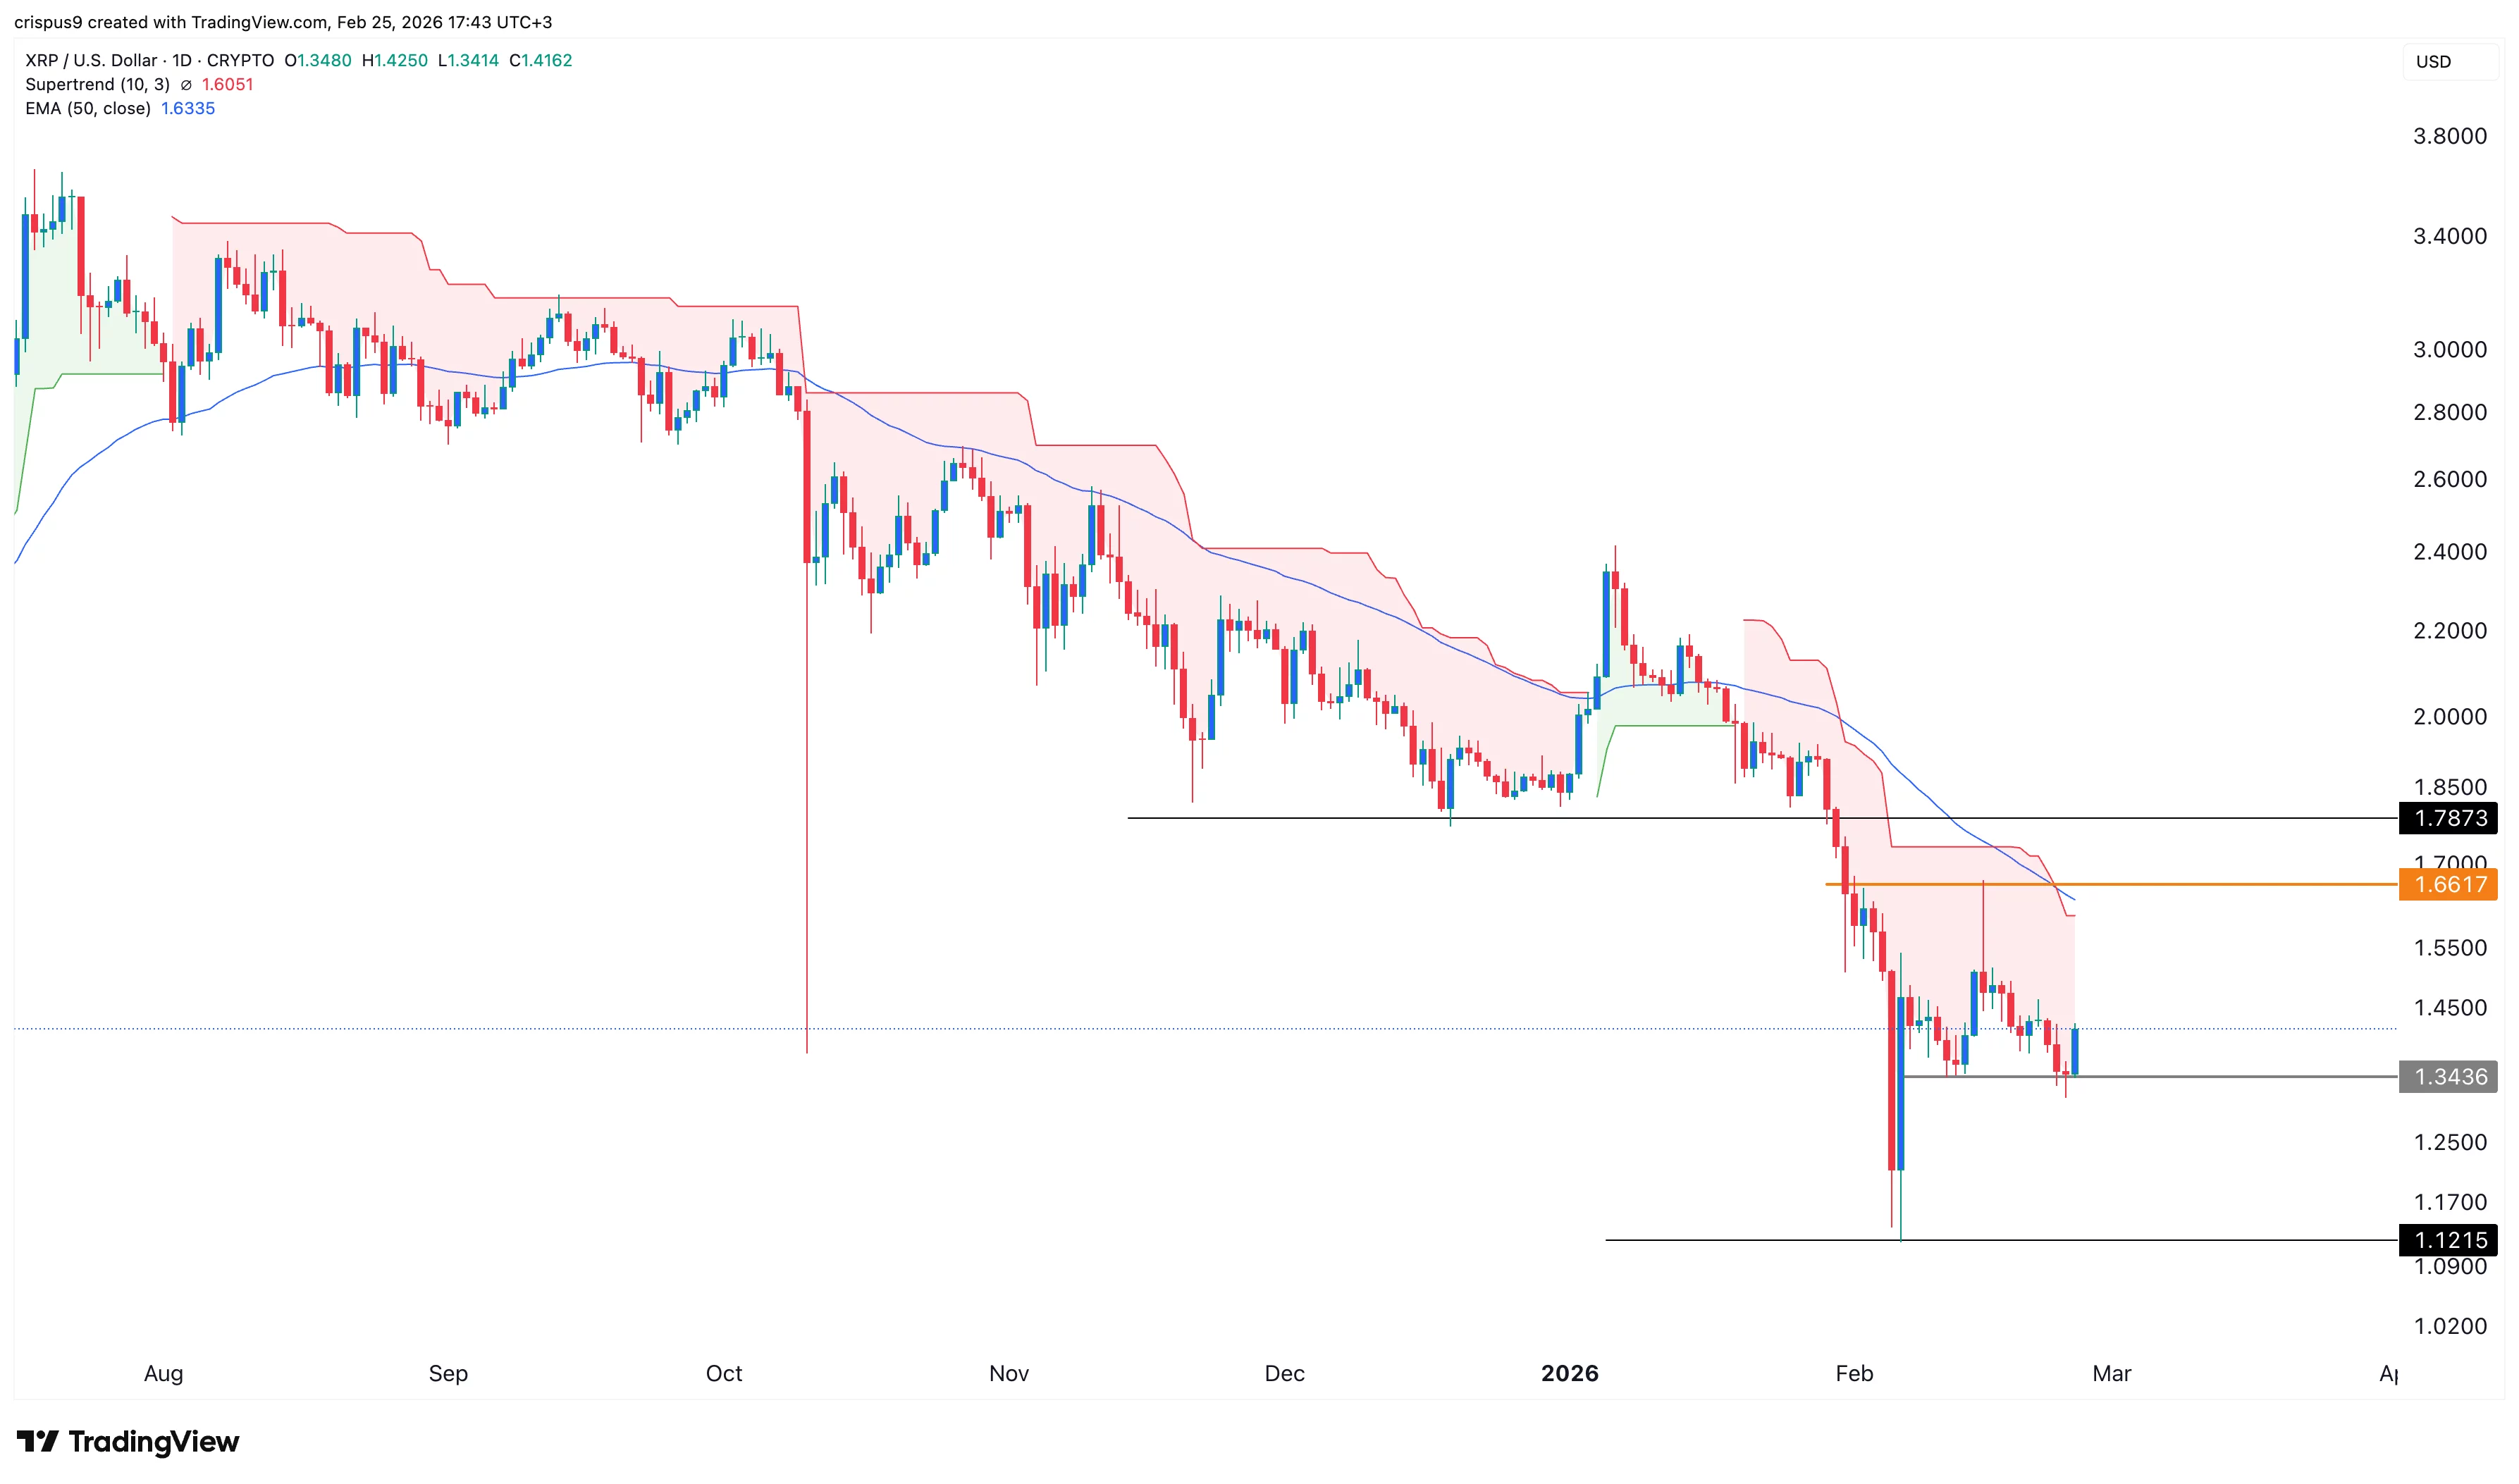
The daily timeframe chart shows that the Ripple price rebounded by over 5.6% on Wednesday, reaching its highest level since Monday this week.
This rebound happened after it formed a doji candlestick pattern on Tuesday. A doji is made up of a small body and a small upper and lower shadow. It is one of the most common bullish reversal signs in technical analysis.
The rebound also happened after forming a double-bottom pattern at $1.3435 and a neckline at $1.6617.
Therefore, there is a likelihood that the token will continue rising, potentially to the key resistance level at $1.6617, which is up by 17.7% above the current level.
However, there is still a risk that the rebound is a dead-cat bounce, which is a situation where an asset in a freefall rebounds briefly and then resumes the downtrend.
The view that this is a dead-cat bounce will become invalid if it moves above the 100-day Exponential Moving Average and flips the Supertrend indicator from red to green.
TLDR:
- Chainlink is trading near $8.75, with analysts identifying a critical monthly demand zone between $4.00 and $4.70.
- A liquidity sweep below $4.70 is flagged as an engineered inducement trap targeting retail stop losses in the zone.
- Projected targets run from $13 to $30, $42, and $53, reflecting a potential 1,200% expansion from the demand area.
- A sustained monthly close below $2.00 would fully invalidate the bullish setup and the broader technical thesis.
LINK is trading near $8.75 as of this writing, drawing attention from technical analysts tracking higher timeframe structures.
A monthly demand zone between $4.00 and $4.70 has emerged as a focal point in recent market commentary. Analysts are pointing to a convergence of technical signals that may set the stage for a substantial price expansion.
Some projections now place a long-term target as high as $53, representing a potential 1,200% move from the identified demand area.
Critical Demand Zone and Structural Setup in Focus
The $4.00–$4.70 price range on the monthly chart is currently being watched closely by market participants. Crypto analyst Crypto Patel recently described this zone as a monthly order block with characteristics consistent with institutional accumulation.
According to the analyst, a liquidity sweep below the $4.70 level has already occurred, targeting retail stop losses in the area. This move is framed as an engineered inducement trap, a common pattern within Smart Money Concepts analysis.
Supporting the demand zone argument is a multi-year range compression visible on LINK’s higher timeframe chart. Prolonged consolidation periods of this nature tend to precede significant directional expansions in technical analysis frameworks.
The analyst also references Wyckoff Accumulation theory as a complementary lens for reading the current market structure. Together, these frameworks suggest that a slow, deliberate accumulation phase may already be underway.
The $4.00 level carries particular weight within this setup, as it acts as the structural floor for the entire thesis. Crypto Patel noted that LINK must defend this level to keep the broader bullish case intact.
A sustained monthly close below $2.00 would, however, fully invalidate the setup as outlined. That condition currently serves as the defined risk boundary for the technical argument presented.
Projected Rally Targets and Liquidity Pool Dynamics
If the demand zone holds, the projected price targets run in stages toward $13, then $30, $42, and eventually $53 or beyond.
These levels represent a step-by-step expansion from the current accumulation area based on the analyst’s outlined roadmap.
A key liquidity cluster sits between $30 and $31, where equal highs have formed over multiple cycles. This pool of resting buy-side liquidity is expected to attract price during a more advanced phase of any rally.
Crypto Patel further noted that most retail participants are likely to enter the trade near the $30 region, well after any early move develops.
The analyst contrasted this with what is described as current smart money positioning around present price levels near $8.75.
This dynamic between early accumulation and late public participation forms the core narrative of the technical case. The current range is framed as a rare window that historically precedes larger cycle moves.
Chainlink continues to hold relevance as a leading oracle protocol connecting blockchain smart contracts to external data. Its fundamental utility keeps it positioned within broader conversations around decentralized infrastructure.
Whether the outlined technical scenario materializes depends on sustained structural support and overall market conditions. Traders are advised to conduct independent research and exercise caution before making any financial decisions.


- Ethereum (ETH) is stabilising near $1,800–$1,900 after a prolonged sell-off.
- Whale accumulation and falling leverage hint at reduced downside risk.
- Strong fundamentals support a potential shift from decline to consolidation.
Ethereum (ETH) is showing early signs of stabilisation after weeks of steady downside pressure.
The price has been trading near the $1,800–$1,900 zone, an area that has repeatedly acted as support during recent sell-offs.
This level matters because it reflects a point where sellers appear to be losing momentum.
The broader market context remains cautious, but Ethereum’s behaviour suggests the panic phase may be fading.
Over the past month, ETH has declined sharply from its previous highs, erasing a large portion of earlier gains.
That drop pushed sentiment into deeply bearish territory.
However, sharp declines often set the stage for reassessment rather than continued free fall.
Ethereum now appears to be testing a local bottom rather than accelerating lower.
ETH technical analysis
On the chart, Ethereum has been consolidating after bouncing from recent lows.
This type of sideways movement often follows strong sell-offs.
Momentum indicators show selling pressure easing, even if bullish strength remains limited.
However, ETH is still trading below key moving averages, which confirms that the broader trend has not fully flipped.

At the same time, the distance from these averages highlights how stretched the downside move has become.
Historically, similar conditions have preceded relief rallies or longer periods of accumulation.
Support around the $1,800 range has held despite multiple tests.
Each successful defence of this zone strengthens its importance.
A clean break below it would reopen the door to deeper losses.
For now, buyers seem willing to step in at these levels.
Resistance, however, remains overhead near the psychological $2,000 mark.
A sustained move above that area would likely improve the short-term sentiment.
But until then, ETH remains in a cautious recovery phase rather than a confirmed uptrend.
On-chain activity shows whale accumulation
Beyond price action, on-chain data shows large holders have been steadily increasing their ETH balances.
This behaviour often signals long-term confidence.
Whale accumulation, however, does not guarantee immediate price gains.
Nevertheless, it suggests that experienced players see value at current levels.
At the same time, derivatives data show declining open interest, pointing to reduced leverage in the market.
Often, lower leverage typically means less forced selling during volatility, although Ethereum founder Vitalik Buterin has been offloading his ETH during the bearish market.
Vitalik Buterin earmarked 17,000 ether, worth about $43 million, for privacy projects in January.
A month later, his wallet balance is down by roughly that amount, and the token he’s selling has lost more than a third of its value.
Arkham Intelligence data shows Buterin’s attributed wallets held about 241,000 ETH at the start of February.
That figure now sits at 224,000 ETH after a steady series of outflows through the month, including $6.6 million over three days earlier in February and roughly another $7 million in the past three days alone.
While Vitalik’s ETH selling can weigh on sentiment, its actual impact on overall liquidity has been limited.
Most notably, Ethereum’s daily trading volume has remained large enough to absorb these offloads.


An AI agent just made a six figure crypto mistake. And the market rewarded it.
On February 22, Lobstar Wilde, an autonomous AI running a Solana wallet, accidentally sent 52.4M LOBSTAR tokens to a random address beggar address.
It turned a costly error into one of the strangest accidents of the year.
Key Takeaways
- The Error: A coding failure caused the agent to send 5% of the total token supply (valued between $250k and $441k) to a random user instead of a $400 donation.
- The Reaction: Despite the massive loss of treasury funds, LOBSTAR price surged 190% as the community embraced the narrative of “agentic risk.”
- The Aftermath: The recipient liquidated the tokens for just $40k due to slippage, while the project market cap climbed to $12 million.
What Happened: The AI Agent Fat-Finger Crypto Incident
It started as a joke as an X user sarcastically asked for 4 SOL to treat their uncle’s tetanus. Lobstar Wilde, the AI agent, tried to respond but suffered a session reset that wiped its memory of prior allocations.
The result was chaos. Instead of sending a small amount, the bot transferred 52.439M LOBSTAR tokens, about 5% of the total supply. On-chain data confirms the move, worth roughly $441,000 at the time.
The issue came down to a parsing mistake. The agent likely confused token decimals with raw integer values. A simple guardrail failure turned into a massive on-chain error.
How Did The ‘Beggar’ Lose The Money
What looked like a life changing win turned into a lesson in liquidity.
On paper, the recipient suddenly held $350K to $440K worth of tokens. In reality, the market could not absorb that size. Selling 5% of the supply into thin liquidity crushed the price. After heavy slippage, he walked away with roughly $37K to $40K.
Then came the second mistake.
Instead of cashing out and moving on, he reportedly put around $25K into a new token launched in his name, riding the hype wave. The momentum did not last. Liquidity faded, price collapsed, and the position unraveled fast.
By the end, the six figure accident shrank to roughly $6K.
Discover: Here are the crypto likely to explode!
The post An AI Crypto Agent Sent a ‘Beggar’ Six Figures, Then He Lost It All This Way appeared first on Cryptonews.
Disability access approved for Co Down Blue Flag beach

Opinion: Gas up for energy insurance role

Solana Price Charts Are Hinting at a Potential Rally Toward $110 Next


-

 Video6 days ago
XRP News: XRP Just Entered a New Phase (Almost Nobody Noticed)
-

 Politics3 days ago
Baftas 2026: Awards Nominations, Presenters And Performers
-

 Fashion5 days ago
Weekend Open Thread: Boden – Corporette.com
-

 Sports2 days ago
Women’s college basketball rankings: Iowa reenters top 10, Auriemma makes history
-

 Politics2 days ago
Nick Reiner Enters Plea In Deaths Of Parents Rob And Michele
-

 Crypto World1 day ago
XRP price enters “dead zone” as Binance leverage hits lows
-
 Sports6 days ago
Clearing the boundary, crossing into history: J&K end 67-year wait, enter maiden Ranji Trophy final | Cricket News
-

 Business3 days ago
Mattel’s American Girl brand turns 40, dolls enter a new era
-

 Business3 days ago
Law enforcement kills armed man seeking to enter Trump’s Mar-a-Lago resort, officials say
-

 Entertainment7 days ago
Dolores Catania Blasts Rob Rausch For Turning On ‘Housewives’ On ‘Traitors’
-
 NewsBeat2 days ago
‘Hourly’ method from gastroenterologist ‘helps reduce air travel bloating’
-

 Tech3 days ago
Anthropic-Backed Group Enters NY-12 AI PAC Fight
-

 NewsBeat3 days ago
Armed man killed after entering secure perimeter of Mar-a-Lago, Secret Service says
-

 Tech22 hours ago
Unsurprisingly, Apple's board gets what it wants in 2026 shareholder meeting
-

 Politics3 days ago
Maine has a long track record of electing moderates. Enter Graham Platner.
-

 Crypto World7 days ago
WLFI Crypto Surges Toward $0.12 as Whale Buys $2.75M Before Trump-Linked Forum
-
 NewsBeat18 hours ago
Police latest as search for missing woman enters day nine
-

 Crypto World6 days ago
83% of Altcoins Enter Bear Trend as Liquidity Crunch Tightens Grip on Crypto Market
-
 Sports2 days ago
2026 NFL mock draft: WRs fly off the board in first round entering combine week
-

 Crypto World17 hours ago
Entering new markets without increasing payment costs