

Crypto World
Why Gartner Just Named AMD (AMD) the Enterprise AI Leader


Key Highlights
- Shares of AMD advanced 2.5% Thursday, reaching an intraday peak of $550.88 before closing at $532.57
- UBS increased its price objective to $670; Gartner identified AMD as “the company to beat” in the enterprise AI server CPU market
- First quarter revenue reached $10.25 billion, representing a 37.8% year-over-year increase and surpassing analyst projections
- The company’s forward P/E ratio stands at 71x compared to Nvidia’s 23x — presenting valuation considerations
- The forthcoming MI450 processor, manufactured using TSMC’s 2nm technology, aims to compete with Nvidia’s Vera Rubin architecture
Shares of Advanced Micro Devices climbed 2.5% during Thursday’s session, peaking at $550.88 before finishing at $532.57. This represented a gain from the previous day’s close of $519.74. Trading activity registered approximately 26.7 million shares, falling about 29% short of the typical daily volume of 37.7 million.
Advanced Micro Devices, Inc., AMD
The upward movement occurred on below-average volume, indicating the rally wasn’t driven by widespread market momentum. However, the catalyst behind the move was unmistakable: a series of favorable analyst assessments.
Reports indicate UBS elevated its price objective for AMD to $670. Additionally, technology research leader Gartner designated AMD as “the company to beat” in the enterprise AI server CPU sector — a designation that resonated throughout investment circles.
The broader analyst community maintains a favorable outlook on AMD. Among those monitored by MarketBeat, 28 analysts recommend Buy, 12 suggest Hold, two rate it Strong Buy, and just one recommends Sell.
The consensus price target currently rests at $440.41, although several recent revisions have elevated forecasts considerably. Mizuho increased its target to $615 while TD Cowen adjusted upward to $600, both maintaining constructive ratings.
The company’s first quarter performance, announced on May 5th, reinforced the positive sentiment. Revenue totaled $10.25 billion, exceeding the $9.90 billion projection and marking a 37.8% increase compared to the prior year period. Earnings per share reached $1.37, topping the consensus estimate of $1.29.
Valuation Questions Persist Among Investors
Notwithstanding solid operational performance, AMD’s valuation multiple has emerged as a recurring topic among market watchers. The stock currently carries a trailing P/E ratio near 171x and a forward P/E of 71x. Nvidia, in contrast, trades at a forward P/E of approximately 23x.
Several market observers have highlighted that AMD’s elevated valuation multiples provide limited margin for disappointment. Should growth projections fall short of expectations, even marginally, the stock could experience downward pressure. One analysis noted that even Micron’s robust quarterly results failed to provide uplift to AMD shares, suggesting a more discriminating market climate.
Chief Executive Lisa Su divested 125,000 shares on June 10th at an average execution price of $460.69, generating proceeds of approximately $57.6 million. The divestiture was conducted through a previously established 10b5-1 trading arrangement. Executive Vice President Mark Papermaster similarly sold 6,000 shares on June 15th at $536.33. Both transactions were pre-scheduled rather than opportunistic.
The MI450 Represents the Next Major Milestone
AMD’s upcoming significant product launch centers on the MI450 processor, which is being produced utilizing TSMC’s cutting-edge 2-nanometer manufacturing process. This represents a generational advantage over Nvidia’s 3nm Vera Rubin architecture.
The MI450 is projected to feature 432 GB of HBM4 memory capacity, substantially exceeding Vera Rubin’s 288 GB configuration. Industry analysts also anticipate AMD will deliver superior total cost of ownership economics, a consideration that carries weight in hyperscale data center procurement decisions.
AMD’s current market capitalization hovers around $868 billion, representing a small fraction of Nvidia’s $4.9 trillion valuation. This disparity forms a central component of the bullish investment thesis — significant expansion potential remains.
The company’s data center business segment now contributes 56% of total revenue. Nvidia’s comparable segment represents 92% of its revenue mix, highlighting both how much ground AMD must cover and the substantial growth opportunity that lies ahead.
Institutional investors hold 71.34% of outstanding shares. Wall Street projects full-year earnings per share of $6.15 for the current fiscal period.




Aztec Network, an Ethereum Layer 2 built for private smart contracts, said on Tuesday that its Alpha V5 release is live on mainnet, calling it "the fastest private transactions we've ever shipped." The company said Alpha V5 proves a fully private transaction in about 2.5 seconds on a laptop and… Read the full story at The Defiant
Crypto World
Jack Mallers Questioned MicroStrategy’s Bitcoin Strategy, Now He’s Stepping Down From Twenty One
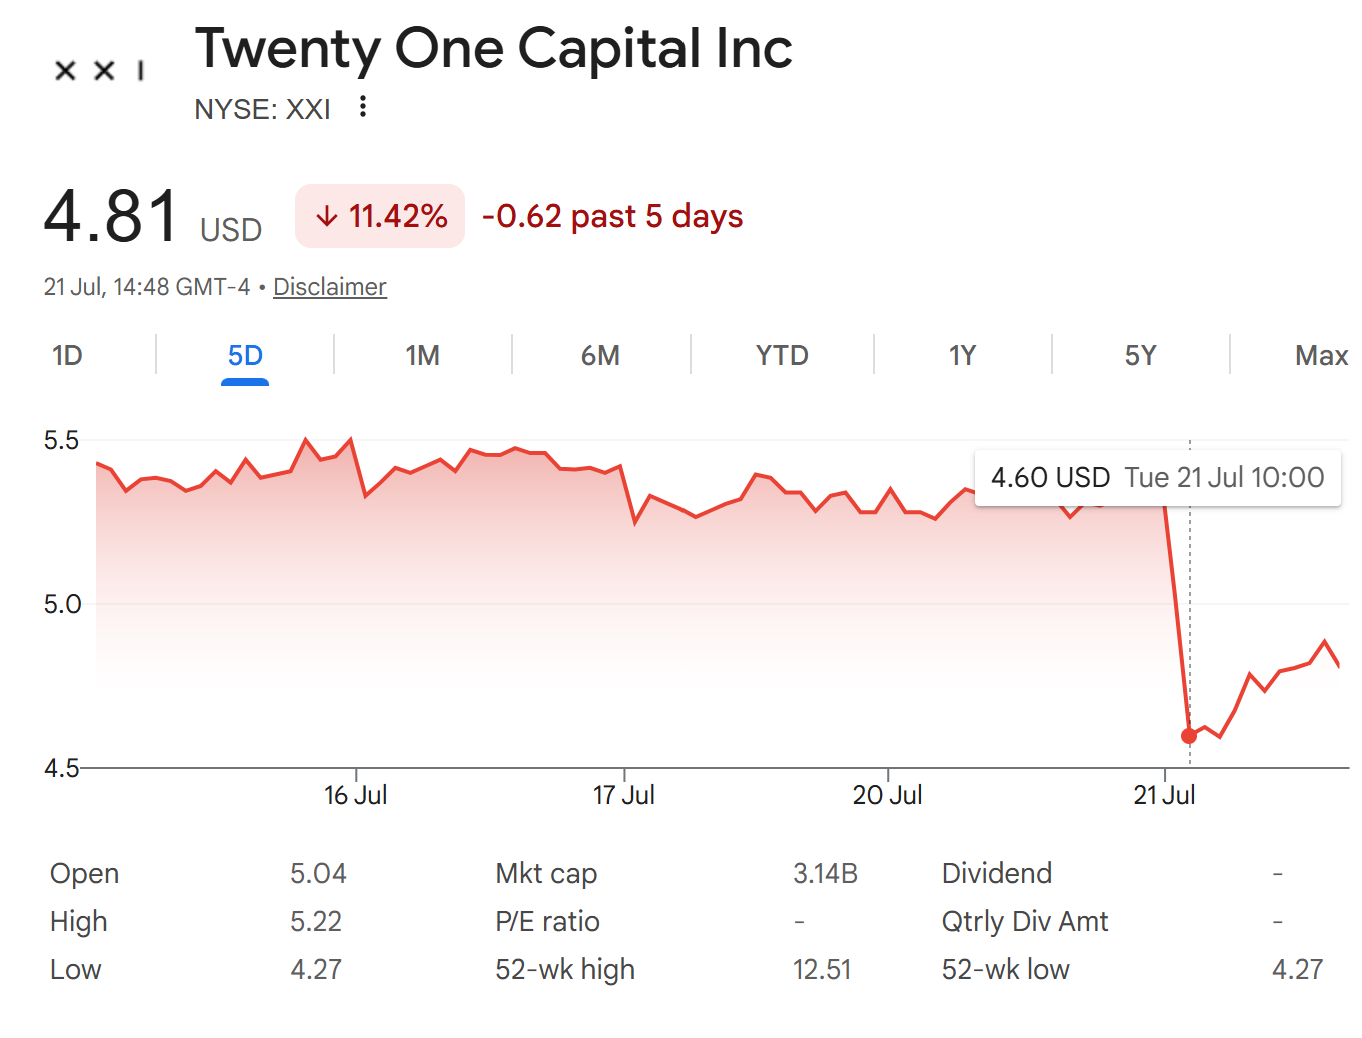
Jack Mallers has stepped down as CEO of Twenty One (XXI), the Tether-backed Bitcoin treasury firm. His exit lands months after he publicly pressed Michael Saylor over mNAV math and digital credit yields.
The Strike founder says he quit after clashing with the board over the company’s direction. Critics now tie his exit to the doubts he raised on stage earlier this year.
Board Disagreements End Jack Mallers’ Twenty One Tenure
Mallers announced the decision this week. XXI began trading on December 9, 2025, so his run lasted just seven months. The firm went public with roughly 43,500 BTC, worth about $4 billion at the time. Tether, Bitfinex, and SoftBank backed it.
Tether took full control in May 2026 by buying SoftBank’s entire stake.
He shared more detail in follow-up posts. He walked away, he said, because “the board and I couldn’t agree on the future of the company.”
He also denied a claim by X’s Grok chatbot that he collected $140.8 million in pay. His forfeited options, he noted, now expire worthless.
The exit leaves the second-largest corporate Bitcoin treasury fully in Tether’s hands. XXI is already rethinking its model. Incoming CEO Raphael Zagury wants cash flow, not just more Bitcoin buying.
The Saylor Questions That Resurfaced After His Exit
The backstory makes the exit sting more. At BTC Prague earlier this year, Mallers challenged Saylor from the audience over mNAV. The metric shows how much the market pays for each dollar of Bitcoin a treasury firm holds.
His concern was simple. Some firms count securities as equity even when they are far from turning into shares. That inflates the metric. In an interview at the event, he explained the question he put to Saylor.
“…do you agree with classifying out of the money securities as equity, which obviously that would inflate the equity value, which would make an MNAV metric more attractive,” Mallers said.
He used XXI’s own convertible bond as the example. The bond turns into stock at $13 per share. However, the stock traded near $5 at the time, so that switch was nowhere close.
On a panel the same day, Mallers took aim at digital credit. These products pay investors a big yearly dividend that never stops.
Stretch, sold by Strategy, paid 11.5% when Mallers spoke. SEC filings show the rate rose to 12% in July. His question was simple. Who pays that bill without real revenue?
“You’re not doing anything productive in the economy to produce cash flow that can afford the money that you want to give to your grandmother. So, who’s coming up with the money?” he said during the panel.
Saylor responded at length at the time. He framed mNAV as one metric among several and defended the model’s math.
Those clips are now everywhere again. Many read them as proof that Mallers doubted the sector’s core math long before he left it.
Rug Pull Claims Meet a Firm Denial
The market’s verdict was quick. XXI closed near $4.60 on Tuesday, down 13.5% in a day. Early backers paid $10 per share, so they have lost more than half their money.

Critics on X claim losses of up to 85% from the stock’s peak, and some accused Mallers of abandoning shareholders.
He pushed back hard.
“Rug pull? Who pulled what rug? I resigned voluntarily, took no severance, forfeited my options, and walked away because it was the right thing to do. Twenty One also never sold shares via an ATM while I was CEO,” Mallers replied on X.
Reactions split into three camps. Investor Mike Alfred praised the move as a sign of clarity and alignment. BnkToTheFuture founder Simon Dixon went further. He framed it as Mallers walking away from wrapped securities entirely.
A third camp sees a warning for the digital asset treasury (DAT) sector. The model looks strong while premiums grow, they argue. The real test starts when mNAV compresses and capital dries up.
The rankings could shift too. Metaplanet crossed 43,000 BTC in July. That nearly matches XXI’s stash of roughly 43,500 BTC, putting the second spot in play.

The debate lands with Bitcoin (BTC) near $66,600 on Tuesday, a five-week high. Mallers, meanwhile, returns his full attention to Strike. There, he wants cash flow, not dilution, to fund Bitcoin buying.
Whether his warnings prove right now depends on XXI’s next chapter under Tether. If the restructured company delivers without the metrics he questioned, his critique may fade with the drawdown that fueled it.
The post Jack Mallers Questioned MicroStrategy’s Bitcoin Strategy, Now He’s Stepping Down From Twenty One appeared first on BeInCrypto.


Russia’s State Duma approved a sweeping crypto bill on July 21 that brings trading into a licensed financial system. Industry critics say the rules could dismantle the market they claim to regulate.
Lawmakers passed Bill No. 1194918-8 in its second and third readings on the same day. It still needs approval from the Federation Council and President Vladimir Putin.
The main rules would start on September 1, followed by a transition period ending July 1, 2027.
A Legal Market With Narrow Doors
The bill allows individuals and companies to buy and sell crypto through licensed Russian intermediaries.
These will include brokers, asset managers, exchanges, digital depositories and a new class of registered crypto exchangers.
A digital depository would hold and record customers’ crypto, much like a traditional custodian. Crypto payments for goods and services inside Russia will remain prohibited.
Retail investors must pass a test and may buy only the most liquid assets selected under Bank of Russia criteria.
Their limit will be 300,000 rubles per year through each intermediary. Current criteria would likely admit Bitcoin, Ethereum, and USDT. Qualified investors face no purchase cap.
Foreign Exchanges Lose Their Banking Rail
From July 1, 2027, Russian banks will have to block direct payments to unlicensed foreign exchanges.
GMT Legal founder Andrey Tugarin said users will no longer be able to fund overseas platforms directly through Russian banks after that date.
Some crypto transfers will also face a 48-hour anti-fraud cooling period. The thresholds will be 300,000 rubles for transfers inside Russian infrastructure and 100,000 rubles when assets move into international infrastructure.
A Market Built From Scratch
Registered exchangers will need at least 15 million rubles in capital. They must install anti-fraud systems, separate client assets from company funds and meet strict compliance, staffing and cybersecurity rules.
“Crypto exchangers are a completely new legal form,” Tugarin said. No existing Russian company automatically holds that status.
However, the bill gives exporters, importers, miners, exchangers and depositories wider access to crypto for foreign trade. It also creates a clearer route for USDT, USDC and other stablecoins by classifying them as foreign digital instruments.
“This Is a Ban”
Exved founder Sergey Mendeleev said the industry had submitted detailed proposals since December 2025, but lawmakers largely ignored them.
He argued that the framework favours selected banks, exchanges and foreign-trade participants while restricting ordinary users and existing crypto businesses.
Traditional financial firms could also lose millions before realising crypto trading will not produce the margins they expect, he said.
“This is not regulation. It is a ban. Like casinos or forex,” Mendeleev concluded.
The bill creates legal crypto access through a tightly controlled domestic system. Its survival will depend on whether users and businesses accept those limits or continue operating outside it.
The post Russia’s Duma Approved a Crypto Bill That Could Destroy Its Market appeared first on BeInCrypto.
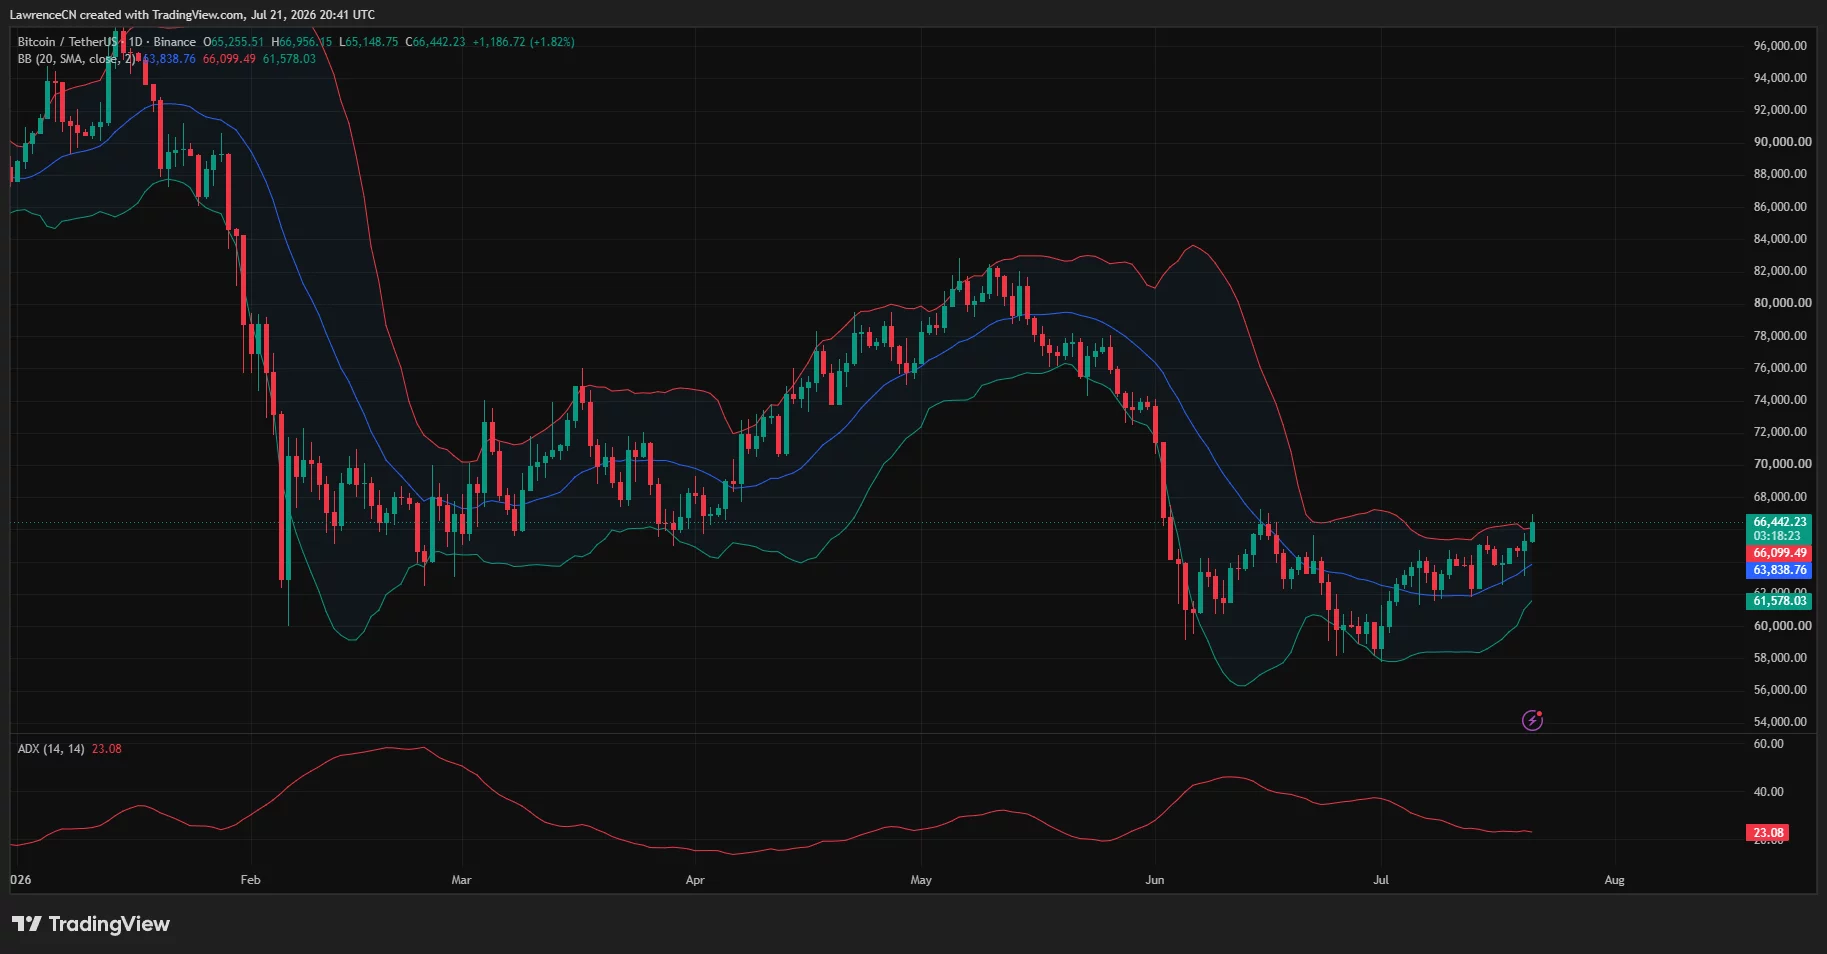
Bitcoin price has retreated from nearly $67,000 after escalating U.S.-Iran hostilities pushed oil prices higher and tempered optimism created by progress on the CLARITY Act.
Summary
- Bitcoin pulled back after briefly touching $66,965 as sellers defended the $67,000 resistance level.
- CLARITY Act progress, ETF inflows and short liquidations fueled BTC’s rapid advance.
- Rising oil prices and the U.S.-Iran conflict threaten a sustained breakout toward $70,000.
According to data from crypto.news, Bitcoin (BTC) price rose from an intraday low of $65,149 to $66,965 on July 21 before sellers forced the price back to about $66,440. The asset remained up 1.8% on the day, but its failure to hold $67,000 showed that traders were unwilling to chase the rally as energy and inflation risks returned.
CLARITY Act progress and ETF inflows have fueled Bitcoin’s rally
Bitcoin’s advance began after the White House and Senate negotiators reached an agreement on an ethics provision that had delayed the Digital Asset Market Clarity Act. Treasury Secretary Scott Bessent described negotiations as being at the “1-yard line,” while senators suggested the bill was close to a final vote.
The proposed ethics rules address concerns about elected officials and senior government figures holding or promoting crypto assets while in office. Reports that President Donald Trump had accepted the provision helped crypto-linked stocks rally, with Coinbase and Circle shares gaining as much as 10% during the session.
U.S. spot Bitcoin exchange-traded funds added another source of demand. According to SoSoValue data, the funds recorded about $227 million in net inflows on July 20, their fifth consecutive positive session and their longest inflow run since April.
The ETF streak followed a difficult June, when investors withdrew billions of dollars from the products. Five days of fresh allocations have helped absorb available supply while Bitcoin has recovered from its June low near $58,000.
Spot activity also remained firm during the latest advance. Commenting on the order flow, analyst Ted Pillows wrote:
“Consistent spot buying for BTC now. This looks much better.”
Leverage amplified the initial breakout. Market data showed roughly $223 million in crypto positions liquidated over 24 hours, including about $181 million in shorts. Forced purchases by bearish traders helped Bitcoin clear $65,000 and accelerate through the $66,000 resistance area.
A separate derivatives event later exposed the rally’s fragility. According to trader Daan Crypto Trades, a position worth more than $100 million appeared to close at market, erasing over $250 million in Bitcoin open interest within one minute.
BTC briefly fell toward $65,900 before recovering most of the decline, which Daan attributed to a possible execution error or an attempt to trigger cascading liquidations.
Oil risks and overhead supply have blocked a clean $67,000 breakout
Oil prices have complicated the bullish setup. U.S. crude climbed about 2.6% to $84.70 per barrel, its highest level since June 12, as supply fears grew across the Strait of Hormuz and the Red Sea.
Washington carried out a tenth consecutive day of strikes against Iran, while Trump warned that Tehran “will pay” for attacks that killed American soldiers. Reuters also reported damage to a tanker near the Strait of Hormuz and disruption involving Saudi crude shipments after threats from Iran-aligned Houthi forces.
Higher energy costs could feed into July inflation and give the Federal Reserve less room to support financial markets. The dollar strengthened as traders reassessed the chances of higher interest rates, creating a potential headwind for Bitcoin and other speculative assets.
On the daily chart, BTC has moved above the Bollinger Band midpoint at $63,839 and briefly exceeded the upper band near $66,100. Trading above the upper band confirms strong buying pressure, but the rejection from $66,965 raises the risk of a pullback toward the band’s midpoint.
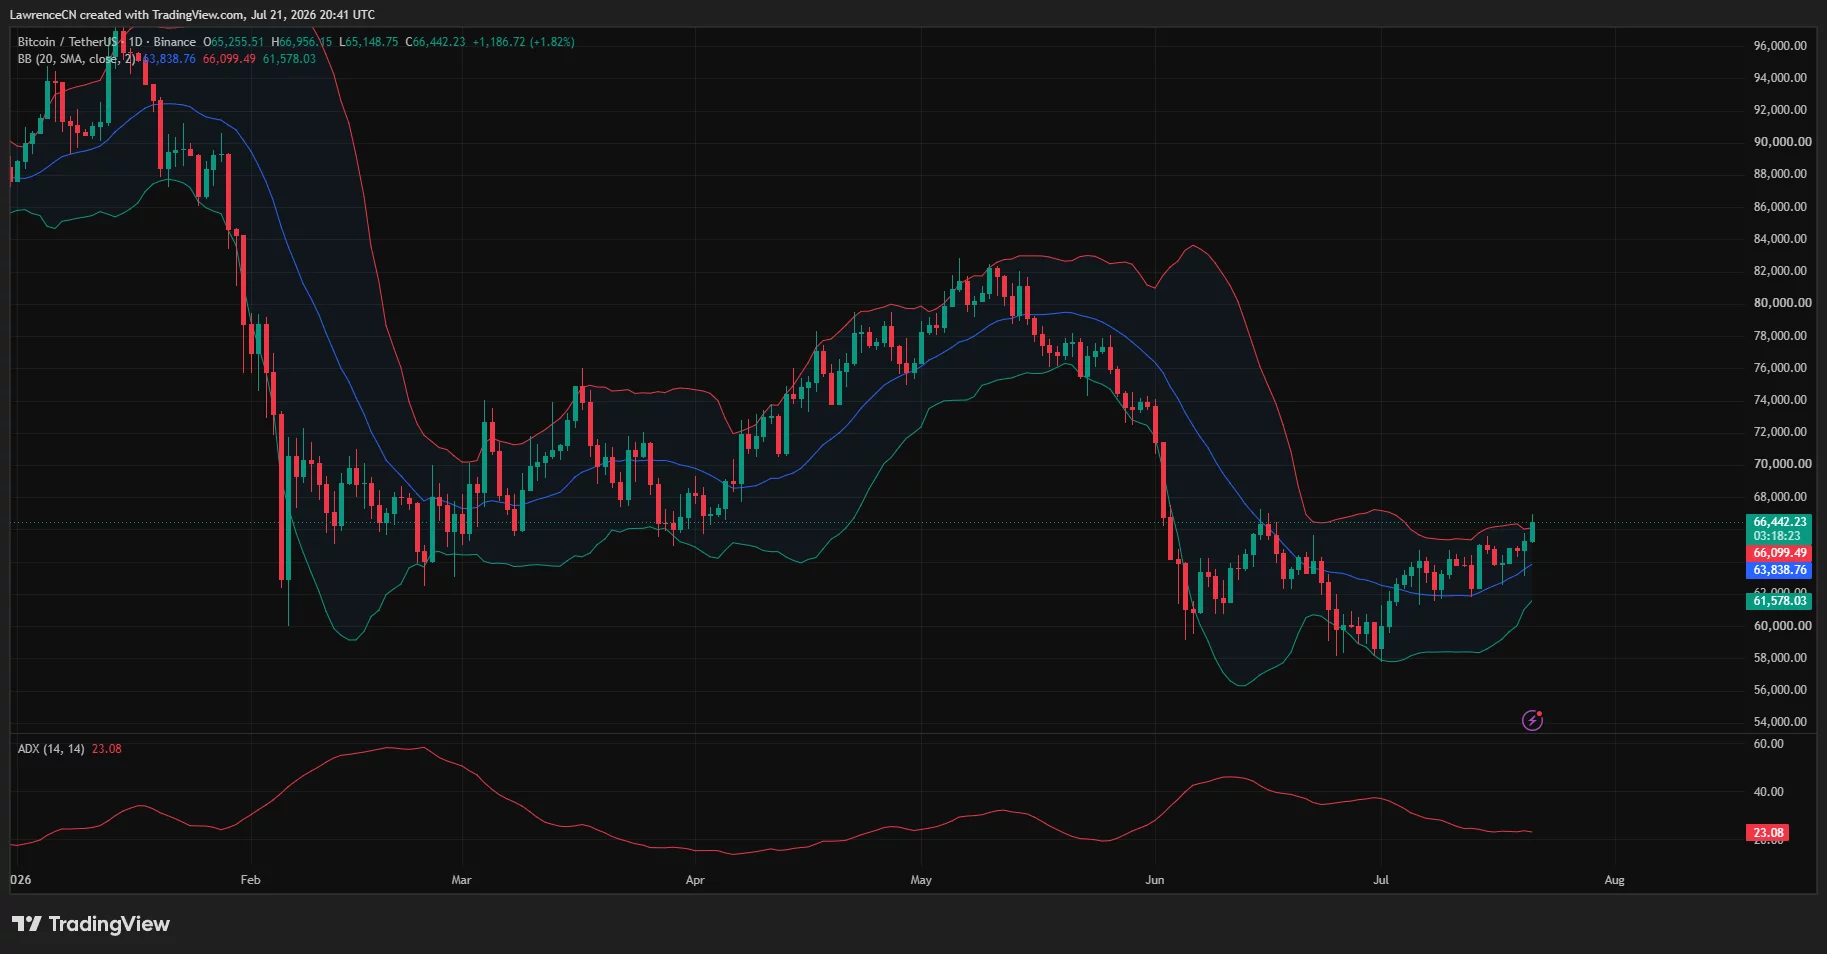
The Average Directional Index stood at 23.08. A reading below 25 means the daily trend has not yet gained enough strength to confirm a sustained directional move, despite Bitcoin’s recovery from the June trough.
Bitcoin has also reached the upper boundary of an ascending parallel channel on the four-hour chart. Resistance sits between $67,000 and $67,800, while the channel floor runs near $64,000. A four-hour close above $67,800 would clear the structure and expose $69,500, followed by the psychological $70,000 level.
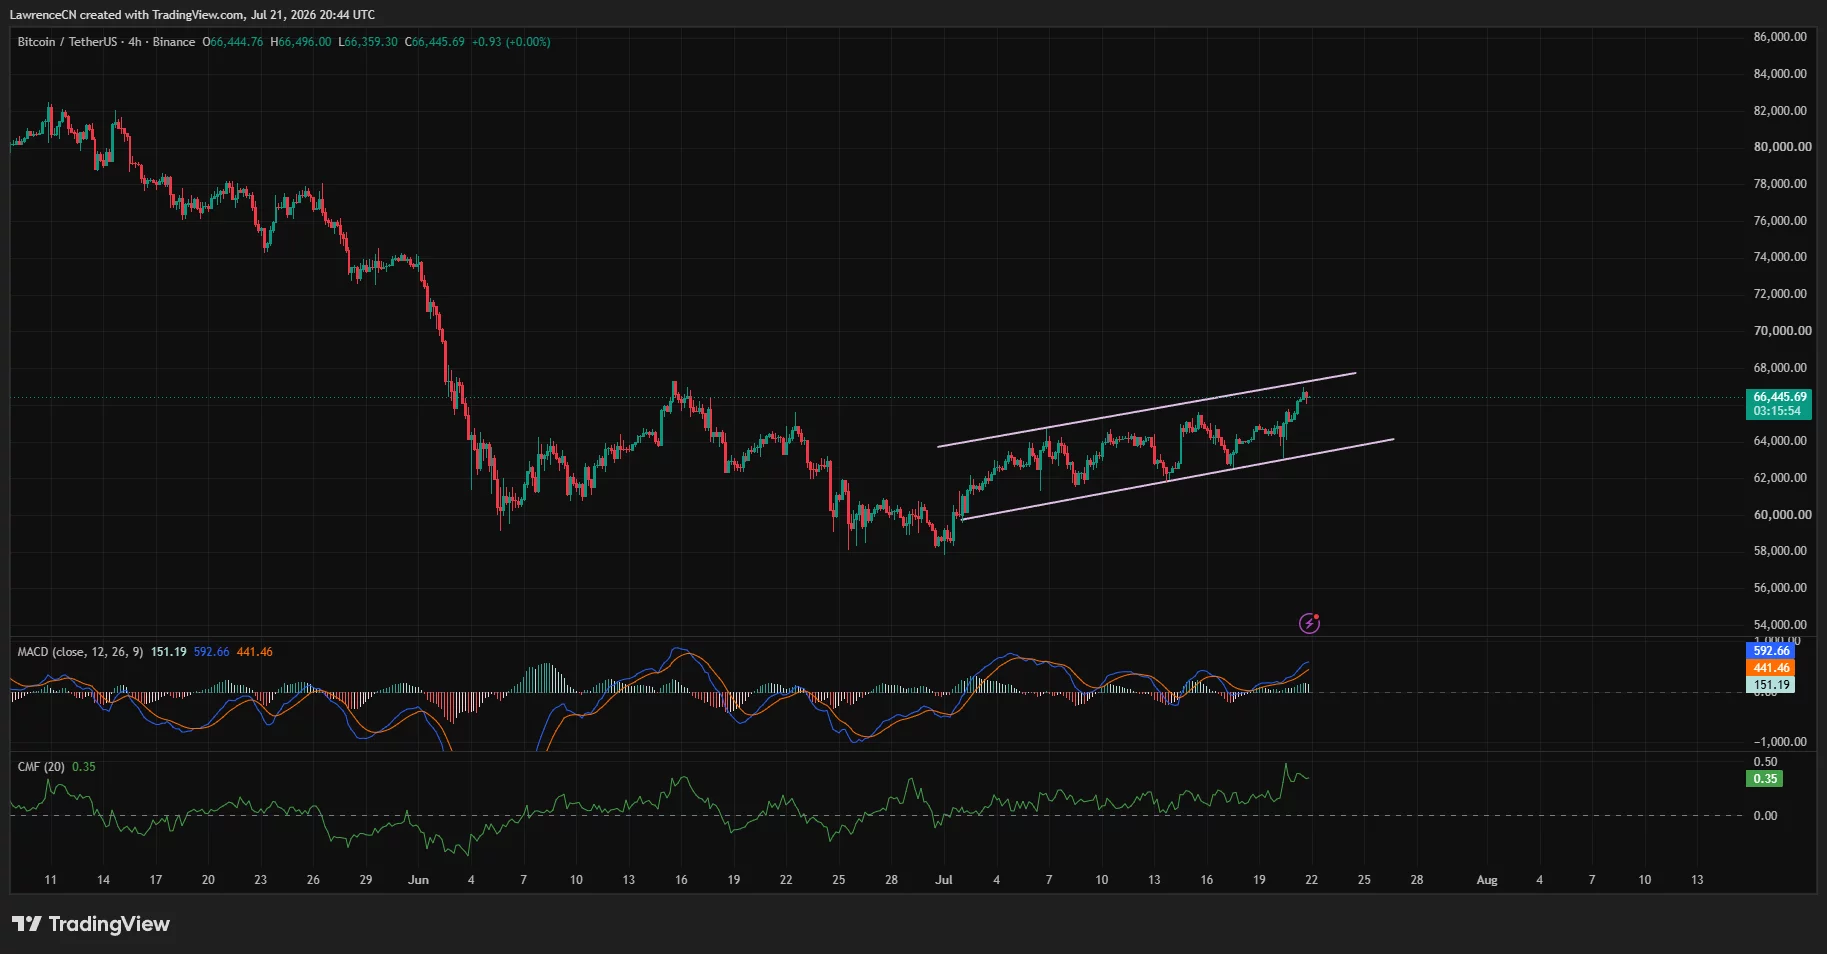
Momentum still favors buyers. The four-hour MACD line stood at 592.66, above its 441.46 signal line, while the positive histogram reached 151.19. The Chaikin Money Flow reading of 0.35 showed that capital continued to enter the market despite the rejection.
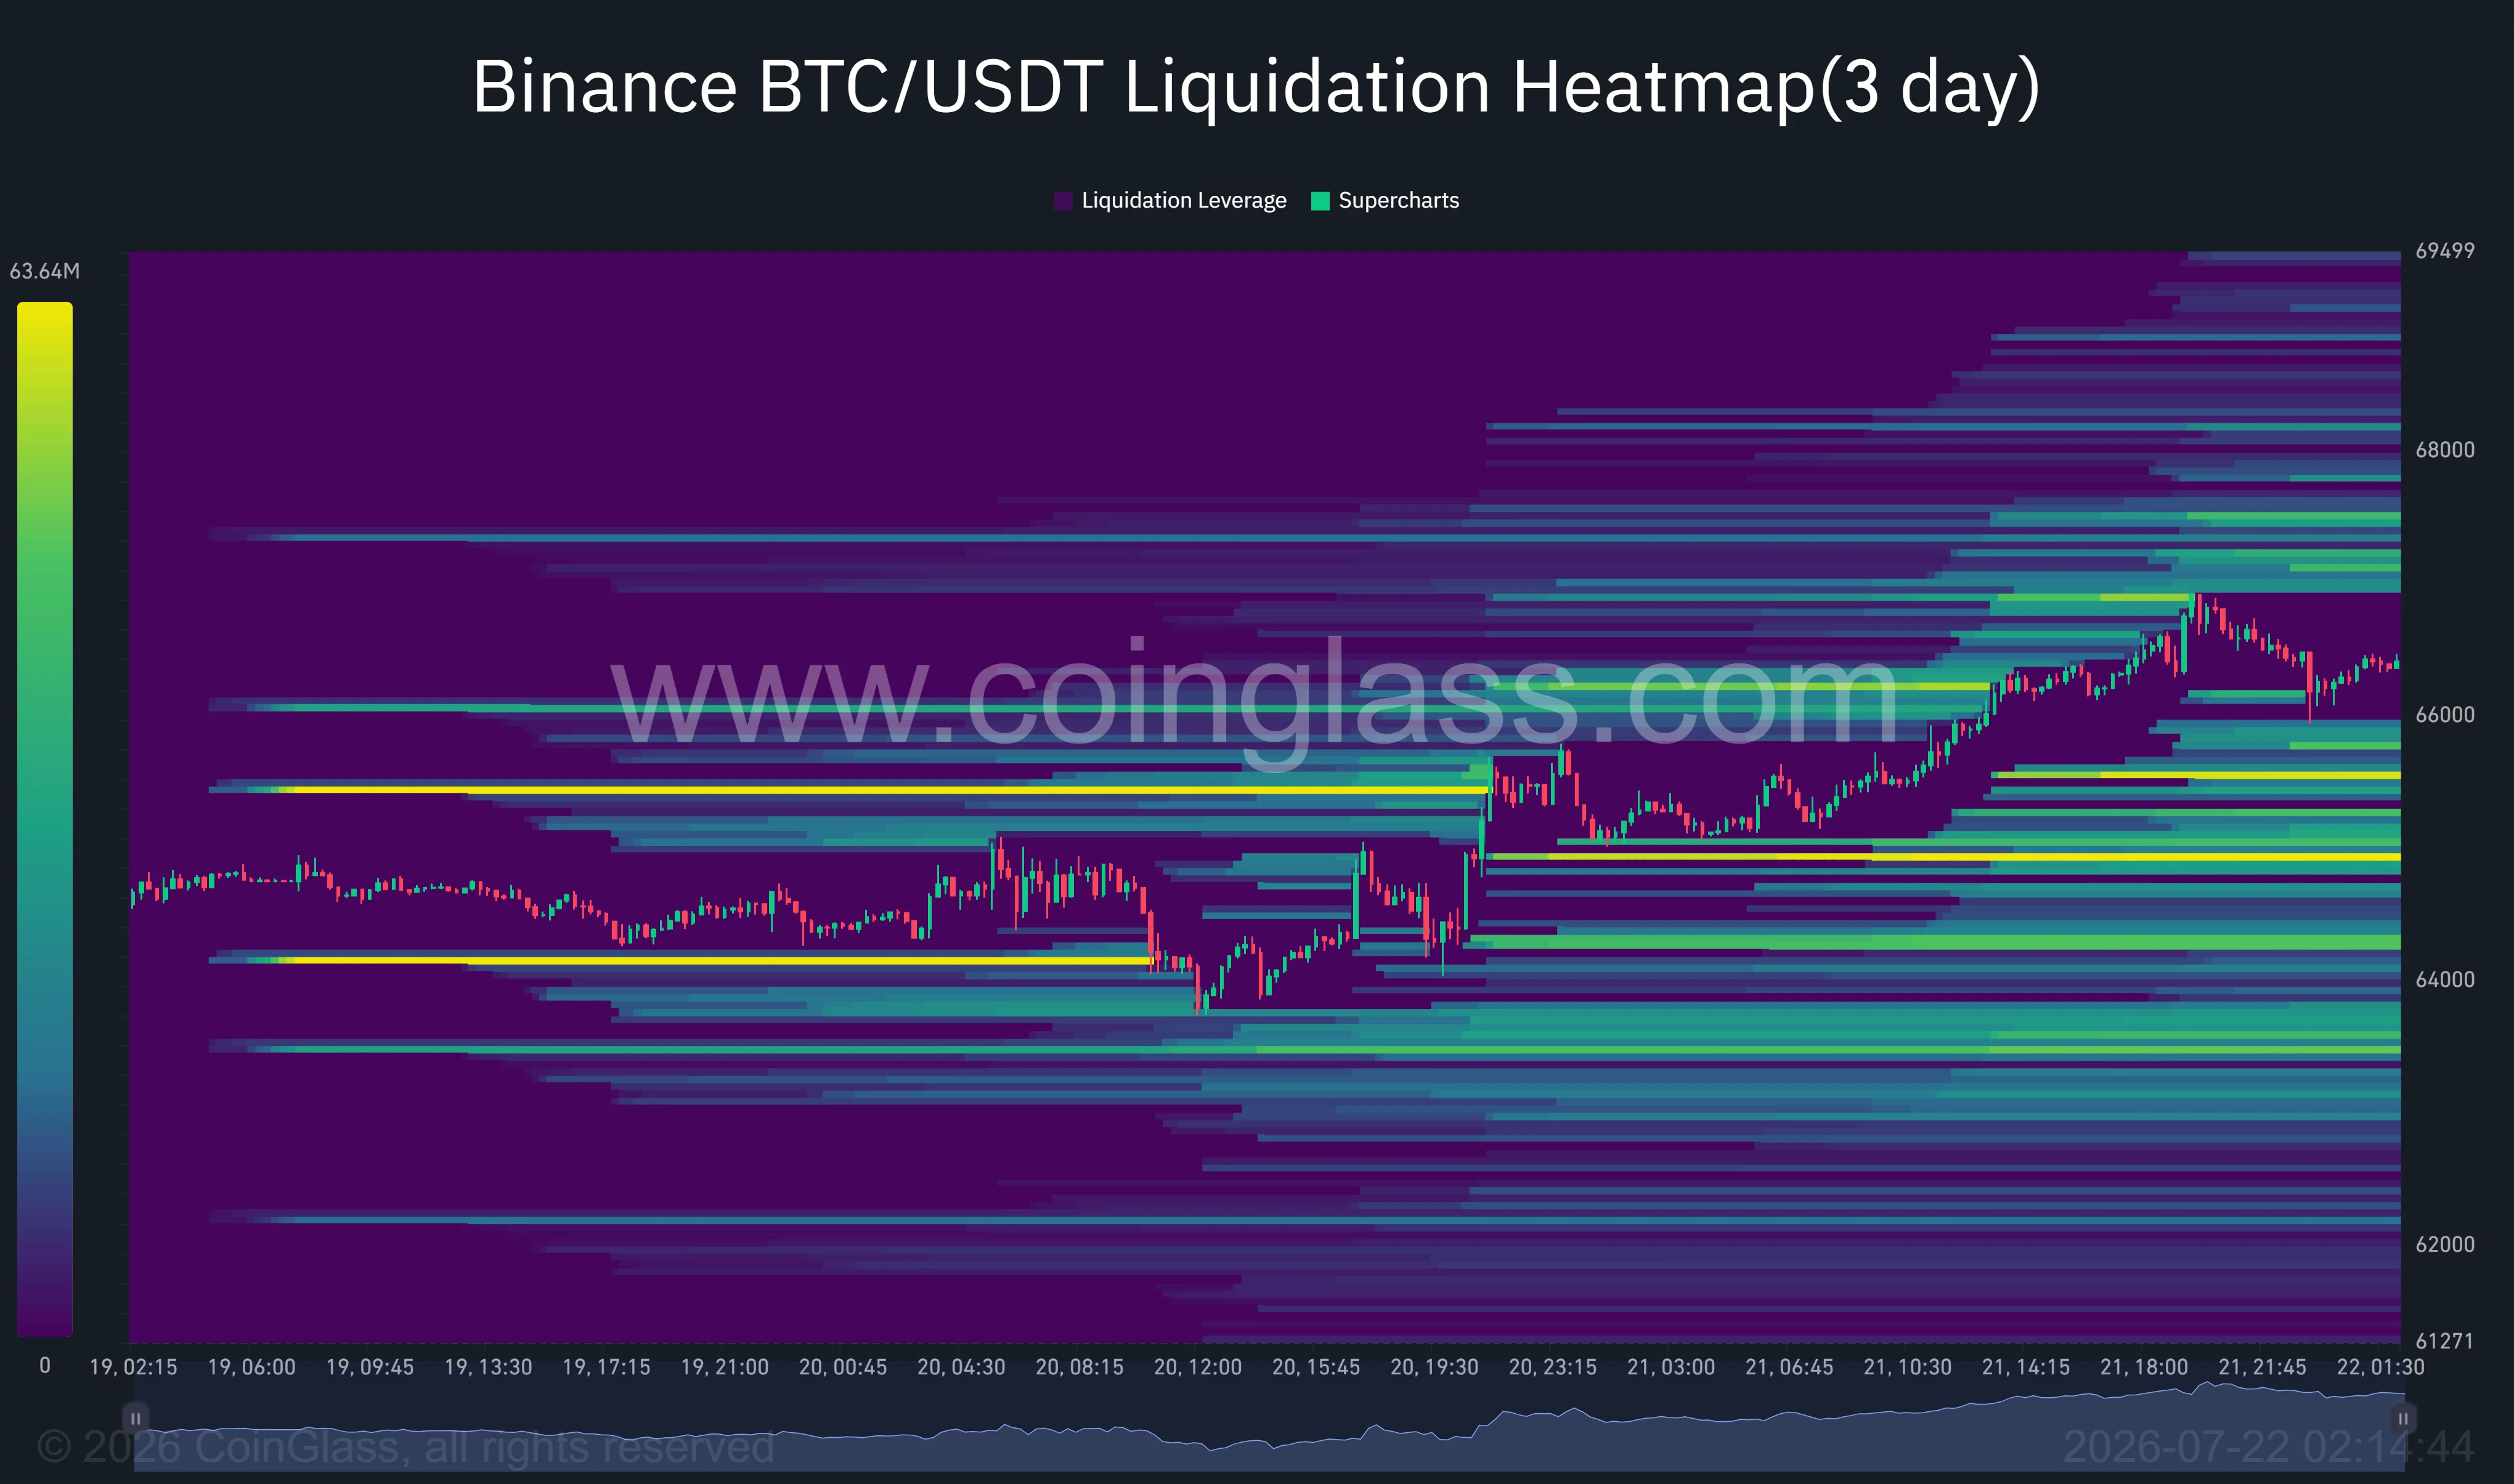
CoinGlass’ three-day liquidation heatmap places the closest overhead leverage around $66,800 to $67,300, with another concentration near $68,000. A move through those levels could force additional short closures. Below price, liquidation pools appear around $65,300, $64,800, and $64,200.
The bullish case would weaken if BTC closes below the channel floor and loses the daily Bollinger midpoint near $63,800. Such a breakdown could expose the lower daily band at $61,578, while renewed oil gains, further military escalation, or declining ETF inflows would add pressure. Bitcoin must therefore convert $67,000 into support before the latest recovery can extend toward $70,000.
Disclosure: This article does not represent investment advice. The content and materials featured on this page are for educational purposes only.
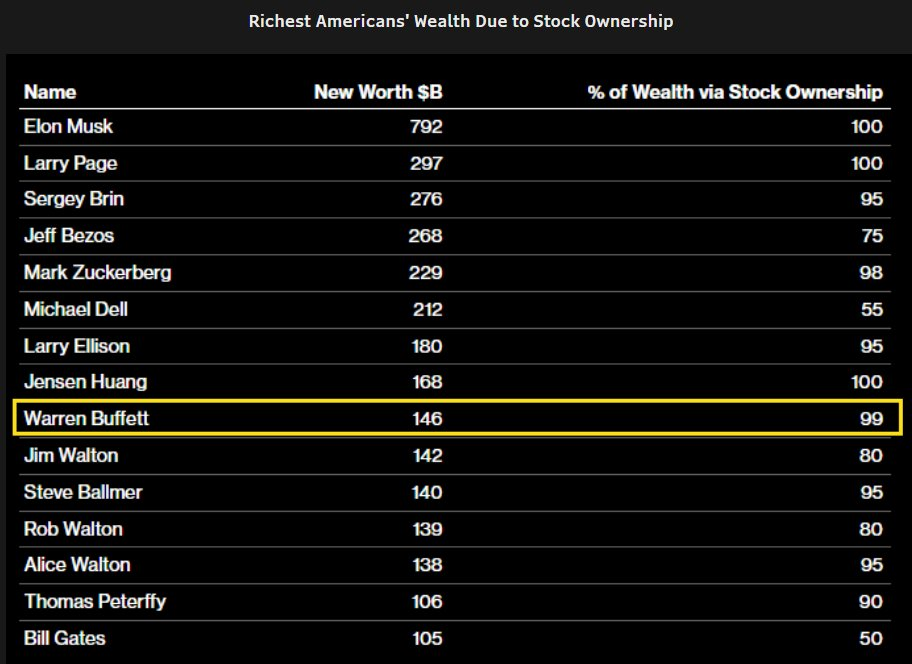
A top Bloomberg analyst has a bold idea for Warren Buffett. Eric Balchunas says the investor should give his Berkshire Hathaway shares to Trump Accounts, the new government investment accounts for American children.
Balchunas shared the idea on Tuesday. Buffett, 95, plans to give away his remaining Berkshire stake, worth about $140 billion, by the end of 2034.
Why Balchunas Points Buffett to Trump Accounts
Trump Accounts launched on July 4. They were created under the One Big Beautiful Bill Act, a new tax law. Every eligible child born between 2025 and 2028 gets a $1,000 deposit from the Treasury.
Families can add up to $5,000 per year. The money sits in an S&P 500 index fund called SPYM by default. The Treasury picked Robinhood and BNY to run the app and the accounts.

Balchunas, the senior ETF analyst at Bloomberg Intelligence, thinks the accounts are a natural match for Buffett. Almost all of Buffett’s wealth is Berkshire stock. He has also promised to give more than 99% of it away.
“I’ve thought about this for a while and have come to the conclusion that Warren Buffett et al could/should choose Trump Accounts as the destination for donating their stock shares,” he wrote.
He listed several benefits. Stock gifts could narrow the wealth gap and teach kids about investing. They also skip capital gains tax. And children holding Berkshire shares would carry Buffett’s legacy forward.
There is a precedent. Michael and Susan Dell pledged $6.25 billion to the program. Their gift gives $250 each to about 25 million children in lower-income ZIP codes.
Why It May Never Happen
Buffett’s money is already going elsewhere. On July 14, he gave nearly $6 billion in Berkshire shares to his four family foundations. He also cut out the Gates Foundation for the first time since 2006.
“My goal is to dispose of all of my Berkshire shares within about eight years,” Buffett said in a statement.
The rules are another problem. The accounts only take cash today. Congress also limited them to US index funds with fees under 0.1%.
Changing that would take a new law. Altimeter Capital CEO Brad Gerstner has pushed to allow stock gifts from billionaires. Even he faces that wall.
Meanwhile, President Donald Trump has hinted that Bitcoin (BTC) could join the accounts one day.
For now, it is just an idea. Buffett’s next round of giving will show whether Trump Accounts ever make his list.
The post Warren Buffett’s $140 Billion Giveaway: Will Trump Accounts Get a Slice? appeared first on BeInCrypto.
Key takeaways:
- Despite ETH’s price gains, weak onchain activity and low DEX volumes signal trader caution.
- Record Ethereum staking at 34% reduces sell pressure, yet sustained upside needs external catalysts.
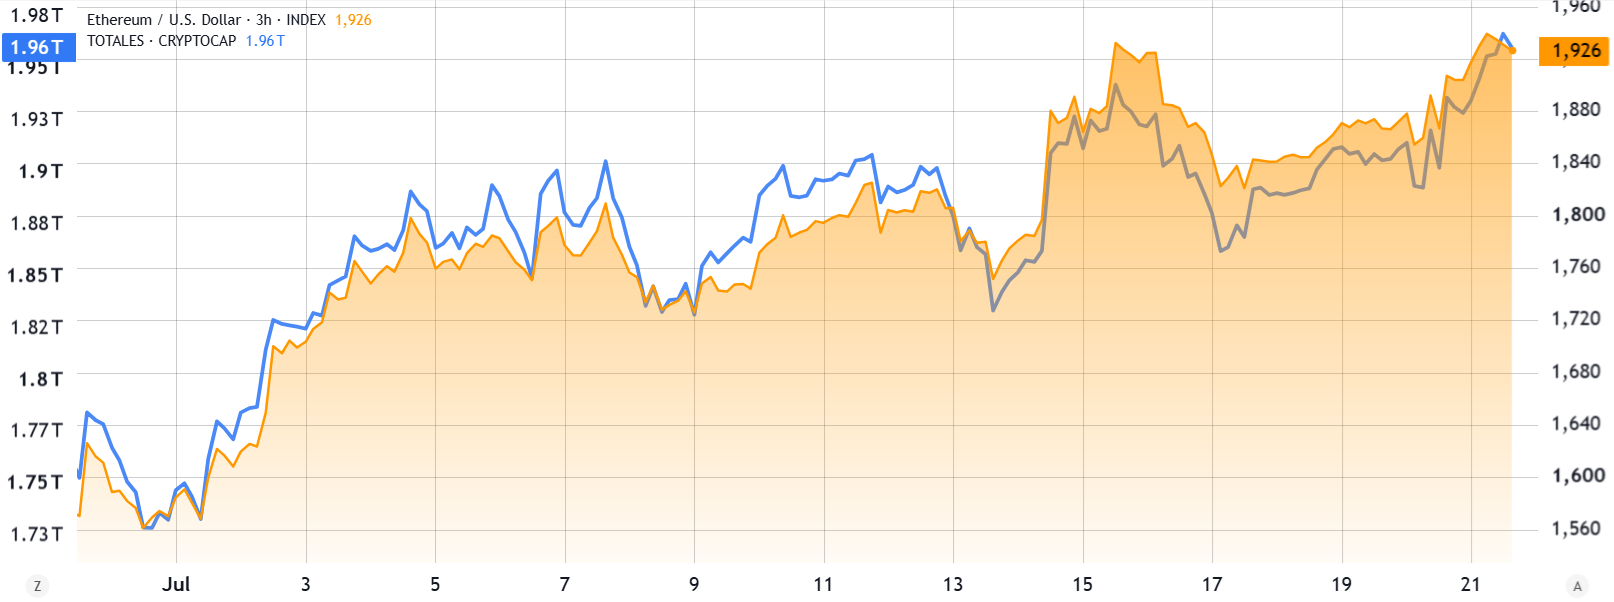
Ether (ETH) tested the $1,950 mark for the first time in seven weeks on Tuesday, triggering $62 million in liquidations across leveraged bearish positions. The move delivered 29% gains from the $1,500 low on June 26 and aligned with the broader risk-on mood that drove Bitcoin (BTC) above $66,500. Can ETH push through to $2,100?
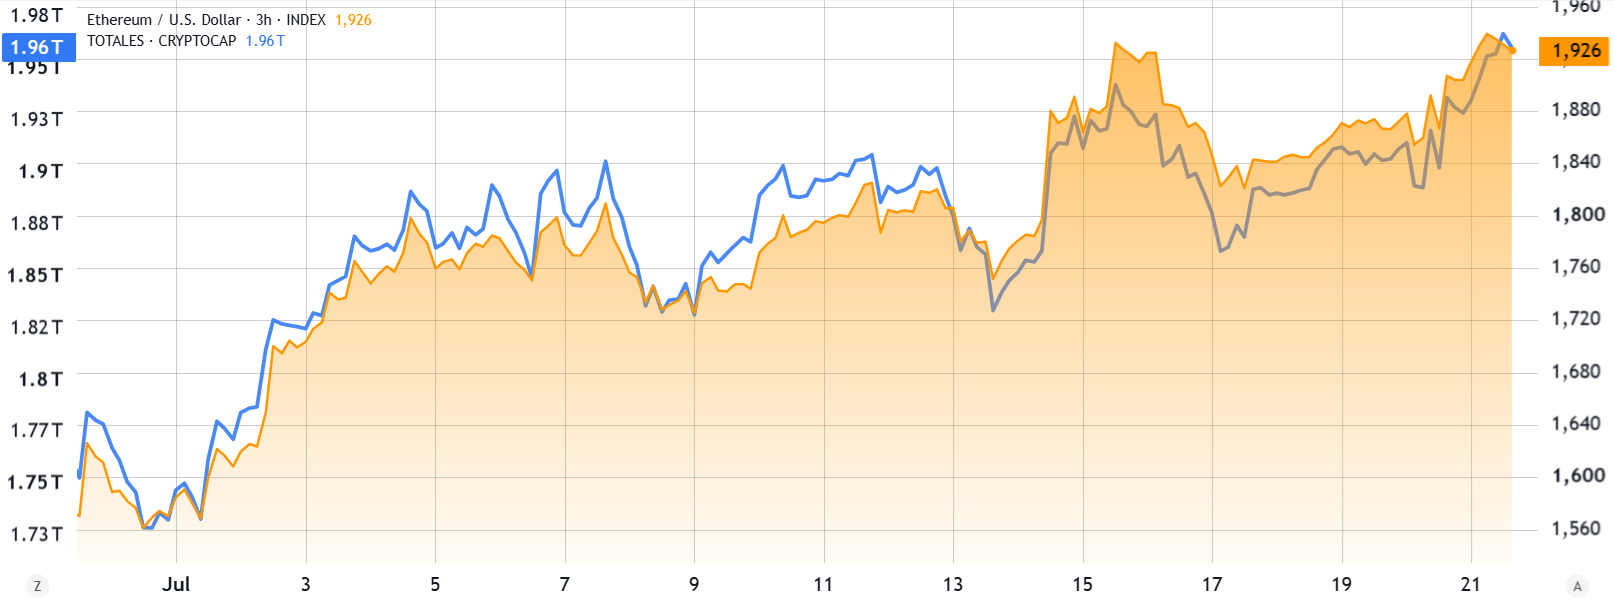
Total crypto market capitalization (left) vs. ETH/USD. Source: TradingView
Ether’s price largely tracked the overall crypto market trend, which shifted to positive momentum in July. Tuesday’s gains in the US stock market helped ease investor worries about stretched valuations after the artificial intelligence stock rally. Traders expect solid corporate earnings after 3M Company (MMM US) reported results Tuesday morning.
Google’s parent, Alphabet, is expected to report quarterly results on Wednesday after US stock markets close. Investors look for 64% growth in cloud services revenue amid heavy AI investments. Strong earnings could restore confidence and help push the cryptocurrency market past the $2 trillion total capitalization mark.
Weak Ethereum onchain metrics and muted ETH derivatives persist
Despite recent ETH price gains, Ethereum onchain metrics show stagnation. Demand for blockchain processing has not recovered to levels seen six months ago, partly because traders are showing less interest in memecoins and utility tokens. Some of Ethereum’s top projects posted losses of 50% or more year-to-date, including Ethena (ENA), Mantle (MNT) and Arbitrum (ARB).
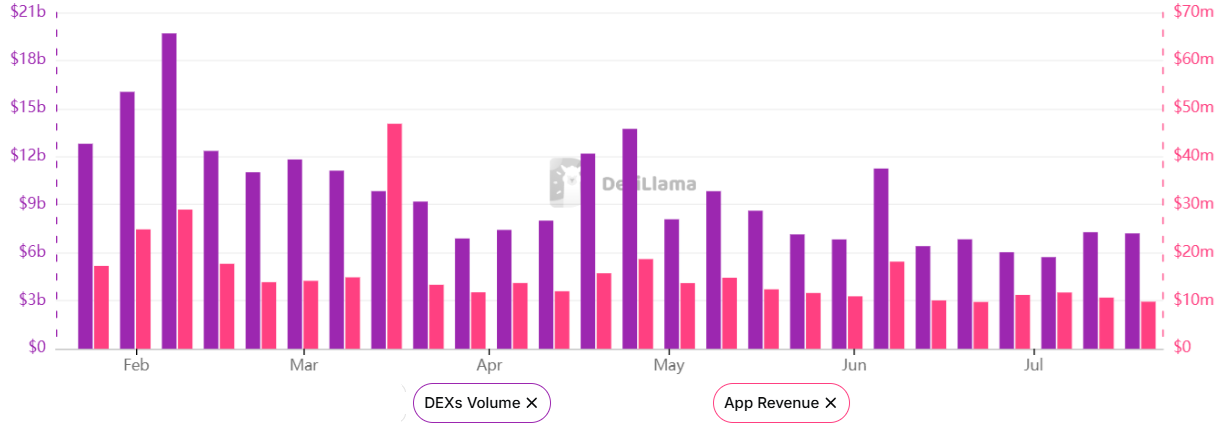
Ethereum network weekly DEX volumes & DApps revenues, USD. Source: DefiLlama
Weekly revenue for Ethereum’s decentralized applications (DApps) fell to the lowest levels since September 2024, hitting $9.8 million. Among the strongest performers are Sky (formerly MakerDAO) at $3.2 million in weekly revenue and Chainlink, which brought in $1.2 million over the same period. Overall, decentralized exchange (DEX) volumes dropped to $7.2 billion per week.
Ethereum’s weak onchain data mirrors the subdued mood in derivatives markets.
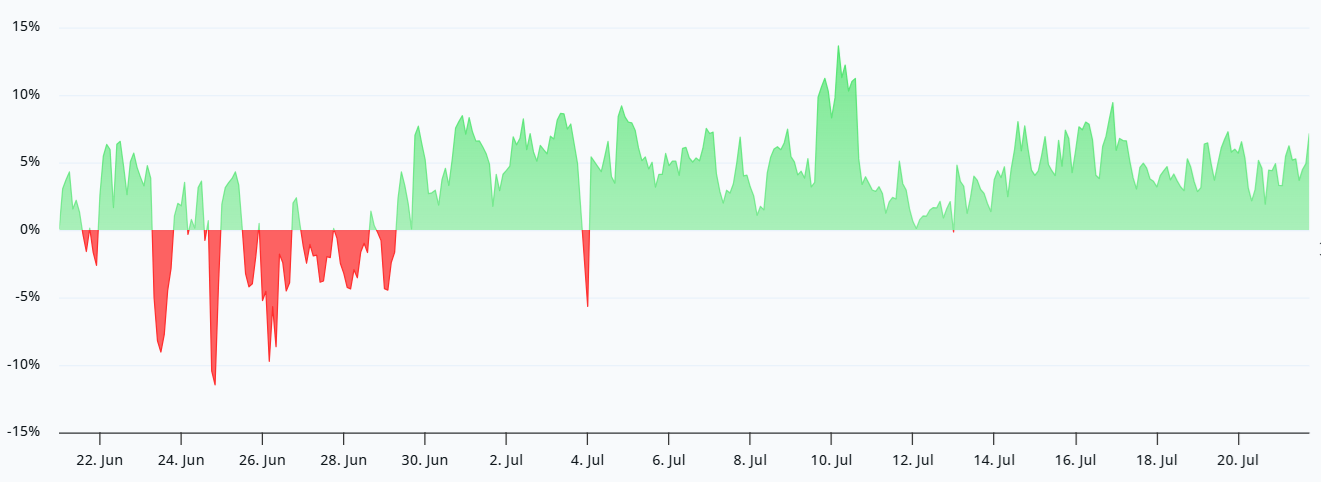
ETH perpetual futures annualized funding rate. Source: Laevitas
The annualized funding rate on ETH perpetual futures has struggled to remain within the neutral 6%-12% range over the past month. Still, sentiment has improved from the negative rates seen in late June, which reflected heavy bearish demand. Rising interest in Ethereum staking has likely boosted trader expectations for price gains and reduced downside risks.
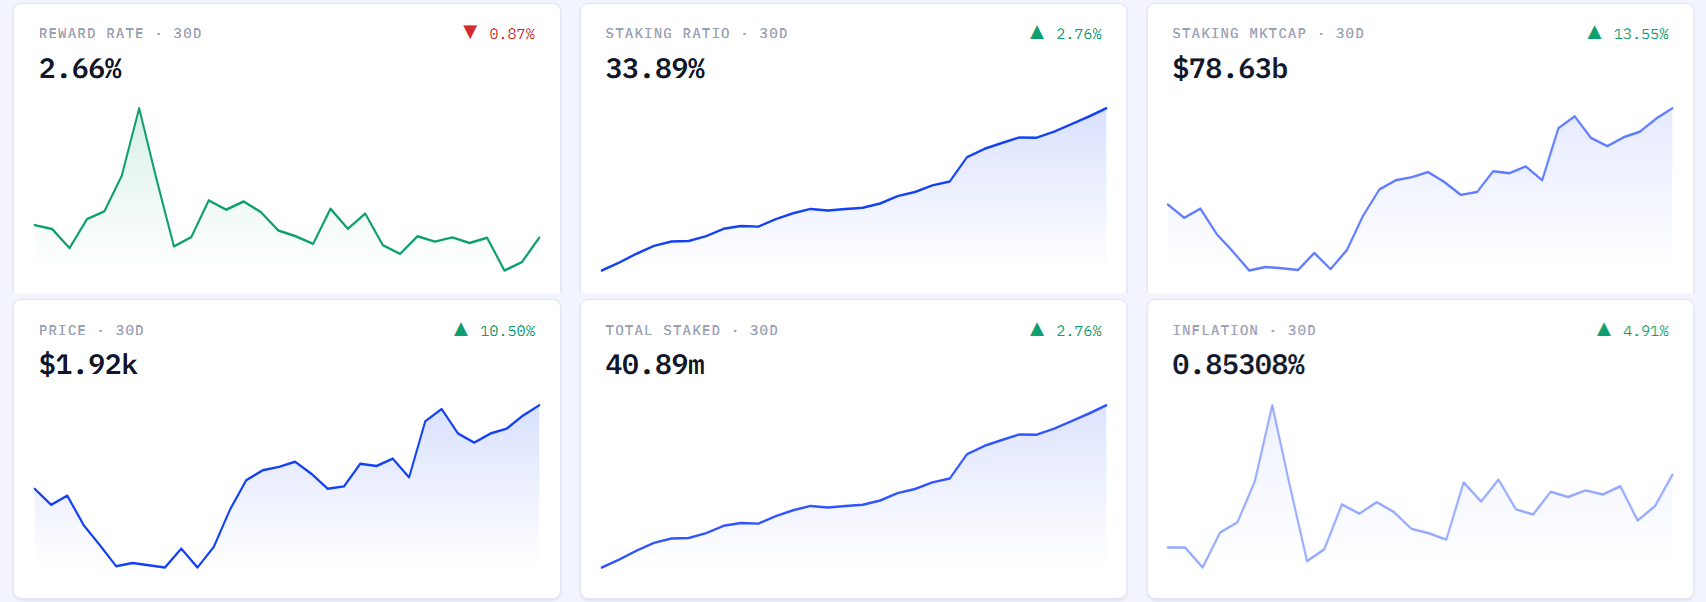
Ethereum staking data. Source: StakingRewards
According to Staking Rewards data, a record-high 34% of all ETH supply is now staked, up from 33% one month earlier. Analysts expect reduced sell pressure as long-term holders keep accumulating supply, including Tom Lee’s Bitmine Immersion (BMNR US), which added 156,719 ETH over the past month. The company now controls 4.8% of available supply.
ETH price is 61% below the all-time high from August 2025, which helps explain why bulls lack enthusiasm in derivatives markets. The soft on-chain metrics and six-month bear market have left traders skeptical about sustained upside.
Ether’s path to $2,100 likely depends on reduced risk aversion across markets, which makes Google’s revenue guidance on Wednesday especially important.
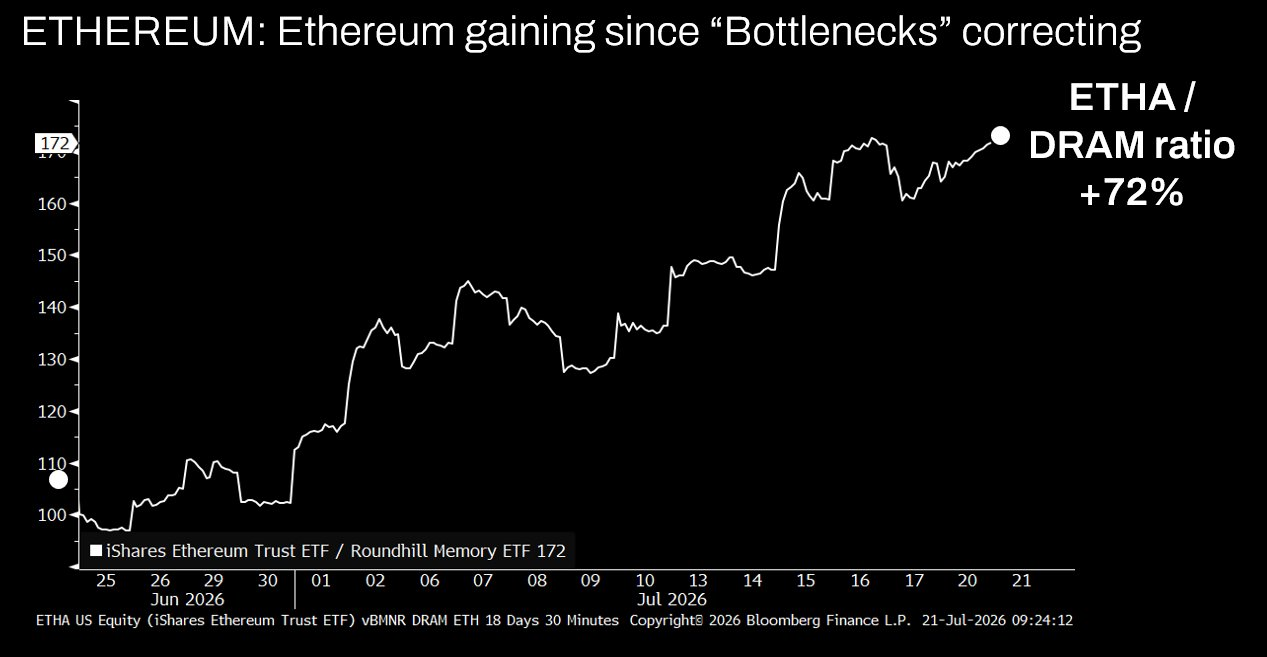
Tom Lee says the AI trade is changing lanes. He points to Ethereum (ETH) beating the Roundhill Memory ETF (DRAM) by 72% in relative terms this month, a sign of AI money rotating into Ethereum.
ETH rose 24% in his chart window while the memory fund fell 38%. Lee co-founded research firm Fundstrat and now chairs BitMine, one of the largest holders of ETH.
ETH Up 24%, Memory Fund Down 38%
Lee shared the chart Monday in a post. The 72% is the rise in Lee’s ratio chart. It divides BlackRock’s iShares Ethereum Trust ETF (ETHA) by the memory fund. That ratio climbed from 100 to 172 between June 25 and July 21.
“The “AI downstream” relative performance continues to strengthen – $ETH vs $DRAM relative outperformance in the past month gained to 7,200bp, or 72 percentage points – ETH up +24% vs $DRAM ETF down -38%”

The DRAM ETF is new. Roundhill launched it in April as the first fund built only on memory chipmakers. SK Hynix and Samsung alone make up about 41% of it, data shows.
Investors piled in fast. The fund raised $6.5 billion in 27 trading days, the fastest ETF launch on record. It peaked at $81.34 before the slide. Lee’s 38% drop measures from June 25.
Ether, meanwhile, trades near $1,921, up 1.5% in a day. BeInCrypto rankings data shows ETH up 10.9% over 30 days. Lee’s bigger 24% measures from June 25, when his chart starts.

ETH also sits 61% below its August 2025 peak of $4,946. So the winner of this trade is still climbing out of its own hole.
AI Money Rotating Into Ethereum, or Just a Memory Reset?
Lee’s case is simple. Wall Street is building on Ethereum, not just trading it. He points to BlackRock’s tokenized BUIDL fund and Robinhood Chain, which pays its fees in ETH. That drives Ethereum’s institutional bull case.
He also compares ETH to Amazon, which sat near $6 for 12 years before its market grew. Big wallets lean his way for now. BitMEX co-founder Arthur Hayes resumed buying, adding $2.53 million in ETH on Monday.
However, the memory story is not dead. Jefferies expects memory prices to climb about 50% this quarter. Supply is so tight that a US lawsuit accuses chipmakers of engineering a 700% DRAM price spike.
The ETF’s slide may simply be a reset after a wild run. SanDisk sank 14%, Micron 5%, and Seagate 10% in one July session on memory supply glut fears.
One caveat. Lee’s BitMine holds 5.77 million ETH, about 4.8% of all supply. If his rotation call wins, he wins with it.
What settles the question? Memory earnings and Ethereum ETF flows in the coming weeks.
The post Is AI Money Rotating Into Ethereum? Tom Lee Cites 72% Outperformance appeared first on BeInCrypto.
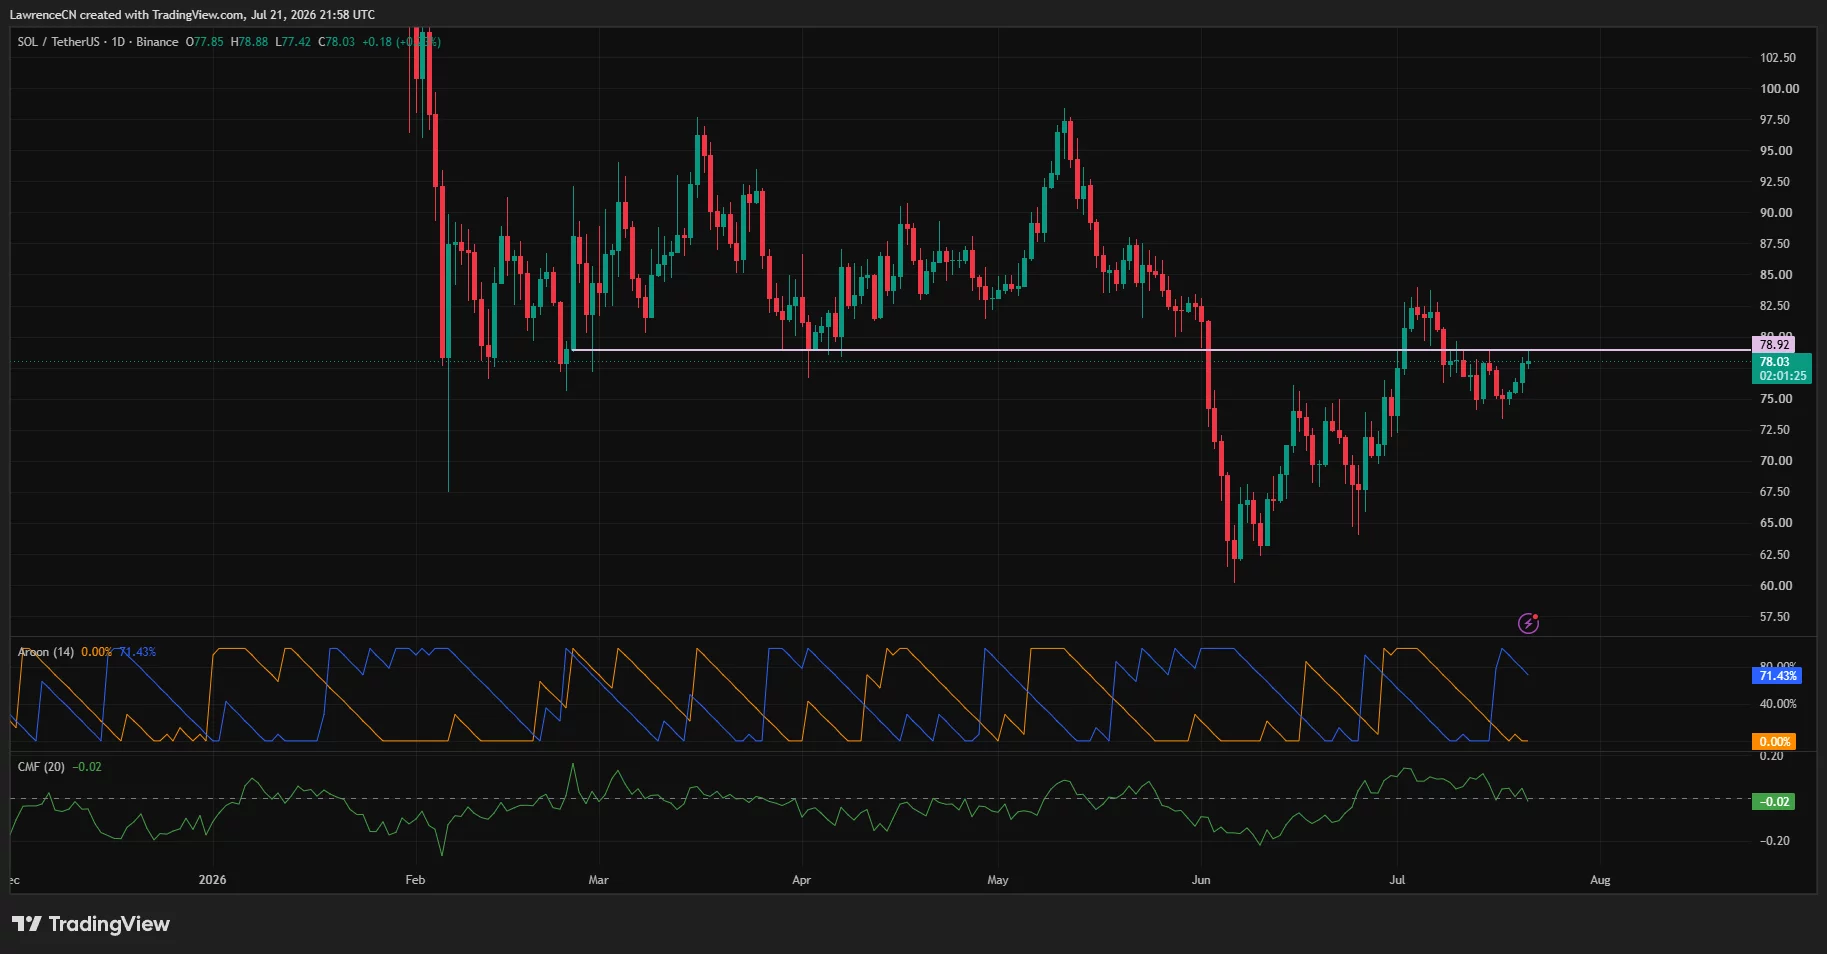
Solana price has climbed to $78 after buyers defended support near $74, though repeated failures below $80 and lingering concern over the BONK governance attack have kept market sentiment cautious.
Summary
- Solana price has recovered to $78 but must close above $80 to confirm a breakout.
- SOL trades above four key moving averages, while liquidity clusters could trigger a short squeeze.
- A loss of the $75.55 support would expose $72.50 and the June range floor near $67.
According to data from crypto.news, Solana (SOL) price traded at $78.03 at press time, up marginally over the past 24 hours after moving between an intraday low of $77.42 and a high of $78.88. The token has recovered about 5% from its July 18 low but remains below the $82–$84 zone reached earlier this month.
Confidence across the Solana ecosystem took a hit after an attacker drained nearly $20 million from the BonkDAO treasury. According to crypto.news, the attacker spent roughly $4.4 million to acquire enough BONK to meet the governance threshold, then passed a proposal with 99.9% approval.
The incident did not compromise Solana’s base layer, but it exposed weak safeguards within a major ecosystem project. BonkDAO had low voter participation, no execution delay, and enough concentrated voting power for one participant to control the result, according to crypto.news analysis.
Meanwhile, demand through regulated investment products has provided some support. U.S. spot Solana exchange-traded funds recorded $8.36 million in net inflows on July 6, their strongest day in nearly two months, according to data from SoSoValue. Early-July inflows reached about $5.75 million during one full trading week, with no daily outflow reported over the period.
Geopolitical pressure remains a hurdle for high-beta cryptocurrencies. Brent crude settled at $91.01 on July 21 after U.S.-Iran hostilities, and Houthi threats against Red Sea shipping routes raised concern over energy supplies. The dollar index also advanced to 101.16 as traders increased bets that higher oil costs could keep the Federal Reserve focused on inflation, Reuters reported.
A stronger dollar and renewed rate-hike expectations usually reduce demand for speculative assets. Solana may therefore need both crypto-market strength and less pressure from energy prices to sustain a move beyond nearby resistance.
Solana needs a daily close above $80 to unlock the next range
The daily chart places SOL directly below resistance at $78.92, a level that previously acted as support in February, April and early June. Buyers briefly reclaimed it during the first half of July, but price slipped back underneath after stalling near $83.
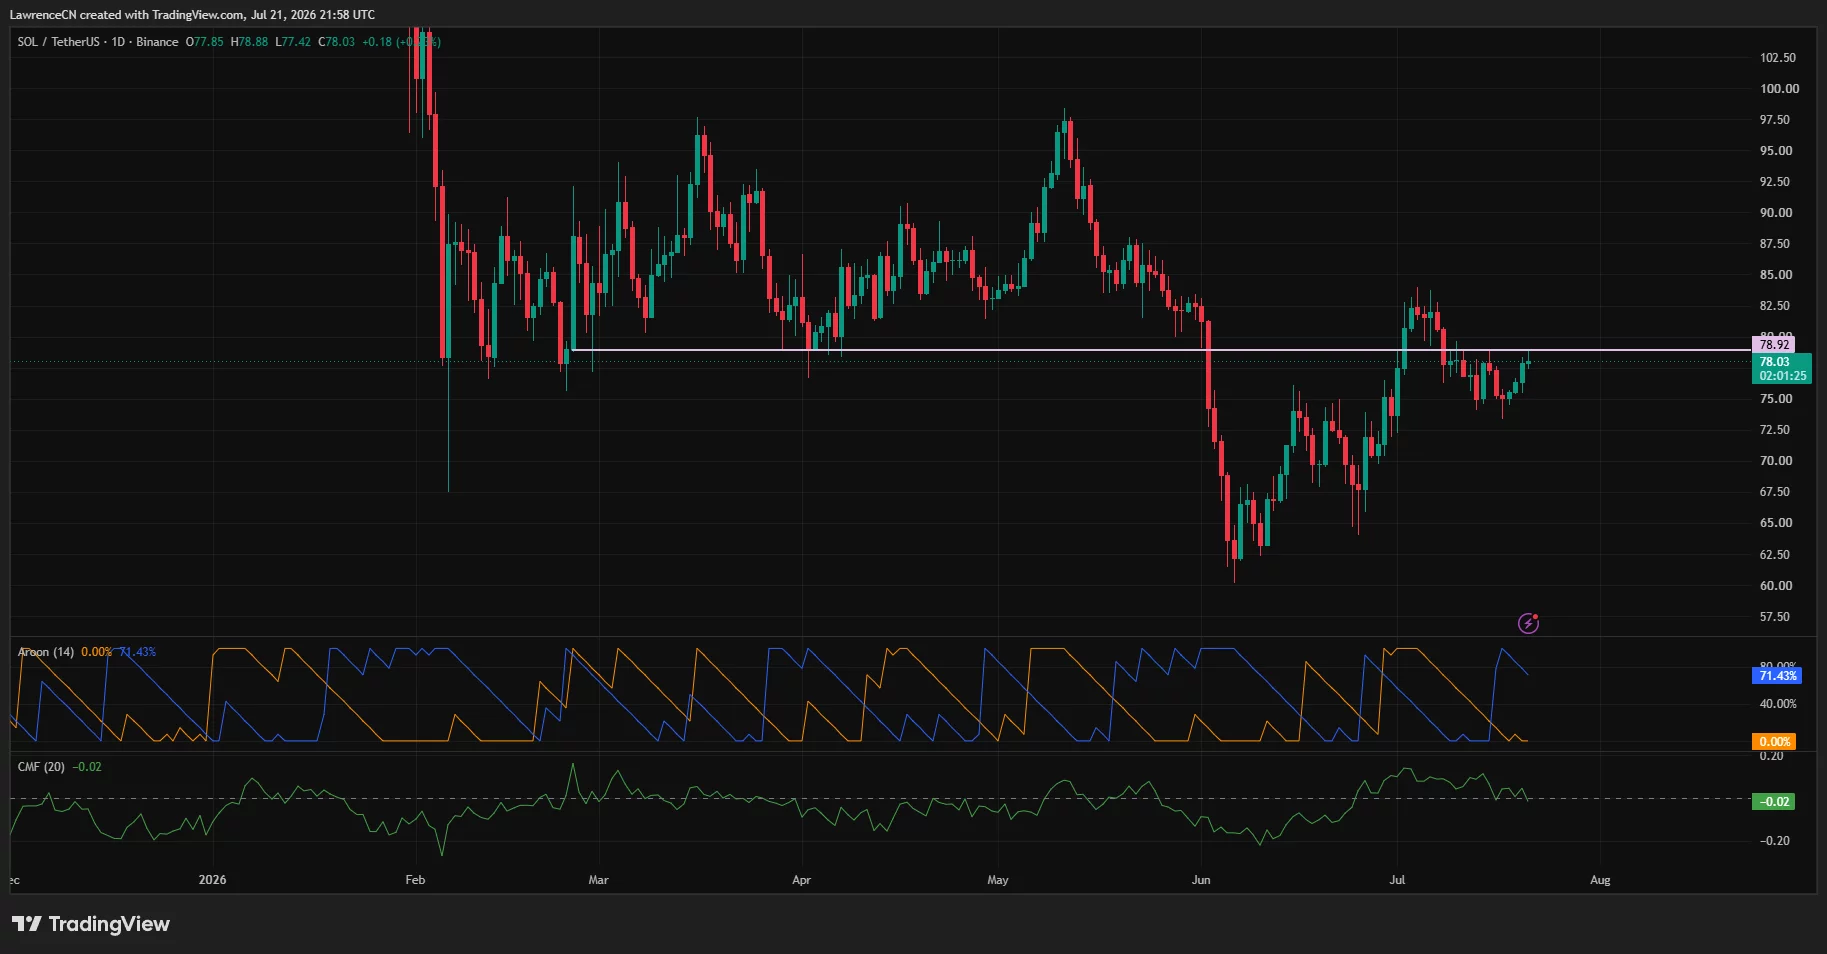
A daily close above $78.92 would clear the first barrier, while $80 remains the psychological level required to confirm a breakout. Beyond it, the July swing highs between $82.50 and $84 form the next supply zone. A close above $84 could open the route toward $90 and the previous range high near $97.60.
Daily momentum favors another test. The Aroon Up reading stands at 71.43%, while Aroon Down has fallen to zero, showing that recent highs carry more weight than recent lows. However, the Chaikin Money Flow remains slightly negative at -0.02, which shows that capital inflows have not yet matched the price recovery.
According to crypto trader Daan Crypto Trades, SOL has reached a “key high timeframe region” that will decide whether bulls can attack the upper end of the range.
“Either the bulls push through and set a higher low here to take a stab at the range high in the $90s. Or this rejects here and dribbles back down to that mid $60s area.”
The 4-hour chart offers a more constructive setup. SOL trades above its 20-period moving average at $77.01, its 50-period average at $76.42, its 100-period average at $77.60 and its 200-period average at $75.55. Regaining all four lines has placed short-term control with buyers.
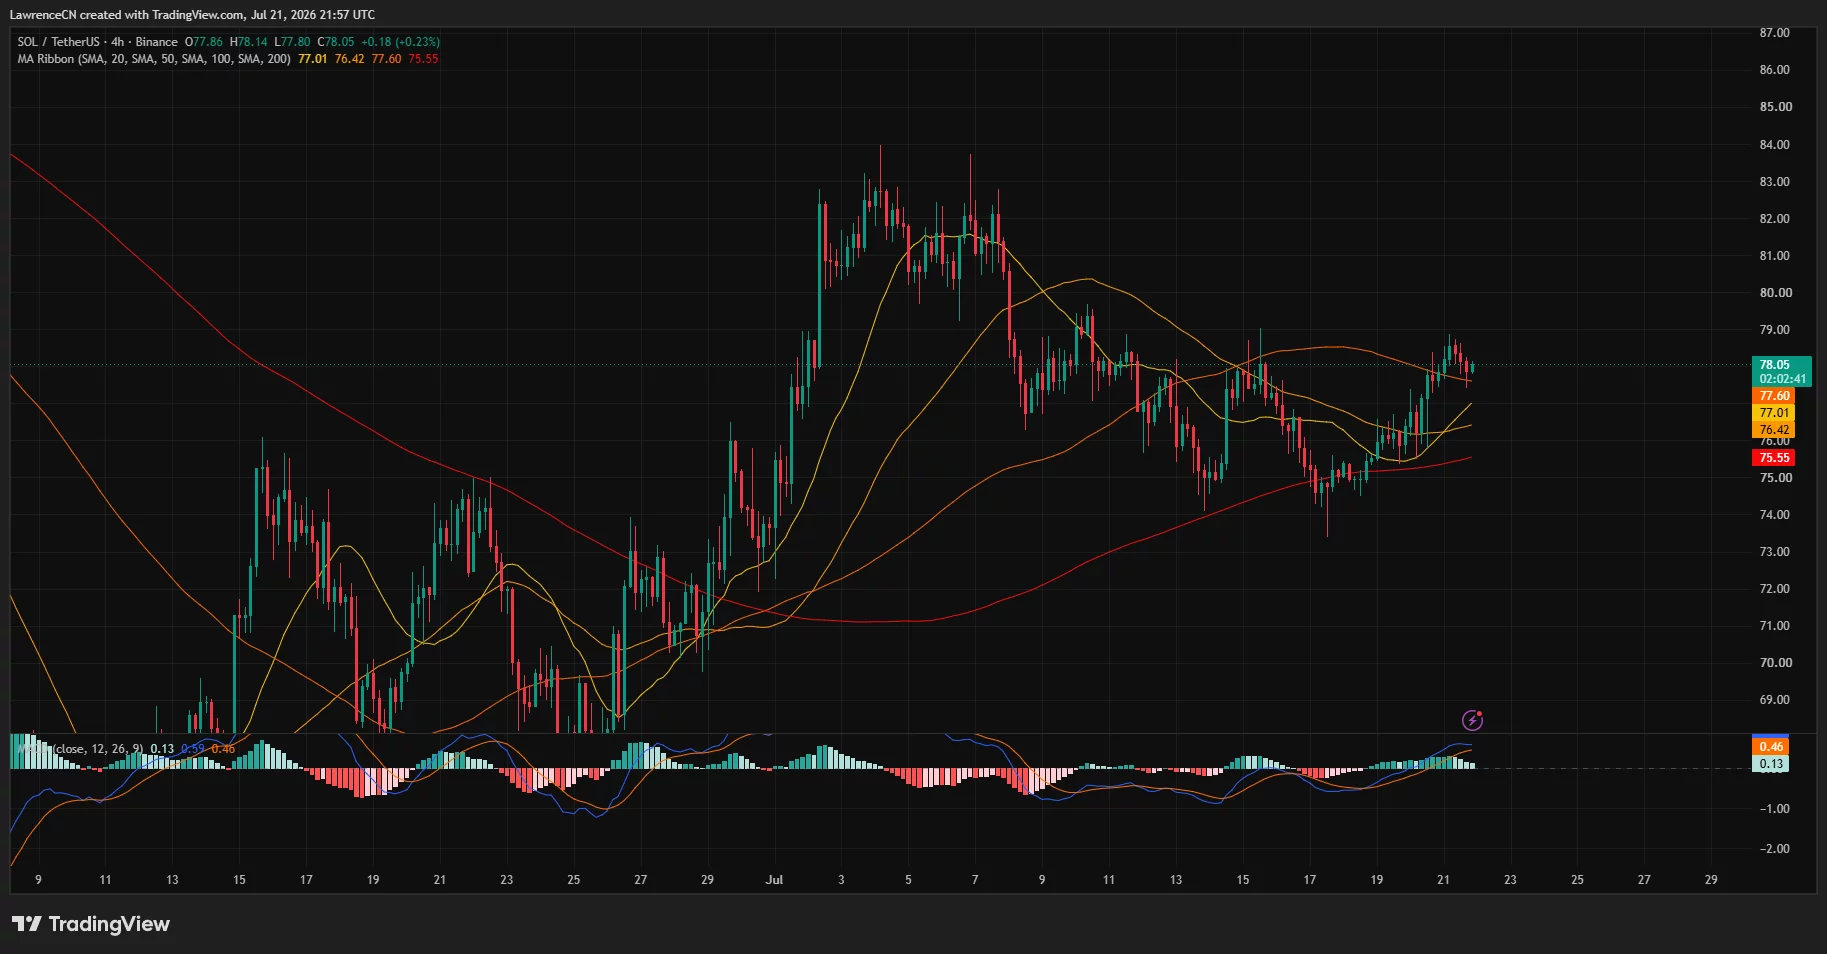
The 4-hour MACD remains above its signal line, although its histogram has narrowed to 0.13. Momentum has therefore stayed positive, but buyers need stronger follow-through before the move can extend through $80.
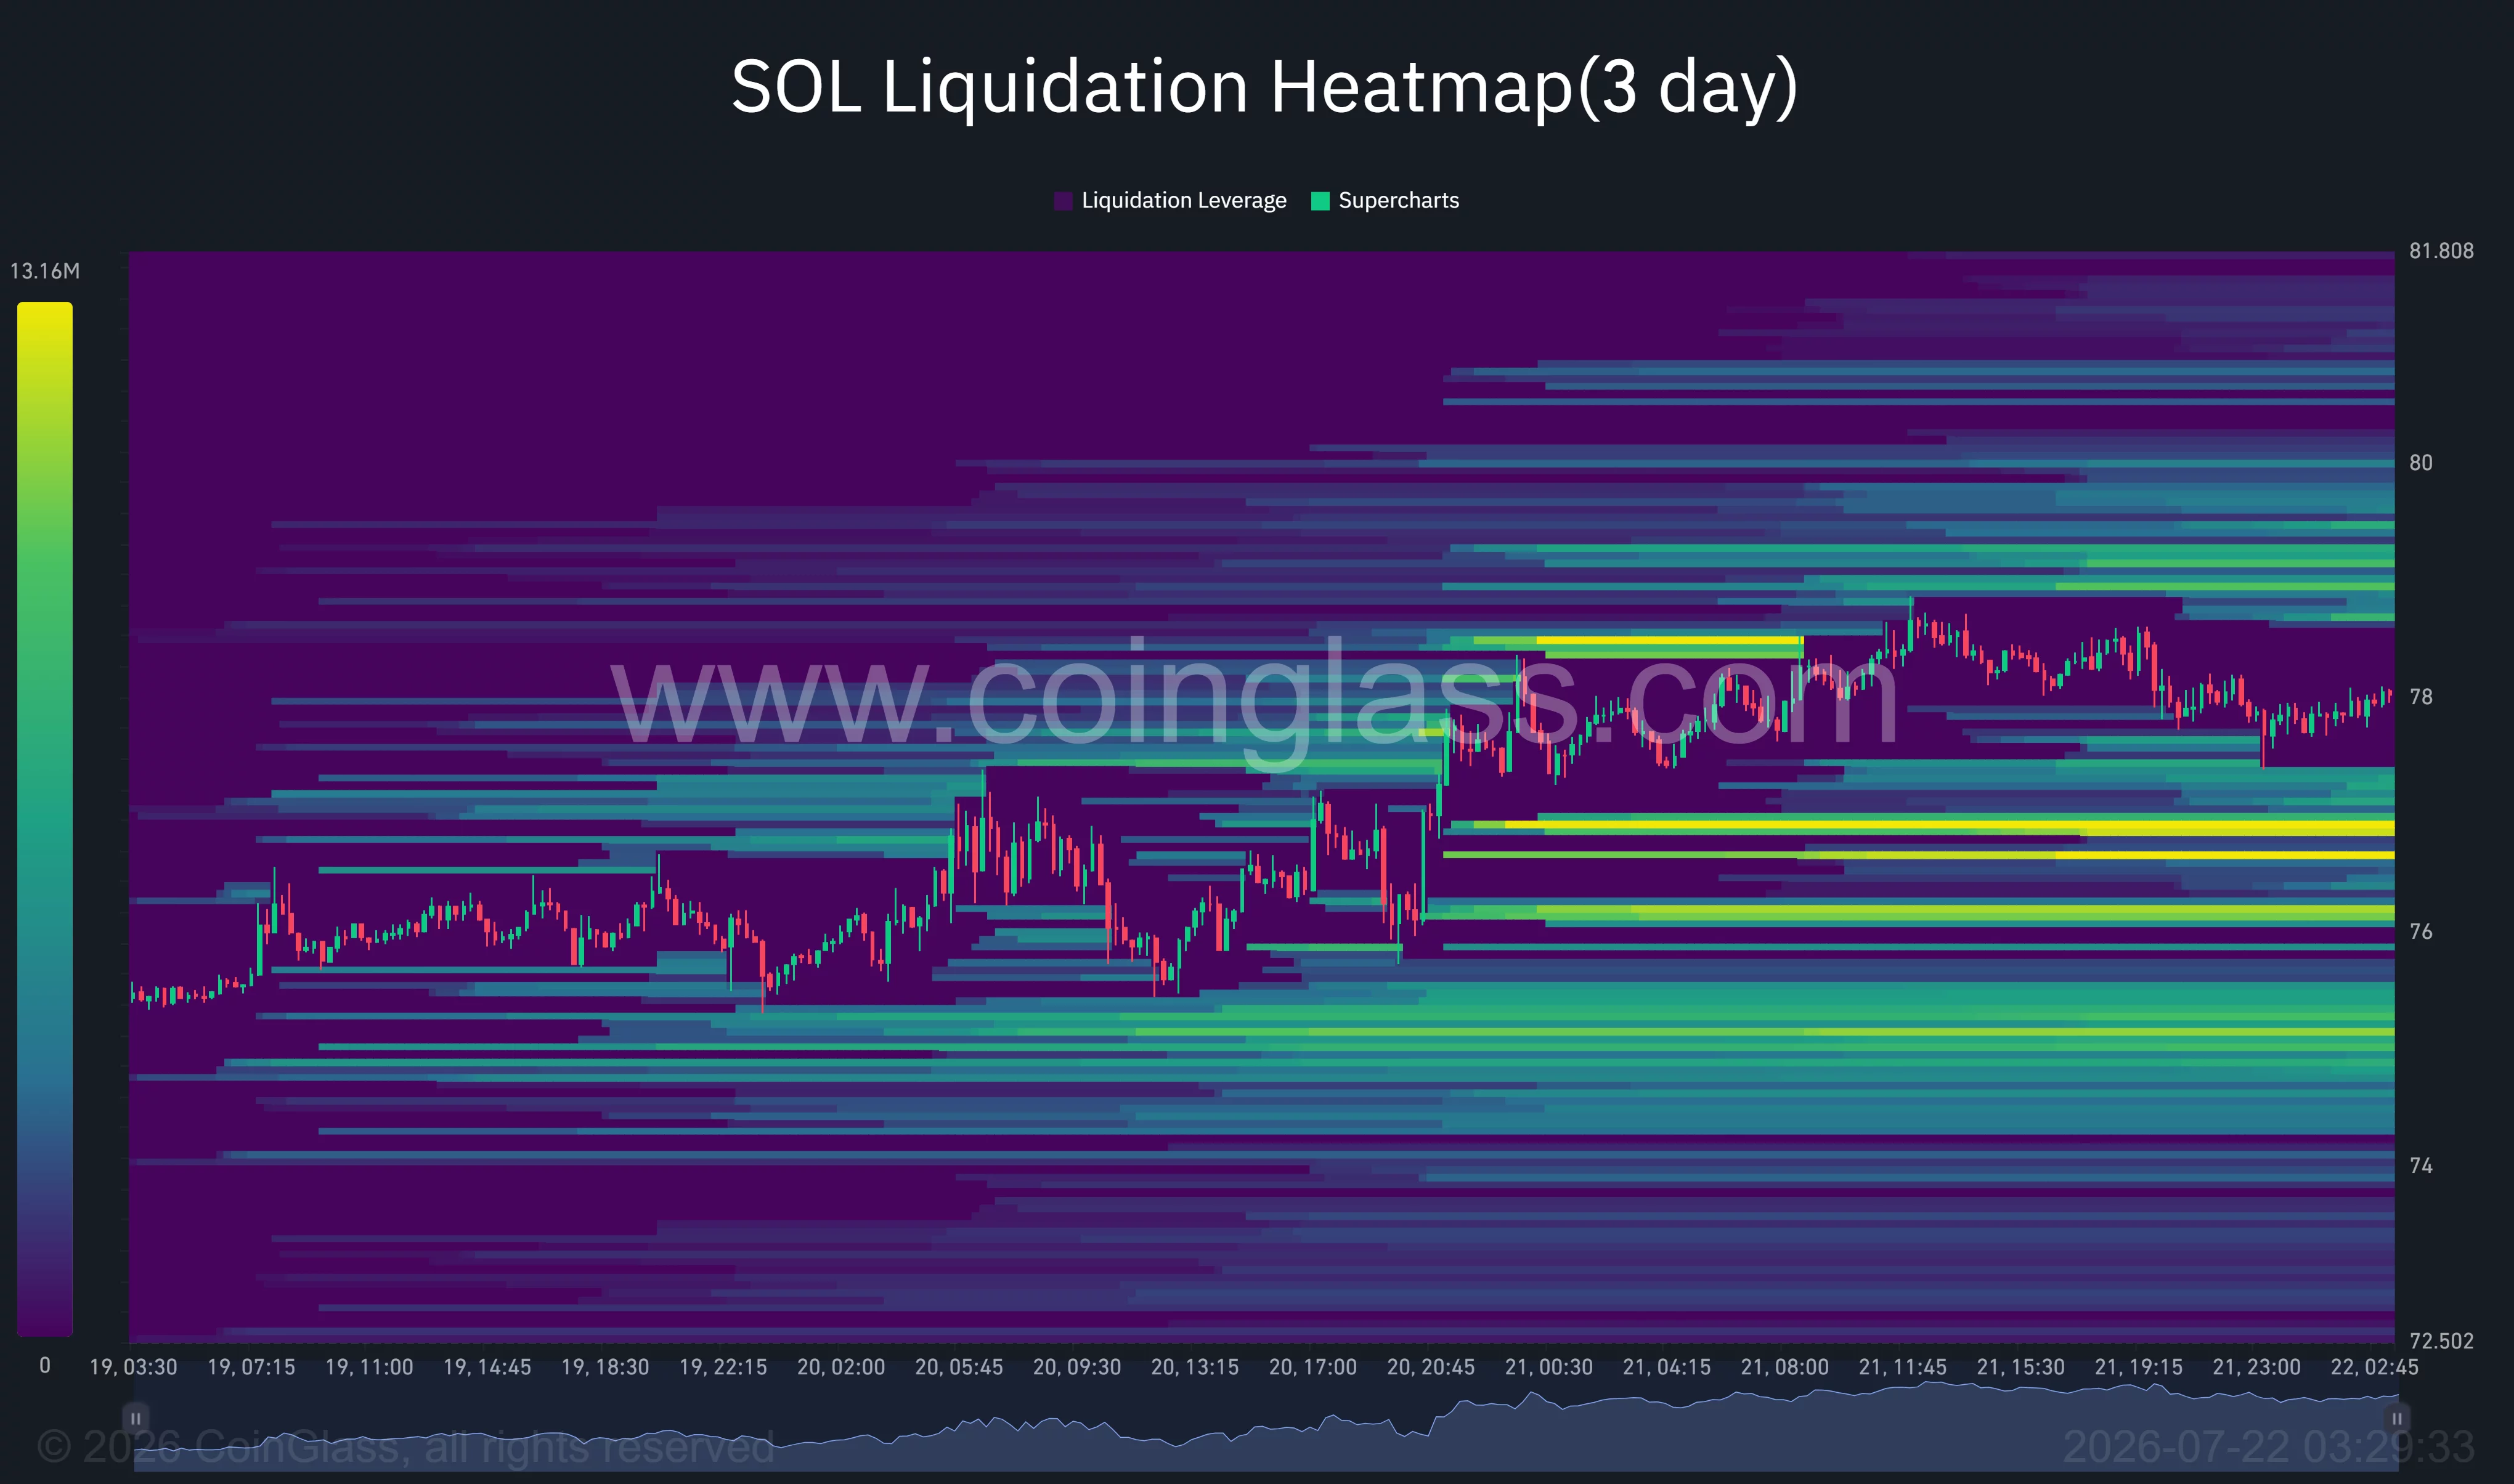
Derivatives liquidity could help accelerate a breakout. CoinGlass’ three-day liquidation heatmap shows concentrated short-liquidation bands near $78.50, $79.20 and $80.60. A move through $79 could force leveraged bears to close positions and add market buy orders, creating the conditions for a quick test of $81.
Loss of $75.50 would invalidate the bullish setup
Below the market, the largest nearby liquidation pools sit around $76.80, $76.10 and $75. A downturn through those levels could trigger long liquidations and pull SOL toward $74, where buyers stepped in during the latest retracement.
The 4-hour 200-period moving average at $75.55 serves as the main invalidation line. A sustained close below it would return SOL beneath its moving-average cluster and expose $72.50, followed by the June range floor near $67.
Oil above $90, further U.S.-Iran escalation, or another Solana ecosystem security incident could strengthen the bearish case. For now, the charts support another attempt at $80, but SOL must close above that level with stronger capital inflows to turn the recovery into a confirmed breakout.
Disclosure: This article does not represent investment advice. The content and materials featured on this page are for educational purposes only.


Movement Labs has filed for Chapter 11 bankruptcy with no more than $500,000 in assets and liabilities that could reach $10 million following more than a year of turmoil around the MOVE token.
Summary
- Movement Labs filed for Chapter 11 with up to $10 million in liabilities.
- Rushi Manche holds its largest unsecured claim, worth more than $1.6 million.
- Move Industries says its operations and Movement blockchain development remain unaffected.
Court records show that MVMT Labs submitted its petition on July 15 in the U.S. Bankruptcy Court for the District of Delaware. The original developer of the Movement blockchain listed between $100,001 and $500,000 in assets, up to $10 million in liabilities and as many as 299 creditors.
Former co-founder and chief executive Rushikesh “Rushi” Manche holds the largest unsecured claim at more than $1.6 million, according to the filing. The document also names the Delaware Division of Corporations, Move Industries, Anchorage Digital and security auditor OtterSec among the claimants, with the Delaware agency allegedly owed $459,000.
Despite being removed from the company in May 2025, Manche still owns a 34.25% equity stake in Movement Labs. He previously sued the company in the Delaware Court of Chancery and secured payment of legal expenses connected to a U.S. Department of Justice grand jury investigation into the MOVE launch.
Movement Labs originally served as the main research and development company for Movement Network, which launched as an Ethereum layer-2 using the Move programming language. Meta initially developed Move for its abandoned Libra and Diem digital currency projects.
Before the token controversy, Movement Labs had attracted substantial venture funding. The company raised $38 million in a Series A round led by Polychain Capital, while Reuters reported in January 2025 that it was close to completing another $100 million round at a proposed $3 billion valuation.
MOVE scandal left lasting damage
Movement Labs’ problems intensified after MOVE debuted on exchanges in December 2024. An investigation by CoinDesk found that a market-making agreement handed 66 million MOVE tokens, or about 5% of the supply, to a little-known intermediary called Rentech.
According to internal documents reviewed by CoinDesk, wallets linked to market maker Web3Port sold the tokens one day after MOVE’s exchange debut and generated about $38 million. The sale placed a large share of the publicly traded supply under one counterparty’s control and contributed to a steep fall in the token’s price.
Scrutiny also fell on the structure of the agreement because Rentech appeared in contracts both as a Movement Foundation agent and as a Web3Port affiliate, CoinDesk reported. Rentech denied misrepresenting itself, while Movement co-founder Cooper Scanlon told employees that the project was examining whether it had been misled.
Reviewing the documents, crypto founder Zaki Manian argued that the terms created incentives to raise MOVE’s valuation before selling tokens to retail traders.
“Even participating in a discussion where that’s on paper is insane,” Manian told CoinDesk.
Binance later banned the market-making account for what the exchange described as misconduct and froze the profits linked to the token sales. Movement Network Foundation subsequently announced a $38 million MOVE repurchase plan using the recovered funds and hired outside firm Groom Lake to investigate the agreement.
Leadership changes followed the inquiry. Movement Labs terminated Manche after alleging that he had signed undisclosed agreements, while the company transferred core development responsibilities to the newly formed Move Industries under chief executive Torab Torabi.
Trading disruptions compounded the damage. The Block reported that Binance and Coinbase suspended MOVE trading after the launch controversy, while TradingView data cited in the original report placed MOVE near $0.0108 following the bankruptcy news, with the token gaining less than 1%.
Move Industries remains outside the filing
Move Industries has denied any involvement in the Chapter 11 case and continues to operate the blockchain separately from Movement Labs. Addressing the filing on X, Torabi stressed that the two companies are distinct legal entities.
“Move Industries is operating normally. We continue to put our heads down and build.”
Movement Network Foundation confirmed in December 2025 that Move Industries had become the network’s primary service provider and assumed its main operating duties. Under that arrangement, the foundation remains the independent network steward, while Move Industries handles development, operations and ecosystem work.
Following the corporate separation, Move Industries converted Movement from an Ethereum layer-2 into an independent layer-1 network. The company has since positioned the chain as infrastructure for stablecoin payments, cross-border transfers and remittances in emerging markets.
Movement Labs is the second prominent crypto company to seek U.S. bankruptcy protection in recent months. In May, Nasdaq-listed Bitcoin Depot entered Chapter 11 in the Southern District of Texas to close its crypto ATM business and sell its assets under court supervision.
Unlike Movement Labs, Bitcoin Depot blamed tighter state rules, lower transaction limits, litigation and enforcement pressure for making its model unsustainable. The company took more than 9,000 kiosks offline and included its Canadian entities in the court-supervised process, according to its May 18 announcement.
August 7 — the fast-approaching final day before the Senate’s summer recess — is seen as a major deadline for finishing the Clarity Act this year. Crypto insiders are expecting the bill to get to the floor as soon as the beginning of next week, which would fit with what Senate Majority Leader John Thune had previously indicated. The legislation could require several days to get to a final vote.
Earlier on Tuesday, CoinDesk had reported that a White House official said Trump agreed to “the most comprehensive and wide-ranging ethics provision in history,” though the actual language he’s accepted hadn’t yet been shared with Democrats. As of press time, it was still unclear if Democrats had seen the exact language. Still, the administration argued that it had “bent over backward” to satisfy Democrats, suggesting it would be their fault if the legislation doesn’t advance.
Trump’s agreement to a crypto constraint of his own business ties raises significant questions about how his involvement would be made sufficiently remote to comply with the limit. The president and his family are deeply connected to several crypto business initiatives, including their ownership stake in World Liberty Financial. While Trump has insisted he’s not conflicted as his administration imposes crypto policies that affect his own businesses, Democratic lawmakers have openly accused him of corruption.

Aztec Launches Alpha V5 on Mainnet With Faster Private Proving

Training gear, opening ceremony kits missing: Indian boxers hit by luggage chaos ahead of CWG 2026 | Commonwealth Games News

NYT Strands hints and answers for Wednesday, July 22 (game #871)


-
 NewsBeat5 days ago
London Mayor Sadiq Khan handed a peerage by Keir Starmer alongside 15 other Labour figures… just days before the PM leaves No10
-

 Fashion4 days ago
Weekend Open Thread – Corporette.com
-

 Politics4 days ago
The House | The City of London can help the new chancellor deliver growth in every postcode
-

 Politics6 days ago
Young campaigners urge incoming PM to act on outdoor junk food ads
-
 Crypto World5 days ago
Two July Windows Left: The CLARITY Act’s Senate Fight and What Failure Means
-

 Crypto World6 days ago
CFTC blocks Kalshi from unwinding Michigan trades after court order
-
 Crypto World4 days ago
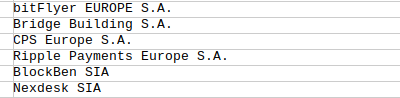
Ripple Payments Joins MiCA With 14 Firms, Does It Mean Anything For XRP?
-

 Business6 days ago
Nvidia Stock Slips After Big Tuesday Rally as Huang Confirms Vera Rubin Chip Is Now in Production Today
-

 Politics2 days ago
Democrats look to World Cup watch parties to register thousands of voters
-
 Entertainment6 days ago
Disney’s Most Ambitious Failed Star Wars Attraction Is Coming to SDCC
-

 Crypto World4 days ago
Ripple wins EU-wide access as ESMA adds it to MiCA register
-

 Crypto World15 hours ago
Grayscale Files For Worldcoin ETF, WLD Registers Sharp Rise
-

 Crypto World5 days ago
Injective Submits SEC Transfer-Agent Registration to Onchain Ownership Records
-

 Business6 days ago
Palantir Shares Rise After Expanded Nvidia Partnership and Fresh Analyst Upgrades Ahead of Earnings Day
-
 Tech23 hours ago
Sail Virtually Aboard The “Itanic” With IA-64 Emulator
-
Tech20 hours ago
Turtle Beach Command Series KB7 review: a nifty screen-equipped gaming keyboard
-

 NewsBeat4 days ago
Registration is now open for March for Men with Kev 2026
-

 NewsBeat2 days ago
Unregistered fitter used Gas Safe logo on business flyers
-
 Sports6 days ago
New Cornerback Enters Vikings Trade Rumor Mill
-

 News Videos5 days ago
Money | Class 12 Economics | CBSE Board Exam 2026-27
You must be logged in to post a comment Login