Crypto World
Why IBM Shares Plunged by More Than 13%

Yesterday, shares in IBM Corporation opened above $254 but closed below $224. By some estimates, this marked the company’s largest single-day decline in the past 25 years. Since the start of February, the stock has fallen by roughly 27%, its worst monthly performance since 1968.
Why Did IBM’s Share Price Drop?
The main trigger was an announcement by Anthropic about the launch of a new AI tool, Claude Code, designed to modernise legacy COBOL code.
This is particularly significant for IBM, as much of “Big Blue’s” business is tied to mainframes processing transactions for banks and government institutions in COBOL. Traditionally, upgrading such systems required “armies of consultants” and multi-billion-dollar budgets.
The new AI solution promises to automate this process, making it faster and more cost-effective. This not only poses a direct threat to IBM’s services and support revenues, but also reignites concerns that AI could reshape the entire technology sector, rendering established business models less sustainable.

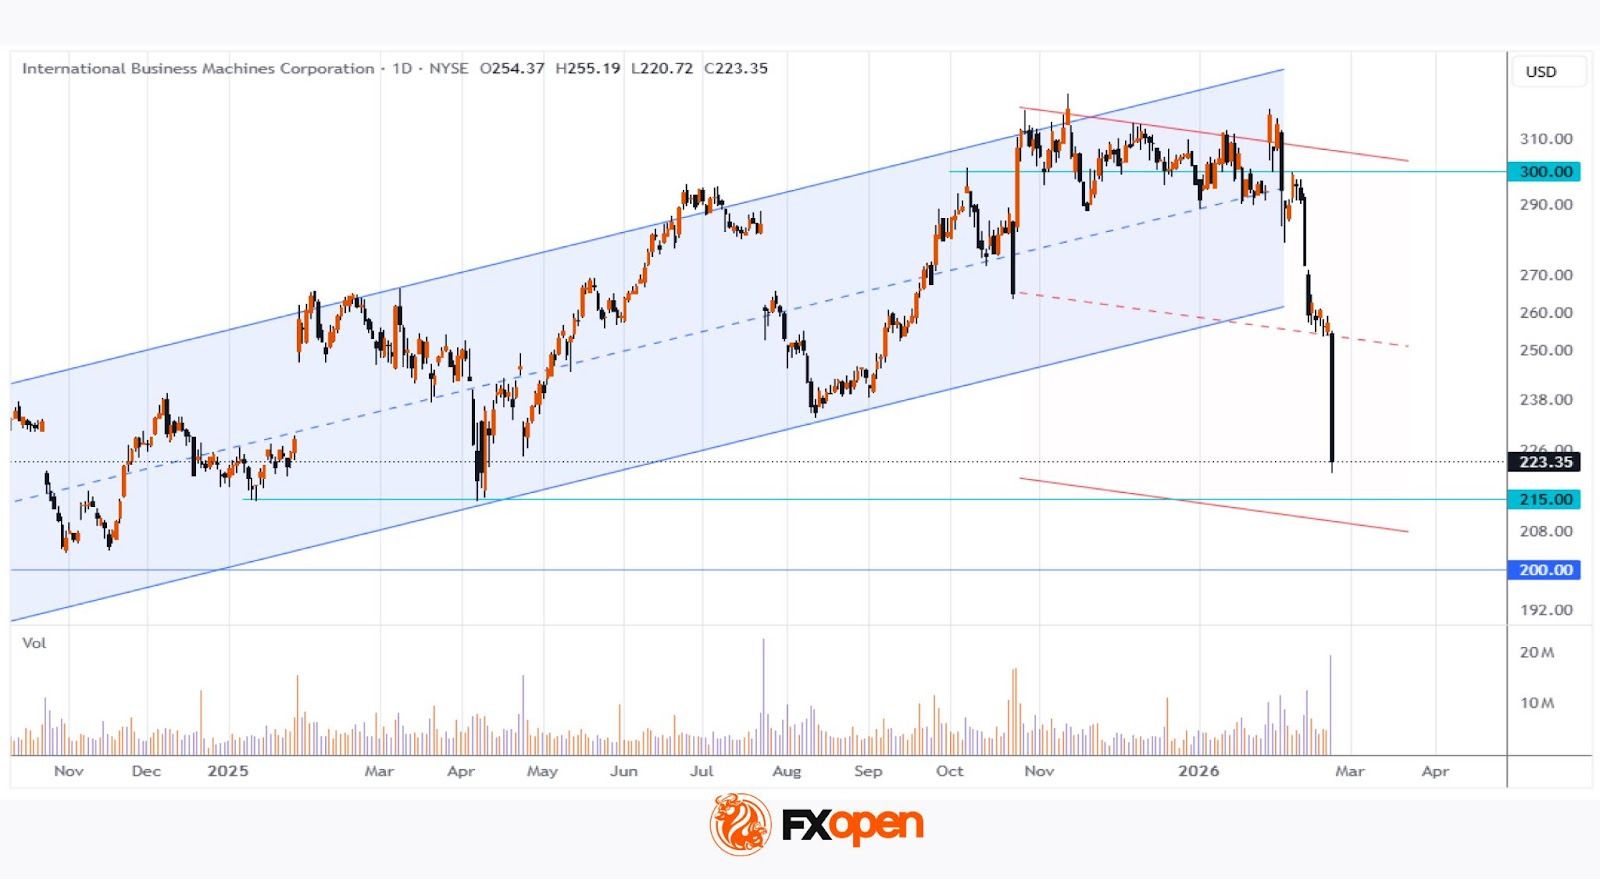
Technical Analysis of IBM Shares
Throughout 2025, IBM stock traded within an ascending channel, but the psychological $300 level proved to be strong resistance. The price attempted to secure a foothold above it for several months, without success. The earnings release on 28 January turned into a bull trap and marked the beginning of an extraordinary sell-off, accompanied by rising volume on bearish candles — a sign of market weakness.
At the same time, several major analysts (including those at Goldman Sachs and Jefferies) have maintained or reiterated their “Buy” ratings. Their optimism is based on the view that panic surrounding Anthropic’s tool may be overstated, while IBM’s financial fundamentals remain solid.
Although the sharp downward momentum may continue in the near term, a support zone could emerge where several technical levels converge:
→ the psychological $200 mark;
→ the 2025 low around $215;
→ the lower boundary of an increasingly clear channel (shown in red).
Buy and sell stocks of the world’s biggest publicly-listed companies with CFDs on FXOpen’s trading platform. Open your FXOpen account now or learn more about trading share CFDs with FXOpen.
This article represents the opinion of the Companies operating under the FXOpen brand only. It is not to be construed as an offer, solicitation, or recommendation with respect to products and services provided by the Companies operating under the FXOpen brand, nor is it to be considered financial advice.