
Crypto World
Why Japan’s Election Is a Short-Term Drag but Long-Term Win for Bitcoin


Japan’s landslide election boosted equities but added near-term pressure to Bitcoin as capital rotated and liquidity tightened.
Japan’s ruling bloc secured a two-thirds majority in the Lower House on February 8, handing Prime Minister Sanae Takaichi a decisive victory that has already reshaped global market positioning.
The result has lifted Japanese equities while adding short-term pressure to Bitcoin (BTC), even as longer-term policy shifts in Tokyo may support institutional crypto adoption.
Takaichi’s Victory Reshapes Capital Flows
Market reaction to the election was swift, with Japanese stocks pushed to fresh record highs in the hours after the result, and the Nikkei extending gains as traders priced in aggressive fiscal stimulus and a more tolerant stance toward yen weakness.
Market watcher Ash Crypto wrote on X that Japan’s stock market had hit a new all-time high following Takaichi’s victory, reflecting optimism around domestic reflation.
Research firms and analysts were more cautious about global spillovers. XWIN Research described the outcome as bearish for Bitcoin in the near term, pointing to tighter global liquidity and shifting capital flows.
Meanwhile, GugaOnChain noted that the so-called “Takaichi Trade” is not a simple exit from U.S. assets but a portfolio rebalance. Japanese Government Bonds, sidelined for years by ultra-low yields, are attracting incremental capital as fiscal expansion raises reflation expectations.
That rotation has coincided with a pullback in U.S. equities. Over the past seven days, the Nasdaq Composite fell about 5.6%, the S&P 500 slipped by about 2.7%, and the Russell 2000 dropped close to 2.6%.
You may also like:
A stronger dollar, driven by yen weakness and persistent rate gaps between the U.S. and Japan, has tightened financial conditions further. In these risk-off phases, Bitcoin has tended to move alongside U.S. equities, allowing equity-led de-risking to spill into crypto markets.
“The Takaichi Trade strengthens Japan but puts pressure on the U.S. and Bitcoin,” wrote GugaOnChain. “The capital flight to JGBs and a robust dollar create an environment of inevitable adjustments, requiring investors to closely monitor the correlation between U.S. indexes and crypto assets.”
Weak Sentiment Now, Policy Tailwinds Later
At the time of writing, BTC was trading just below $71,000, up about 2% on the day but down more than 6% over the past week and nearly 22% in the last month.
Adding to the feeling of fragility in the market, the Bitcoin Fear and Greed Index fell to a 6-year low on February 7 after BTC slid from above $90,000 in late January to near $60,000 before rebounding.
CryptoQuant’s latest report shows Bitcoin trading below its 365-day moving average, with spot and institutional demand weak and liquidity tightening, all common features of a bear phase.
Still, Japan’s political backdrop looks different beyond the immediate risk-off trade. With a two-thirds majority, Takaichi’s administration has room to pursue legislative changes, and officials have previously framed Web3 as an industrial policy focus. As such, analysts expect discussions around crypto tax reform and stablecoin rules to resume.
As XWIN concluded,
“Near-term pressure on U.S. equities and Bitcoin is macro-driven, while Japan’s institutional reforms may support crypto markets longer term.”
SECRET PARTNERSHIP BONUS for CryptoPotato readers: Use this link to register and unlock $1,500 in exclusive BingX Exchange rewards (limited time offer).

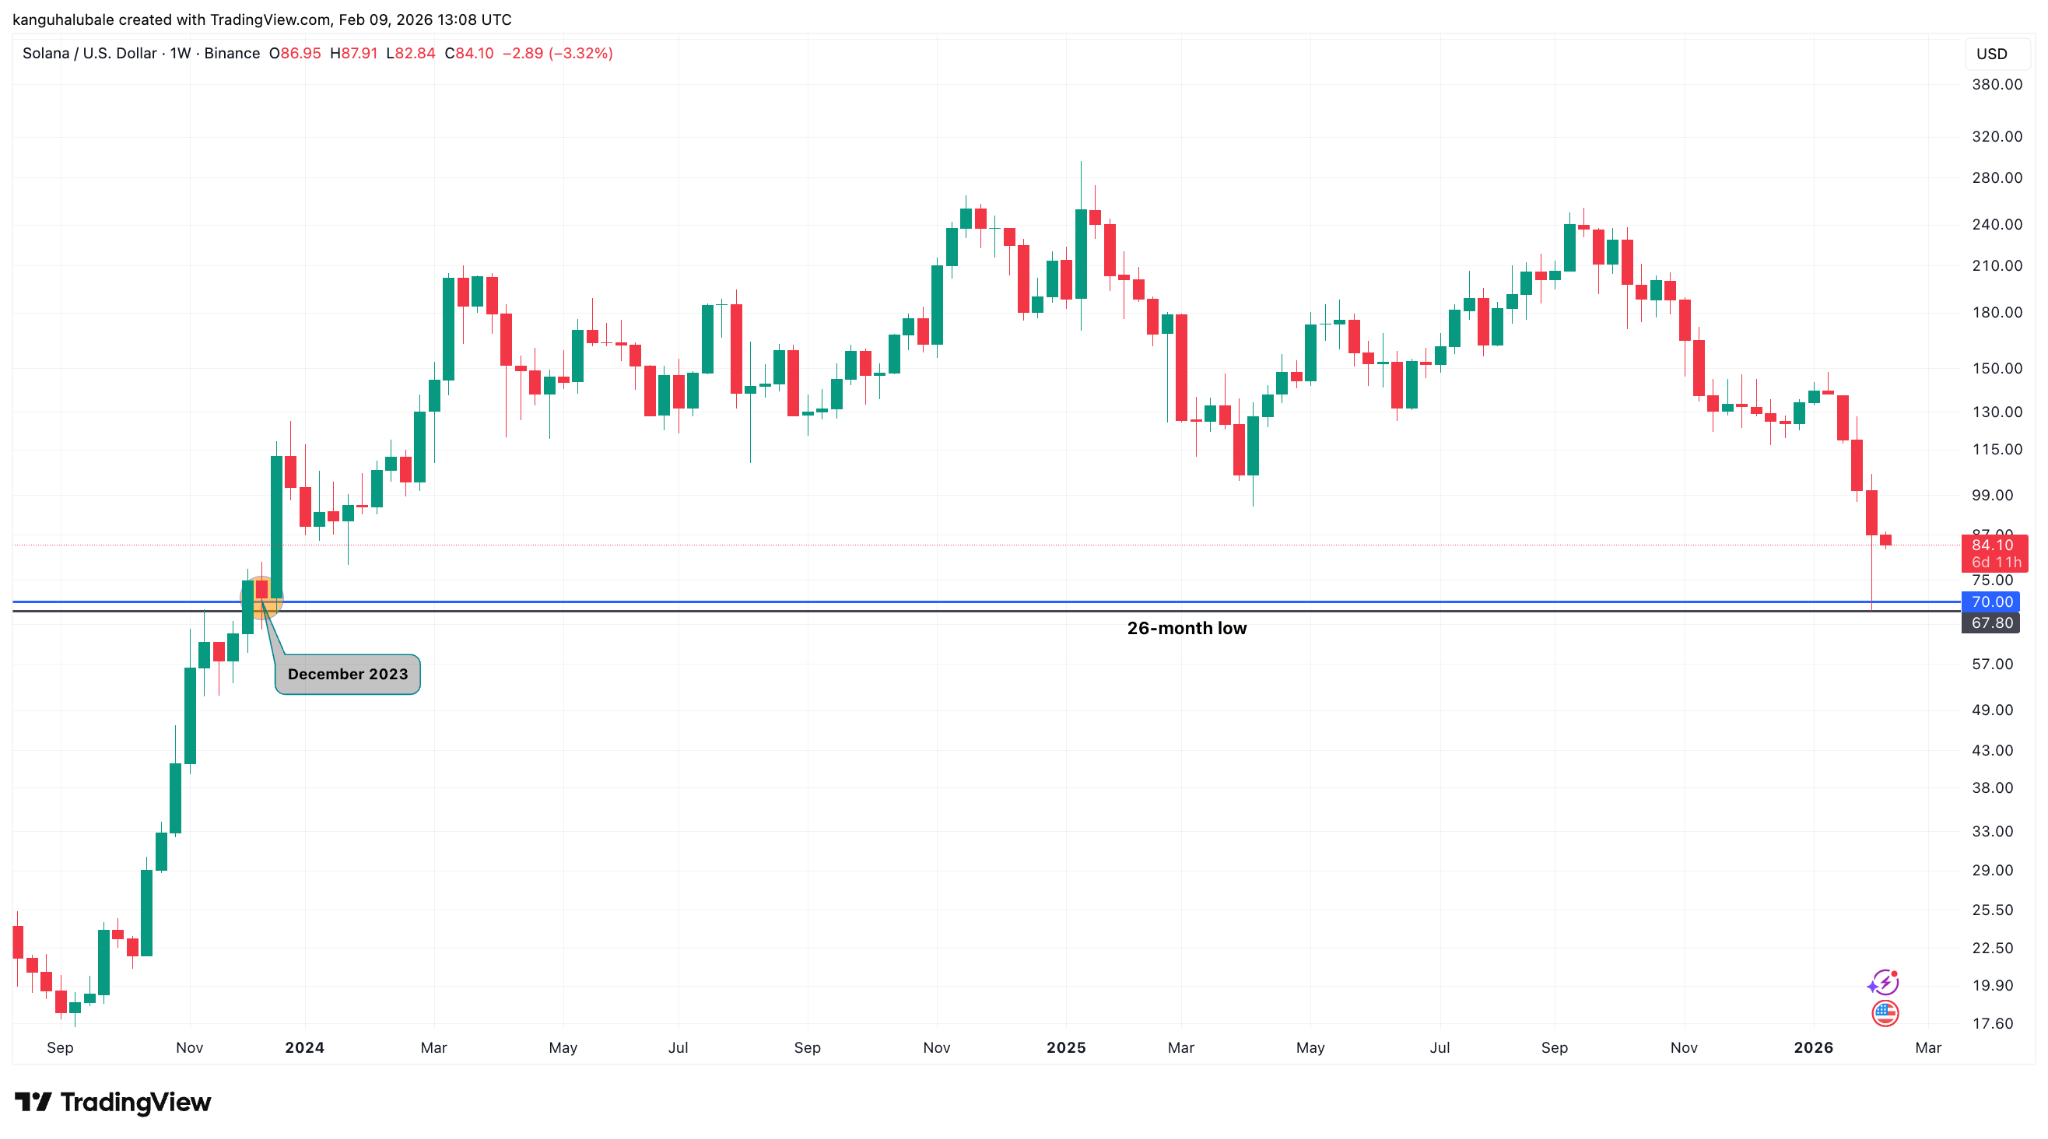
Solana’s SOL (SOL) has dropped 38% over the last 30 days, falling to a two-year low of $67 on Friday. Multiple analysts believe that the downside is not over for the seventh-placed cryptocurrency, with downward targets extending as low as $30.
Key takeaways:
-
Solana’s head-and-shoulders pattern targets a SOL price of $50 or lower.
-
MVRV bands point to a potential bottom, but support at $75 must hold.

Solana targets $42 after bearish confirmation
SOL price has already lost over 72% of its value since a cycle top of around $295 in January 2025. In doing so, its price confirmed a head-and-shoulders (H&S) pattern on multiple time frames.
Related: Pump.fun moves deeper into trading infrastructure with Vyper acquisition
Crypto analyst Bitcoinsensus shared a chart showing SOL validating a H&S pattern, hinting at more downside ahead.
“Solana has confirmed a breakdown from this macro Head & Shoulders pattern,” Bitcoinsensus said in a Monday post on X, adding:
“The target could be as low as $50 per $SOL.”

“This is a classic head and shoulders pattern with a measured move to $45,” analyst Nextiscrypto said about SOL’s two-week chart. But other analysts said the price can go even lower.
Pseudonymous analyst “Shitpoastin” said Solana’s price has also formed a “massive head and shoulders” pattern on the monthly chart over two years, “with nothing but air until $30.”

The two-day candle chart, meanwhile, shows that SOL price had broken below the H&S neckline at $120 on Jan. 30.

The measured target of the H&S pattern, calculated by adding the head’s height from the breakdown point, is $57, representing a 32% drop from the current level.
Solana’s MVRV bands give hope for a bottom at $75
SOL’s price crash last week was stopped by support from the lowest boundary of its MVRV extreme deviation pricing bands, currently at $75.
These bands show when SOL is below or above the average price at which traders last moved their coins.

Historically, SOL prices drop to near or even below the lowest MVRV band before a bottom is reached.
That includes the March 2022 bounce, when the SOL price rose 87% within three weeks to $140 after testing the lowest MVRV deviation band around $75. A similar rebound occurred earlier in December 2020.
Solana’s association with the FTX crash in November 2022, however, saw a significant deviation below this band, with the price dropping another 70% and bottoming around $7 in December that year.
Therefore, SOL’s drop below $75 spark the next phase of the correction as seen in 2022, likely aligning with the H&S target.
This article does not contain investment advice or recommendations. Every investment and trading move involves risk, and readers should conduct their own research when making a decision. While we strive to provide accurate and timely information, Cointelegraph does not guarantee the accuracy, completeness, or reliability of any information in this article. This article may contain forward-looking statements that are subject to risks and uncertainties. Cointelegraph will not be liable for any loss or damage arising from your reliance on this information.


Michael Saylor continued his dollar-cost averaging last week, even as Bitcoin tumbled to its lowest level since 2024 and losses soared.
Summary
- Strategy continued its Bitcoin accumulation as its unrealized losses rose.
- The company bought 1,142 coins last week, bringing its total holdings to 714,644.
- Wall Street analysts are highly bullish on the MSTR stock.
Strategy continues Bitcoin accumulation
In a statement, Saylor said that his company bought 1,142 Bitcoin (BTC) at the average price of $78,815. This purchase brought its total Bitcoin holdings to 714,644 valued at over $49 billion.
Data compiled by Bitcoin Treasuries shows that its average cost per Bitcoin stood at over $76,052. With the Bitcoin price trading at $69,000, it has suffered a nearly 10% loss. More data shows that it has suffered a $5 billion in unrealized losses.
In a report last week, the company said that its operating loss rose to over $17.4 billion as the Bitcoin price plunged. Its net loss soared to $12.4 billion, a trend that may persist if BTC remains in a downtrend.
Worse, Strategy continues to dilute its shareholders by using its common stock to buy Bitcoin. Data show it has more than $7.9 billion in authorized shares to buy.
It also has over $20 billion in available STRK preferred shares. As a result, the total outstanding shares jumped to over 300 million, up from 77 million in 2021.
Wall Street analysts are optimistic of MSTR stock
Still, Wall Street analysts are starting to turn bullish on the Strategy stock, citing the potential BTC rebound. Cantor Fitzgerald analyst maintained an overweight rating with a target of $192.
BTIG analysts have a target of $250, while Canaccord Genuity, Mizuho, and Truist Financial see it soaring to $185, $403, and $268. Data compiled by MarketBeat shows that the consensus target among Wall Street analysts is $347, up by 176% from the current level.
MSTR’s stock recovery will depend on Bitcoin’s rebound. A strong Bitcoin rally will lead to a higher stock price, as it happened on Friday. Strategy jumped by nearly 30% as Bitcoin moved from $60,000 to over $70,000.

Solana’s SOL (SOL) (CRYPTO: SOL) has fallen 38% in the past month, dropping to a two-year low near $67 on Friday as bearish momentum intensifies for the seventh-largest crypto by market value. Since peaking near $295 in January 2025, SOL has steadily trended lower, trimming gains from a storied run and triggering a wave of technical analyses that warn of further downside. The decline comes amid a broader risk-off backdrop for crypto assets, prompting traders to scrutinize chart patterns, on-chain signals, and potential support zones as the market contends with macro uncertainty and shifting liquidity dynamics.
Key takeaways
- Solana’s head-and-shoulders pattern points to a price target around $50 or lower, with some estimates even suggesting mid-$40s depending on the measured move.
- The breakdown appears to be anchored by a neckline around $120 on a Jan. 30 breakout in the two-day timeframe, implying a further drop toward a $57 target — roughly a 32% decline from current levels.
- Solana’s on-chain metrics, notably the MVRV extreme deviation bands, currently sit near $75, a level historically associated with potential bottoming before a rebound.
- Analysts are split: some see a path to as low as $30 on longer horizons, while others anticipate a near-term floor around the $75 area before any significant recovery.
- The backdrop includes a prior cycle high around $295 in January 2025, underscoring the magnitude of the pullback and the risk-off sentiment affecting Solana and similar networks.
Tickers mentioned: $SOL
Sentiment: Bearish
Price impact: Negative. SOL has slumped about 38% in 30 days, hitting a two-year low near $67 and signaling sustained selling pressure.
Market context: The move sits within a broader risk-off environment for crypto markets, with technical breakdowns and pattern-driven targets shaping expectations as liquidity conditions remain uncertain and traders reassess the near-term demand for smart-contract platforms like Solana.
Why it matters
The Solana narrative has long hinged on both on-chain activity and the durability of its ecosystem amid macro fluctuations. As SOL slides from multi-hundred-dollar highs to the current vicinity, market participants are watching whether the token can sustain activity and funding flows that underpin network usage. The emergence of a prominent head-and-shoulders pattern across multiple timeframes increases the probability that downside momentum persists, particularly if the price breaks key support levels and fails to reclaim near-term momentum.
On-chain and market data add nuance to the story. The MVRV bands — a measure of how far the current price deviates from where holders last moved their coins — currently point to a potential bottom around the $75 area. Historically, SOL has dipped toward and even below the lower bands before turning, as observed in prior cycles around March 2022 and December 2020. However, the 2022 FTX episode demonstrated that sentiment and price can diverge sharply, with the price briefly tumbling well below typical bottom bands before a prolonged recovery path materialized. This history suggests that the next move could hinge on how liquidity and risk appetite evolve in the weeks ahead.
For SOL, the chart patterns suggest a didactic lesson in risk management: even as a long-term narrative remains intact for some developers, the near-term price action could remain fragile until a credible reversal signal appears. The price action, combined with on-chain signals, reinforces the potential for a multi-week or multi-month consolidation phase, during which price discovery may be tempered by macro volatility and evolving investor sentiment toward Layer-1 ecosystems.
What to watch next
- Watch for interactions with the $75 MVRV-band level, which historically has served as a reference point for potential reversals in SOL’s price.
- Monitor the H&S-based targets around $57 and the possibility of further downside toward the $50–$45 range if the pattern remains intact and selling pressure persists.
- Observe whether SOL can establish a footing above the $120 neckline on a sustained basis, or whether the price continues toward the next support levels identified by market analysts.
- Stay attentive to evolving risk sentiment in crypto markets and any regulatory or macro developments that could influence flows to and from Solana’s ecosystem.
Sources & verification
- Solana price action and the current price trajectory, including the 38% drop over 30 days and a low near $67 (Friday) as reported in technical summaries.
- Bitcoinsensus’ X post noting a potential downside target as low as $50 per SOL.
- Nextiscrypto’s two-week chart assessment calling for a possible move toward $45.
- Shitpoastin’s analysis of a long-term monthly head-and-shoulders pattern suggesting a target near $30.
- Glassnode data on Solana’s MVRV extreme deviation bands, currently around $75, used to frame potential bottoming activity.
Solana targets $42 after bearish confirmation
Meme coins are once again drawing trader attention as speculative capital rotates back into high-volatility setups. After weeks of choppy conditions, several meme-driven assets are beginning to show technical signs of stabilization and early reversals.
BeInCrypto has analysed three such meme coins that investors should watch in February week 2.
Sponsored
Sponsored
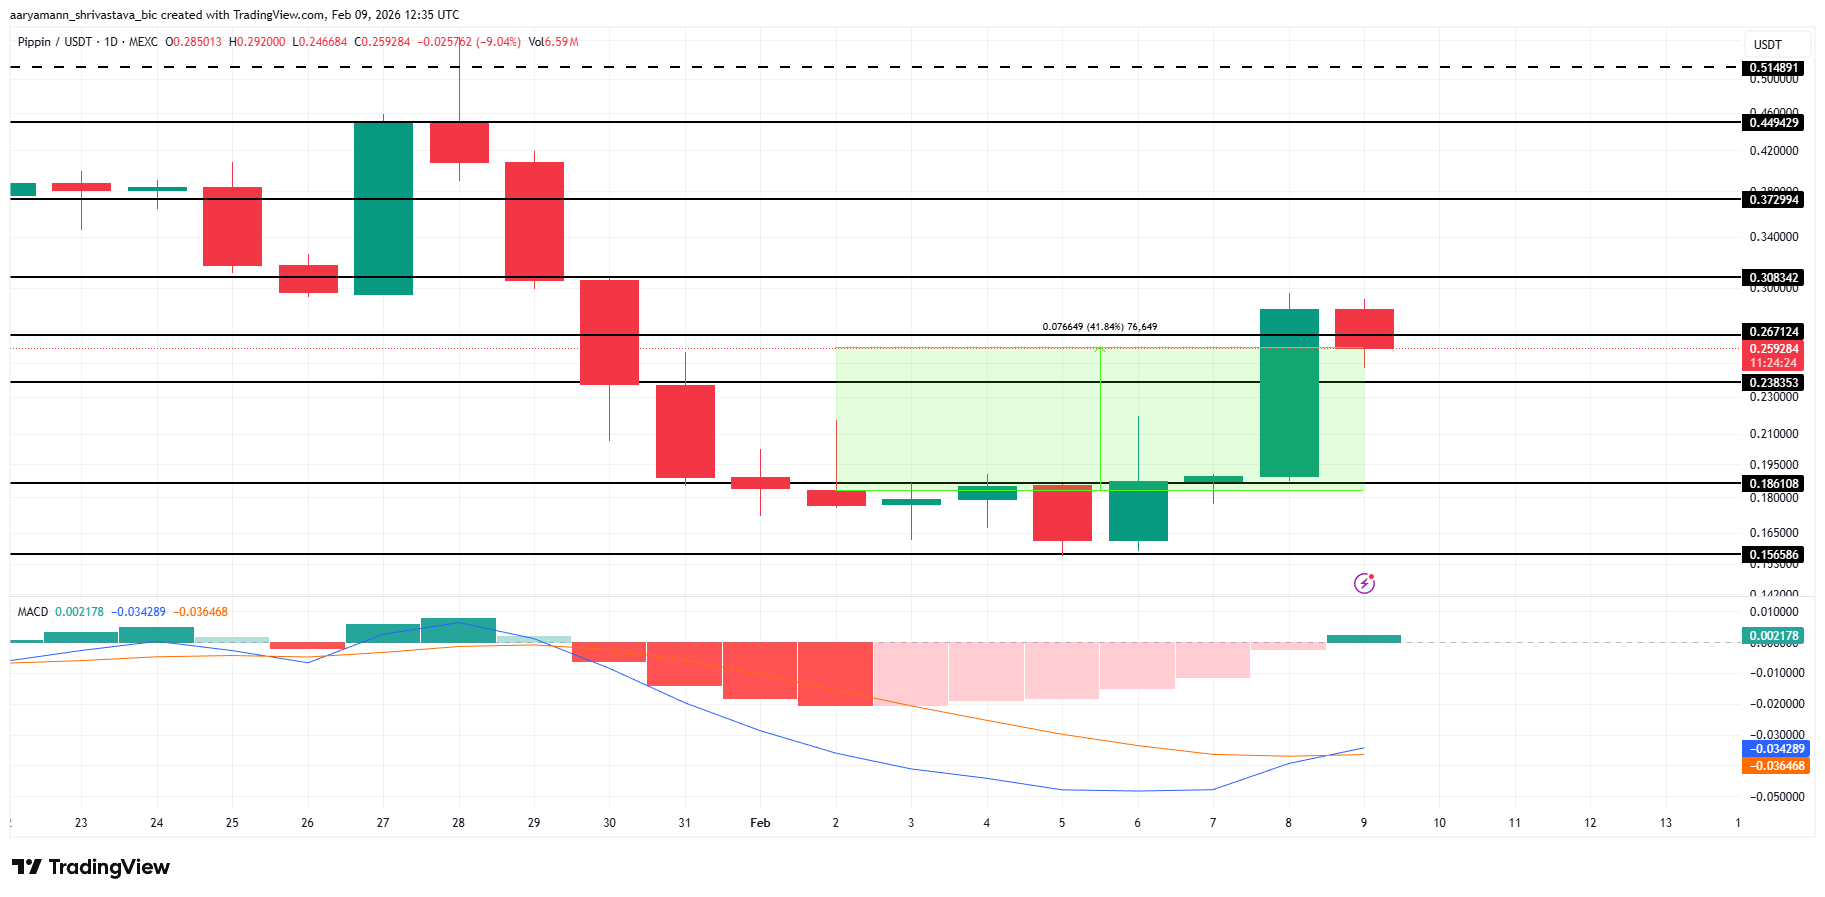
Pippin (PIPPIN)
PIPPIN is attempting a trend reversal after a sharp corrective leg, with price bouncing cleanly from the $0.1565 demand zone and forming short-term higher lows. Momentum is improving as the MACD histogram is forming a bullish crossover, suggesting selling pressure is fading, and buyers are stepping back in.
Price is currently trading around $0.2592, which remains the immediate level to reclaim. A strong daily close above $0.2671 would confirm continuation and open the path toward $0.3083, with a further extension toward $0.3729 if momentum and volume expand in favor of bulls.
Want more token insights like this? Sign up for Editor Harsh Notariya’s Daily Crypto Newsletter here.

This recovery structure stays intact as long as the price holds above $0.1861 on a daily closing basis. A breakdown and close below $0.1565 would invalidate the bullish reversal, flip momentum back bearish, and expose downside continuation, signaling the bounce was corrective rather than trend-changing.
Sponsored
Sponsored
Bone ShibaSwap (BONE)
BONE is noting a bounce after an extended downtrend, with price defending the $0.0482 swing low and reclaiming the 23.6% Fibonacci level at $0.0607. The structure hints at a potential short-term reversal as bullish candles step in, while CMF ticks up to -0.11, signaling declining but still cautious capital outflows.
Price is currently trading at $0.0685, testing the 38.2% Fibonacci retracement. A clean daily close above $0.0685 would open upside continuation toward $0.0747 (50% Fib), followed by a move to $0.0810 at the 0.618 level. A breach above $0.0810 would shift the market structure bullish and target $0.0899 next.
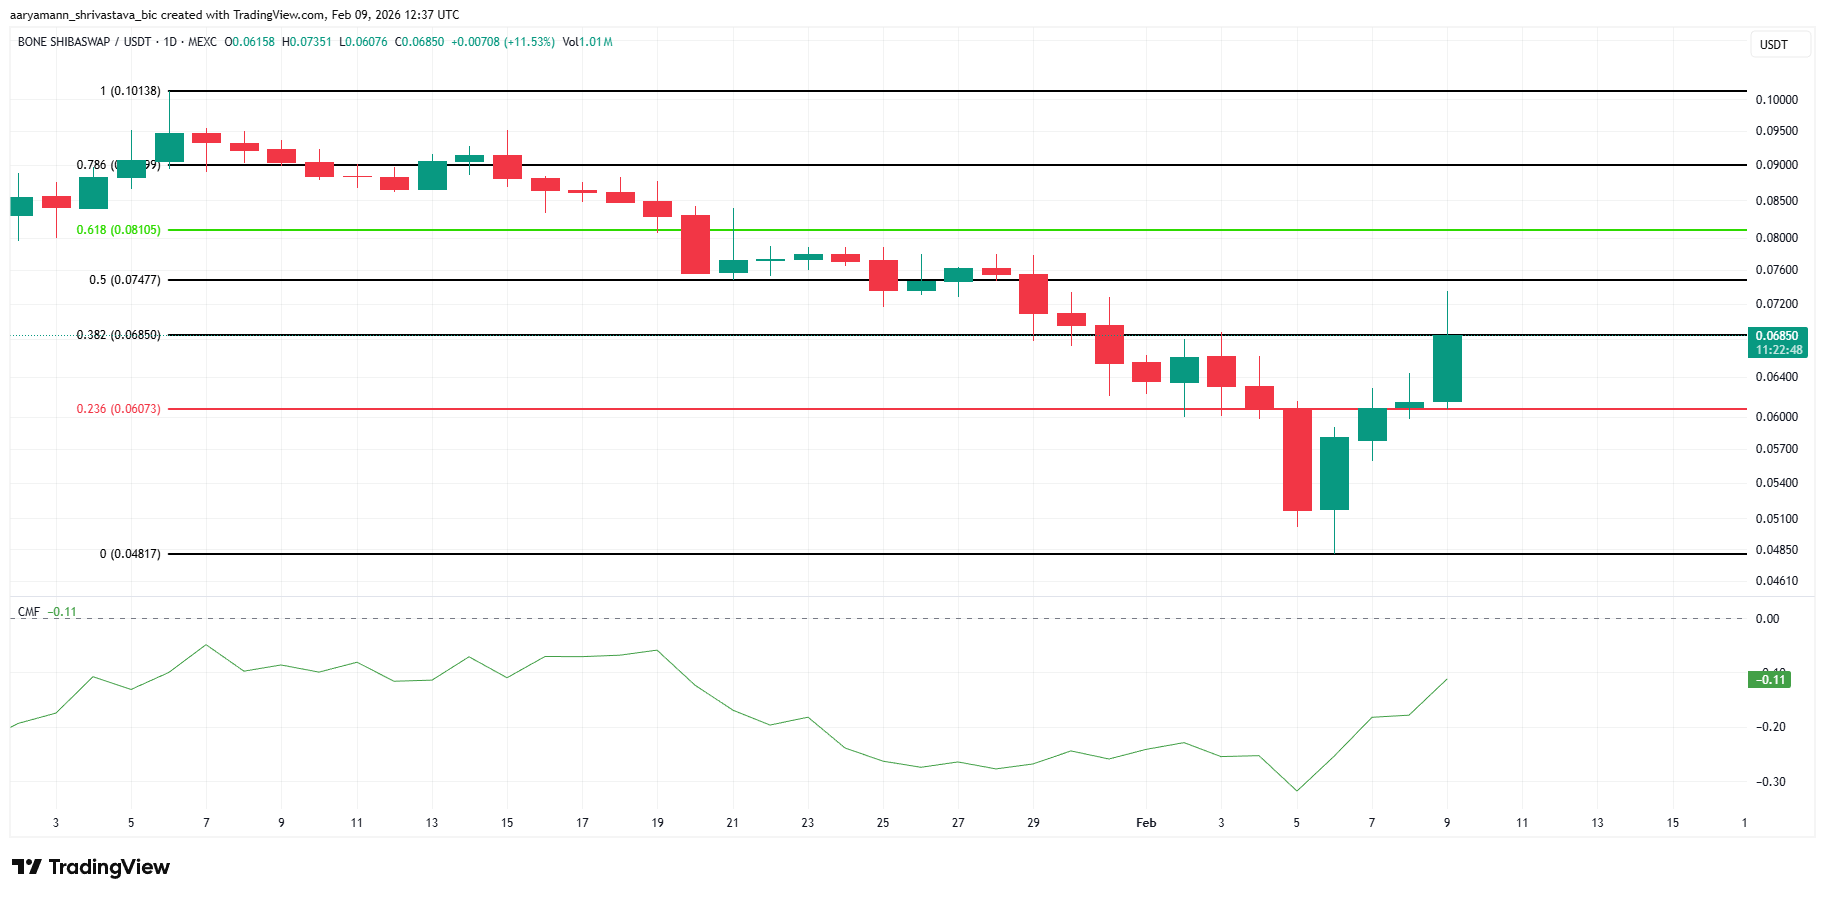
This recovery remains valid as long as the price holds above $0.0607 on a daily closing basis. A breakdown below this support would fully invalidate the bullish reversal, sending BONE to $0.0481.
Banana For Scale (BANANAS31)
BANANAS31 has rallied sharply over the past four days, trading near $0.0043 at the time of writing. The meme coin is pressing against the $0.0043 resistance, which aligns with the 38.2% Fibonacci retracement. This level is critical for determining whether recent momentum can sustain further upside.
Historically, BANANAS31 has failed to clear this resistance, making the current attempt decisive. A successful breakout would confirm bullish continuation. The Money Flow Index indicates strong buying pressure, reinforcing upside potential. A move above $0.0047, the 50% Fibonacci level, could accelerate gains toward the $0.0051 target.
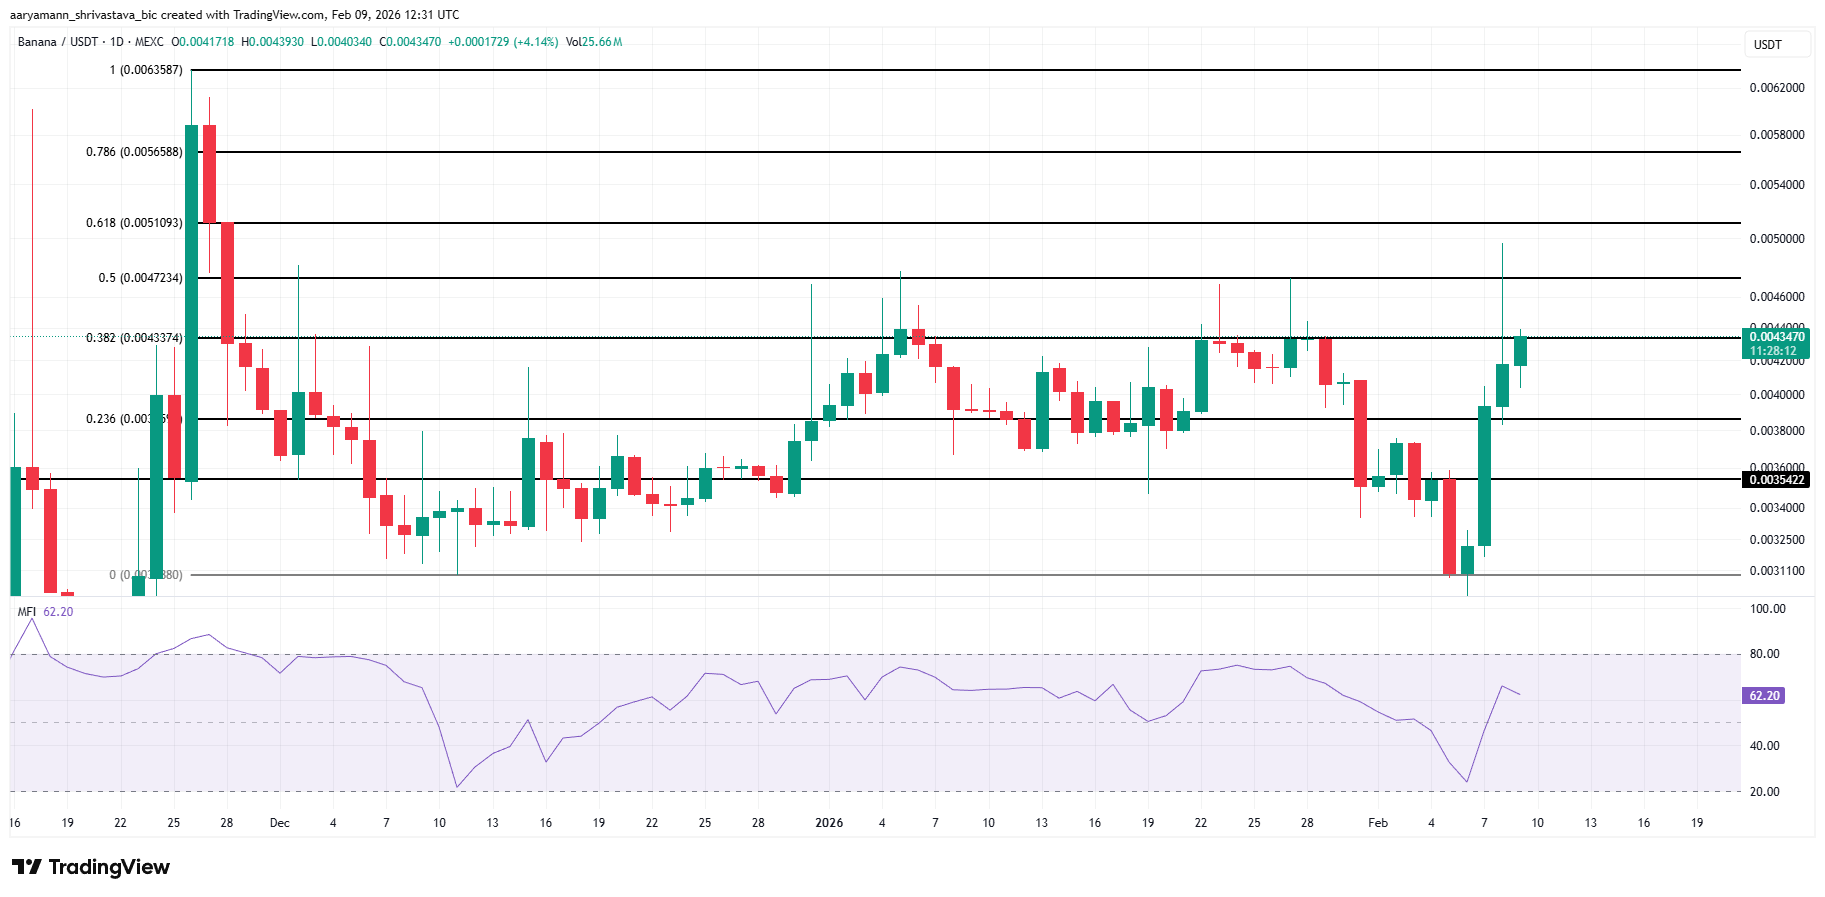
On the other hand, failure to break $0.0043 may trigger a pullback toward $0.0039. Losing the 23.6% Fibonacci support would weaken the structure. Under that scenario, BANANAS31 could slide to $0.0035, invalidating the bullish thesis and erasing the meme coin’s recent recovery gains, sending it back to early February’s price.


Victoria, Seychelles, February 9, 2026 — Bitget, the world’s largest Universal Exchange (UEX), today announced the release of The UEX Security Standard: From Proof to Protection, a joint research report authored with blockchain security firm BlockSec. The report outlines a system-level security framework designed for exchanges operating across crypto, tokenized assets, and traditional financial markets within unified account environments.
As trading platforms evolve into Universal Exchanges, first coined by Bitget CEO Gracy Chen at its 7th year anniversary, security challenges extend beyond single-asset custody and on-chain safeguards. Unified margin systems, shared settlement infrastructure, and cross-market access introduce new risks, with failures at the account, data, or permission layer capable of rippling across products and asset classes. The report addresses these challenges by shifting the security conversation from isolated controls toward continuous, verifiable resilience.
The UEX Security Standard defines five core benchmarks for the next generation of exchange security: verifiable solvency, multi-asset risk isolation, data security and privacy protection, AI-driven dynamic monitoring, and resilient application and infrastructure defense. Together, these standards aim to ensure that risks can be contained, correctness can be verified, and trust can scale alongside platform complexity.
The framework is grounded in measurable safeguards already in place at Bitget, including a regular Proof of Reserves reporting and a strong Protection Fund. These measures are reinforced through collaboration with BlockSec, spanning real-time monitoring, offensive security testing, incident response readiness, and compliance-grade controls such as AML screening and fund tracing.
“The transition to Universal Exchanges changes the nature of security risk,” said Gracy Chen, CEO of Bitget. “Security can no longer focus on individual assets or reactive disclosure. It must operate at the system level, where risks are identified early, isolated by design, and verified under real-world conditions.”
From BlockSec’s perspective, the report reflects a broader industry shift toward integrated security architectures. “UEX is not just a product upgrade. It is a structural shift in how trading infrastructure and security must work,” said Yajin Zhou, Co-founder and CEO of BlockSec. “When you combine crypto-native assets with stocks, ETFs, and other off-chain instruments, the security boundary expands dramatically. Platforms must prove asset transparency, ensure pricing integrity, and secure off-chain dependencies to the same standard as on-chain systems. UEX demands a unified, verifiable security framework that can protect multi-asset trading at scale.”
Beyond technical architecture, the report also emphasizes transparency, emergency response readiness, and user education as part of a comprehensive security model. It positions security not as a static feature, but as an operating discipline that must evolve alongside market structure and product complexity.
The UEX report is intended to serve as a reference point for exchanges, regulators, and market participants navigating the next phase of multi-asset trading infrastructure.
For the full report, visit here.
About Bitget
Bitget is the world’s largest Universal Exchange (UEX), serving over 125 million users and offering access to over 2M crypto tokens, 100+ tokenized stocks, ETFs, commodities, FX, and precious metals such as gold. The ecosystem is committed to helping users trade smarter with its AI agent, which co-pilots trade execution. Bitget is driving crypto adoption through strategic partnerships with LALIGA and MotoGP™. Aligned with its global impact strategy, Bitget has joined hands with UNICEF to support blockchain education for 1.1 million people by 2027. Bitget currently leads in the tokenized TradFi market, providing the industry’s lowest fees and highest liquidity across 150 regions worldwide.
For more information, visit: Website | Twitter | Telegram | LinkedIn | Discord
For media inquiries, please contact: [email protected]
Risk Warning: Digital asset prices are subject to fluctuation and may experience significant volatility. Investors are advised to only allocate funds they can afford to lose. The value of any investment may be impacted, and there is a possibility that financial objectives may not be met, nor the principal investment recovered. Independent financial advice should always be sought, and personal financial experience and standing carefully considered. Past performance is not a reliable indicator of future results. Bitget accepts no liability for any potential losses incurred. Nothing contained herein should be construed as financial advice. For further information, please refer to our Terms of Use.
Crypto World
Tom Lee’s Bitmine (BMNR) adds to ETH stack after price crash, now holds 3.6% of Ethereum’s (ETH) total supply


Bitmine Immersion Technologies (BMNR) added to its ether holdings amid last week’s crypto crash, bringing its stack to more than 4.3 million tokens worth about $8.7 billion at the current price just above $2,000.
Led by Chairman Tom Lee, the company, which is the world’s largest holder of ETH, purchased another 40,613 tokens over the past week, though it didn’t disclose the average buy price. ETH began the week above $2,300 and plunged to as low as $1,700 before closing out the week just above $2,000.
BMNR shares are flat in early trading on Monday, though lower by 34% year-to-date.
“Bitmine has been steadily buying Ethereum, as we view this pullback as attractive, given the strengthening fundamentals,” said Lee in a press release. “In our view, the price of ETH is not reflective of the high utility of ETH and its role as the future of finance.”
Two-thirds of the firm’s ETH, around 2.9 million tokens, are already staked, generating an annualized yield of $202 million.
Bitmine remains deeply underwater on its ETH purchases. Based on data from Dropstab, the company sits on a $7.8 billion loss on its ether holdings, which it bought at an average price of $3,826.

Silver continues to sit at the intersection of monetary confidence, industrial transformation, and geopolitical tension. Its price history shows repeated phases of sharp repricing followed by consolidation, reflecting shifts in macro conditions rather than steady progression.
Looking ahead, silver’s role in electrification, combined with fiscal and currency dynamics, keeps it firmly in focus for market participants. This article examines silver’s historical price behaviour and provides analysts’ silver price predictions for the next 5 years, placing recent developments within a broader market context.
Analytical Forecast Summary
2026
For 2026, estimates span roughly $92 to $262, with bank views clustering around $100 while some retail-aggregator models extend far higher. The spread reflects uncertainty around real yields, dollar direction, and how long physical tightness persists after the January volatility spike.
2027
In 2027, forecasts widen further, from about $112 to $374. Some views lean on a lower gold-silver ratio as a driver of relative upside, while others assume industrial thrifting and substitution cap follow-through after any sharp repricing
2028
Silver’s projected price in 2028 ranges from around $128 to $423. This gap largely comes down to how much PV and electrification demand offsets lower silver intensity per unit and whether supply response remains slow.
2029
2029 estimates run from roughly $136 to $443. Longer-range numbers diverge on whether investment demand remains episodic or returns in multi-quarter waves during macro stress.
2030
Forecasts for 2030 sit between about $143 and $499, implying continued volatility rather than a linear trend, with outcomes hinging on fiscal dynamics, monetary credibility, and the balance between demand growth and supply constraints.
Silver’s Price History
Silver’s price history is marked by dramatic fluctuations, reflecting the interplay of market forces, geopolitical events, and investor behaviour.
Silver Thursday (1980)
One of the most significant periods was in the late 1970s and early 1980s, notably during the Silver Thursday event of 1980. After the precious metal began climbing in the latter half of the 1970s, an attempt by the Hunt brothers to corner the market in January 1980 led to silver prices reaching an all-time high of $49.45 per troy ounce—from the 1979’s high of $28— before crashing to a low of $4.90 at the end of 1982.
The Early 21st Century (2000-2011)
Following the dot-com bubble burst in the early 2000s, silver and other precious metals began a bullish run as investors sought so-called safe-haven assets amidst economic uncertainty. However, after surging from a low of around $4.43 in November 2002 to a high of $15.23 in May 2006, prices stalled. It eventually rose again, driven by a combination of investment demand, industrial applications, and concerns over fiat currency devaluation in the run-up to the Great Financial Crisis of 2008.
While it dipped as the crisis unfolded, silver spiked in the following years, reaching an all-time high of roughly $50 in April 2011.
A Volatile Period in Silver’s History (2012-2026)
However, silver then reversed hard, ending 2011 near $27.80 and sliding again as tighter policy expectations built. The downswing carried into the mid-2010s, with a trough around $13.9 in late 2015/early 2016. For much of 2014-2019 it rotated in a $15-$20 band as US rates rose and the dollar firmed.
In March 2020, the COVID liquidity shock pushed silver below $12, then stimulus and reflation trades drove a fast rebound towards $29 by August 2020. A retail-driven “silver squeeze” wave in early 2021 lifted it to around $30 before momentum faded.
Fed tightening and a stronger dollar weighed again in 2022, taking prices back toward $18 before stabilising. A break higher gathered pace from May 2024 (moves through $32-$35 linked to tight physical conditions and strong solar-related demand signals), then 2025 accelerated: silver cleared the prior nominal record in October near $54.50 and pushed higher into year-end. In January 2026, price action became disorderly, with a spike to over $121 late in the month. At the time of writing on the 29th of January, silver stands at around $114.
Interested readers can head over to FXOpen’s TickTrader platform to explore silver price trends using our interactive XAG/USD charts.
Analytical Silver Prices Forecasts for 2026
Silver enters 2026 after a steep 2024–January 2026 run and a sharp volatility spike. The key issue for silver price predictions is whether the metal rises on strong fundamental factors, or corrects as the factors change.
Macro, Rates, and Debasement Concerns
Rate-path pricing and the US dollar remain central. If real yields drift lower and fiscal deficits stay elevated, concerns about currency depreciation may continue to influence investment flows into precious metals. Persistent budget imbalances, heavy Treasury issuance, and questions around long-term currency purchasing power remain a central part of the backdrop.
Industrial Demand and Manufacturing Thrift
Solar, electrification, and electronics demand stay in focus, but 2025 highlighted a clear constraint: higher prices encouraged reduced silver loadings in PV cells and components. If prices remain elevated, further thrifting and substitution may lower silver demand.
Supply, Inventories, and Physical Tightness
The silver market has recorded several annual deficits in recent years. Analysts note a decline in above-ground inventories and heightened sensitivity to regional physical flows. While recycling supply may rise in response to price incentives, primary mine output is likely to remain relatively inelastic given silver’s predominantly by-product production profile.
Volatility and Positioning
After the January spike, silver may trade in wide ranges driven by ETF flows, futures positioning, and liquidity conditions. The 2025 breakout zone around $28-$35 remains important; sustained trade below it could point to a deeper reset.
Analytical Silver Price Predictions for 2026
Silver price forecasts for 2026 reflect a market adjusting after sharp repricing, with views shaped by macro policy uncertainty, physical availability, and shifting investor positioning.
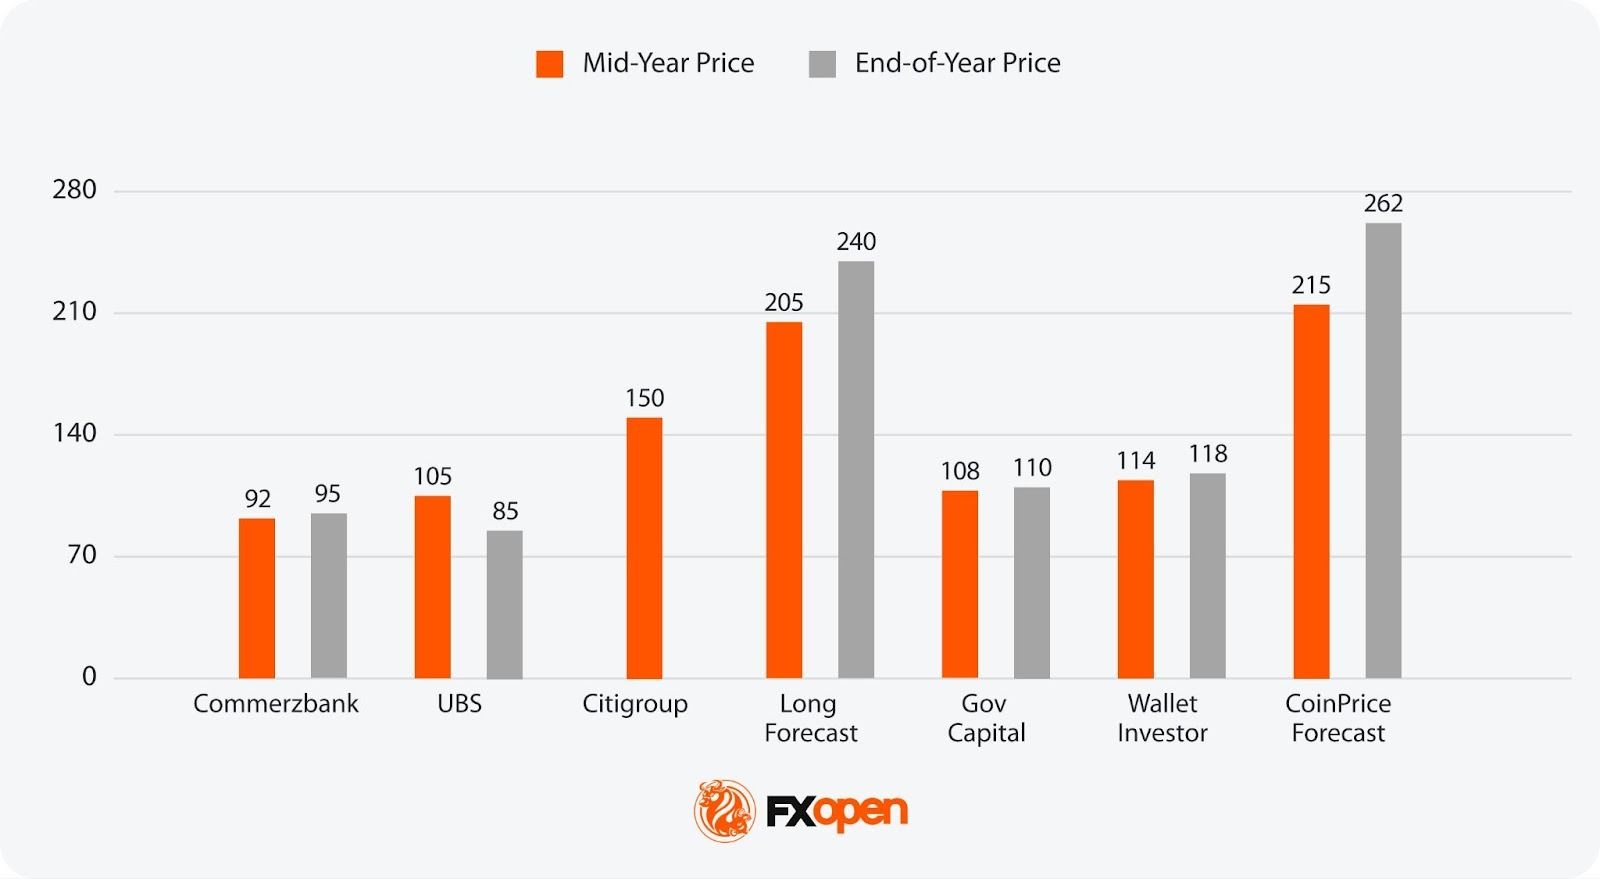
- Most Pessimistic Projection for Mid-Year 2026: $92 (Commerzbank)
- Most Optimistic Projection for Mid-Year 2026: $215 (CoinPriceForecast)
- Most Pessimistic Projection for End-of-Year 2026: $85 (UBS)
- Most Optimistic Projection for End-of-Year 2026: $262 (CoinPriceForecast).
Citigroup outlines one of the most aggressive near-term outlooks, pointing to $150/oz by mid-2026. Commodities strategist Max Layton links this view to strong Chinese buying, supply constraints, and persistent structural imbalances. Citi characterises silver as behaving like “gold squared”, arguing the move may persist until valuations appear stretched relative to gold.
Commerzbank has lifted its expectations materially, now seeing $92/oz by mid-2026 and $95/oz by year-end, up sharply from late-2025 assumptions. Analyst Carsten Fritsch points to escalating geopolitical tensions, including unrest in Iran and the risk of wider confrontation, while cautioning that higher prices may accelerate industrial thrifting or substitution towards cheaper metals.
Analytical Silver Price Forecasts for 2027 and Beyond
Beyond 2026, silver price predictions become less about short-term positioning and more about structural forces shaping demand, supply, and capital allocation.
Structural Demand Versus Intensity Decline
Solar, grid expansion, EVs, and data infrastructure continue to absorb material volumes, but the focus shifts from headline installation growth to silver intensity per unit. PV manufacturers, battery systems, and electronics producers are expected to keep reducing silver loadings where technically feasible. This creates a tension: total volumes may rise, but marginal demand growth becomes more sensitive to price. Periods of elevated prices risk flattening fabrication demand.
Fiscal Dynamics and Monetary Credibility
Longer term, silver remains exposed to currency debasement narratives rather than cyclical rate expectations alone. Persistent fiscal deficits, rising sovereign debt servicing costs, and political resistance to austerity may keep precious metals embedded in asset-allocation discussions. Unlike 2024–2026, this influence is expected to express itself episodically rather than through sustained one-way moves.
Supply Response Lag
Mine supply response beyond 2027 remains constrained. Supply elasticity remains low: as most silver is mined as a by-product, production levels are often dictated by the economics of copper, lead, or zinc rather than silver market trends. Recycling growth faces natural limits after several years of elevated prices pulling forward scrap supply. This could keep the market sensitive to demand shocks.
Analytical Silver Price Predictions: 2027
The 2027 outlook points to a continuation of longer-cycle themes, with some analyses focusing on relative valuation against gold while others factor in demand moderation from industrial thrift.
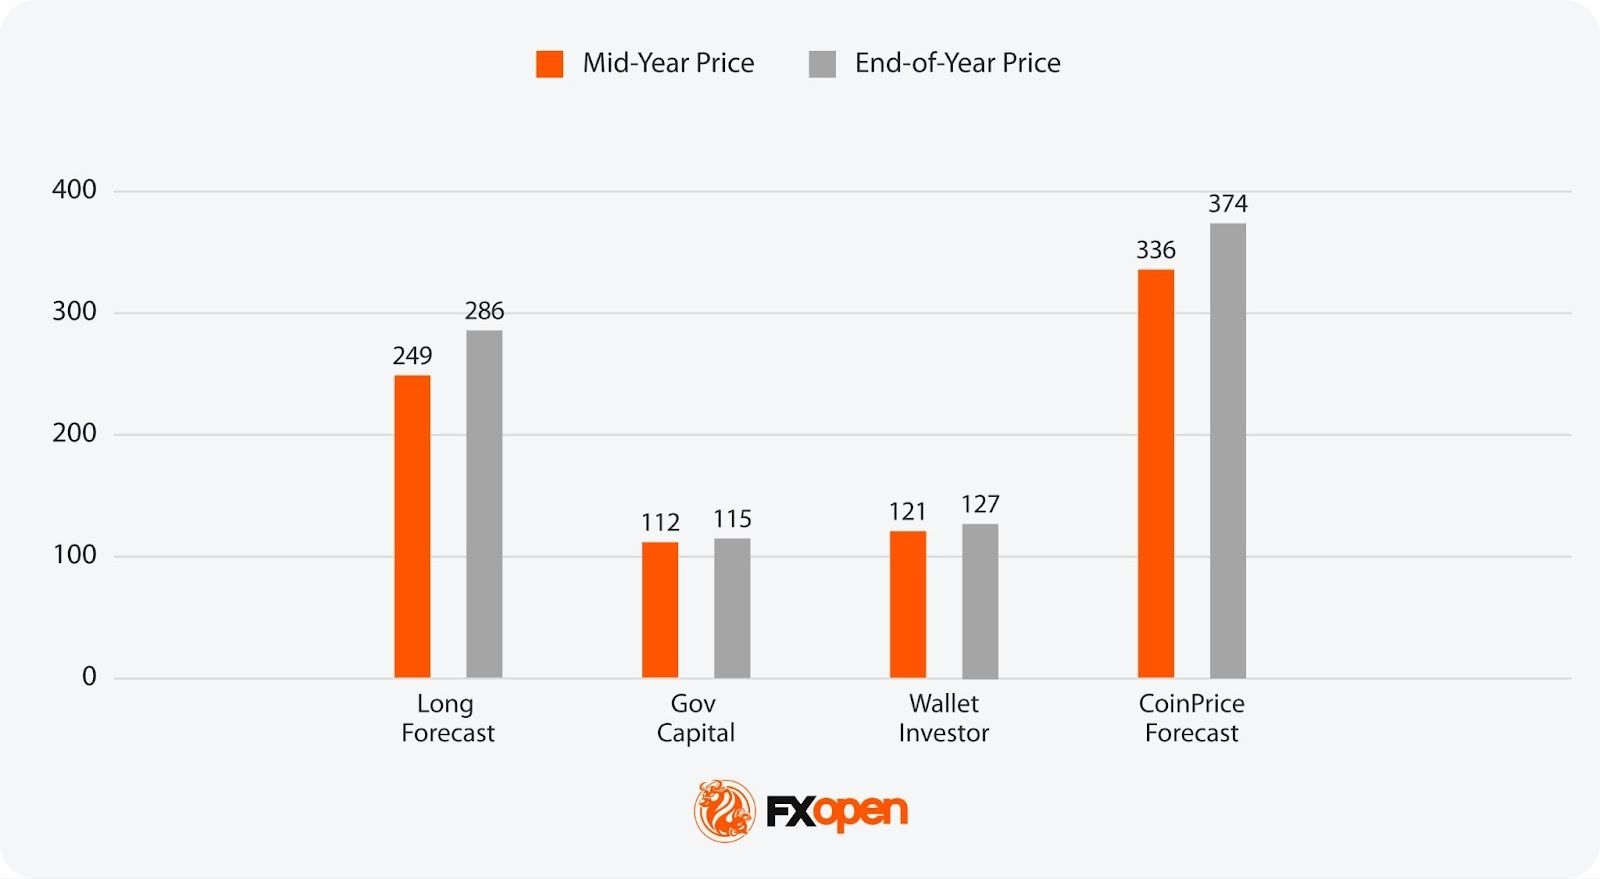
- Most Pessimistic Projection for Mid-Year 2027: $112 (Gov Capital)
- Most Optimistic Projection for Mid-Year 2027: $336 (CoinPriceForecast)
- Most Pessimistic Projection for End-of-Year 2027: $115 (Gov Capital)
- Most Optimistic Projection for End-of-Year 2027: $374 (CoinPriceForecast)
HSBC’s James Steel expects physical market tightness to ease gradually through 2027 as supply-side pressures resolve. The bank projects the global deficit narrowing further as industrial demand weakens, while mine output and recycling rise. Steel notes that elevated prices are encouraging “substitution, thrifting and design changes” across industrial applications, with jewellery demand “especially vulnerable.”
Oxford Economics, in a December 2025 report on behalf of the Silver Institute, projects that electric vehicles will overtake internal combustion engine (ICE) vehicles as the primary source of automotive silver demand by 2027. Electric vehicles consume, “on average, 67-79 percent more silver than ICE vehicles.”
Data centres powering AI systems represent another expanding offtake channel; as digitisation accelerates, demand for silver’s superior conductivity in servers and infrastructure is expected to rise in tandem. Oxford Economics characterises silver as a “next-generation metal,” concluding it will “remain an essential component across multiple high-growth sectors as industries race to embrace digital innovation and meet clean energy mandates.”
Analytical Silver Price Predictions: 2028
By 2028, projections diverge more clearly as assumptions vary around supply response timing, sustained electrification demand, and the durability of investment flows.
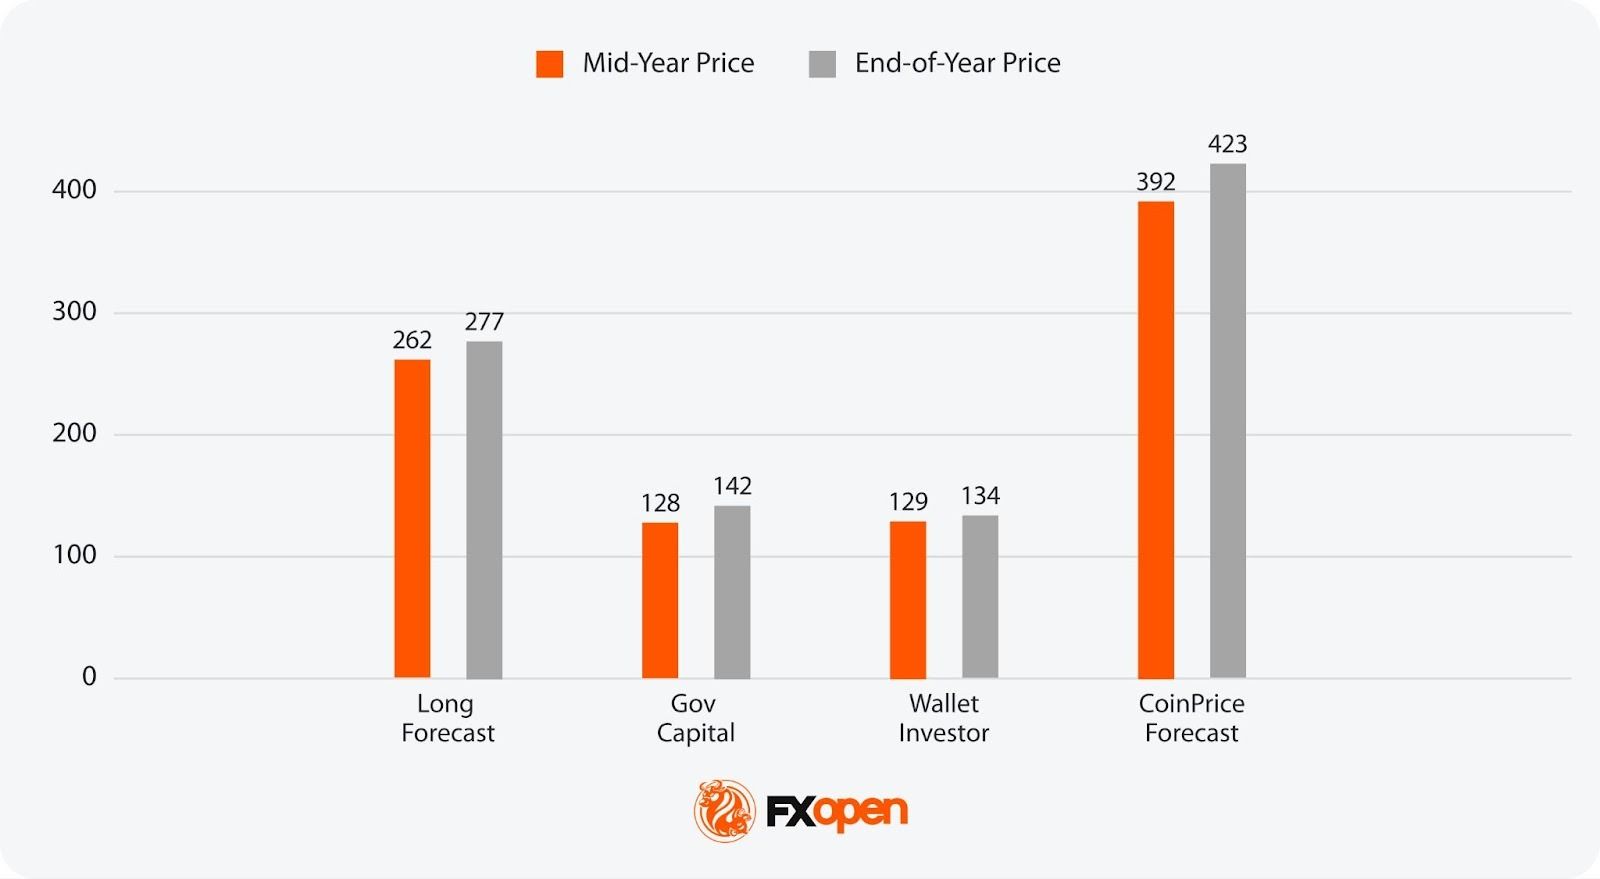
- Most Pessimistic Projection for Mid-Year 2028: $128 (Gov Capital)
- Most Optimistic Projection for Mid-Year 2028: $392 (CoinPriceForecast)
- Most Pessimistic Projection for End-of-Year 2028: $142 (Gov Capital)
- Most Optimistic Projection for End-of-Year 2028: $423 (CoinPriceForecast)
Analytical Silver Price Predictions: 2029
The 2029 outlook reflects growing uncertainty over macro structure rather than short-term cycles, with outcomes tied to fiscal dynamics, currency credibility, and episodic capital rotation.
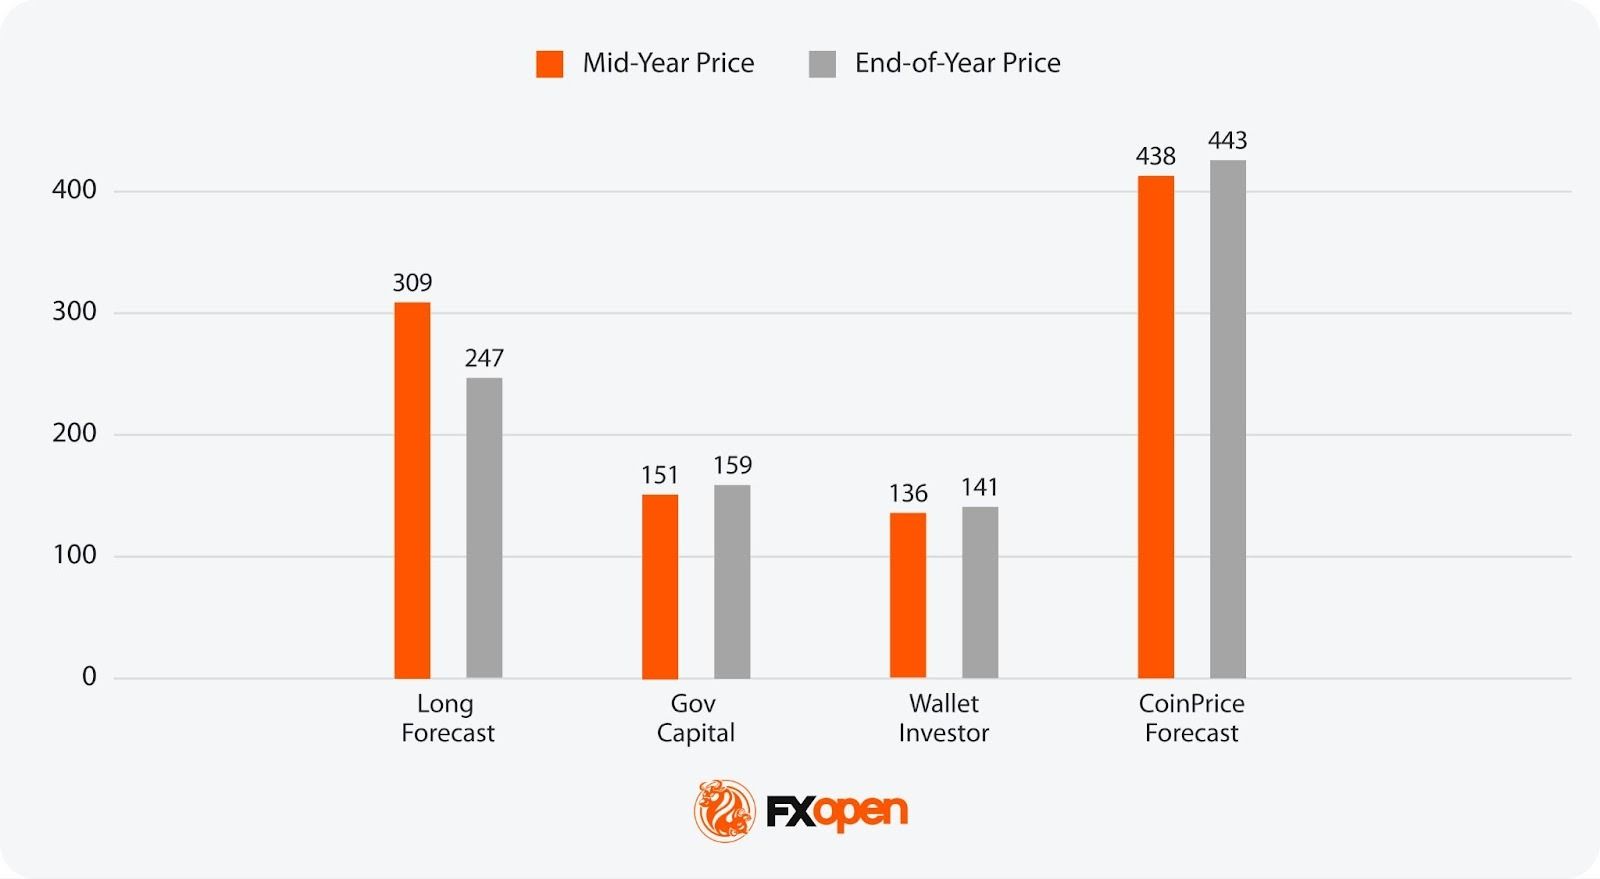
- Most Pessimistic Projection for Mid-Year 2029: $136 (Wallet Investor)
- Most Optimistic Projection for Mid-Year 2029: $438 (CoinPriceForecast)
- Most Pessimistic Projection for End-of-Year 2029: $141 (Wallet Investor)
- Most Optimistic Projection for End-of-Year 2029: $443 (CoinPriceForecast)
Analytical Silver Price Predictions: 2030
Looking at long-term silver price forecasts in 2030, estimates frame silver as a hybrid asset, where price behaviour depends on whether structural demand pressures outweigh gradual supply adaptation and periodic volatility.
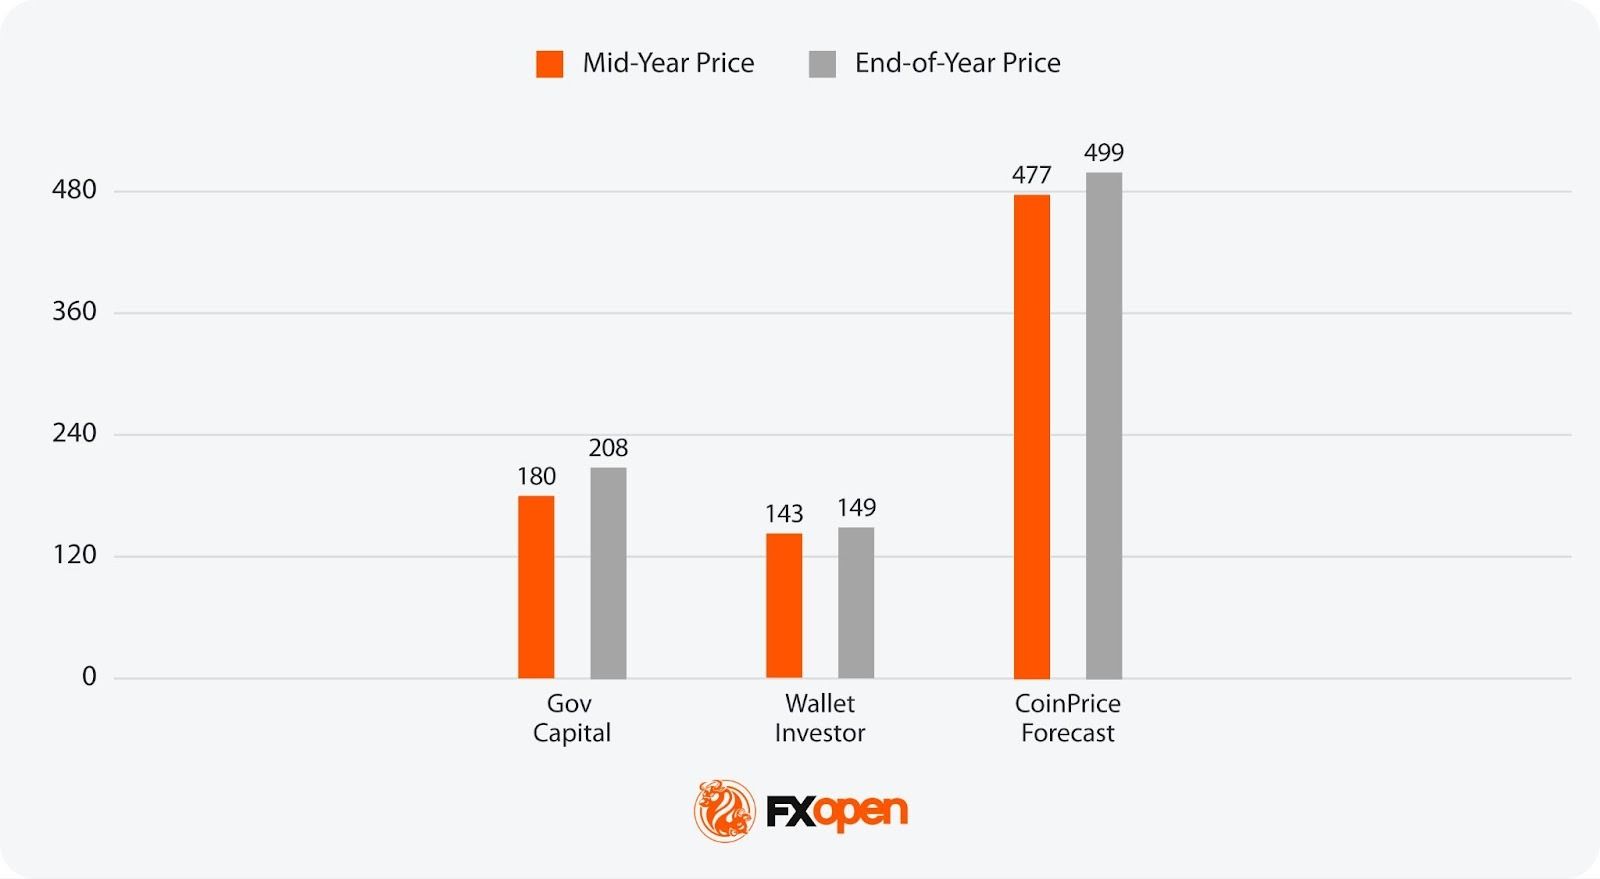
- Most Pessimistic Projection for Mid-Year 2030: $143 (Wallet Investor)
- Most Optimistic Projection for Mid-Year 2030: $477 (CoinPriceForecast)
- Most Pessimistic Projection for End-of-Year 2030: $149 (Wallet Investor)
- Most Optimistic Projection for End-of-Year 2030: $499 (CoinPriceForecast)
Factors That Might Affect the Silver’s Price
Silver prices are shaped by a dynamic blend of economic, geopolitical, and industrial factors, reflecting its dual role as both an investment and an industrial metal. Key factors going forward include:
- Industrial Demand: Silver’s extensive use in technologies like solar panels and electronics directly influences its price.
- Economic Conditions: Economic growth increases silver demand in manufacturing, while downturns often boost its appeal as a so-called safe-haven asset.
- Monetary Policy: Interest rate changes can shift investor preference between silver and yield-bearing assets.
- US Dollar Strength: An inverse relationship exists between XAG prices and the US dollar; a stronger dollar can suppress its price.
- Geopolitical Tensions: Conflicts and instability tend to increase investment in silver as a so-called protective measure.
- Gold/Silver Ratio: This indicator may help investors decide when to buy silver over gold, affecting demand and prices.
The Bottom Line
Silver’s outlook remains shaped by a mix of macro uncertainty, fiscal dynamics, and structural industrial demand. Price behaviour over the coming years is likely to reflect shifts in real yields, currency confidence, and supply constraints rather than linear trends, with volatility remaining a defining feature.
If you are looking to trade Silver via CFDs, you can consider opening an FXOpen account and get access to the advanced trading tools and more than 700 instruments.
FAQ
Will Silver Go Up in 2026?
Silver’s direction in 2026 depends on real yields, dollar trends, and physical market conditions. Some analysts point to support from tight supply and debasement concerns, while others highlight scope for consolidation after the January volatility spike.
Is Silver a Good Investment in 2026?
Silver is analysed as a hybrid asset with both industrial and monetary drivers. Its role in electrification and sensitivity to macro stress may support portfolio diversification, though price behaviour in 2026 is expected to remain uneven.
Will Silver Hit $200?
Some analyses outline scenarios above $200 based on historical gold-silver ratios compressing sharply. These outcomes assume sustained macro stress and strong investment flows, and sit well outside base-case assumptions from major banks.
What Will Silver Be Worth by 2030?
By 2030, analytical estimates range widely between $143 and almost $500, reflecting uncertainty around fiscal dynamics, supply response, and industrial demand intensity. Longer-range views agree that the future of silver prices will likely be volatile and shaped by macro structure and capital flows.
How Do Traders Trade Silver in Forex?
Silver cannot be traded on the forex market, as it is a currency market. However, it can be traded in the XAG/USD pair via CFDs. If you are interested in CFD trading, you can consider opening an FXOpen account and get access to over 700 instruments and 1,200 analytical tools.
This article represents the opinion of the Companies operating under the FXOpen brand only. It is not to be construed as an offer, solicitation, or recommendation with respect to products and services provided by the Companies operating under the FXOpen brand, nor is it to be considered financial advice.


[PRESS RELEASE – Amsterdam, Netherlands, February 9th, 2026]
NOWPayments, a crypto payment gateway, has announced a limited-time promotion offering zero network fees on USDT (TRC20) payments for new partners.
To access the zero-fee option, users need to register with NOWPayments and enable Custody in their dashboard. Enabling Custody also provides access to additional features such as Mass Payouts and off-chain conversions, allowing businesses to streamline payment flows and manage settlements more efficiently.
The initiative allows newly registered merchants to accept USDT TRC20 payments without network fees for the first two months*, helping businesses save on operational costs while exploring crypto payments in a real-world environment.
The offer is designed to support companies across multiple industries – including iGaming, Trading, Software as a Service (SaaS), and technology teams such as IT companies and developers – by lowering the barrier to entry for stablecoin payments. By removing network fees on USDT TRC20 deposits, NOWPayments enables merchants to experience fast, reliable, and cost-efficient crypto transactions from day one.
“Our mission is to make crypto payments practical and accessible for businesses of all sizes,” said Kate Lifshits, CEO of NOWPayments. “This promotion gives new partners the opportunity to evaluate our infrastructure without additional network costs – from seamless API integration to near-instant settlement.”
In addition to the zero-fee promotion, NOWPayments supports 350 cryptocurrencies, including 20+ stablecoins across Ethereum, Tron, Binance Smart Chain, Solana, Polygon and other blockchain networks. Payments can reach finality in under a minute, depending on the network, with no limits on transaction size – large-value payments are processed at the same speed as smaller ones. The platform also imposes no limits on transaction volume, offering high throughput and enabling businesses to process a large number of payments efficiently and at scale.
NOWPayments also offers a comprehensive set of payment tools, including:
- Permanent deposit addresses
- Mass payouts with 0% fee
- Average transaction time of approximately 1 minute
- Fiat off-ramp & on-ramp support
- Gateway fees of 0.5% for single-currency payments and 1% for payments with conversion
These features position NOWPayments as a flexible and scalable payment solution for businesses seeking transparent, efficient, and compliant crypto payment infrastructure.
About NOWPayments
NOWPayments is a cryptocurrency payment gateway that helps businesses to accept, manage, and distribute crypto payments across more than 350 digital assets. Founded in 2019, the platform supports companies operating in iGaming, eCommerce, and other high-risk industries with permanent deposit addresses, mass payout tools, fiat off-ramp & on-ramp capabilities, and average transaction times of under three minutes.
Website: https://nowpayments.io
* The promotion applies to USDT (TRC20) payments only and is available to new users for a period of two months.
Disclaimer
This communication is provided for informational purposes only and does not constitute investment, financial, or legal advice. It is not intended as an offer, solicitation, or recommendation and does not create any binding obligations. Terms and conditions may change without notice. Cryptoassets are highly volatile and may result in total loss of capital. Service availability and regulatory status depend on your jurisdiction. Users can refer to the Terms & Conditions for further details.
SECRET PARTNERSHIP BONUS for CryptoPotato readers: Use this link to register and unlock $1,500 in exclusive BingX Exchange rewards (limited time offer).

TLDR
- Monday.com (MNDY) beat Q4 earnings with $1.04 per share versus $0.92 expected and revenue of $333.9 million against $329.51 million consensus
- Stock plunged 15% in premarket trading despite the earnings beat on disappointing 2026 guidance
- Company projects 2026 operating income of $165-$175 million, well below Wall Street’s $218 million estimate
- Full-year 2026 revenue guidance of $1.45-$1.46 billion missed analyst expectations of $1.48 billion
- MNDY shares are down 34% year-to-date, caught in the broader software sector selloff
Monday.com stock tumbled in early trading Monday despite posting fourth-quarter results that topped Wall Street expectations. The work-management software provider delivered an earnings beat but spooked investors with cautious guidance for the year ahead.
The company reported adjusted earnings of $1.04 per share for the fourth quarter. That beat analyst estimates of $0.92 per share by $0.12.
Revenue came in at $333.9 million for the quarter. That topped the consensus estimate of $329.51 million and marked a 25% increase from the same period last year.
But investors quickly shifted their focus to the company’s 2026 outlook. Monday.com projected operating income between $165 million and $175 million for the full year.
That forecast fell well short of Wall Street’s expectations. Analysts had been expecting operating income of $218 million heading into the earnings report.
The revenue guidance also disappointed. Monday.com expects 2026 revenue between $1.45 billion and $1.46 billion.
Analysts had estimated $1.48 billion for the full year. The midpoint of Monday.com’s guidance represents a roughly $30 million shortfall from expectations.
Market Reaction and Stock Performance
Shares dropped 15% in premarket trading following the earnings release. The stock closed Friday at $98.00 after a brutal stretch for the company.
MNDY is down 34% year-to-date. The stock has fallen 38.98% over the past three months.
The 12-month performance looks even worse. Shares have declined 69.99% over the past year.
Monday.com has been swept up in the broader software sector selloff. The entire industry has faced pressure as investors rotate out of growth stocks.
Analyst Activity and Financial Health
The company has seen mostly positive analyst activity in recent months. Monday.com received 17 positive earnings revisions in the last 90 days.
Only one negative revision came through during that period. InvestingPro rates Monday.com’s financial health score as showing “good performance.”
The earnings beat marks another quarter of execution on the top and bottom lines. But the conservative guidance suggests management sees headwinds ahead.
The operating income miss of roughly $50 million at the midpoint raises questions about profitability expectations. Revenue growth is expected to continue but at a pace that fell short of analyst models.
The stock’s steep decline this year reflects both company-specific concerns and broader sector weakness. Software stocks have faced multiple compression as interest rates remain elevated.
Monday.com’s Q4 revenue of $333.9 million beat estimates by $4.39 million while earnings per share topped forecasts by 13%.


The company’s latest purchase raised some eyebrows due to the poor timing.
Michael Saylor, the Bitcoin champion behind Strategy’s BTC accumulation strategy, announced minutes ago the latest acquisition made by the company, in which it spent $90 million to accumulate 1,142 units.
Consequently, the firm’s total stash has grown to 714,644 BTC, acquired at an average price of $76,056 for a total of $54.35 billion. Thus, Strategy’s bitcoin holdings continue to be in the red as the asset trades below $70,000 at press time.
Strategy has acquired 1,142 BTC for ~$90.0 million at ~$78,815 per bitcoin. As of 2/8/2026, we hodl 714,644 $BTC acquired for ~$54.35 billion at ~$76,056 per bitcoin. $MSTR $STRC https://t.co/4X2c81LQwm
— Michael Saylor (@saylor) February 9, 2026
Given the cryptocurrency’s adverse movements over the past week or so, the average price of $78,815 per BTC means that Strategy completed its acquisition on Monday or Tuesday. After all, the asset plunged hard in the following days and hasn’t traded at such high prices for a week now.
This raised some questions within the cryptocurrency community, including Satoshi Flipper, who indicated that buying BTC at these levels, even with DCA, makes these purchases “beyond silly.”
DCA all the way but what’s up with these purchase prices, they are beyond silly.
$78k?
So the last time price was $78k it was 2/2-2/3 … these must be purchases made 1 week ago. https://t.co/V0LSZvS4yr
— Satoshi Flipper (@SatoshiFlipper) February 9, 2026
Interestingly, Strategy’s stock prices ended the previous week on a high note, skyrocketing by over 26% to $135. However, MSTR has dropped by nearly 4% in pre-market trading today. On a monthly scale, MSTR’s price is down by 14% despite Friday’s bounce.
You may also like:
SECRET PARTNERSHIP BONUS for CryptoPotato readers: Use this link to register and unlock $1,500 in exclusive BingX Exchange rewards (limited time offer).

Inside the driver setups powering two Phoenix Open contenders

Your Recap of Super Bowl 2026 Ads Is Here: Baby Yoda, Pokemon and Much More
First picture of dad found dead at Dundee flats on Hogmanay as daughter pays tribute


-

 Video7 days ago
When Money Enters #motivation #mindset #selfimprovement
-

 Tech5 days ago
Wikipedia volunteers spent years cataloging AI tells. Now there’s a plugin to avoid them.
-

 Politics22 hours ago
Why Israel is blocking foreign journalists from entering
-
 Sports2 days ago
JD Vance booed as Team USA enters Winter Olympics opening ceremony
-

 Tech3 days ago
First multi-coronavirus vaccine enters human testing, built on UW Medicine technology
-

 NewsBeat16 hours ago
Winter Olympics 2026: Team GB’s Mia Brookes through to snowboard big air final, and curling pair beat Italy
-

 NewsBeat6 days ago
US-brokered Russia-Ukraine talks are resuming this week
-
 Business21 hours ago
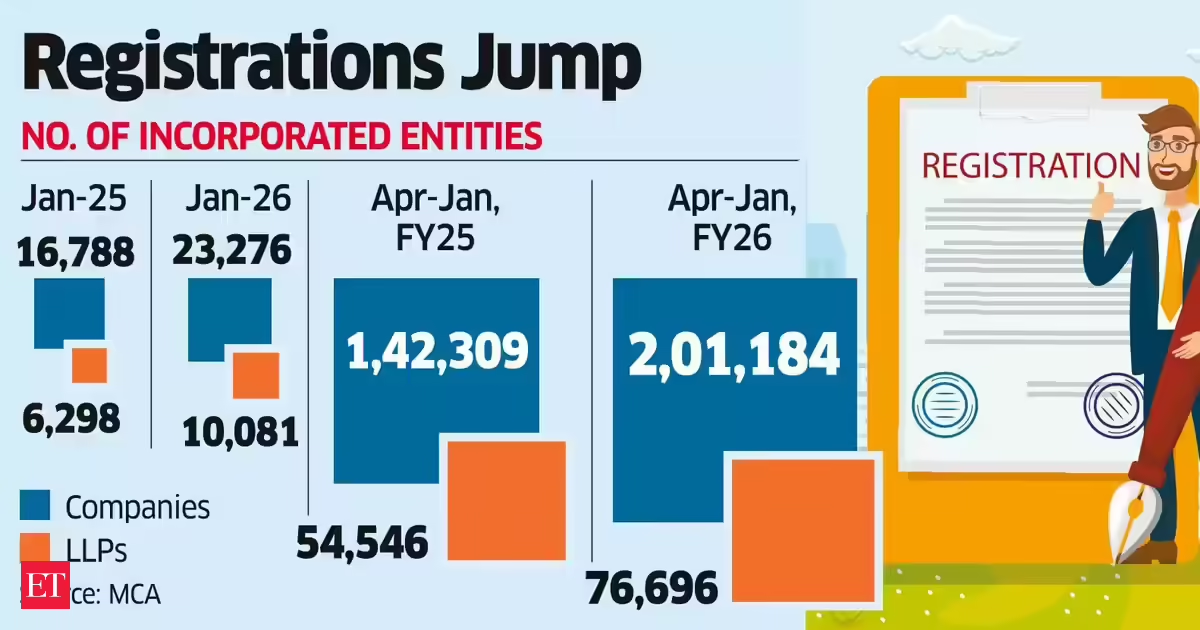
LLP registrations cross 10,000 mark for first time in Jan
-

 Sports11 hours ago
Benjamin Karl strips clothes celebrating snowboard gold medal at Olympics
-

 Politics24 hours ago
The Health Dangers Of Browning Your Food
-
Sports2 days ago
Former Viking Enters Hall of Fame
-
Sports3 days ago
New and Huge Defender Enter Vikings’ Mock Draft Orbit
-

 Business1 day ago
Julius Baer CEO calls for Swiss public register of rogue bankers to protect reputation
-
 NewsBeat3 days ago
Savannah Guthrie’s mother’s blood was found on porch of home, police confirm as search enters sixth day: Live
-

 Business4 days ago
Quiz enters administration for third time
-
 NewsBeat6 hours ago
Residents say city high street with ‘boarded up’ shops ‘could be better’
-

 NewsBeat4 days ago
Still time to enter Bolton News’ Best Hairdresser 2026 competition
-
 NewsBeat3 days ago
Driving instructor urges all learners to do 1 check before entering roundabout
-

 Crypto World6 days ago
Russia’s Largest Bitcoin Miner BitRiver Enters Bankruptcy Proceedings: Report
-

 NewsBeat7 days ago
Images of Mamdani with Epstein are AI-generated. Here’s how we know