

Crypto World
WIF price forms bullish divergence, bottom forming?

WIF price trades below $0.18 range support while RSI prints bullish divergence. A reclaim of this level could signal a deviation and potential move toward $0.26.
Summary
- Key Level: $0.18 range low must be reclaimed to confirm a deviation.
- Momentum Signal: Bullish RSI divergence suggests selling pressure is weakening.
- Upside Target: Successful reclaim could drive rotation toward $0.26 range resistance.
Dogwifhat (WIF) is currently trading at a crucial technical level after losing the key range support near $0.18. Price action has now been finding acceptance below this region since the February 6 low was established, signaling that the market has temporarily shifted below its previous trading range.
While a break below support often indicates further downside risk, the current setup is presenting a potential deviation scenario that traders are watching closely.
Wif price key technical points
- Range Low Support: $0.18 is the key level that must be reclaimed to confirm a potential deviation.
- Bullish RSI Divergence: RSI is forming higher lows while price prints lower lows.
- Upside Target: Reclaiming range support could trigger a move toward range high resistance at $0.26.
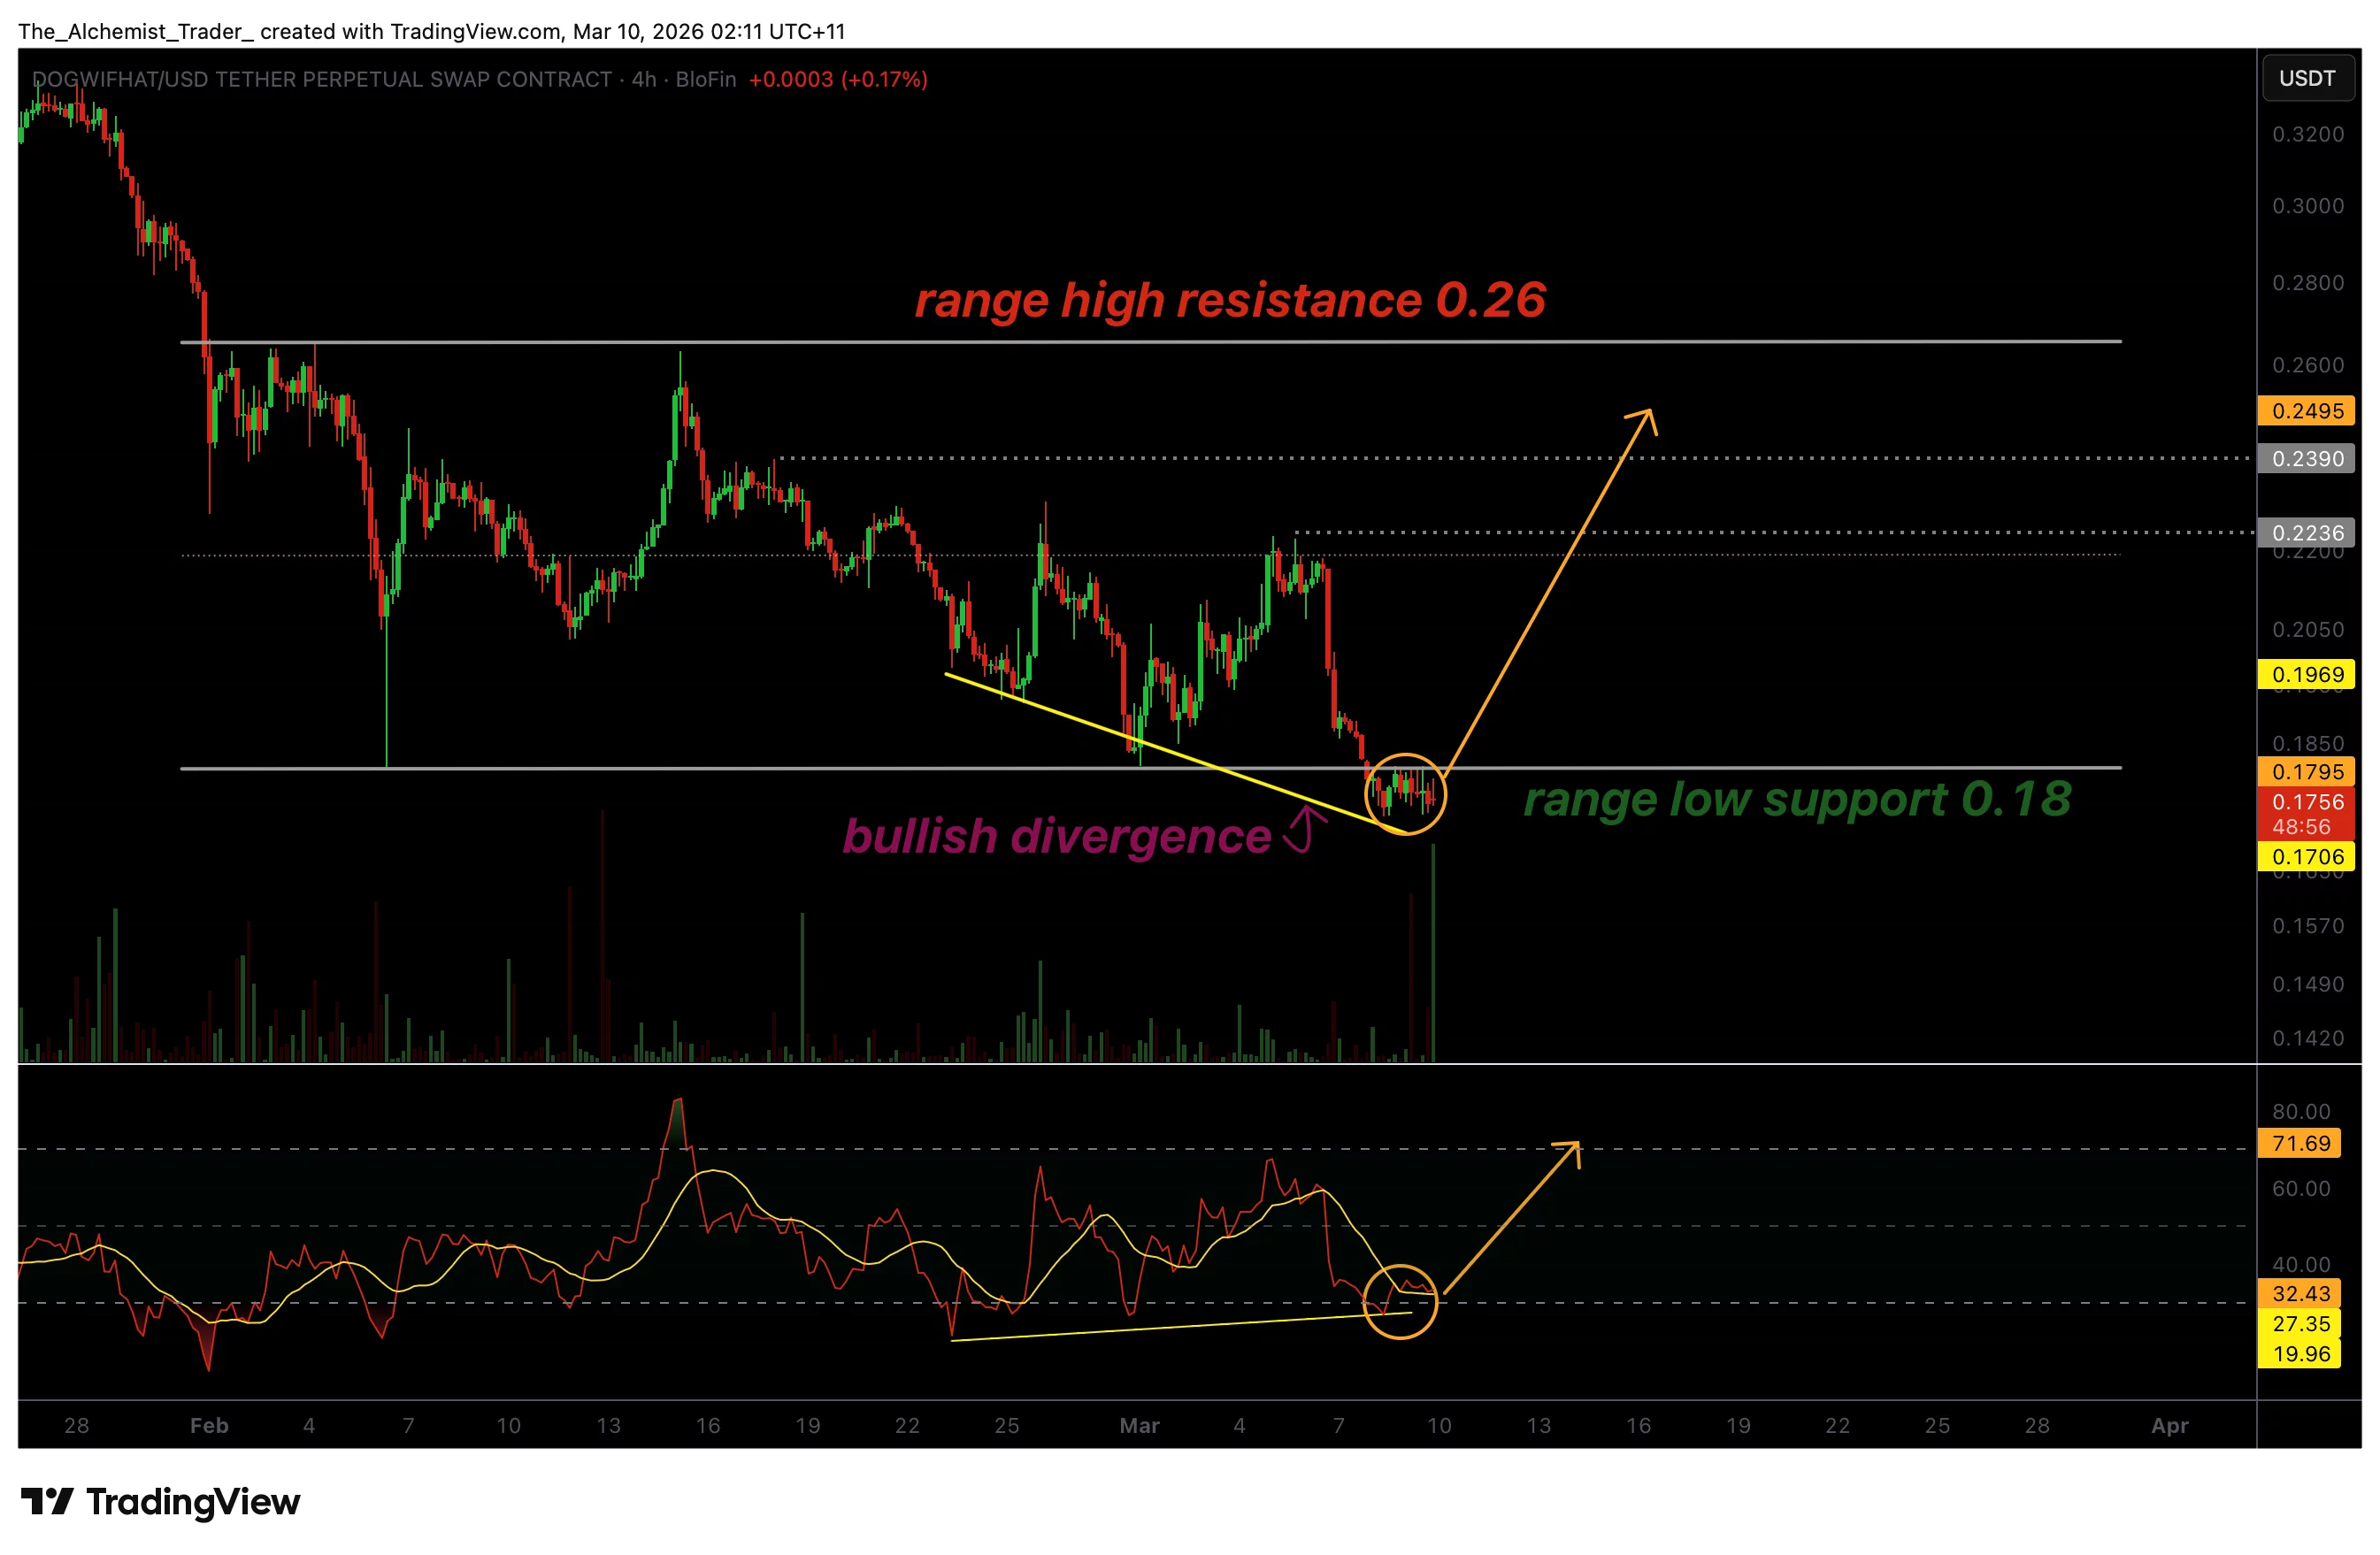
The recent breakdown below the $0.18 level marked an important development in WIF’s market structure. This level previously acted as the range low of the broader trading environment and had provided multiple reactions in previous price cycles. Once price broke below this level, the market entered a lower trading zone where acceptance beneath support began to develop. Sustained trading below a key range boundary typically increases the risk of further downside expansion, but this scenario may be evolving differently due to the appearance of momentum divergence.
One of the most notable signals currently present on the chart is the bullish divergence forming on the Relative Strength Index (RSI). While WIF price action has continued to print lower lows, the RSI indicator has begun forming higher lows.
This divergence between price and momentum often indicates that selling pressure is weakening and that the bearish trend may be losing strength. In many cases, bullish divergence appears during late stages of a downtrend when the market is preparing for a potential reversal or relief rally.
However, momentum signals alone are not enough to confirm a trend reversal. The broader crypto market also remains under bearish pressure, with Bitcoin and most altcoins still trading significantly below their all-time highs after double-digit declines.
As a result, the key technical confirmation for WIF will be a reclaim of the $0.18 range low. If price can push back above this level and hold it as support, it would suggest that the recent breakdown was likely a deviation rather than a true continuation move. Such a reclaim would shift market structure back into the previous trading range and increase the probability of a rotation toward the upper boundary.
From a broader market structure perspective, range-bound markets tend to rotate between support and resistance levels as liquidity moves between participants. Once a deviation occurs and price re-enters the range, the probability often favors a move toward the opposite side of the range. In WIF’s case, the next major technical target would be the range-high resistance near $0.26.
Volume and momentum behavior will also play an important role in confirming this potential shift. If price begins reclaiming support alongside increasing buying pressure and strengthening RSI momentum, it would add further confirmation that a local bottom may be forming. Conversely, continued rejection below $0.18 would keep the market vulnerable to further downside exploration.
What to expect in the coming price action
WIF remains at a key technical turning point as bullish divergence develops while price trades below major support. A confirmed reclaim of $0.18 would strengthen the case for a deviation and open the door for a rotation toward $0.26 resistance, while failure to reclaim the level could allow bearish momentum to persist.

The PENGU token is up 7% in the past 24 hours.
Pudgy Penguins has officially launched Pudgy World, a free-to-play browser-based game.
Set across a fictional frozen landscape called The Berg, the game features 12 unique towns for players to explore. The central storyline tasks players with helping the character Pengu track down a missing friend named Polly, with mini-games woven throughout. The multiplayer setup means players can explore The Berg together in real time.
The launch marks a significant milestone for one of crypto’s most successful crossover brands. Pudgy Penguins was purchased by current CEO Luca Netz in 2022 and has since evolved from a forgotten relic of 2021’s NFT summer into one of the top collections in the NFT space.
What has set Pudgy Penguins apart from its peers is an aggressive push into mainstream consumer products. The brand’s IP coverage expanded steadily under Netz, with physical toys featured in Walmart and Amazon, a children’s book deal with Random House, and a mobile game called Pudgy Party, which became the top-ranked mobile racing game in Apple’s App Store within three days of its release.
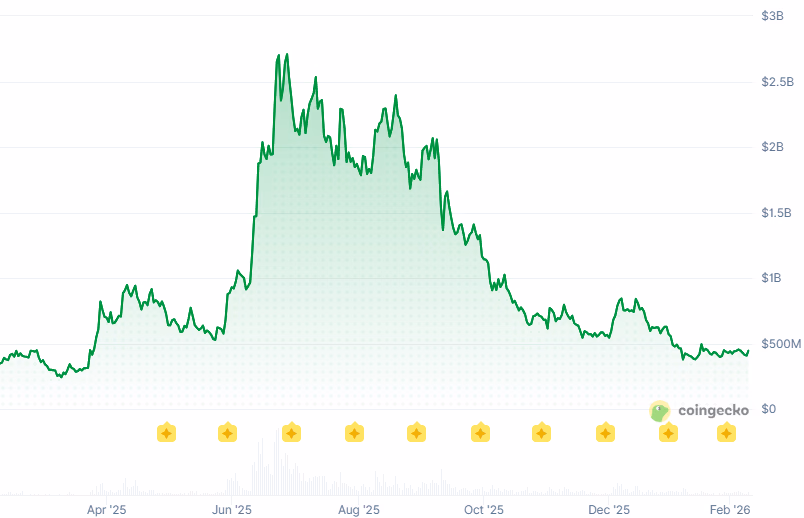
The ecosystem’s PENGU token is up 7% in the past 24 hours, trading at a $440 million market capitalization.

Pudgy World is designed to bring the brand’s broad audience, spanning physical retail, social media, mobile gaming, and crypto, into a single, shared interactive space.


Disclosure: This article does not represent investment advice. The content and materials featured on this page are for educational purposes only.
Traders compare crypto futures platforms as derivatives activity grows across major exchanges.
Summary
- Futures platforms BTCC, Binance, and Bybit differ in leverage, fees, and margin systems as derivatives trading grows.
- BTCC offers up to 500x leverage, compared with Bybit’s 200x and Binance’s 125x on major perpetual futures pairs.
- Binance, Bybit, and BTCC all provide USDT perpetual futures, but only Binance and Bybit offer coin-margined contracts.
Growing institutional and retail participation in cryptocurrency derivatives markets has prompted traders to examine the technical specifications of futures trading platforms more closely. Comparisons between BTCC, Binance, and Bybit reveal differences in leverage availability, trading costs, margin systems, and platform features.
Leverage and fees
Higher leverage allows traders to control larger positions with smaller margin deposits, but also increases the risk of liquidation when prices move against a position.
Bybit offers up to 200x, and Binance caps leverage at 125x on major perpetual futures pairs. BTCC offers the highest maximum leverage of the three platforms, at up to 500x on select perpetual futures contracts.
On maker fees — charged when a trader places a limit order that adds liquidity to the order book — Binance and Bybit both charge 0.02%, while BTCC charges 0.025%. On taker fees — charged when a trader executes a market order — Bybit charges the highest rate at 0.055%, followed by BTCC at 0.045% and Binance at 0.04%. All three platforms offer tiered fee structures in which higher trading volumes or account balances qualify users for reduced rates.
Contract types and margin modes
All three exchanges offer USDT-margined perpetual futures contracts, which settle in Tether (USDT). Binance and Bybit additionally offer coin-margined contracts, which allow traders to use cryptocurrencies such as Bitcoin or Ether as collateral. BTCC focuses on USDT perpetual contracts.
Cross-margin and isolated margin modes are available across all three platforms. Binance and Bybit also offer portfolio margin, which allows traders to offset positions and reduce capital requirements. BTCC does not list portfolio margin as a feature.
All three platforms maintain insurance funds intended to cover losses that exceed a trader’s margin balance during liquidation events. Each exchange also employs an auto-deleveraging mechanism, which reduces the positions of profitable traders when insurance funds cannot fully absorb a liquidation shortfall. Margin calls are issued across all three platforms when a trader’s equity falls below maintenance thresholds.
Demo and simulated trading
BTCC offers a demo trading environment that operates within the main platform interface using virtual funds. Binance and Bybit provide simulated trading through separate testnet environments. Testnets are distinct from demo environments, as they run on separate blockchain infrastructure rather than replicating live platform conditions.
BTCC was founded in 2011, making it the oldest of the three exchanges. Binance launched in 2017 and grew to become one of the largest cryptocurrency exchanges by trading volume. Bybit was founded in 2018 with a focus on derivatives trading.
The three platforms offer comparable core functionality in several areas, including USDT perpetuals, cross and isolated margin modes, insurance funds, and tiered fee structures, while differing on leverage ceilings, taker fee rates, contract variety, and the scope of available margin tools.
Disclosure: This content is provided by a third party. Neither crypto.news nor the author of this article endorses any product mentioned on this page. Users should conduct their own research before taking any action related to the company.
Bitcoin whipsawed between $65k and $69k as oil spiked then retreated, underscoring that macro energy shocks still script BTC’s role as a global risk barometer.
Summary
- Bitcoin rebounded from $65k toward $69k after oil slid from near $120 on strategic-reserve headlines, tying BTC’s bounce directly to easing energy shock fears.
- Traders framed BTC as a high-beta gauge of global risk appetite, watching the $67k area as a key line in the sand for whether the rally sticks.
- Spot data show BTC hovering near $68.6k with over $50.7b in volume as Ethereum and Solana lag or outperform on the risk curve rotation.
Bitcoin (BTC) reminded markets on Monday that macro still writes the script. After sliding to roughly $65,000 earlier in the session, the benchmark cryptocurrency snapped back toward $69,000 as crude oil retreated sharply from near $120 per barrel on headlines that strategic reserves could be tapped. CoinMarketCap summed it up bluntly: “Bitcoin recovered to around $69,000 after falling to $65,000, rebounding as oil pulled back sharply from near $120 per barrel following reports that strategic reserves may be tapped.”
That sequence – energy shock fears, then relief, then a crypto bid – was not lost on traders watching the tape. One macro‑focused account responded that “when energy shock fears fade, crypto catches a bid almost immediately,” framing BTC as a high‑beta expression of global risk appetite rather than an isolated digital asset. Another observer at Zeconomy wrote: “From 65K to 69K on an oil pullback is a good reminder that BTC still trades like a global risk barometer,” underlining how quickly flows rotate once pressure eases in commodities.
At the same time, positioning around key levels remains central to how this move is being read. Aequalis Lab argued that “if it holds 67k, next week could get spicy,” pointing to the mid‑$60K band as a line in the sand for trend traders. Short‑term sentiment, at least among vocal bulls, has already flipped back toward accumulation: one trader insisted that “$69K proves the dip was just a blip, accumulation continues,” while another suggested that future “nostalgia about buying BTC at current levels” will dominate once prices move to “levels that seem somewhat unbelievable to most of the market.”
For now, spot data show Bitcoin trading near $68,600, up about 2.5% over the last 24 hours, with 24‑hour turnover above $50.7 billion and a market capitalization north of $1.35 trillion. Ethereum changes hands around $2,011, down roughly 3.7% on the day with a market cap of about $260.2 billion, while Solana trades near $83.76, up roughly 2.7% over the same period as liquidity rotates down the risk curve.

Analysts say Bitcoin increasingly sits inside ETFs and corporate treasuries.
Bitcoin reserves held on centralized exchanges have fallen back to levels last seen in 2019. Data shared by crypto market analyst Dark Fost shows that exchange reserves have been steadily declining since 2022.
This trend has accelerated following the collapse of the FTX exchange.
Bitcoin Supply Migration
In November 2022 alone, more than 325,000 BTC were withdrawn from exchange reserves as investors moved their assets off centralized platforms. As a result of this continued outflow, total BTC reserves on exchanges accessible to retail investors have now dropped to roughly 2.7 million BTC.
Among these platforms, Binance alone accounts for approximately 20% of the remaining reserves. When platforms primarily used by professional investors are included in the analysis, Coinbase Advanced ranks first, holding close to 800,000 BTC. However, this figure is still about 200,000 BTC lower than the level recorded in July 2025.
Dark Fost stated that while the FTX collapse played a major role in encouraging investors to hold assets in private wallets, two additional developments have also contributed to the reduction in exchange balances. The first is the launch of spot Bitcoin exchange-traded funds in January 2024. At the time of their introduction, exchange reserves were still above 3.2 million BTC. Since then, ETFs have accumulated around 1.3 million BTC, which represents roughly 6.7% of Bitcoin’s total supply and effectively removes that amount from exchange liquidity.
The second factor is the growth of digital asset treasury companies (DATs) that hold Bitcoin as a reserve asset. Collectively, these firms now control about 1.1 million BTC, or nearly 5% of the total supply. Both ETF holdings and corporate treasuries represent a growing share of Bitcoin supply held in structured financial vehicles.
“Over the long term, this transformation could play an important role in market liquidity and price formation, even if these structural effects always take time to fully materialize.”
Geopolitical Tensions Halt Breakout
Against this backdrop of changing supply patterns, Bitcoin entered the second week of March under pressure as markets remained focused on escalating tensions in the Middle East. The cryptocurrency recently failed a breakout attempt above $70,000 as the ongoing US-Iran conflict contributed to broader market uncertainty. Despite the pullback, crypto trader and analyst Michaël van de Poppe said BTC’s current price action does not represent a worst-case scenario.
You may also like:
In his latest post on X, the trader noted that Bitcoin continues to trade within a range but described the performance as relatively strong given the current market conditions. According to him, oil prices surged about 15% on Monday to their highest levels since 2022, while gold and commodities declined, and the Nasdaq fell significantly. Van de Poppe added that if the US stock market opens higher and oil prices begin to correct, Bitcoin could regain momentum toward $70,000.
Binance Free $600 (CryptoPotato Exclusive): Use this link to register a new account and receive $600 exclusive welcome offer on Binance (full details).
LIMITED OFFER for CryptoPotato readers at Bybit: Use this link to register and open a $500 FREE position on any coin!


Mining Bitcoin on a desktop in 2026 may sound simple, but is it profitable? Do rising network difficulty and energy costs mean the end of PCs as Bitcoin mining equipment?


Already on a tear ahead of the war in Iran, Circle (CRCL) might be an unlikely beneficiary of the conflict.
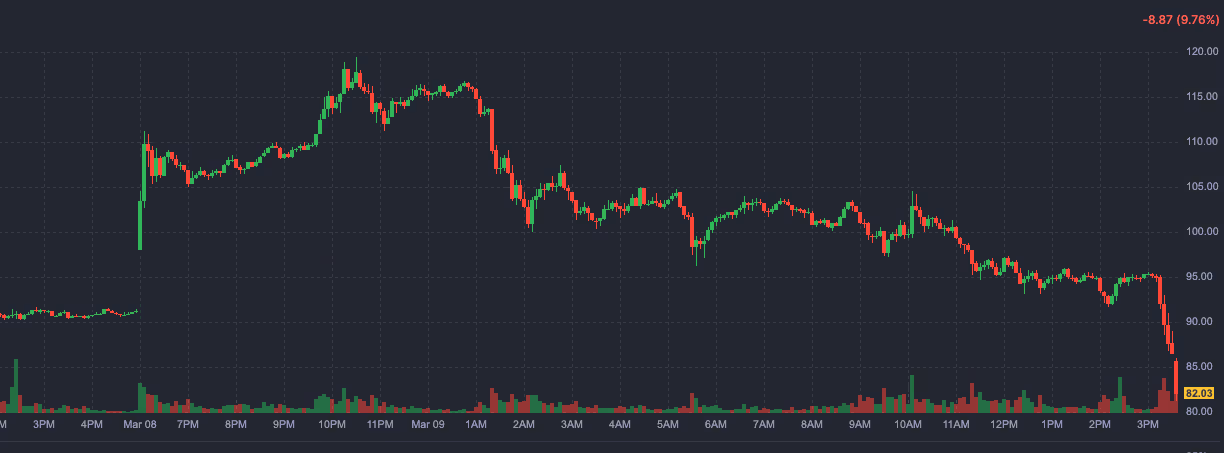
The stock rose 10% on Monday, outperforming other crypto-linked equities, with the shares now up by 86% over the past month, though they remain sharply lower since their peak post-IPO frenzy last summer.
Japanese bank Mizuho said part of the Circle rally reflects the jump in oil prices following the escalation in Middle East tensions. Higher crude prices could reignite inflationary pressures, potentially reducing expectations for Federal Reserve rate cuts.
Other things being equal, stablecoin issuers are thought to benefit from higher interest rates as that means higher yields on their invested dollars.
Indeed, oil prices have surged since hostilities erupted in the Gulf, with WTI crude up roughly 35% since Feb. 28. Higher energy prices tend to fuel inflation and can limit central banks’ ability to cut interest rates.
Positioning has surely played a role as well.
While the company reported solid growth in USDC supply in its fourth-quarter earnings, analysts say the magnitude of the move likely reflected a crowded short trade ahead of the release.
“The magnitude of the move wasn’t purely about the headline numbers. Positioning was the real catalyst,” said Markus Thielen, founder of 10x Research.
According to his data, hedge funds had accumulated sizable bearish bets ahead of the report. That setup created what Thielen described as a “high-probability short squeeze rather than a fundamental re-rating.”
Short interest currently stands at about 13% of the float, equivalent to roughly two days to cover, according to FactSet data.
Read more: Circle moves $68 million in just 30 minutes by using its own stablecoin for internal payments


Crypto brokerage company Blockchain.com is expanding into Ghana as part of a broader push to grow its presence across Africa, following rapid user growth in Nigeria over the past year.
The company said it plans to offer Ghanaian users access to its trading platform as it builds out regional infrastructure and explores additional African markets.
The expansion follows strong growth in Nigeria, where the company launched retail operations last year and reported more than a 700% increase in brokerage transaction volume. According to the company, the most traded assets on its platform in the country have been Bitcoin (BTC), Tether (USDT) and Tron (TRX).
The company said Ghana has also seen rising activity on its platform ahead of the formal launch, with active users increasing 140% over the past year and transaction volumes climbing 80%.
“We are actively collaborating with Ghanaian officials and regulators to help build a regulatory framework and have already established local compliance representation in Ghana,” a Blockchain.com spokesperson said.
The company said expanding local payment infrastructure will be important as it enters the Ghanaian market. “Given how widely used mobile money is in Ghana, integration with the mobile money ecosystem is a key focus,” the spokesperson told Cointelegraph.
Blockchain.com said it is building local teams to support operations, partnerships and regulatory engagement as it expands across the region. The company already operates in more than 70 jurisdictions worldwide and plans to enter additional African markets as part of its long-term growth strategy.
Data from Chainalysis shows Nigeria consistently ranks among the world’s leading countries for grassroots crypto adoption, with activity driven by remittances, currency volatility and a large mobile-first user base.
Founded in 2011 and headquartered in London, Blockchain.com is a cryptocurrency platform that offers trading services, digital asset wallets and other crypto infrastructure to users worldwide.
Related: Uganda opposition leader promotes Bitchat amid fears of internet blackout
Crypto adoption grows across Sub-Saharan Africa
Crypto use has grown quickly across Sub-Saharan Africa in recent years. The region received more than $205 billion in onchain crypto value between July 2024 and June 2025, a 52% increase from the previous year, making it the third-fastest-growing crypto market globally, according to a September report from Chainalysis.
Nigeria dominates crypto activity, receiving more than $92 billion during the period. South Africa, Ethiopia, Kenya and Ghana rank among the next largest markets. Analysts say demand is often driven by cross-border payments, remittances and efforts to hedge against currency volatility.
Speaking at the World Economic Forum Annual Meeting in Davos in January, former UN under-secretary-general Vera Songwe said stablecoins are increasingly used for remittances and cross-border payments. She said traditional money transfers often cost about $6 for every $100 sent, while stablecoins can reduce fees and settle transactions in minutes.
Songwe added that persistent inflation in several African economies and limited access to banking services are also pushing more users toward digital dollar alternatives.
Earlier this month, the executive chairman of Africa Bitcoin Corporation Stafford Masie said that Bitcoin functions as everyday money in some African communities rather than primarily as a store of value. Speaking on the Coin Stories podcast with Natalie Brunell, Masie said some merchants in local circular economies accept payments in satoshis instead of fiat currencies.
Meanwhile, Africa recorded the highest median stablecoin-to-fiat conversion spreads among tracked regions in February, according to data from payments infrastructure company Borderless.xyz.
Magazine: The debate over Bitcoin’s four-year cycle is over: Benjamin Cowen


Michael Saylor’s latest bitcoin binge — 1,360 Bitcoin in a single day via strc — shows corporate treasury demand actively absorbing supply even as retail second‑guesses the cycle’s next leg.
Summary
- Bitcoin magazine flags saylor’s strategy buying 1,360 btc in one day via strc, a new daily record that stunned market observers.
- Traders frame the move as balance‑sheet absorption, with institutions quietly stacking while retail sentiment stays nervous and reactive.
- The purchase, worth about $93m, lands in a thin‑float market already driven by big treasury buyers, tightening liquidity and reinforcing the up‑only narrative.
Michael Saylor’s Bitcoin (BTC) strategy just set a new daily speed record – and it landed right in the middle of a macro‑driven liquidity squeeze. Bitcoin Magazine reported that “it’s now estimated that Michael Saylor’s Strategy bought 1,360 BTC today via STRC, a new daily record,” underscoring how aggressive corporate accumulation has become even as retail debates whether the cycle is long in the tooth.
The reaction from market participants was immediate and telling. “1,360 BTC in a single day is wild. Corporate Bitcoin accumulation isn’t slowing down,” one commentator wrote, capturing the sense that institutional balance sheets are quietly absorbing supply while sentiment on social feeds remains jumpy. Another observer framed the move as structural rather than cosmetic: “1,360 BTC in a single day… that’s not buying, that’s absorption. While retail hesitates, institutions are quietly stacking. Supply keeps shrinking. The Bitcoin game is simple: They print. Saylor buys.” A third voice put it even more bluntly: “Saylor is single-handedly draining the liquidity pool. 1,360 BTC in a day is aggressive accumulation.”
This is not happening in a vacuum. Live market data show Bitcoin trading around $68,583, up roughly 2.5% over the past 24 hours, with a 24‑hour trading volume of about $50.75 billion and a market capitalization in excess of $1.3 trillion. Ethereum changes hands near $2,014, having climbed about 3.9% on the day, with 24‑hour turnover around $30.1 billion and a market cap of roughly $260.2 billion. Solana trades close to $83.76, up approximately 2.7% in the last 24 hours, on volumes near $5.83 billion and a market value of about $52.77 billion.
In other words, Saylor’s 1,360 BTC haul – at current prices worth roughly $93 million – landed in a market that is already tight on float and increasingly dominated by large, repeat buyers rather than marginal speculators. For traders trying to read the next leg, the message from this episode is straightforward: corporate treasury demand remains deeply pro‑cyclical, willing to lean into volatility and, in the process, reshape the liquidity profile of Bitcoin’s up‑only narrative.

Wyoming Senator Cynthia Lummis, a veteran advocate for crypto policy, is reviving a tax-focused approach as lawmakers weigh a sweeping digital asset framework. She, who has signaled plans to leave the Senate in 2027, used a recent platform to push for a de minimis exemption on small cryptocurrency transactions, arguing it could clarify when a sale becomes a capital gains event versus when digital assets simply function as a medium of exchange. In a CNBC interview from March 2026, Lummis underscored the need for a practical tax treatment that mirrors everyday usage of digital money, particularly for routine on-chain activity. The conversation comes as committees on both sides of Capitol Hill study a concept that would make it cheaper to transact with Bitcoin (CRYPTO: BTC) and other assets without triggering immediate tax consequences.
Key takeaways
- The proposal would extend a de minimis tax exemption to crypto transactions under $300, with an annual cap of $5,000, aligning with a standalone bill introduced in July 2025.
- The aim is to let Bitcoin (CRYPTO: BTC) serve as a practical means of exchange in everyday purchases while preserving a framework for capital gains when appropriate.
- Progress on the broader crypto market structure bill remains unsettled in the Senate, with concerns about tokenized equities and regulatory responsibilities slowing movement after Coinbase (EXCHANGE: COIN) signaled opposition to the text as written.
- President Donald Trump amplified the policy debate by urging banks to strike a deal with the crypto sector, arguing that the CLARITY Act should not be used as leverage in financing negotiations.
- Senator Lummis’s influence in the debate persists even as she disclosed she will not seek reelection, with her last day in January 2027.
Tickers mentioned: $BTC, $COIN
Sentiment: Neutral
Market context: The stalled track of the crypto market structure bill highlights the tension between innovation in digital assets and the traditional regulatory framework, a dynamic playing out amid ongoing debate over tokenized securities, stablecoins, and cross-border compliance. The outcome will influence how market participants plan liquidity, tax strategies, and regulatory alignment as the ecosystem matures.
Why it matters
The push for a de minimis exemption on crypto transactions reflects a broader effort to reconcile the fast pace of digital asset innovation with the slow-moving machinery of fiscal policy. If enacted, the exemption could reduce friction for everyday crypto use, encouraging individuals to transact with smaller sums without immediate tax penalties and potentially increasing on-chain activity in economies where digital currencies coexist with traditional payment rails. For users, this could mean a more predictable tax treatment for micro-transactions, while investors and developers may reassess the timing and scale of on-chain experiments within a clarified tax landscape.
However, the debate is far from theoretical. The market structure bill—part of a larger regulatory package—has become entangled in the broader questions surrounding tokenized equities, the division of responsibilities among U.S. financial regulators, and the ethics surrounding potential conflicts of interest in policy design. Coinbase (EXCHANGE: COIN) has raised concerns about the text as drafted, arguing that certain provisions could hamper the innovation curve or expose exchanges to unintended liabilities. The discord contributed to a postponement of a planned Senate markup, underscoring how even widely anticipated reforms can stall when industry stakeholders push back on specifics.
On the political front, the discourse extends beyond technical provisions. President Trump, actively staking a position in the crypto-policy debate, urged banks to negotiate in good faith with the industry and warned against treating the CLARITY Act as leverage in financial negotiations. The public commentary illustrates how crypto regulation has become a partisan, high-stakes issue with implications for monetary policy, banking relationships, and the competitive positioning of U.S. firms in a global, rapidly digitalizing market. The practical effect is a policy environment that remains uncertain, even as lawmakers repeatedly emphasize the importance of clarity and consumer protection for market participants.
Additionally, the underpinnings of the policy debate touch on the broader macro and regulatory backdrop. Tokenized securities, yield-bearing stablecoins, and the governance models powering digital assets all feed into the legislative calculus, shaping whether a future framework will encourage responsible innovation or risk creating a patchwork of inconsistent rules across asset classes. The discussion is not merely about whether to tax crypto transactions differently; it is about how to design a coherent regime that can scale with evolving technologies while maintaining investor confidence and financial stability.
The conversation around de minimis tax exemptions is also a reminder of Lummis’s long-standing role in crypto policy. As a member of the Senate Banking Committee, she has consistently positioned herself at the intersection of technology policy and financial regulation. Her open commitment to the idea of a threshold under which crypto transactions would not trigger capital gains aligns with the broader aim of enabling practical usage of digital assets in everyday commerce, as lawmakers balance risk, consumer protection, and innovation.
Looking ahead, the regulatory path remains highly uncertain. The CLARITY Act’s fate in the Senate hinges on a delicate balance of concerns from both parties, industry perspectives, and the evolving pulse of the market. Whether the de minimis proposal becomes a centerpiece of a larger tax reform package or remains a policy experiment will depend on negotiations within committees, potential amendments, and the ability of proponents to secure cross-party support in a political environment that has, at times, treated crypto policy as a proxy for broader debates over technology and finance.
For market participants, the unfolding discourse signals that concrete tax-based incentives and regulatory clarity could become more tangible in the months ahead, even as the exact contours of a final bill remain in flux. The interplay between tax policy, regulatory oversight, and industry input will shape how participants plan their capital allocations, user onboarding, and product strategies in a landscape that continues to evolve rapidly.
Additional context around these discussions includes references to prior reporting on Lummis’s policy initiatives and the evolving stance of major industry players. See the July 2025 standalone crypto tax bill introduction and the subsequent discussions around the CLARITY Act’s provisions and treatment of tokenized assets, as well as coverage of Coinbase’s publicly stated concerns about the bill’s current form. For broader regulatory commentary on how policy is shaping the crypto sector, related analyses consider how the “four-year cycle” debates and other macro considerations interact with on-chain activity and institutional engagement.
Video coverage of Lummis’s remarks and related policy discussions can be found in the CNBC interview linked earlier, and further exploration of the legislation and industry responses is available through targeted reports and official statements. The evolving conversation underscores that, even as individual provisions gain or lose momentum, the path to a cohesive, enforceable framework for digital assets will require ongoing negotiation among lawmakers, regulators, and market participants.
To watch the referenced CNBC interview and review the broader policy discussions, visit the linked sources and the related Cointelegraph analyses that tracked the standalone crypto tax bill and the market structure debate as it unfolded on Capitol Hill.
Video source: CNBC interview
Further context on the standalone bill and market-structure considerations: Lummis’s standalone crypto tax bill and the CLARITY Act discussions with Coinbase.
Trump’s take on the crypto-banking dynamic can be explored in the coverage here: Trump on banks and the stalled bill.
For additional perspectives on policy debates and market responses, see related analyses that examine the evolving stance of regulators and industry players in this space.
A wild 24 hours continued in all markets after President Trump said the war against Iran could be over soon.
The action against Iran is “very far ahead” of what was expected to be a four-to-five-week time frame, said Trump in late-afternoon comments. He is expected to give updates on the situation at 5:30 pm ET.
Already in the midst of a sharp reversal higher after plunging Sunday evening as oil soared as much as 30%, crypto and equity markets added to gains following the comments.
Just ahead of the close, the Nasdaq was ahead 1.25% and S&P 500 0.8%. Bitcoin at just above $69,000 was up 2.4% over the past 24 hours.
Oil, meanwhile, tumbled even further. After rising as much as 30% to $120 per barrel on Sunday evening, WTI crude plunged all the way back to $85, now lower by 6% for the day.

Crypto-related stocks added to Monday’s gains, with Circle (CRCL) up 10% while Strategy (MSTR) and Coinbase (COIN) were 5% and 2% higher, respectively.
Pudgy Penguins Launches ‘Pudgy World’ Browser Game

Days of our Lives 2-Week Spoilers March 9-20: EJ Reveals Shocking News & Melinda Faces Dangerous Temptation!

Pinito victorious in 2026 Aspiration Quality post Queensland Oaks second

Smart energy pays enters the US market, targeting scalable financial infrastructure

Why Israel is blocking foreign journalists from entering

Bitcoin: We’re Entering The Most Dangerous Phase

BITCOIN: Get Ready for This MAJOR Target! (soon) – BTC Price Prediction Today

BITCOIN PRICE TRAP: BlackRock Buying Now!!! – Bitcoin News Today, Ethereum & Altcoins

Pinky Cole – Slutty Vegan – Bankruptcy Breakdown – Financial Advisor Reacts
-

 Politics7 days ago
Alan Cumming Brands Baftas Ceremony A ‘Triggering S**tshow’
-
Business3 days ago
Form 8K Entergy Mississippi LLC For: 6 March
-

 Fashion3 days ago
Weekend Open Thread: Ann Taylor
-

 News Videos9 hours ago
10th Algebra | Financial Planning | Question Bank Solution | Board Exam 2026
-

 Crypto World6 hours ago
Paradigm, a16z, Winklevoss Capital, Balaji Srinivasan among investors in ZODL
-

 Tech5 days ago
Bitwarden adds support for passkey login on Windows 11
-
 Sports4 days ago
499 runs and 34 sixes later, India beat England to enter T20 World Cup final | Cricket News
-

 Sports2 days ago
Three share 2-shot lead entering final round in Hong Kong
-

 Sports2 days ago
Braveheart Lakshya downs Lai in epic battle to enter All England Open final | Other Sports News
-

 Business6 days ago
Guthrie Disappearance Enters Fifth Week as Family Visits Memorial
-

 NewsBeat4 days ago
Piccadilly Circus just unveiled ‘London’s newest tourist attraction’ and it only costs 80p to enter
-

 Politics3 days ago
Top Mamdani aide takes progressive project to the UK
-

 Business1 day ago
Search for Nancy Guthrie Enters 37th Day as FBI Probes Wi-Fi Jammer Theory
-

 Entertainment3 days ago
Hailey Bieber Poses For Sexy Selfies In New Luscious Lip Thirst Traps
-
 Sports7 days ago
Jack Grealish posts new injury update as Man City star enters crucial period
-

 Tech7 hours ago
Despite challenges, Ireland sixth in EU for board gender diversity
-

 Crypto World5 days ago
New Crypto Mutuum Finance (MUTM) Reports V1 Protocol Progress as Roadmap Enters Phase 3
-

 Tech5 days ago
ACIP To Discuss COVID ‘Vaccine Injuries’ Next Month, Despite That Not Being In Its Purview
-
Entertainment5 days ago
Harry Styles Has ‘Struggled’ to Discuss Liam Payne’s Death
-

 Business2 hours ago
Search Enters 39th Day with FBI Tip Line Developments and No Major Breakthroughs