

Crypto World
Will It Shock Gold & Silver?
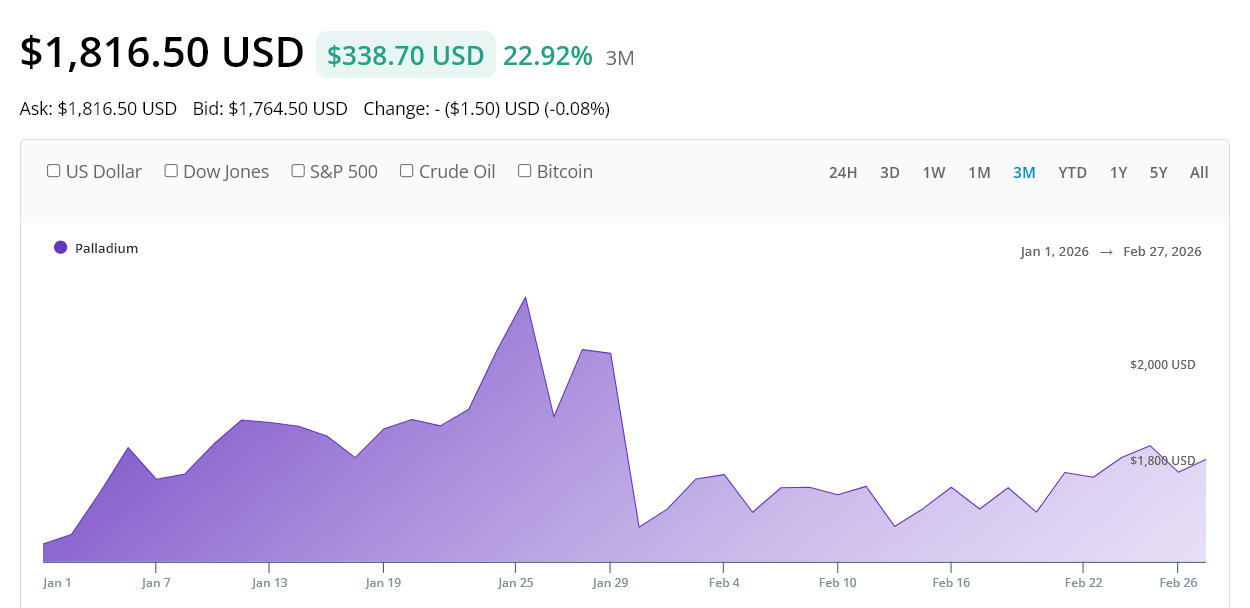
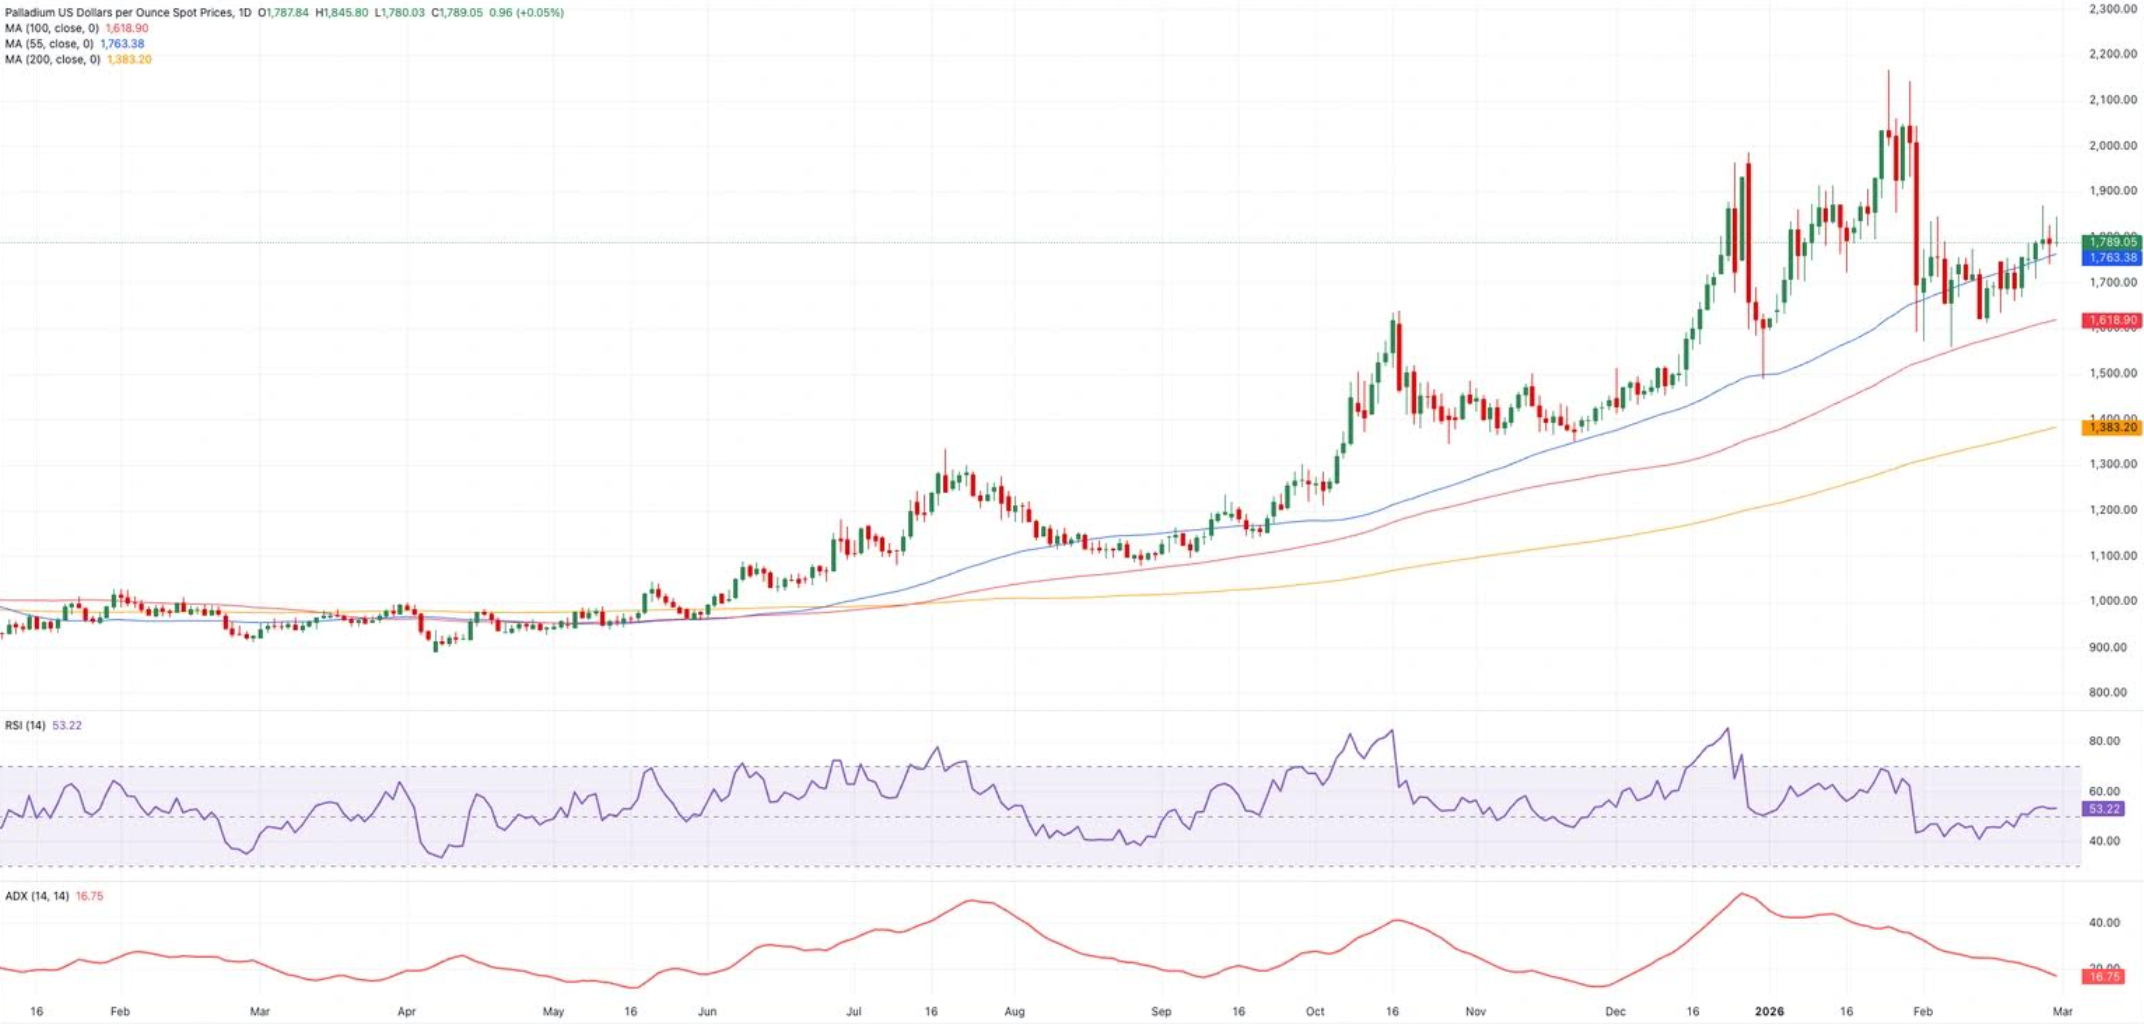
Few major commodities have displayed the kind of price volatility Palladium has since 2020. After a wild ride, boom and bust included, the price of the metal approaches a key area that will help determine its medium- and long-term outlook.
In the space of just a few years, the metal surged above $3,400 during a supply-driven panic, only to collapse back toward $1,000 as industrial fears, substitution dynamics and the electric vehicle transition narrative took hold.
The amplitude of that move rivals some of the most dramatic commodity cycles of the past two decades.

From Scarcity Panic to Structural Unwind
The 2020-2022 rally was fuelled by a perfect storm: tight supply, heavy reliance on Russian production, strong autocatalyst demand, and limited above-ground inventories.
When geopolitical tensions intensified, the scarcity premium exploded.
But blow-offs rarely stabilise gently.
Once peak fear subsided and EV adoption accelerated, the narrative flipped. Investors began pricing a future where internal combustion
engine demand gradually erodes and platinum substitution gains traction.
As that theme gathered momentum, palladium retraced violently.
By late 2023 and into 2024, the market looked washed out.
Volatility and Reset
The decline toward the $1,000-$1,100 zone coincided with extreme pessimism.
Sentiment shifted from “structural shortage” to “structural obsolescence” in less than 24 months. That kind of narrative swing is typically accompanied by positioning liquidation, and price action reflected it.
Technically, the metal moved back toward long-term support levels that had anchored prior cycles. Momentum indicators reset and volatility compressed. The excess was purged.
2025-2026: Reclaim Phase Underway?
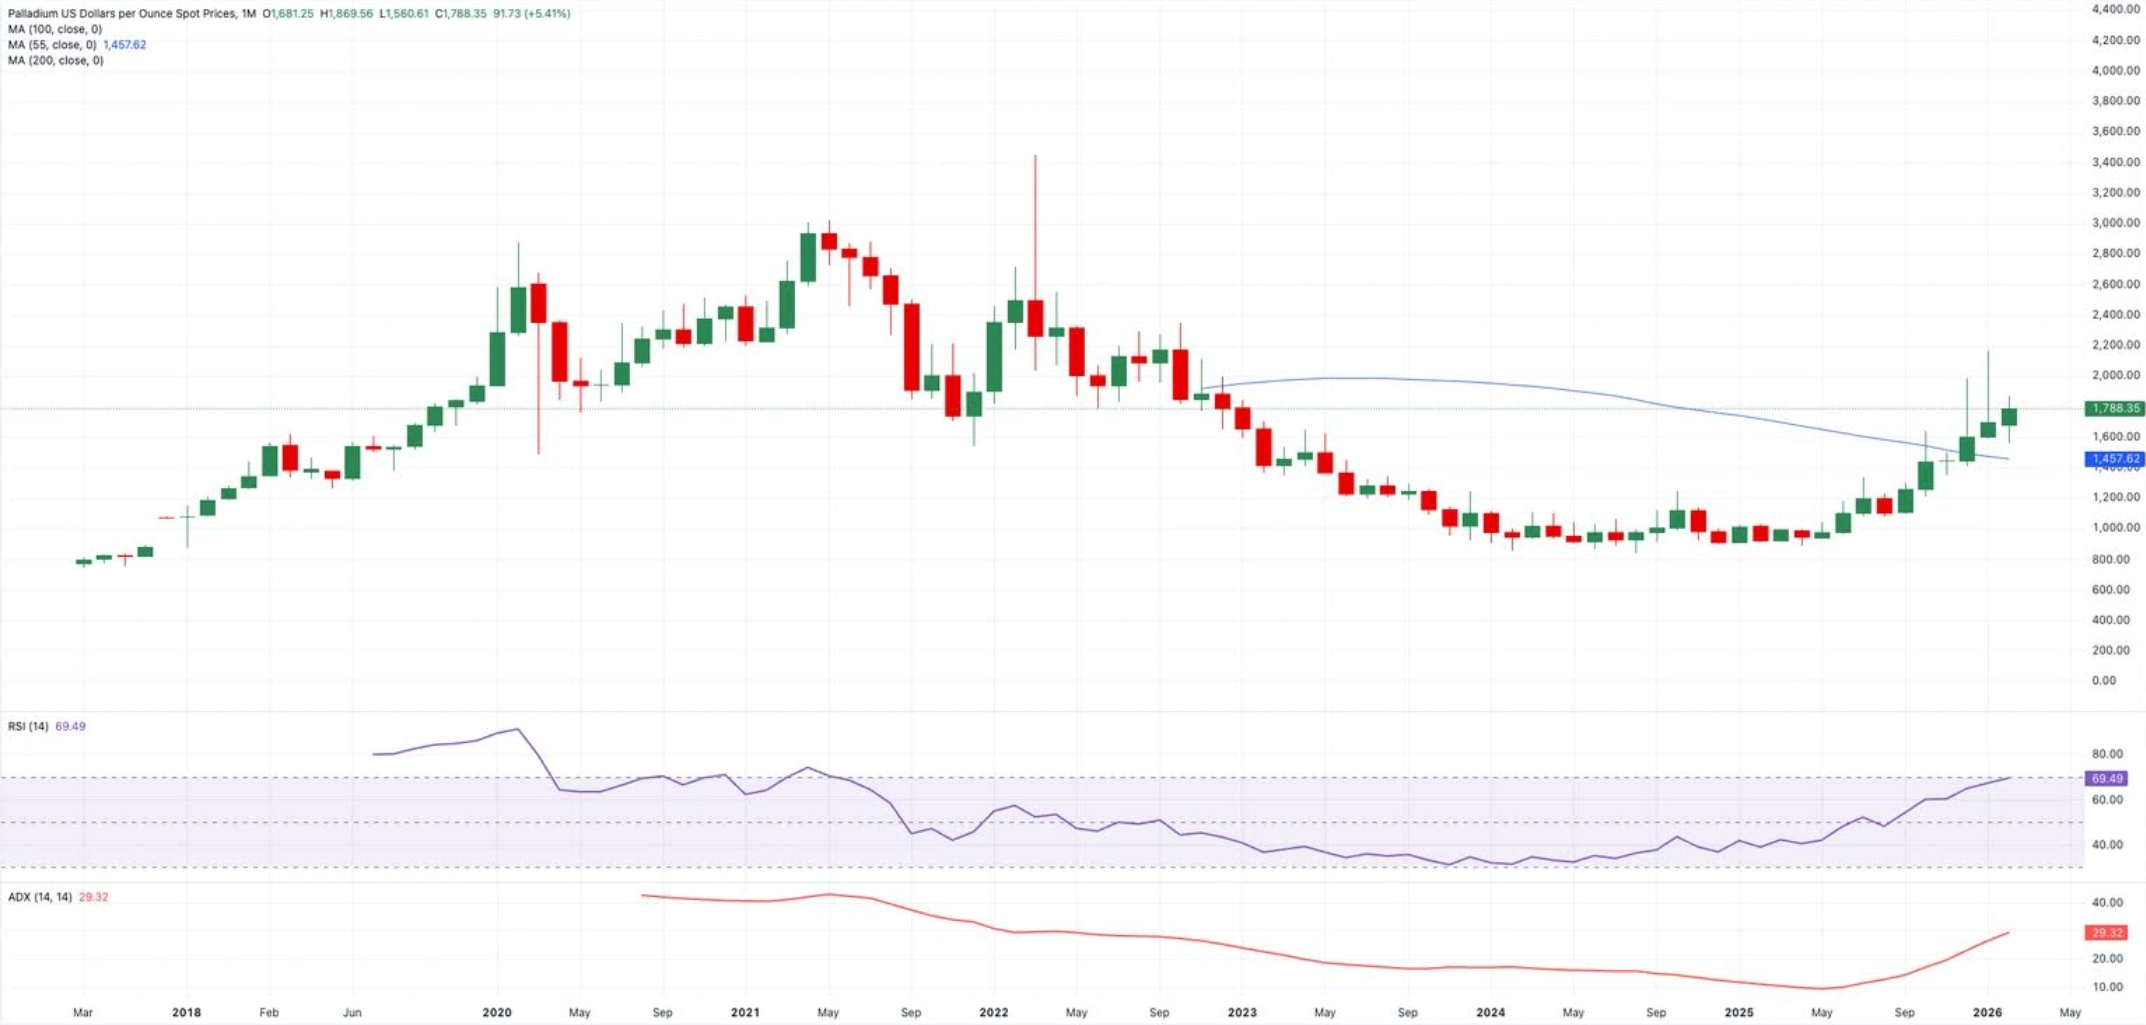
Over the past year, price behaviour has changed meaningfully.
Palladium has reclaimed medium- and long-term moving averages on the weekly and monthly timeframes. Higher lows have begun to form. Momentum has improved without yet reaching euphoric territory.
This rally is not a parabolic breakout, but base construction.
The key zone to watch sits around $1,900-$2,000. A sustained move above that area would mark a structural shift in the longer-term chart and challenge the prevailing “terminal decline” narrative.
Until then, the metal remains in recovery mode, not full revival.
What Drives Palladium?
Unlike Gold, Palladium is not a monetary hedge. It is tied primarily to industrial demand, particularly autocatalysts used in internal combustion and hybrid vehicles.
That means the macro drivers are different:
● Global auto production trends
● China’s manufacturing cycle
● US consumer resilience
● Platinum substitution dynamics
● Russian supply concentration
● The US Dollar trend
If global manufacturing stabilises and hybrid vehicle demand remains robust, Palladium retains its demand base. If the US Dollar softens and industrial sentiment improves, the cyclical tailwind strengthens.
But the structural headwind from electrification remains. This dynamic is precisely what sustains volatility.
Technical Outlook: Compression Before Expansion?
From a chart perspective, Palladium no longer looks like a market in freefall. Instead, it appears to be shifting from liquidation mode into something more constructive.
On the monthly chart, price has managed to climb back above its 55-month moving average and is now pressing up against the 100-month average in the $1,600-$1,700 area.
That may sound technical, but in simple terms it means the metal is rebuilding above levels that had previously defined the long slide.
Momentum has also turned. The Relative Strength Index (RSI), which collapsed during the 2023 washout, has recovered steadily and is now moving back toward bullish territory.
Taken together, the longer-term picture looks less like structural decay and more like a market trying to form a durable base.
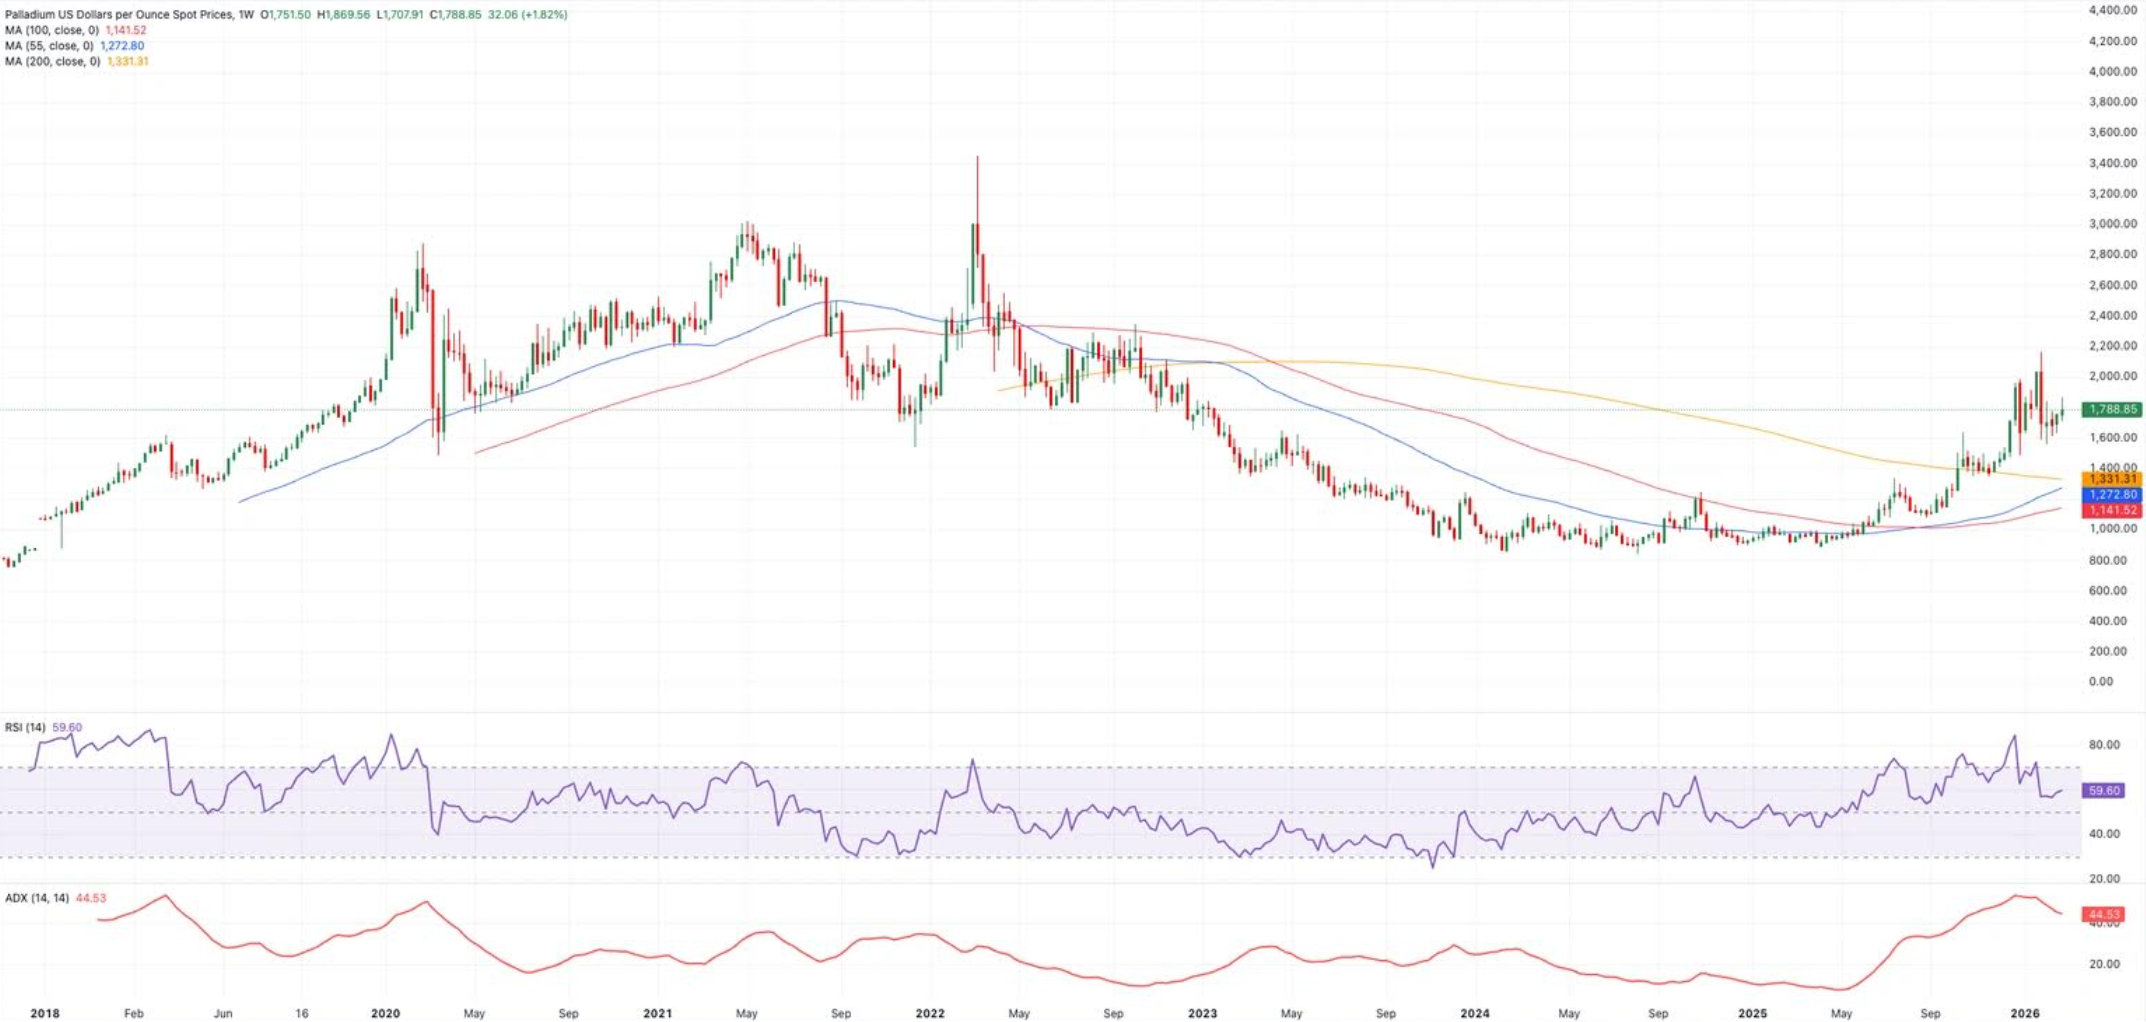
On the weekly chart, higher lows have begun to form since the $1,000 floor held. The trend strength indicators are expanding again, signalling that directional conviction is returning after a prolonged period of compression.
Price is now approaching a key resistance band between $1,900 and $2,000, a zone that previously acted as a distribution during the early stages of the collapse.
A sustained weekly break above that area would materially alter the medium-term outlook and likely trigger a reassessment of the “terminal decline” narrative.
After a big jump, Palladium has settled into a holding pattern around the $1,750-$1,800 area on the daily chart.
The move up has stopped in a fairly orderly way instead of getting too hot. Momentum indicators remain in the middle range, indicating that the market is retaining its gains rather than losing momentum.
For now, the $1,700 to $1,720 range serves as a near-term cushion. On the upside, a convincing break above $1,850 would signal that buyers are ready to press the recovery further.
Until one of those levels gives way, the metal looks more like it is coiling than collapsing.
In short, the technical picture aligns with the broader macro narrative: the worst of the decline appears to be behind us, but confirmation of a new structural leg higher requires a decisive break above the $1,900-$2,000 region.
Until then, Palladium remains a rebuilding story: volatile, sensitive to macro inputs, and poised at an inflection point rather than in a confirmed breakout.
In a market defined by extremes, Palladium may once again be preparing for a decisive move; the only question is whether conviction ultimately resolves higher or whether volatility reasserts itself before a true structural recovery takes hold.


TLDR:
- Korean retail poured $40B into U.S. leveraged ETFs in 2025, with $7B flowing in December alone.
- South Korean regulators imposed training rules to limit retail access to 2x and 3x offshore ETFs.
- The KOSPI has rallied 177% over the past year, driven largely by semiconductor stocks.
- Volatility is rising at market highs, signaling stretched positioning through aggressive leverage.
South Korea’s stock market is sitting on a $40 billion leverage position in U.S. tech assets. The KOSPI has surged 177% over the past year.
On the surface, semiconductor giants Samsung and SK Hynix drove most of that momentum. But a deeper look reveals a retail-driven leverage story that regulators are already scrambling to address.
Korean Retail Floods U.S. Leveraged ETFs at Historic Pace
Korean retail investors allocated $40 billion into U.S. leveraged ETFs throughout 2025. Of that total, $7 billion entered in December alone.
The pace alarmed South Korean financial regulators enough to intervene directly. Authorities imposed mandatory training and mock trading requirements to restrict retail access to these instruments.
The same investor class that fueled the crypto “Kimchi Premium” has rotated into equities. Their appetite for high-risk, high-return products has not cooled. They simply shifted the arena. The move has concentrated enormous exposure into 2x and 3x U.S. tech ETFs.
This is not a niche segment of the market. Korean retail is widely recognized as one of the most active investor bases globally. Their capital flows carry real weight in offshore markets. At $40 billion, their U.S. ETF positioning is now systemically relevant.
The regulatory response confirms the scale of concern. Training requirements and mock trading rules are unusual interventions. They signal that authorities view the current behavior as a structural risk, not just speculative excess.
Rising Volatility at Market Highs Signals Stretched Positioning
Volatility is climbing even as the KOSPI holds near euphoric highs. That combination is historically unusual. Volatility typically spikes during market bottoms, not tops. When it rises alongside highs, it often reflects aggressive call buying and overextended leverage.
According to data flagged by Bull Theory, the current setup involves three overlapping risk layers. A 177% domestic rally almost entirely dependent on semiconductors.
Forty billion dollars parked in highly leveraged offshore tech products. And volatility expanding while prices stay elevated.
If U.S. tech corrects, Korean retail faces pressure on both fronts simultaneously. Their KOSPI holdings decline on weaker chip export expectations. Their leveraged U.S. ETF positions amplify losses in real time. The two portfolios move against them at once.
Seoul’s market is now directly tethered to Nasdaq price action, according to Bull Theory’s analysis. Korean retail has become a significant marginal buyer of high-beta U.S. tech. That linkage runs both ways.

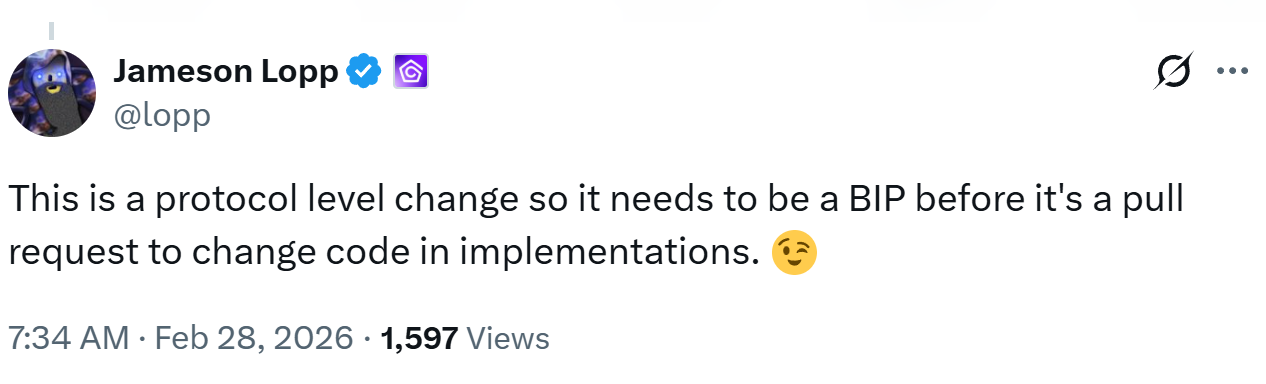
Mark Karpelès, the former CEO of Mt. Gox, is calling on community support for a proposal to recover more than $5.2 billion stolen from his Bitcoin exchange more than a decade ago.
On Friday, Karpelès submitted a proposal on GitHub to add a consensus rule that would allow the 79,956 Bitcoin hacked from Mt. Gox (currently sitting in a single wallet) to be moved to a recovery address without the original private key.
“These coins have not moved in over 15 years. They are among the most well-known and publicly tracked UTXOs in Bitcoin’s history,” he wrote.

Karpelès said that with Mt. Gox trustee Nobuaki Kobayashi already overseeing distributions to creditors, if the coins were recoverable, the existing legal and logistical framework would distribute them to their rightful owners.
“I want to be upfront: this is a hard fork. It makes a previously invalid transaction valid. All nodes would need to upgrade before the activation height. I’m not trying to disguise that fact or sneak it through as something else,” he added.
However, Karpelès said the proposal wasn’t intended to bypass the Bitcoin development process; instead, it was an attempt to start a discussion with the Bitcoin community.

“The MtGox trustee has declined to pursue on-chain recovery, citing the uncertainty of whether such a consensus change would ever be adopted,” he said.
“This creates a deadlock: the trustee won’t act without certainty, and the community can’t evaluate the idea without a concrete proposal. This patch breaks that deadlock by providing something concrete to discuss.”
Bitcoin immutability at risk, say critics
Karpelès’ proposal saw strong opposition on the online forum Bitcointalk, with most arguing that it would set a bad precedent for Bitcoin, a decentralized cryptocurrency intended to be irreversible and immutable.
“Each time a hack incident [happens], someone will call for another new consensus rule to recover stolen funds. This will destroy the bitcoin concept in full,” wrote “coupable,” who has been a member of the forum since 2015.
“Bitcoin should be independent from what Law Enforcement decides in any [jurisdictions],” said another forum member known as “PrivacyG.”
Karpelès also acknowledged that this would be the strongest argument against the proposal, but argued that the specific case is different enough, as there is both law enforcement and community consensus that the address in question contains Bitcoin stolen from Mt. Gox.
Some who claim to be affected by the Mt. Gox bankruptcy were in favor of the proposal.
“If those coins ever move by whatever mechanism, then I am going to want my share of them back,” said Samson.
“I’m a creditor and have been paid what little was left of my Bitcoin from the bankruptcy – I got about 15% back… I would support obtaining a court order to claim these coins.”
A brief recap of Mt Gox’s collapse
Mt. Gox was once the biggest Bitcoin exchange, operating from 2010 to 2014 and handling 70% of all Bitcoin transactions worldwide.
Its global presence, however, made it a honey pot for hackers, who used weaknesses in Mt. Gox’s security systems in 2011 to transfer out thousands of Bitcoin, while other operational errors led to thousands more Bitcoin being “lost.”
On Feb. 24, 2014, an alleged leaked document claimed that the company was insolvent after losing 744,408 Bitcoin in a theft that was undetected for years.
The exchange filed for bankruptcy protection in Tokyo on Feb. 28, 2014, reporting it had about $65 million in liabilities after losing 750,000 of its customers’ Bitcoin and 100,000 of its own, worth nearly half a billion dollars at the time.
Magazine: Review: The Devil Takes Bitcoin, a wild history of Mt. Gox and Silk Road


Magic Eden, the prominent NFT marketplace best known for its deep roots in the Solana blockchain ecosystem, is set to close its Bitcoin and EVM-based trading platforms and discontinue support for its multi-chain wallet.
Summary
- Magic Eden plans to shut down its Bitcoin and EVM NFT marketplaces in early March 2026, ending broader multi-chain support.
- The platform will continue supporting Solana-based assets, doubling down on its original ecosystem.
- Users need to withdraw assets from closing markets and the multi-chain wallet before termination dates.
Magic Eden refocuses on Solana, winds down Bitcoin and EVM services
Magic Eden originally rose to prominence by offering a user-friendly platform for buying, selling, and trading digital collectibles, especially non-fungible tokens (NFTs), on the high-throughput Solana network.
Over time, the platform expanded into Bitcoin Ordinals and Ethereum Virtual Machine (EVM) chains such as Ethereum, Polygon, and Avalanche in an effort to capture a broader share of the burgeoning NFT market.
However, new reports say the company will begin shutting down its Bitcoin and EVM marketplaces in the first week of March 2026, with its cross-chain wallet entering export-only mode by mid-March and fully ceasing service in early April. Support for Solana-based NFTs and assets will continue uninterrupted.
The move could be a strategic realignment rather than a retreat.
By concentrating on its core Solana busines, where the majority of its trading volume has historically originated, Magic Eden aims to streamline operational complexity and refocus engineering resources on strengthening features, liquidity, and community engagement within its original ecosystem.
Affected users are being urged to withdraw any assets held in the Bitcoin and EVM marketplaces or within the multi-chain wallet before support ends to avoid the risk of losing access. As the NFT sector evolves, Magic Eden’s decision highlights broader market trends toward specialization and platform consolidation.
TLDR:
- OpenAI signed a deal to deploy AI models on U.S. Department of War classified networks on Feb. 28, 2026.
- The agreement bans domestic mass surveillance and requires human control over lethal force decisions.
- Anthropic reportedly refused a similar Pentagon deal, citing autonomous weapons and surveillance risks.
- Backlash on X was swift, with thousands of users announcing plans to cancel ChatGPT subscriptions.
OpenAI has agreed to deploy its AI models on classified U.S. Department of War networks, CEO Sam Altman announced. The deal follows reports that Anthropic publicly declined similar Pentagon demands over autonomous weapons and surveillance concerns.
Altman posted the announcement to X, where it quickly drew millions of views and thousands of replies. The reaction online was largely critical, with many users threatening to cancel their ChatGPT subscriptions.
OpenAI and the Department of War Reach Classified AI Agreement
The agreement allows OpenAI models to operate within DoW classified systems under specific conditions.
Altman stated the deal includes explicit prohibitions on domestic mass surveillance. It also requires human oversight for any use of force, including autonomous weapons systems. Deployment will occur on cloud networks only, with OpenAI personnel embedded to monitor model behavior.
Altman noted on X that the DoW agreed with these core safety principles.
According to the post, those principles are also reflected in existing law and policy. OpenAI said it will build technical safeguards to keep models aligned with the agreement’s terms. The company also called on the DoW to extend the same terms to all AI companies.
Altman framed the deal as part of a broader effort to reduce friction between AI companies and the government. He wrote that OpenAI wants to move away from legal and governmental conflicts.
The announcement signals a shift toward negotiated frameworks rather than standoffs. OpenAI described its mission as serving all of humanity amid a “complicated, messy, and sometimes dangerous world.”
The post received over 11,000 likes within hours of going live. Reposts and quote replies numbered in the thousands. Despite the scale of engagement, most visible reactions skewed negative.
Anthropic’s Refusal Puts Spotlight on OpenAI’s Pentagon Move
Reports from the previous day indicated Anthropic CEO Dario Amodei refused similar Pentagon demands. The refusal reportedly centered on concerns about enabling mass surveillance and autonomous weapons.
Amodei allegedly offered to help the DoW transition to another provider rather than comply. That stance drew widespread praise from AI safety advocates and researchers.
OpenAI’s subsequent agreement was widely read as stepping into the gap Anthropic left. Critics on X accused the company of opportunism. Several users announced they were switching from ChatGPT to Claude. Some described the move as contradicting OpenAI’s own stated safety values.
Block, Inc. will reduce its workforce by nearly half, cutting more than 4,000 jobs as CEO Jack Dorsey said the fintech firm restructures around artificial intelligence and leaner teams.
Summary
- Block, Inc. will cut over 4,000 jobs, reducing headcount from 10,000+ to under 6,000 in one of its largest corporate overhauls.
- CEO Jack Dorsey says the move reflects a strategic pivot toward intelligence tools and flatter, more efficient teams — not financial distress.
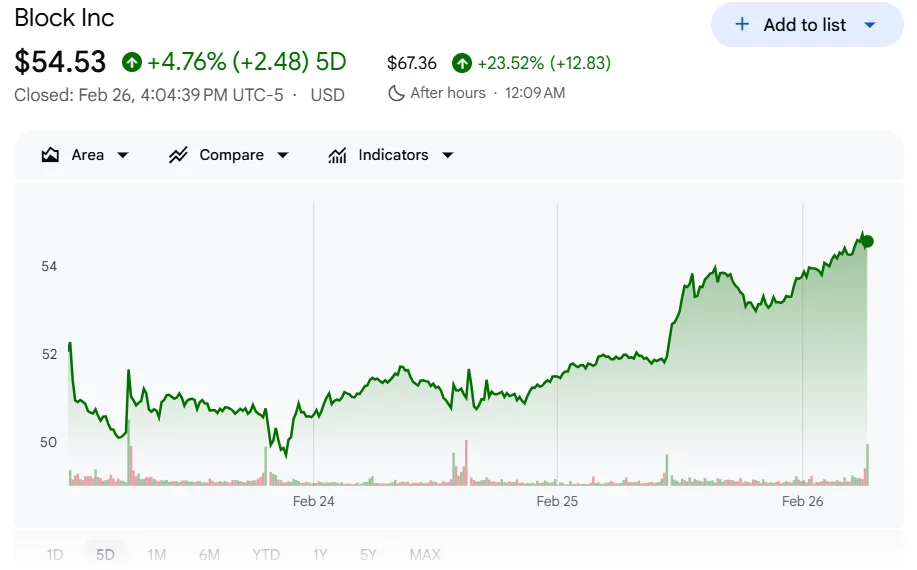
- Investors responded enthusiastically, sending Block shares up more than 23% in after-hours trading.
Wall Street cheers Jack Dorsey’s AI restructure
In a note shared publicly, Jack Dorsey said the company will shrink from over 10,000 employees to just under 6,000. He described the move as “one of the hardest decisions in the history of our company,” adding that affected employees would be notified the same day.
Despite the scale of the layoffs, Dorsey emphasized that Block is not facing financial distress. He said gross profit continues to grow, customer numbers are rising, and profitability is improving.
Instead, he framed the cuts as a proactive shift driven by the rapid advancement of intelligence tools that are reshaping how companies are built and operated.
“We’re already seeing that the intelligence tools we’re creating and using, paired with smaller and flatter teams, are enabling a new way of working,” Dorsey wrote, arguing that acting decisively now would avoid repeated rounds of layoffs that could damage morale and trust.
Employees leaving the company will receive 20 weeks of salary plus an additional week per year of tenure, equity vesting through the end of May, six months of healthcare coverage, their corporate devices, and $5,000 in transition support. Terms will vary internationally depending on local regulations.
Dorsey said internal communication channels would remain open through Thursday evening to allow departing staff to say goodbye, and he plans to host a live video session to address employees directly.
The market’s reaction to Jack Dorsey’s “leaner, meaner” pivot was nothing short of explosive. As news broke regarding the reduction of 4,000 roles, Block Inc. shares ignited in after-hours trading, surging by more than 23%.

The chart reflects a dramatic vertical shift as investors pivoted from uncertainty to overwhelming optimism, interpreting the layoffs not as a sign of corporate distress, but as a commitment to long-term profitability and AI-driven efficiency.


Disgraced FTX founder Sam Bankman-Fried has reignited controversy from prison after publicly endorsing the proposed CLARITY Act, calling it a “huge milestone for crypto” and “a huge achievement” for Donald Trump.
Summary
- Sam Bankman-Fried praised the CLARITY Act and credited Donald Trump, triggering immediate criticism from U.S. senators.
- Cynthia Lummis dismissed SBF’s comments and suggested the legislation would not benefit him legally.
- Elizabeth Warren warned that SBF’s backing should concern lawmakers debating crypto market structure reform.
Sam Bankman-Fried backs CLARITY Act, draws swift rebuke from Lummis and Warren
In a post on X, Bankman-Fried claimed he had championed similar legislation aimed at limiting the regulatory authority of former SEC Chair Gary Gensler before his prosecution. He suggested that Gensler “helped Biden’s DOJ put me behind bars,” reviving familiar allegations that his case was politically influenced.
The comments quickly drew bipartisan backlash.
Senator Cynthia Lummis responded sharply, writing: “Someone’s looking for a pardon and doesn’t realize the CLARITY Act would have you locked up for much longer than 25 years.”
She added that her crypto legislation differs fundamentally from what she described as the bill Bankman-Fried “tried to buy from Congress” in 2022. “We do not need—nor want—your support,” she said.
Senator Elizabeth Warren also weighed in, warning that Bankman-Fried’s endorsement should “set off alarm bells.” Warren reiterated her stance that any crypto market structure legislation must prioritize investor protection and financial stability.
Bankman-Fried, who is serving a lengthy federal sentence following his conviction over the collapse of FTX, has recently attempted to re-enter public discourse through media outreach and social media commentary. Previous efforts to sway political opinion, including outreach linked to Trump, have largely failed to gain traction.
The episode shows the heightened political sensitivity surrounding crypto regulation, particularly as lawmakers debate market structure reforms amid lingering fallout from FTX’s multibillion-dollar collapse.


Federal authorities have arrested Christopher Alexander Delgado, the founder and CEO of Goliath Ventures, on federal charges tied to an alleged $328 million Ponzi crypto scam, the U.S. Department of Justice announced.
Summary
- Goliath Ventures CEO Christopher Delgado was arrested on federal wire fraud and money laundering charges tied to a $328 million Ponzi scheme.
- Prosecutors say investors were promised monthly crypto returns, but funds were diverted to pay earlier investors and support Delgado’s luxury lifestyle.
- If convicted, Delgado faces up to 30 years in prison; authorities are reaching out to victims under the Crime Victims’ Rights Act.
Goliath Ventures CEO arrested in $328M crypto scam
Delgado, 34, of Apopka, Florida, was taken into custody on a criminal complaint filed in the United States District Court for the Middle District of Florida, where he is charged with wire fraud and money laundering.
If convicted on all counts, he could face up to 30 years in federal prison.
Prosecutors allege Delgado’s scheme ran from January 2023 through January 2026, during which he solicited investors to put money into purported cryptocurrency “liquidity pools” that promised steady monthly returns. In reality, federal officials say only about $1 million of the funds was actually invested in legitimate crypto assets.
The bulk of the more than $300 million collected from victims was used to pay earlier investors and finance Delgado’s lavish lifestyle, including luxury travel, company-sponsored events, and purchases of multi-million-dollar homes in central Florida.
According to court filings, victims were drawn in through personal referrals, slick marketing materials, and high-end networking events aimed at projecting legitimacy. At the scheme’s unraveling, investors seeking withdrawals were met with delays, inconsistent explanations, and restricted access to account information.
Federal law enforcement agencies including IRS Criminal Investigation and Homeland Security Investigations spearheaded the probe. Victims are being notified of their rights under the Crime Victims’ Rights Act, and authorities have invited potentially unidentified victims to come forward.
The arrest marks one of the largest alleged crypto-related fraud cases in recent years and underscores ongoing regulatory and criminal scrutiny of digital asset investment schemes.

An autonomous AI security tool caught a bug in the XRP Ledger that, if left undetected, could have let an attacker steal funds from any account on the network without ever touching the victim’s private keys.
The vulnerability, disclosed Thursday by XRPL Labs, sat in the signature-validation logic of the Batch amendment, a pending upgrade that would allow multiple transactions to be bundled and executed together.
The amendment was still in its voting phase among validators and had not been activated on mainnet, meaning no funds were ever at risk. But the exploit path was about as bad as it gets for a blockchain.
Here’s what the bug did in plain terms. Batch transactions let users bundle several operations into one. Because the individual transactions inside the batch don’t carry their own signatures, the system relies on a list of batch signers to confirm that every account involved has authorized the bundle.
The validation function that checked those signers had a critical loop error. If it encountered a signer whose account didn’t yet exist on the ledger, and whose signing key matched their own account — the normal case for a brand-new account — it immediately declared the entire check successful and stopped looking at the rest of the list.
An attacker could exploit this by constructing a batch with three transactions. The first creates a new account the attacker controls. The second is a simple transaction from that new account, making it a required signer. The third is a payment from the victim’s account to the attacker.
Because the new account doesn’t exist yet when validation runs, the signer check exits early after the first entry and never verifies the second. The victim’s funds move without their keys ever being involved.
Pranamya Keshkamat and Cantina AI’s autonomous security tool Apex identified the flaw through static analysis of the codebase on Feb. 19 and submitted a responsible disclosure. Ripple’s engineering team validated the report the same evening with an independent proof-of-concept.
The response was fast. Validators on the network’s Unique Node List were immediately advised to vote “No” on the amendment.
An emergency release, rippled 3.1.1, was published on Feb. 23, marking both the Batch and the related fixBatchInnerSigs amendments as unsupported to prevent them from ever activating. A corrected replacement called BatchV1_1 has been built and is under review, with no release date set.
The fact that an AI tool found this is notable on its own.
XRPL Labs said it would add AI-assisted code audit pipelines as a standard step in its review process going forward, alongside expanded static analysis specifically designed to catch the kind of premature loop exits that caused this bug.


Bitcoin’s attempt to reclaim $70,000 earlier in the week lasted about 48 hours.
The largest cryptocurrency slid to $65,735 in early Asian hours on Saturday, down 3% over the past day and 2.8% on the week. Wednesday’s rally, which came within touching distance of $70,000, has now given back more than half its gains as broader risk sentiment deteriorated through Thursday and Friday’s U.S. sessions.
Altcoins took a harder hit. Solana dropped 6.7%, ether fell 6.2%, dogecoin shed 5.1%, and XRP lost 4%. The losses pushed most major tokens into the red on a weekly basis, erasing the altcoin outperformance that had been the week’s most encouraging signal. BNB held up better than most, down just 2.5%.
The trigger was familiar. Friday’s U.S. session saw the S&P 500 close down 0.4%, the Nasdaq 100 drop 0.3%, and the Dow fall 1.1%. Nvidia, still digesting its post-earnings reaction, shed another 4.2%.
A hotter-than-expected 0.5% jump in producer prices added fuel, signaling inflationary pressure that may keep the Fed from cutting rates anytime soon. Block Inc.’s massive layoffs fanned broader anxiety that AI is starting to displace jobs across the economy rather than just creating them.
Crypto followed equities lower, but as usual, with amplified magnitude. A 0.4% drop in the S&P became a 3% drop in bitcoin and a more than 6% drop in altcoins. The leverage that re-entered the system during Wednesday’s rally got flushed on the way back down.
The irony is that the institutional flow data this week was actually strong.
U.S. spot bitcoin ETFs added $1.1 billion in three days, putting them on pace for their best week in months. But ETF inflows haven’t been enough to overcome the broader macro headwinds.
“Over-analysis of short-term price movements is misguided,” said Dom Harz, co-founder of bitcoin finance firm BOB said in an email. “Bitcoin’s volatility is no surprise, particularly for early investors who have experienced previous cycles. What’s different this time is the type of capital behind the emerging asset class.”
Meanwhile, CryptoQuant data shows USDT stablecoin reserves on exchanges have fallen from $60 billion to $51.1 billion over the past two months, a decline the firm warned could trigger a “massive sell-off” if reserves drop below $50 billion.
Elsewhere, Strategy shares topped the list of large U.S. companies by short interest volume as markets increasingly question the sustainability of the firm’s debt-funded bitcoin buying program.
And on the Ethereum side, large holders have started selling at a loss, with DAT company ETHZilla officially abandoning its ETH accumulation strategy and rebranding to focus on tokenized real-world assets instead.
Bitcoin is now back in the middle of the $60,000-$70,000 range it has been stuck in since the Feb. 5 crash. Wednesday proved the top of that range is resistance. The question heading into March is whether the bottom still holds.


MetaMask and Mastercard have officially launched the MetaMask Card across the United States, marking a significant step in bringing cryptocurrency spending into everyday commerce.
Summary
- MetaMask and Mastercard begin offering the self-custodial MetaMask Card in 49 states, including New York.
- Users spend directly from their wallets, with up to 1% back in mUSD for standard users and up to 3% for premium members.
- The card works at over 150 million Mastercard merchants and supports Apple Pay and Google Pay.
New MetaMask and Mastercard card lets users spend crypto
The announcement follows successful pilot programs in Europe and the UK, and now brings the self-custodial crypto payment card to 49 U.S. states, including New York for the first time.
The MetaMask Card connects users’ self-custodied digital assets to traditional payment infrastructure, allowing holders to spend crypto directly from their wallets anywhere Mastercard is accepted, online or in physical stores, without needing to pre-load balances onto custodial accounts.
Users retain full control of their funds until the point of sale, where conversion and payment happen seamlessly.
“We designed MetaMask Card to make crypto disappear. Not go away, but become so seamlessly woven into daily life that the line between onchain and offchain fades away entirely,” said Gal Eldar, Product Lead at MetaMask.
Issued by FDIC-insured Cross River Bank and powered by Mastercard’s global network with technology from Monavate (formerly Baanx), the card works with Apple Pay and Google Pay, making it compatible with contactless digital wallets. The rollout follows a year-long U.S. trial that began in late 2024, with broader access now available nationwide.
A key feature of the program is on-chain rewards: standard MetaMask Card holders earn up to 1% back in MetaMask’s stablecoin mUSD on purchases, while premium MetaMask Metal subscribers, available for a $199 annual fee, can earn up to 3% back on the first $10,000 spent each year alongside additional travel and spending benefits.
The launch represents a strategic effort to integrate decentralized finance into traditional payment rails, making crypto use more intuitive for everyday purchases while preserving self-custody principles at the heart of Web3.
It also positions MetaMask alongside other crypto-native payment cards, expanding crypto’s real-world utility.
Every Question Police Can’t Answer About Nancy Guthrie’s Disappearance

Jets’ Vladislav Namestnikov ruled out vs. Ducks with lower-body injury
The NFL Won A Lawsuit Over Its Bluesky Ban. Its Social Media Strategy Is Still A Loser


-

 Politics6 days ago
Baftas 2026: Awards Nominations, Presenters And Performers
-

 Sports4 days ago
Women’s college basketball rankings: Iowa reenters top 10, Auriemma makes history
-

 Fashion11 hours ago
Weekend Open Thread: Iris Top
-

 Politics4 days ago
Nick Reiner Enters Plea In Deaths Of Parents Rob And Michele
-

 Business3 days ago
True Citrus debuts functional drink mix collection
-

 Politics1 day ago
ITV enters Gaza with IDF amid ongoing genocide
-

 Crypto World4 days ago
XRP price enters “dead zone” as Binance leverage hits lows
-

 Business6 days ago
Mattel’s American Girl brand turns 40, dolls enter a new era
-

 Business6 days ago
Law enforcement kills armed man seeking to enter Trump’s Mar-a-Lago resort, officials say
-

 NewsBeat2 days ago
Cuba says its forces have killed four on US-registered speedboat | World News
-

 Tech3 days ago
Unsurprisingly, Apple's board gets what it wants in 2026 shareholder meeting
-
 NewsBeat2 days ago
Manchester Central Mosque issues statement as it imposes new measures ‘with immediate effect’ after armed men enter
-
 NewsBeat5 days ago
‘Hourly’ method from gastroenterologist ‘helps reduce air travel bloating’
-

 Tech5 days ago
Anthropic-Backed Group Enters NY-12 AI PAC Fight
-

 NewsBeat5 days ago
Armed man killed after entering secure perimeter of Mar-a-Lago, Secret Service says
-

 Politics6 days ago
Maine has a long track record of electing moderates. Enter Graham Platner.
-

 Business2 days ago
Discord Pushes Implementation of Global Age Checks to Second Half of 2026
-
 NewsBeat3 days ago
Police latest as search for missing woman enters day nine
-
 Sports5 days ago
2026 NFL mock draft: WRs fly off the board in first round entering combine week
-

 Business1 day ago
Only 4% of women globally reside in countries that offer almost complete legal equality