
Crypto World
Will Solana price rebound as its key metrics beat Ethereum?
Solana price remained under pressure this week, continuing a downward trend that started in September last year when it peaked at $252.
Summary
- Solana price continued its strong downward trend this week.
- Key network metrics like active addresses and transactions continued soaring.
- Its ETF inflows continued rising and is beating Ethereum.
Solana (SOL) token dropped for eight consecutive weeks and is now hovering near its lowest level since January 2024. It has dropped by over 73% from its highest level in January last year.
The ongoing Solana price crash continued even as the network growth gained momentum and beat Ethereum (ETH) on key metrics.
For example, data compiled by SoSoValue shows that spot Solana ETFs added over $61 million in inflows this month. They have added assets in the last five consecutive months, bringing the cumulative inflows to over $932 million. These funds now hold over $795 million in assets under management.
On the other hand, Ethereum ETFs shed over $326 million in assets in February. They have shed over $2 billion in the last four months, bringing the cumulative net assets inflows to over $11.6 billion.
Solana is also beating Ethereum in other areas, by far. For example, data compiled by Nansen shows that Solana handled over 2.6 billion transactions in the last 30 days, while Ethereum processed 66.7 million.
Similarly, Solana made over $25 million in fees, while Ethereum made $18 million in the same period. These fees made it the second most profitable chain in the crypto industry after Justin Sun’s Tron.
Meanwhile, the number of active addresses in Ethereum dropped by 5.3% in the last 30 days, while Solana’s rose by 30% to over 114 million.
Solana price prediction: Technical analysis
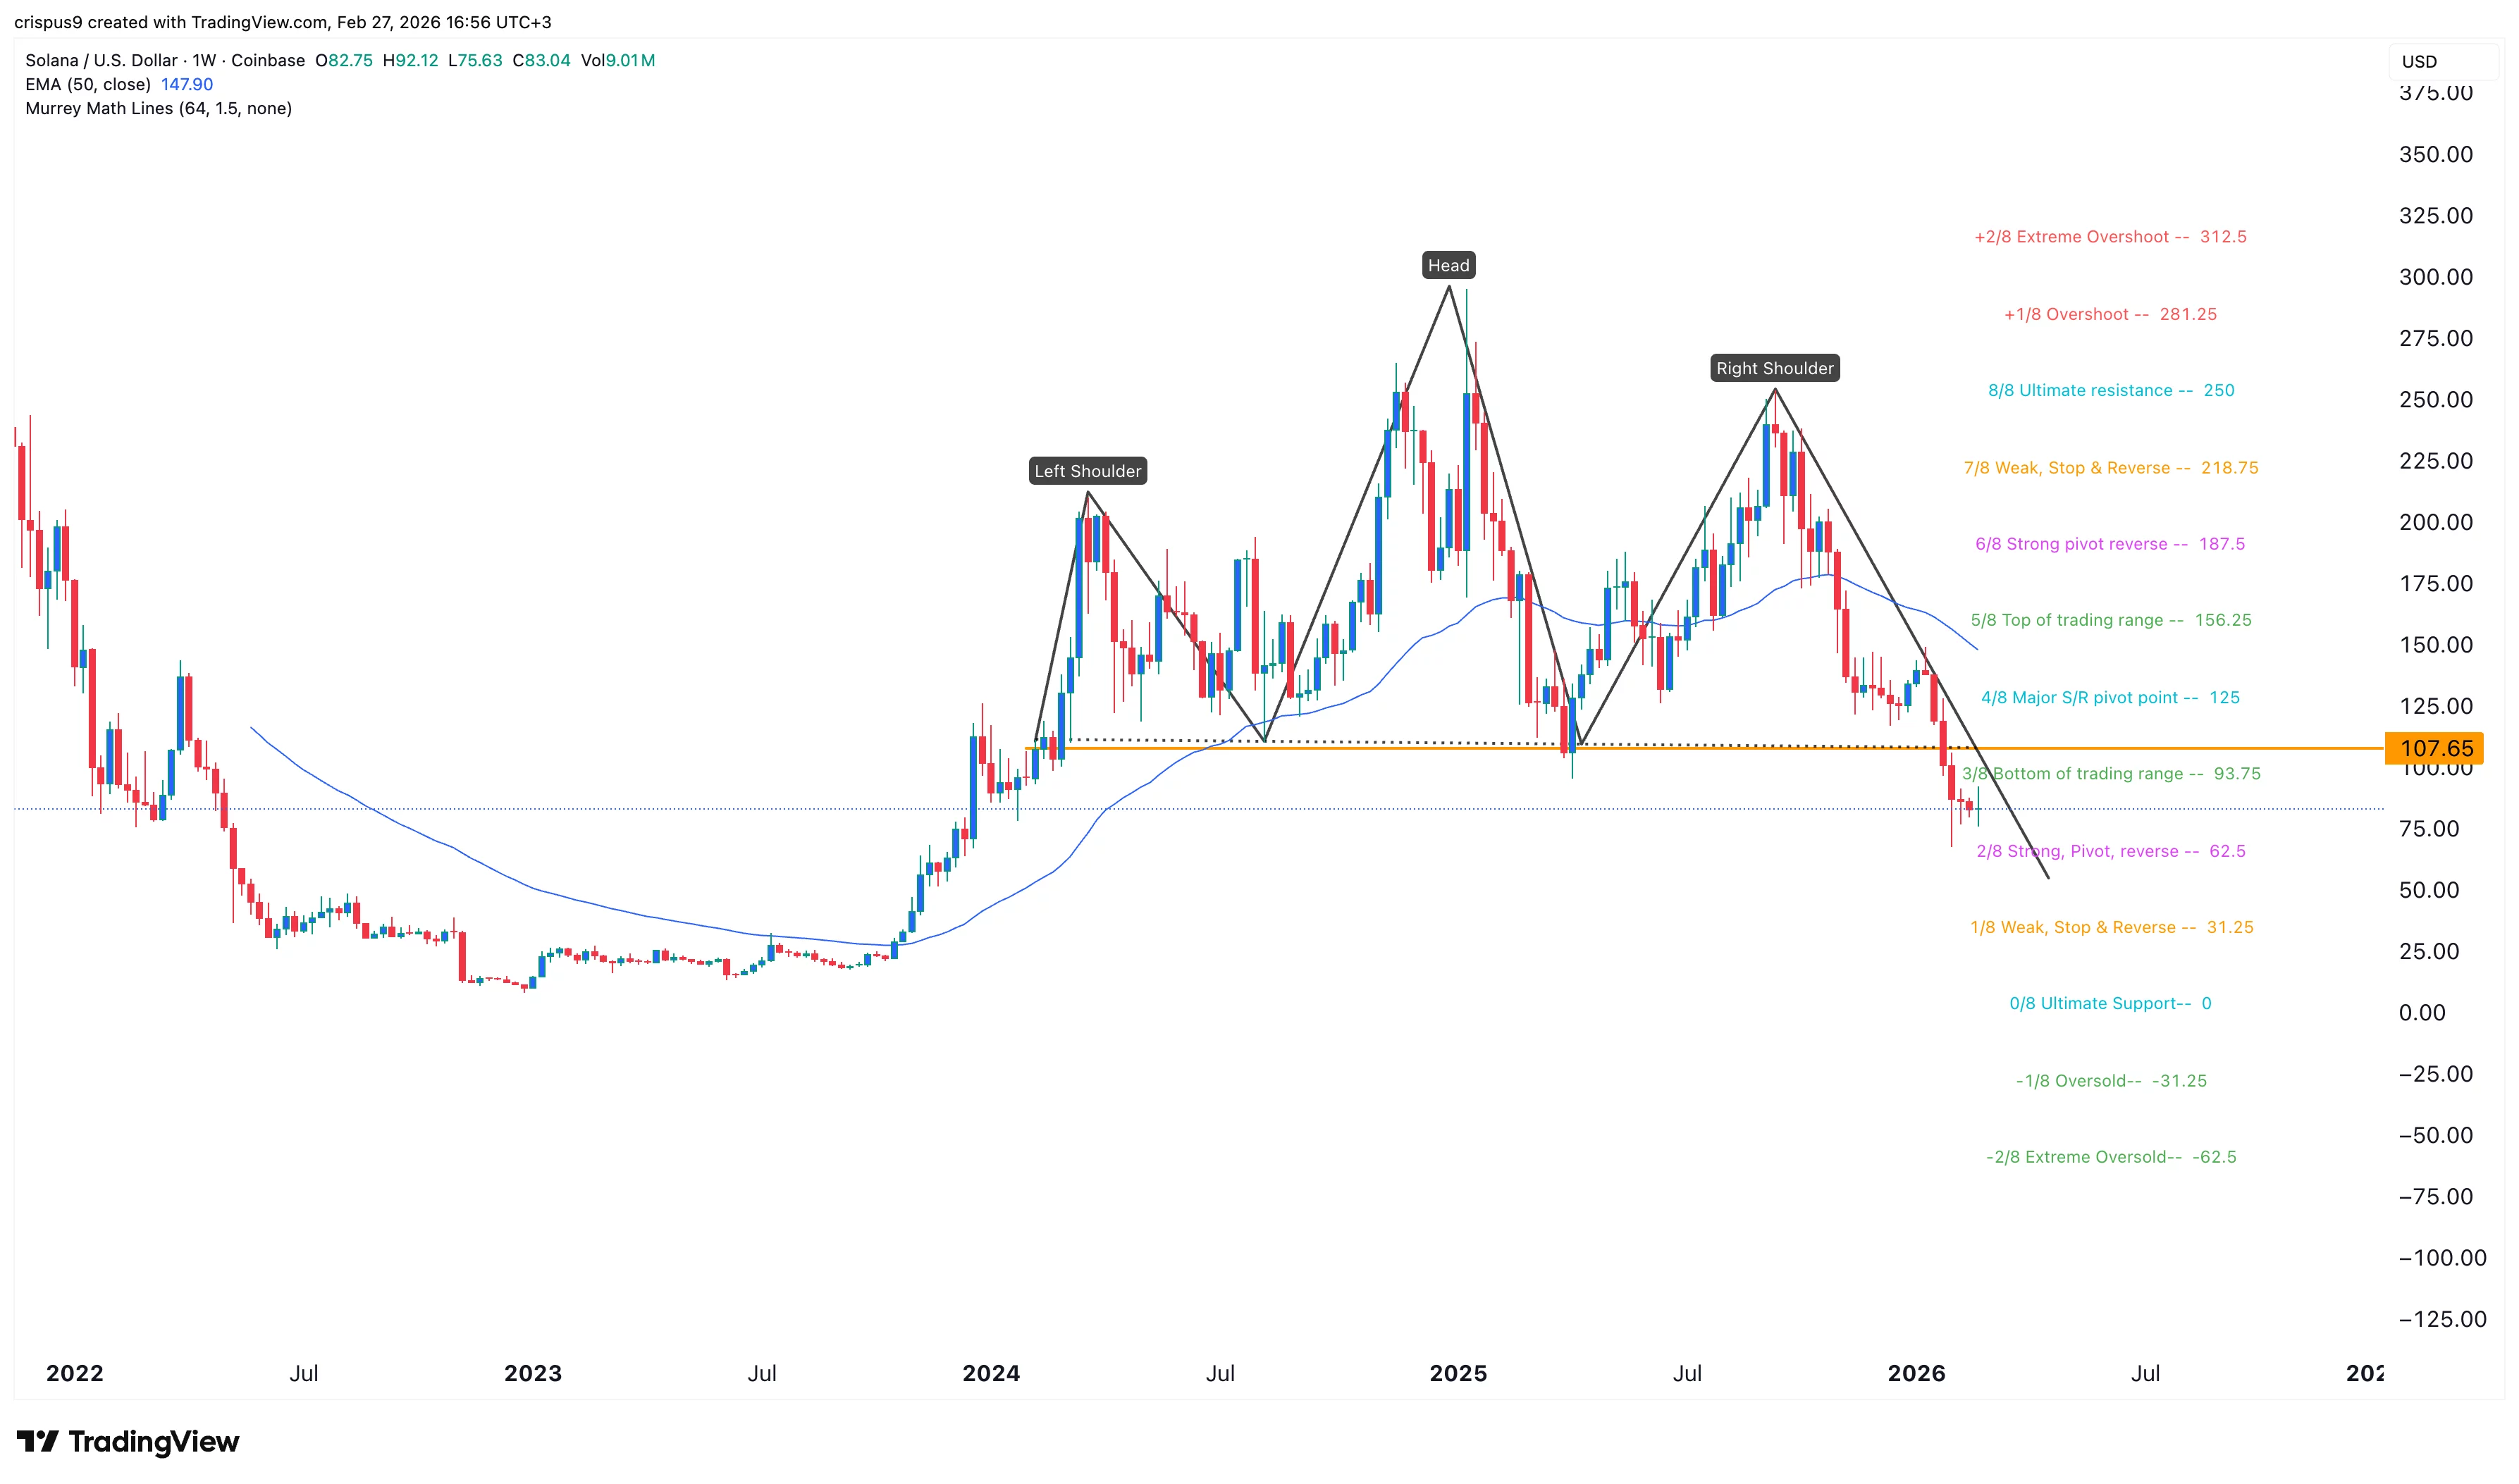
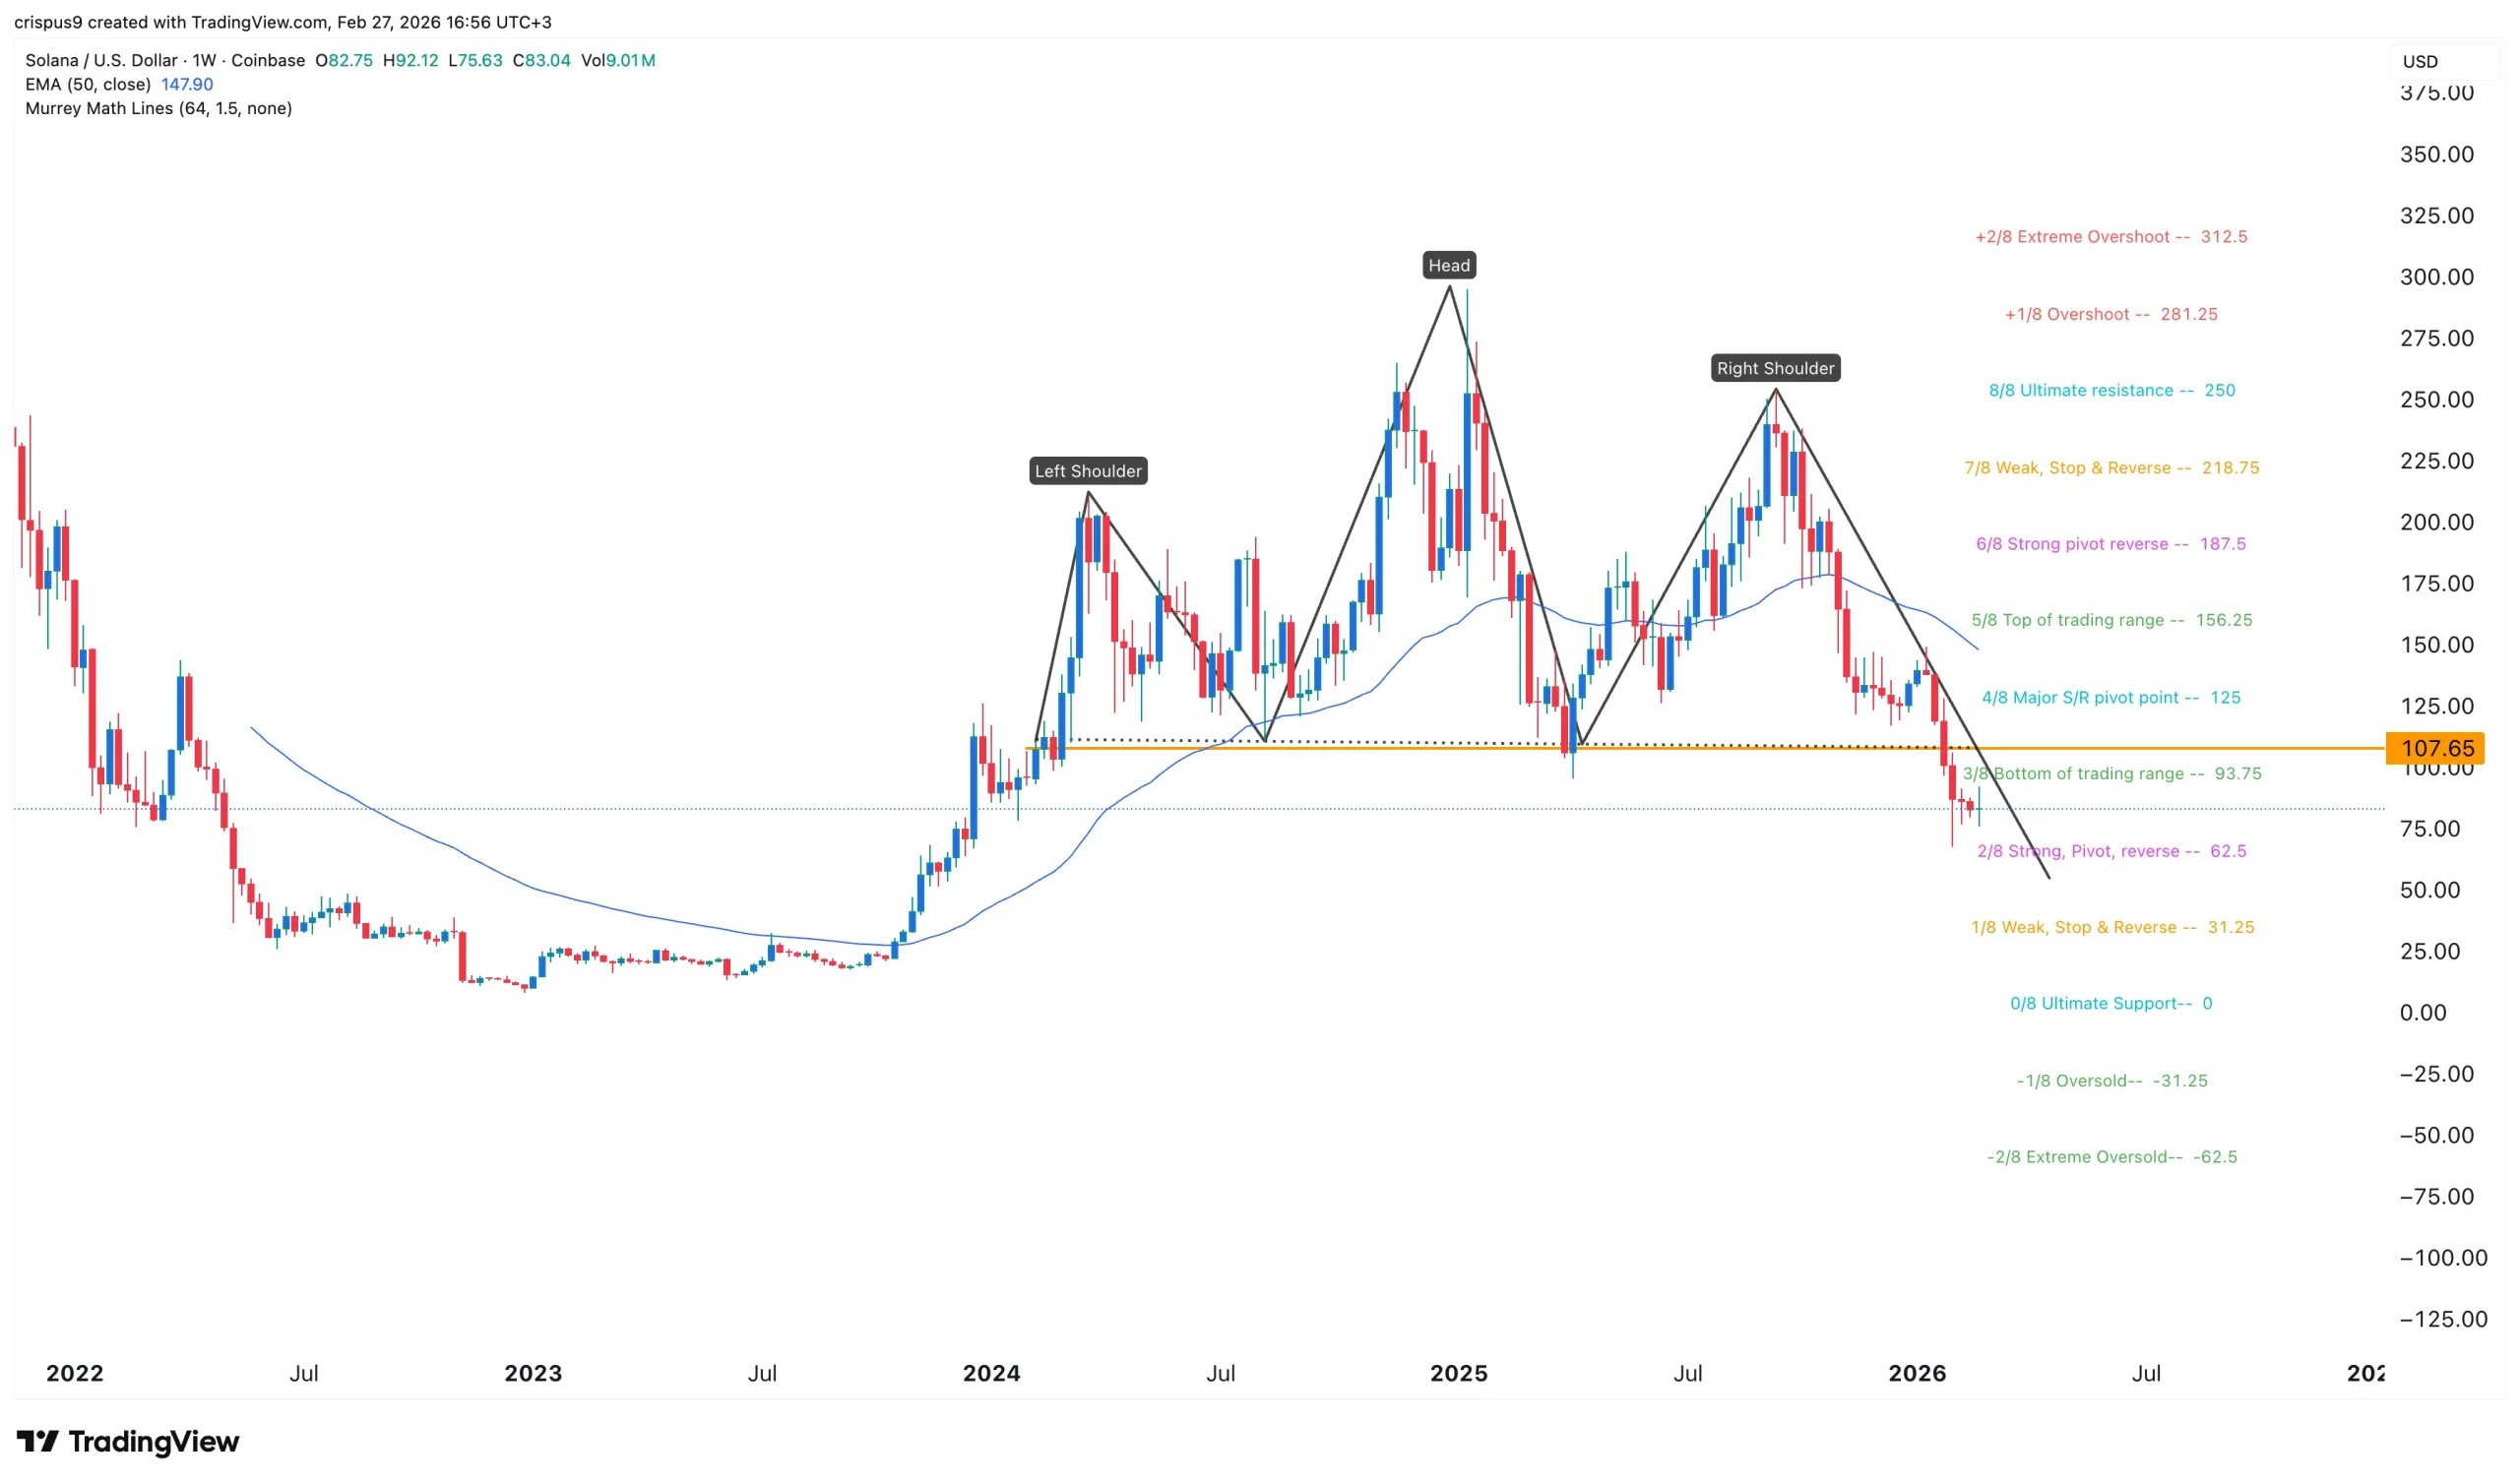
The weekly timeframe chart shows that SOL price has remained in a bear market in the past few months. It has dropped below the key support level at $107, the neckline of the head-and-shoulders chart pattern.
The token has dropped below the key support level at $93.75, the Bottom of trading range of the Murrey Math Lines tool. It also remains below the 50-week and 100-week Exponential Moving Averages.
Solana also remains below the Supertrend indicator. Therefore, the token will likely continue falling, potentially to the Strong, Pivot, and Reverse of the Murrey Math Lines tool at $62.5.
The coin will then bounce back when the ongoing crypto market crash fades, which may happen in the next few weeks or months.


The U.S. Commodity Futures Trading Commission (CFTC) has provided more details on its pilot program that allows cryptocurrencies to be used as collateral in derivatives markets. The new guidance was issued in response to frequently asked questions about the program that began last year.
Summary
- CFTC allows crypto as collateral in derivatives, following a pilot program.
- FCMs must apply a 20% capital charge for Bitcoin and Ether positions.
- Crypto cannot be used for uncleared swaps, but is allowed for cleared transactions.
The CFTC’s recent notice outlines the procedures for futures commission merchants (FCMs) wishing to participate in the pilot program. FCMs are required to file a notice with the Market Participants Division and specify the date they will begin accepting crypto assets as margin collateral. This development is part of the CFTC’s ongoing efforts to integrate crypto assets into traditional financial markets.
The CFTC’s pilot allows for the use of crypto as collateral in derivatives transactions, a move that aligns with the crypto industry’s push for 24/7 trading and immediate settlement. The guidance issued in December clarified which tokenized assets can be used as collateral and how they should be valued and calculated for trading positions.
Capital Charges and Aligning with SEC Guidelines
The CFTC made it clear that its guidance on capital charges would align with the Securities and Exchange Commission (SEC). Futures commission merchants must apply a 20% capital charge for positions in Bitcoin and Ether, while stablecoins will carry a 2% charge. This move is aimed at ensuring that both agencies maintain consistent regulatory approaches to crypto.
During the first three months of the pilot, FCMs can only accept Bitcoin, Ether, and stablecoins as collateral. They are also required to file weekly reports detailing the total amount of crypto held across customer account types. After three months, other cryptocurrencies can be accepted as collateral, and the reporting requirements will be lifted.
The CFTC also specified that proprietary payment stablecoins are the only ones that can be deposited as residual interest in customer segregated accounts. Additionally, the use of crypto and stablecoins as collateral for uncleared swaps is prohibited.
Crypto assets cannot be used as collateral for uncleared swaps. However, derivatives clearing organizations can accept Bitcoin, Ether, and stablecoins as initial margin for cleared transactions if the assets meet CFTC’s credit, market, and liquidity risk requirements.


Kalshi, a prediction market company, has faced a temporary setback in Nevada. A state judge issued a temporary restraining order, blocking the company from operating for 14 days. The decision follows concerns that Kalshi’s event contracts might violate Nevada’s gambling laws.
Summary
- Kalshi faces a 14-day ban in Nevada after violating the state’s gambling regulations.
- Nevada regulators claim Kalshi’s event contracts are unlicensed gambling under state law.
- Kalshi fights back in multiple states, including Arizona and Massachusetts, over illegal gambling accusations.
On Friday, Carson City District Court Judge Jason Woodbury granted a temporary restraining order, siding with the Nevada Gaming Control Board’s motion to block Kalshi. This comes after the company offered event contracts related to sports, elections, and entertainment, which Nevada regulators view as a form of unlicensed gambling.
The court ruling states that Kalshi is prohibited from offering such contracts in Nevada, as these are considered “sports pools” under state law. Kalshi, however, has not responded to the ruling.
Nevada Gaming Control Board Chair Mike Dreitzer emphasized the state’s responsibility to protect the public, asserting that prediction markets like Kalshi could facilitate illegal gambling.
“Prediction markets, to the extent they facilitate unlicensed gambling, are illegal in Nevada,” Dreitzer said in a statement to Reuters.
Kalshi had argued that its contracts fall under the jurisdiction of the Commodity Futures Trading Commission (CFTC), not Nevada’s gaming regulations. The company has fought similar accusations in other states, asserting that its activities are federally regulated.
However, Judge Woodbury rejected Kalshi’s defense, stating that the legal authority currently favors Nevada’s stance. The court’s decision sets a precedent for ongoing legal battles regarding prediction markets and their regulation across state lines.
Moreover, Kalshi is currently engaged in multiple legal disputes with state regulators. This includes a case in Massachusetts, where a state judge banned the company from offering sports event contracts, though this ban was later lifted on appeal.
Additionally, Arizona has filed criminal charges against Kalshi, accusing the company of running an illegal gambling operation. Kalshi CEO Tarek Mansour has labeled these charges as “total overstep.”


CoinDCX, an Indian cryptocurrency exchange backed by Coinbase, is embroiled in a fraud case involving its founders, Sumit Gupta and Neeraj Khandelwal.
Summary
- CoinDCX founders questioned over a $75K fraud involving fake websites impersonating the platform.
- Over 1,200 websites impersonating CoinDCX were reported, highlighting rising cyber fraud in India.
- Investment scams accounted for 76% of all financial losses in India in 2025, according to reports.
Meanwhile, the founders were questioned by authorities following allegations of their involvement in a crypto investment scam. However, CoinDCX denies the accusations and attributes the fraud to impersonators using its brand for fraudulent activities.
The controversy started after a complaint from a 42-year-old insurance consultant, who claimed to have lost around 71 lakh rupees (roughly $75,000) after investing in a fake website posing as CoinDCX. The Thane Police reportedly arrested Gupta and Khandelwal on allegations of criminal breach of trust. However, other reports suggested that the founders were merely questioned by the authorities rather than arrested.
CoinDCX responded to the claims, stating that the complaint was part of a broader scheme by fraudsters who impersonated the exchange. The company clarified that it had no connection to the fake website and assured the public that funds were diverted by external parties unrelated to the exchange.
CoinDCX has emphasized that brand impersonation and cyber fraud are growing issues in India’s digital finance sector. The exchange stated that it is fully cooperating with law enforcement authorities in their investigation and stressed the importance of educating users about online fraud.
The company revealed that between April 2024 and January 2026, over 1,200 websites had impersonated its domain. This highlights the increasing risks of phishing attacks targeting crypto users in India, with CoinDCX working to combat such fraud.
A Broader Issue of Investment Scams
The case comes amid a rise in investment scams in India, which accounted for 76% of all financial losses in 2025, according to data from the Ministry of Home Affairs. Globally, Web3 platforms also faced significant losses due to hacking and exploitation, amounting to nearly $4 billion in 2025.
CoinDCX, founded in 2018, is one of India’s leading crypto exchanges, with a valuation of $2.45 billion after an investment from Coinbase Ventures in 2025. Despite the recent controversy, the platform remains committed to maintaining user security and combating fraudulent activities.

A prominent crypto influencer is speaking out about the fallout from promoting a memecoin that unraveled just days after its 2024 launch. Hailey Welch, popularly known as the Hawk Tuah girl, says the HAWK memecoin episode left lasting scars after a rapid rise and a dramatic collapse, and she stresses she did not profit from the project or help launch it.
Welch told Channel 5 in a recent interview that she fully cooperated with a Federal Bureau of Investigation (FBI) probe conducted in 2025, which she says cleared her of any wrongdoing. She also emphasized that she did not possess any of the memecoin’s funds and lacked the technical expertise to launch the coin herself. The experience, she says, took a toll on her mental health as she faced intense scrutiny and threats in the wake of the controversy.
“I was starting to get death threats and everything else. People telling me I owe them all this money, and I’m like, ‘I didn’t do this.’ I’m sitting here, and I’m the one getting hit for this. It’s rough. It’s one of those things where if you come out of the house, you put your head down.”
Despite Welch’s portrayal of the episode as a case of mistaken involvement, not everyone in crypto’s investigative community is sympathetic. On-chain sleuth ZachXBT criticized the backlash, arguing that promoters should bear responsibility when they publicly endorse meme coins that turn out to be high-risk bets. “No one should feel bad for the ‘trauma,’” he wrote, pointing to Welch’s decision to promote the token despite warnings from crypto Twitter, and later stepping away from social media as followers lost funds.
Key takeaways
- HAWK launched in December 2024 and quickly surged to a market cap north of $490 million within hours of going live, according to market trackers.
- The following day, the project collapsed by more than 91%, bringing its market cap down to about $41 million and sparking characterizations of a rug pull.
- An investor lawsuit was filed in December 2024 against the teams behind the memecoin, alleging the sale of unregistered securities; Welch was not named in the suit.
- Welch says she cooperated with a 2025 FBI inquiry that cleared her of wrongdoing, and that she neither owned funds from the launch nor had the technical capability to create the token.
- Despite the claims of broad investor losses, Welch’s legal team characterized the total dollar losses by retail investors as around $200,000, while she described the impact as disproportionately harsh on her personally due to threats and public scrutiny.
- Crypto observers remain divided: supporters say the episode underscores risks of influencer endorsements in memecoin hype, while critics argue that promoters should be accountable for the consequences of their campaigns.
The rise, collapse, and aftermath of the HAWK meme
The HAWK memecoin’s December 2024 debut drew immediate attention, with the token vaulting to a multi-hundred-million-dollar valuation in a matter of hours. Market trackers subsequently show the project losing momentum at a breathtaking pace, delivering a dramatic fall from grace as investor confidence eroded and liquidity questions surfaced. Within 24 hours of launch, the market capitalization had receded to roughly $41 million, a drop of more than 90% from its peak. The episode has since been widely described as a rug pull by observers who tracked the token’s early performance and post-mortem discussions in the community.
The public fallout extended beyond market data. In December 2024, an investor lawsuit was filed against the entities behind the memecoin’s launch, alleging the sale of unregistered securities. Welch, who had publicly promoted the token, was not named in the suit, but the case underscored the broader regulatory and legal risks tied to promoter-backed memes amid a crowded field of similar campaigns. The case added to a growing chorus calling for greater scrutiny of token offerings that hinge on celebrity or influencer endorsements rather than foundational project fundamentals.
Context, accountability, and what to watch next
Welch’s account highlights the ethical and personal stakes around influencer involvement in meme coins. She contends that she did not profit from the project and did not facilitate its launch, while still bearing the social and mental health consequences of the episode. The FBI’s involvement—according to Welch—yielded a clearing conclusion, though the broader debate about due diligence and disclosure remains active in crypto circles.
From a market dynamics perspective, the HAWK episode illustrates several enduring tensions in the meme-coin niche: how quickly hype can translate into astronomical valuations, how swiftly sentiment can reverse, and how investor protections lag behind the speed of social media-driven campaigns. For investors, the episode reinforces the importance of scrutinizing promoters’ claims, the provenance of a token, and the clarity of regulatory disclosures before participating in a launch. For builders and platforms, it underscores the necessity of clear governance and compliance frameworks to mitigate the risk of similar episodes undermining trust in the ecosystem.
As regulators and the crypto community continue to grapple with these questions, readers should watch for developments around enforcement actions tied to promoter-led token launches, potential updates to how unregistered securities are treated in meme-powered campaigns, and whether more empirical data will emerge on the real-world losses borne by retail participants in such episodes.
Readers should stay tuned to further statements from involved parties and to updates on any legal proceedings, as the broader narrative around influencer-led memecoins continues to evolve and shape the conversation about accountability in the space.


Hailey Welch, known as the “Hawk Tuah girl,” recently spoke about the fallout from the failed launch of the “HAWK” memecoin in 2024, which she promoted.
Summary
- Hailey Welch was cleared of wrongdoing after promoting HAWK memecoin despite facing backlash and death threats.
- The HAWK memecoin, valued at $490M, collapsed to $41M in hours, triggering legal action.
- Despite FBI clearance, Welch faced emotional struggles and continued public criticism after the memecoin’s failure.
Despite cooperating fully with an FBI investigation that cleared her of wrongdoing, Welch faced immense social backlash and personal distress following the memecoin’s collapse.
In December 2024, the HAWK memecoin launched with great fanfare, quickly surging to a market capitalization of over $490 million. However, within hours, the coin’s value dropped sharply, losing over 90% of its value. By the following day, the market cap had fallen to about $41 million. The event was widely described as a rug pull, where investors were left with significant losses.
Welch, who had publicly promoted the token, said that she was unaware of the technical details behind the launch and had no control over the funds. She added that the financial losses for investors were relatively small, estimating the total at around $200,000. However, the social and emotional toll was much greater.
Following the HAWK memecoin’s collapse, Welch received death threats and experienced heightened public scrutiny.
“I was starting to get death threats and everything else. People telling me I owe them all this money, and I’m like, ‘I didn’t do this,’” Welch explained.
She admitted that the backlash took a significant toll on her mental health, causing her to retreat from social media and try to maintain a low profile for months.
Welch’s lawyer emphasized that she had fully cooperated with the FBI investigation, which ultimately found no evidence of fraud or intentional wrongdoing on her part. Despite this, the public backlash continued, with many in the crypto community blaming her for promoting the memecoin.
Legal action and public reactions
After the HAWK memecoin’s collapse, an investor lawsuit was filed against the team behind the launch. The lawsuit accused the entities of selling unregistered securities, but Welch was not named as a defendant. The legal action pointed to the alleged mismanagement and fraudulent nature of the memecoin’s promotion.
Despite Welch’s claims of being a victim of the situation, not all observers were sympathetic. Onchain investigator ZachXBT criticized her involvement in the project, stating,
“She starts posting about meme coins. The entirety of [crypto Twitter] tells her ‘do not launch a token.’ She launches a memecoin anyway, and after, she blames partners and disappears off social media, with followers losing funds.”

Indian crypto exchange CoinDCX co-founders Sumit Gupta and Neeraj Khandelwal have reportedly been arrested in India following a police complaint alleging their involvement in a crypto investment fraud.
The Economic Times reported Saturday that the pair were arrested by the Thane Police on allegations of criminal breach of trust, citing local officials. Other local media, including Entrackr, reported that the founders had been called for questioning rather than arrested.
The case reportedly centers on a website that allegedly posed as the CoinDCX platform and stemmed from a first information report (FIR) filed by a 42-year-old insurance consultant who claimed to have lost about 71 lakh Indian rupees (roughly $75,000) after being lured to invest via the fake site, according to an earlier report by the Times of India.
In a statement on X, CoinDCX said the FIR was “false and filed as a conspiracy” by impersonators posing as its founders and diverting funds to third-party accounts that it said had no connection to the exchange.

The company described brand impersonation and cyber fraud as growing problems in India’s digital finance sector and stressed that it was “fully cooperating with the relevant law enforcement authorities,” while remaining focused on user education and awareness.
Related: Hong Kong retiree loses $840K in triple ‘crypto expert’ scam
CoinDCX added that between April 1, 2024, and Jan. 5, 2026, it had reported more than 1,212 websites impersonating its coindcx.com domain, highlighting the scale of phishing and impersonation attacks that have increasingly plagued Indian crypto users.
Investment scams and Web3 losses
The case comes amid a broader rise in online investment scams in India. According to data from the Ministry of Home Affairs cited in Insights IAS, investment scams accounted for 76% of all financial losses in 2025. Globally, Web3 platforms lost around $3.95 billion to hacks and exploits in 2025.
Founded in 2018 and based in Mumbai, CoinDCX is one of India’s best-known crypto trading platforms and was valued at about $2.45 billion after an investment from Coinbase Ventures in October 2025.
The exchange has also faced questions over security after a July 2025 breach in which attackers stole roughly $44 million from an internal operational account, an incident that made CoinDCX one of that month’s largest hacking victims by losses, though the company said customer assets were not affected.
Big Questions: Is China hoarding gold so yuan becomes global reserve instead of USD?

Hailey Welch, the online social media influencer, popularly known as the “Hawk Tuah girl,” said that the implosion of the “HAWK” memecoin, which she promoted in 2024, and the ensuing social backlash “traumatized” her.
“I got talked into doing something that I didn’t know anything about, really, but you’ve got to be really careful what you put your name on,” Welsh told Andrew Callaghan of the Channel 5 YouTube channel on Friday.
Welsh said she fully cooperated with a Federal Bureau of Investigation (FBI) probe in 2025, which cleared her of any wrongdoing, and that she did not possess any of the funds from the memecoin launch, nor did she have the technical expertise to launch the coin.

She added that the total amount lost by “real people” in the botched memecoin release was not significant, with her lawyer estimating the total dollar amount lost by retail investors at about $200,000.
Despite this, Welsh said she received death threats and attempted to keep a low profile for months after the incident, which took a toll on her mental health. She said:
“I was starting to get death threats and everything else. People telling me I owe them all this money, and I’m like, ‘I didn’t do this.’ I’m sitting here, and I’m the one getting hit for this. It’s rough. It’s one of those things where if you come out of the house, you put your head down.”
However, not everyone was convinced by Welsh’s comments. “No one should feel bad for the ‘trauma,’” onchain sleuth ZachXBT said.
“She starts posting about meme coins. The entirety of [crypto Twitter] tells her ‘do not launch a token.’ She launches a memecoin anyway, and after, she blames partners and disappears off social media, with followers losing funds,” he added.

Related: Japan PM Takaichi disavows ‘Sanae Token’ after memecoin hits $28M peak
The HAWK memecoin crashes and burns shortly after arrival
The HAWK memecoin launched in December 2024 and surged to a market capitalization of over $490 million mere hours after going live.
Hawk collapsed by over 91% the following day, falling to a market cap of about $41 million, and was widely characterized as a rug pull.

In December 2024, an investor lawsuit was filed against the team and entities that created and managed the memecoin launch, but not Welsh, alleging that the entities sold unregistered securities.
Magazine: Memecoin degeneracy is funding groundbreaking anti-aging research
A stablecoin linked to the crypto project Resolv Labs has fallen off its dollar peg after a deliberate exploit allowed an attacker to mint millions of USR tokens. Resolv Labs announced on X that the protocol’s functions were paused to curb further damage and that the team is working on recovery efforts. On Sunday, the attacker minted 50 million USR, apparently by depositing 100,000 worth of USDC, prompting a rapid depeg and a liquidity crunch across the USR market.
Subsequent on-chain data and posts from observers indicated additional minting of another 30 million USR, intensifying concerns about the contract’s minting logic and the integrity of the asset’s price mechanism. The incident has spilled into multiple liquidity pools, with USR trading far below its $1 target and liquidity drying up as participants moved to exit into stablecoins and other assets.
As the market absorbed the shock, D2 Finance assessed that the minting function on USR’s contract was compromised in some way—whether the oracle was gamed, the off-chain signer was breached, or the value validation between request and completion was absent. The unfolding events have underscored ongoing material risks in DeFi tokens that rely on on-chain oracles and programmable minting rules, even when paired with ostensibly simple dollar-pegged design goals.
Key takeaways
- Attacker minted 50 million USR by depositing USDC, triggering a rapid depeg from $1 and a rush to exit across multiple protocols.
- Early reports indicate a second round of minting added another 30 million USR, intensifying liquidity strain and price slippage.
- The attacker’s cash-out path moved USR into USDC and USDT, then into ETH, with signs of aggressive, high-speed liquidation across venues.
- Resolv Labs paused protocol functions to prevent further damage and is pursuing recovery; the incident highlights potential weaknesses in mint functions and cross-protocol risk controls.
- Market data shows USR trading around the high 80s of a dollar, after a flash-crash low near 2.5 cents on Curve Finance; liquidity across the USR/USDC pool has been severely disrupted.
What happened on the chain and why it matters
On-chain monitoring and social posts outline a sequence that began with a minting event: the attacker leveraged a vulnerability in USR’s contract to generate 50 million new tokens. The attacker funded this mint by placing USDC into the contract, effectively borrowing value to create new supply without tangible backing. The immediate result was a dramatic loss of confidence in USR’s peg and a wave of rapid transfers as users sought to convert USR into more stable assets.
Analysts from D2 Finance described the mint function as “broken” or inadequately protected. They elevated three possible root causes: a compromised oracle feeding price data, a breached or compromised off-chain signer authorizing minting, or simply missing or incorrectly enforced validation between the request to mint and the completion of that mint. The exact mechanism may influence how quickly the protocol can recover and what kind of remedies (including contract fixes or token burns) could restore value stability.
The incident comes amid a broader backdrop where crypto exchanges and protocols have reported a decline in February hacks, even as on-chain exploits and phishing remain persistent threats. The event with USR underscores that dollar-like stablecoins tied to smaller projects can suffer outsized volatility if the underlying minting logic is vulnerable or if market liquidity is fragile.
Market and recovery dynamics
According to observers, the attacker moved the minted USR across several protocols, swapping into stablecoins such as USDC and USDT and then converting into ETH. The exit flow fits a pattern described as a “full-speed” DeFi cashout, where an attacker prioritizes rapid liquidity withdrawal to minimize exposure to slippage and liquidity gaps across multiple venues.
As USR traded, prices showed a steep deviation from the $1 peg. In some venues, USR fetched as little as 50 cents on certain trading pairs, reflecting liquidity constraints and slippage across protocols. By early reporting, USR hovered around the upper 80-cent range, roughly 13% below the peg, with the Curve Finance USR/USDC pool recording a flash crash to around 2.5 cents at one point. The pool’s 24-hour volume stood at several million dollars, signaling that liquidity was being strained while traders sought to capitalize on temporary price dislocations. The liquidity crisis extended to other venues, as reflected in observable on-chain transaction failures tied to urgent liquidation attempts.
Resolv Labs responded by pausing protocol activities to prevent further exploitation, a step aimed at stabilizing the situation while investigators and the team’s security partners assess next steps. Observers have noted that the speed and scale of the minting and cashout imply a concerted attempt to harvest value before confidence returns, a pattern consistent with DeFi hacks that pivot toward rapid liquidity extraction.
The broader DeFi community will be watching whether Resolv Labs can implement robust fixes to the minting mechanism, restore liquidity, and restore trust in USR. The incident raises questions about whether similar vulnerabilities exist in other projects’ minting contracts and how well-layered governance, oracles, and signer architectures withstand sophisticated attacks.
What readers should watch next
Recovery trajectories in complex DeFi incidents hinge on several moving parts: contract-level security patches, post-incident audits, and the resilience of liquidity across major venues. Key areas to monitor include whether Resolv Labs can implement a secure upgrade to the USR contract, how the project handles valuation and backstopping to restore the peg, and whether any external liquidity support or governance-driven measures are deployed to stabilize the market.
Investors and users should also track updates from security researchers and exchanges, who may publish further on-chain findings, potential incident timelines, and recommended risk mitigations for similar tokens. As with many DeFi exploits, the line between on-chain vulnerabilities and off-chain governance decisions will shape both the speed and the scope of a potential recovery.
In the near term, the market will likely remain cautious around USR while the team’s recovery plan takes shape and third-party audits validate fixes to the minting logic. The event will be a reminder that even seemingly straightforward stablecoins can carry outsized risk if their core economic controls are not airtight, especially in a fast-moving, liquidity-dependent ecosystem.
Crypto World
Crypto Layoffs Surge in 2026 as Firms Slash Jobs, Blame Weak Markets and AI Integration

TLDR:
- Over 450 crypto jobs have been cut in weeks, with Gemini, Algorand, and Crypto.com leading the layoffs in early 2026.
- New crypto job postings dropped roughly 80% year-over-year, averaging just 6.5 listings per day in January 2026.
- Companies like Gemini and Crypto.com blamed AI integration for workforce reductions, shifting toward leaner operations.
- Industry experts say AI is not the real cause — collapsed sectors like restaking, DePIN, and L2s are driving most cuts.
Crypto layoffs are accelerating in early 2026, with several major firms cutting hundreds of jobs within weeks. Algorand Foundation, Gemini, Crypto.com, OP Labs, and PIP Labs have all trimmed their workforces recently.
Companies cite weak market conditions, falling token prices, and AI integration as primary reasons. New job postings on major crypto boards have dropped roughly 80% year-over-year. Industry observers warn the visible cuts may only be the beginning of a deeper contraction across the sector.
A Wave of Job Cuts Sweeps Across the Industry
The Algorand Foundation announced on Wednesday it was cutting 25% of its staff. The foundation employs fewer than 200 people, meaning roughly 50 positions were eliminated.
The company cited “the uncertain global macro environment” and a broader crypto market downturn as driving factors.
Gemini announced around 200 layoffs in February, equal to roughly a quarter of its staff. That figure climbed to 30% by mid-March.
In a shareholder letter, the company stated, “AI is now too powerful not to use at Gemini,” adding that not using AI would soon be like arriving to work with a typewriter instead of a laptop.
Crypto.com then announced it was trimming 12% of its workforce, equivalent to about 180 roles. A company spokesperson told CoinDesk, “We are joining the list of companies integrating enterprise-wide AI,” pointing to greater efficiencies that require fewer workers. CEO Kris Marszalek posted on X that companies failing to adopt AI into their processes would ultimately fail.
OP Labs, the team behind layer-2 blockchain Optimism, cut 20 employees earlier this month. PIP Labs, the team behind Story Protocol, let go of five full-time staff and three contractors. Those cuts represented approximately 10% of PIP Labs’ total workforce.
Messari, a crypto data provider now billing itself as an AI-first company, announced its third round of layoffs since 2023.
The firm once targeted a team of 1,000 analysts but now employs roughly 140 people. A CEO change also accompanied the announcement, though Messari did not disclose exact numbers.
Industry Consolidation Points to a Deeper Contraction
Excluding Messari, the companies mentioned above have announced around 450 job cuts in just a few weeks. That tally could grow, as the full scope of industry cuts typically takes months to emerge. During the crypto winter of 2022, CoinDesk tracked over 26,000 job losses across the full year.
New job postings on major crypto job boards averaged roughly 6.5 per day in January 2026. That figure is down approximately 80% compared to the same period a year earlier. The steep decline reflects a market pulling back sharply on new hiring activity.
Dan Escow, founder of crypto recruitment agency Up Top, challenged the AI-driven narrative directly. He said, “I see no real indication that these layoffs have anything to do with AI workforce replacement at scale.” He added that entire sectors like restaking, DePIN, and L2s that were once full of talent are now “basically non-existent.”
Escow further stated that companies are “forced into cost-cutting mode to buy time to figure out how to execute on whatever comes next.”
That assessment aligns with Algorand’s cuts, which hit community management and business development roles. Those are not positions typically displaced by AI tools.
Algorand’s ALGO token recently traded around $0.09, down 98% from its 2019 peak. Bitcoin, the largest cryptocurrency by market cap, has lost 20% this quarter alone. M&A activity is also adding to redundancies, as acqui-hires continue displacing legacy staff across the sector.


XRP slipped lower after another failed recovery attempt, with high-volume selling pushing the token back toward key support near $1.40.
News Background
- XRP remains stuck in a broader corrective phase that has persisted since its mid-2025 peak, with rallies consistently failing to build follow-through.
- The latest pullback comes after a brief mid-March rebound stalled below $1.60, reinforcing the pattern of lower highs that has defined price action in recent months.
- Macro conditions continue to weigh on sentiment, with crypto markets trading cautiously following the Federal Reserve’s latest policy stance. XRP’s structure remains largely technical, with traders focused on whether the token can stabilize or continue drifting lower within its established range.
Price Action Summary
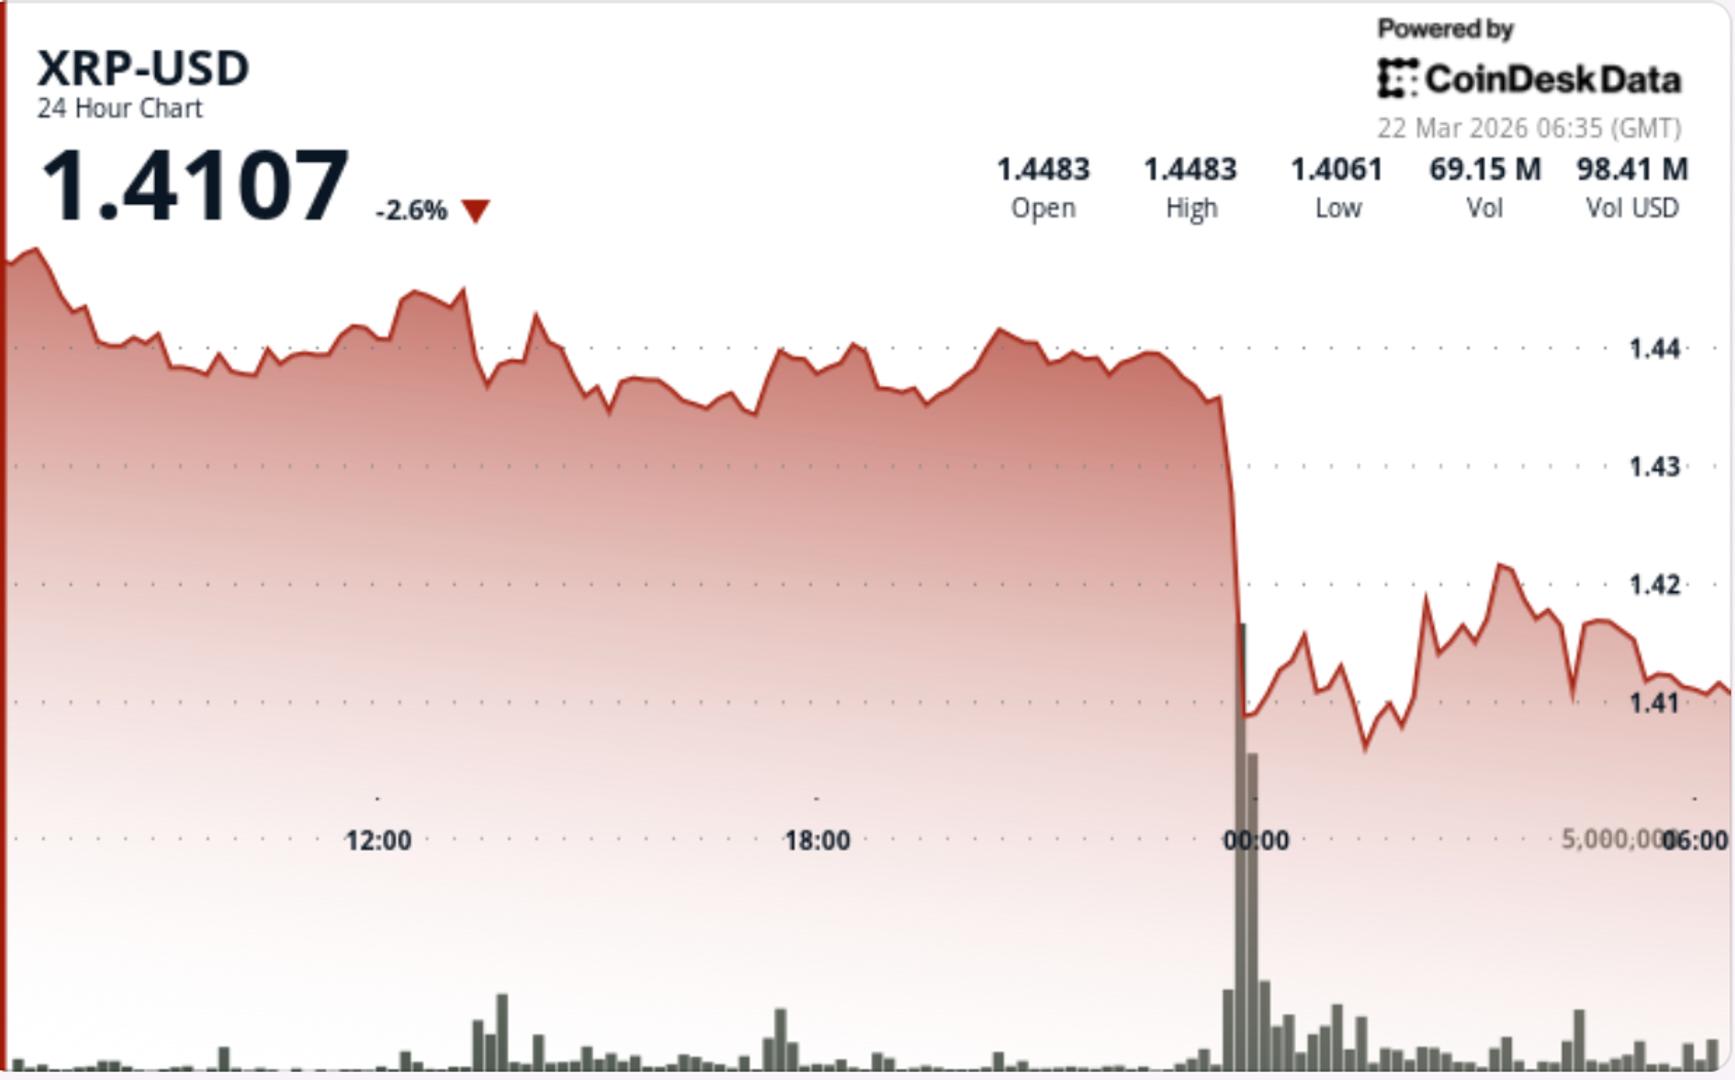
- XRP fell from $1.4457 to $1.4079, down roughly 2.6%
- Price traded near $1.44–$1.45 before breaking down late in the session
- Selling accelerated on a volume spike more than 3x the daily average
- The token stabilized near $1.40 after setting a low around $1.4018
Technical Analysis
- The key move was the late-session break below $1.44 support, which triggered a sharp drop on elevated volume — a sign of active selling rather than passive drift.
- Short-term structure remains weak. XRP continues to form lower highs, and recent recovery attempts have stalled below $1.60, keeping the broader downtrend intact.
- The $1.40 area is now acting as immediate support, with buyers stepping in after the breakdown. A minor bounce has formed, but price remains below prior support levels that have now turned into resistance.
- On higher timeframes, XRP is still trading within a descending channel that has guided price since mid-2025, reinforcing the idea that rallies are corrective unless key resistance levels are reclaimed.
What traders say is next?
- Traders are focused on whether XRP can hold above $1.40.
- If support stabilizes, the token may consolidate before attempting another move toward $1.44–$1.45, with a broader test near $1.55–$1.60 needed to shift momentum.
- If $1.40 breaks, downside risk opens toward the $1.30–$1.32 zone, where weaker support lies and previous moves have lacked strong buyer interest.

money counting machine #shorts #shortsfeed
Gethin Jones’ split from world-famous fiancee and Helen Skelton addressing romance rumours

Thailand Travel Mart Plus 2026 set for June in Pattaya


-

 Tech7 days ago
Your Legally Registered ‘Motorcycle’ Might Not Count Under Proposed US Law
-

 Fashion2 days ago
Weekend Open Thread: Adidas – Corporette.com
-

 Politics2 days ago
Jenni Murray, Long-Serving Woman’s Hour Presenter, Dies Aged 75
-
 Tech5 days ago
Are Split Spacebars the Next Big Gaming Keyboard Trend?
-

 Crypto World12 hours ago
Best Crypto to Buy Now: Strategy Just Spent $1.57 Billion on Bitcoin During Fear While Early Investors Quietly Enter Pepeto for 150x Potential
-

 News Videos4 days ago
RBA board divided on rate cut, unusually buoyant share market | Finance Report | ABC NEWS
-

 Crypto World13 hours ago
Bitcoin Price News: Bhutan Sells $72 Million in BTC Under Fiscal Pressure, but the Smart Money Entering Pepeto Sees What the Market Does Not
-

 Business7 days ago
Search for Savannah Guthrie’s Mother Enters Seventh Week with No Arrests
-
 Crypto World1 day ago
NIO (NIO) Stock Plunges 6.5% as Shelf Registration Sparks Dilution Worries
-

 Business6 days ago
Australian shares drop as Iran war enters third week
-

 Crypto World6 days ago
Crypto Lender BlockFills Enters Chapter 11 with Up to $500M in Liabilities
-

 Politics4 days ago
The House | The new register to protect children from their abusers shows Parliament at its best
-

 Fashion6 days ago
25 Celebrities with Curly Hair That Are Naturally Beautiful
-

 Tech2 days ago
inKONBINI Lets You Spend Summer Days Behind the Register
-

 Crypto World4 days ago
Canada’s FINTRAC revokes registrations of 23 crypto MSBs in AML crackdown
-
 Politics5 days ago
Real-time pollution monitoring calls after boy nearly dies
-
 NewsBeat4 days ago
Residents in North Lanarkshire reminded to register to vote in Scottish Parliament Election
-

 Business6 days ago
Meta planning major layoffs as AI spending and automation reshape workforce
-

 News Videos4 days ago
PARLIAMENT OF MALAWI – PAC MEETING WITH REGISTRAR OF FINANCIAL ON AMARYLLIS HOTEL – INQUIRY LIVE
-
Crypto World7 days ago
U.S. Oil Companies Post Record Profits as Oil Prices Break $100
You must be logged in to post a comment Login