
Crypto World
XRP hits bottom as setup mirrors a move that preceded the 2017 rally


- XRP may have completed a long correction and formed a market bottom.
- Analysts say the current setup mirrors the pattern before the 2017 rally.
- A Wave-5 breakout could drive XRP toward the $5.85 target.
XRP has spent the past several months moving through a slow and frustrating consolidation phase that many traders now believe may represent the final stage of its correction.
The digital asset is currently trading around $1.38 after a period of mixed performance that has seen short bursts of strength followed by pullbacks.
This kind of sideways movement often appears near the end of a market correction, which is why some analysts are beginning to argue that XRP may already be forming a long-term bottom.
The argument is based on a technical structure that looks strikingly similar to the pattern that developed before XRP’s historic rally in 2017.
Back then, the token spent months drifting through a quiet accumulation phase while the broader market paid little attention to it.
When the breakout finally arrived, the price accelerated rapidly and caught much of the market off guard.
Today, analysts believe the same type of structure may be forming once again.
$XRP‘s pattern setup and breakout process was extremely similar to that 2017 move and with this being, there is potential we see this overall run unfold in an identical manner.
Doing so means that right now is only a temporary pullback before a move well above the $20 mark… pic.twitter.com/1MIriZ4Rqn
— JAVON⚡️MARKS (@JavonTM1) March 7, 2026
Several technical charts show XRP completing a large corrective pattern that has been unfolding for months.
According to this view, the correction appears to have finished its final wave, which often marks the point where a new bullish cycle begins.
If the structure continues to play out as expected, XRP could now be entering the early stage of its next major upward move.
This possibility has renewed interest among traders who remember how quickly XRP moved once momentum returned during the previous cycle.
Analysts point to a potential Wave-5 breakout
Furthermore, a number of market analysts have turned to Elliott Wave theory to explain why they believe XRP may be close to a turning point.
Under this model, markets move through a series of impulsive waves followed by corrective phases that prepare the ground for the next advance.
Some analysts, like Dark Defender, believe XRP has just completed an extended corrective structure that lasted several months.
That correction appears to have formed an ABC pattern, which is often seen near the end of a downward phase.
With that structure now appearing complete, analysts say the market may be entering the final upward wave of the cycle.
This final stage is known as Wave 5 and is typically associated with strong bullish momentum.
One widely discussed projection places the next major price objective near $5.85 if the breakout develops as expected.
Reaching that level would represent a substantial recovery from current prices and would mark one of the strongest rallies XRP has seen in years.
XRP completed the large C Wave with 5 Sub-Waves.
Wave 5 towards the $5.85 level is here.
(N F A)#XRP Bull Run will be facemelting. pic.twitter.com/8yQaJcfLjq— Dark Defender (@DefendDark) March 10, 2026
However, analysts also emphasise that the move will likely unfold in stages rather than in a straight line.
Several resistance zones remain along the path, including levels near $1.88, $2.35, and just above the $3 mark.
Each of these areas could slow the advance as traders take profits and the market absorbs new buying pressure.
Still, clearing those barriers could open the door for a much larger move.
Long-term projections stretch far beyond the first targets
While the $5.85 level has attracted attention in the short term, some analysts believe XRP’s potential upside could extend much further.
A more aggressive interpretation of the current wave structure suggests the asset could eventually climb toward the $8 to $14 range during the next phase of the cycle.
In the most optimistic scenario, the final leg of the rally could even approach the $20 region if market conditions remain supportive.
These projections remain speculative, but they reflect growing confidence that the current structure may be setting up a larger trend reversal.

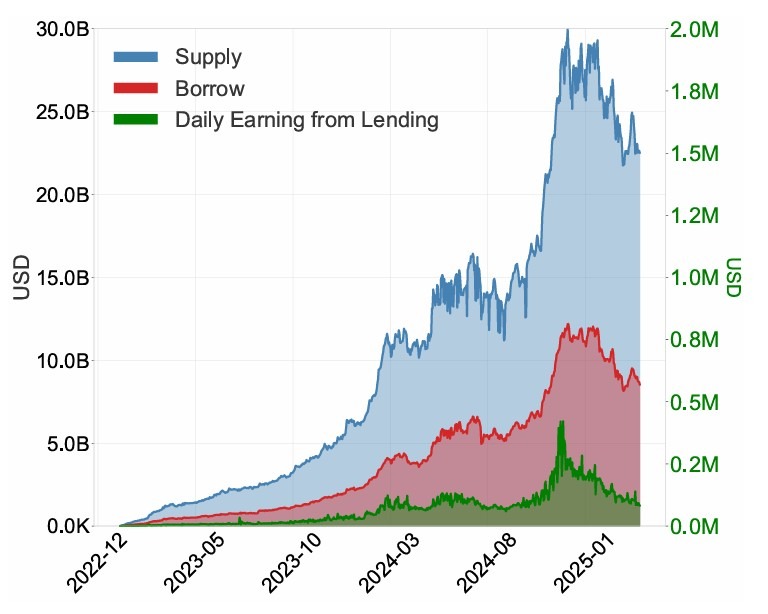
A Bank of Canada staff paper found that Aave V3 reported zero non-performing loans in 2024, with overcollateralization and automated liquidations helping prevent lender losses in its Ethereum lending market.
Using transaction-level data from Jan. 27, 2023, to May 6, 2025, the study found that positions were typically liquidated before collateral values fell below outstanding debt, helping contain lender losses across the sample.
But the model came with a tradeoff, the paper said. While it protected lenders from unrecovered losses, it also shifted risk onto borrowers and constrained capital efficiency compared with traditional lending systems.
According to the paper, Aave V3’s design relies on automated risk controls rather than traditional underwriting, requiring borrowers to post more collateral than they borrow and liquidating positions when they breach risk thresholds.

Recursive leverage fueled borrowing demand
According to the paper, Aave V3’s lending activity was not driven solely by users seeking liquidity. It found that recursive leverage accounted for over 20% of total borrowed volume and 8.2% of borrowing transactions during the sample period.
Recursive leverage involves repeatedly borrowing against collateral, redeploying the borrowed assets as new collateral and borrowing again to amplify exposure.
Related: Aave V4 goes live on Ethereum after governance vote clears rollout
The study said the dynamic made borrowers more exposed when markets turned. According to the paper, liquidations on Aave V3 tended to occur in concentrated waves, with four assets accounting for 90% of total liquidated value.
This includes Wrapped Ether (WETH), Wrapped Staked Ether (wstETH), Wrapped Bitcoin (WBTC) and Wrapped eETH (weETH).
The paper estimated that borrower losses during major liquidation events could be significant. It said liquidation fees typically ranged from 5% to 10% of liquidated value, while missed gains from subsequent price recoveries pushed combined losses to about 10% to 30% in some cases.
The staff paper suggested that while the design for Aave V3 helped prevent unrecovered bad debt in the sample, it did so by exposing borrowers to abrupt losses when collateral prices fell sharply.
Cointelegraph reached out to Aave for comment but did not receive a response before publication.
Magazine: Are DeFi devs liable for the illegal activity of others on their platforms?
Crypto World
Ripple (XRP) Price Prediction: CLARITY Act Targets April Markup While Taurox (TAUX) Nears Phase 4 In a Month After Launch

The topic of Ripple (XRP) price prediction is gaining renewed attention as the CLARITY Act moves toward a late April markup with 72% odds of passing according to prediction market data. XRP is trading around $1.30 following a 22% decline triggered by Trump Liberation Day tariffs on April 2, which imposed duties ranging from 10% to 50% across global trading partners.
Six spot XRP ETFs now hold approximately $1 billion in combined assets under management. Taurox (TAUX) is a decentralized hedge fund protocol where AI agents will trade pooled capital and stakers keep 80% of all profits.
XRP Price Prediction for 2026 and 2028 as Digital Commodity Status Reshapes Outlook
Standard Chartered projects XRP at $2.80 by the end of 2026 and $12.60 by 2028, contingent on sustained ETF inflows and regulatory clarity from the CLARITY Act. The SEC and CFTC have classified XRP as a digital commodity, removing the securities overhang that suppressed institutional adoption for years. Ripple Prime now appears on the DTCC and NSCC directory, signaling deeper integration with traditional settlement infrastructure.
Argentina’s YPF recently tokenized $800 million in energy assets on the XRP Ledger, and an AI-driven security upgrade identified more than 10 bugs in the XRPL’s 14-year codebase. A survey of institutional allocators found that 25% of fund managers plan to add XRP to their portfolios this year. Stakers in protocols built around yield generation keep 80% of trading profits, a structure absent from XRP’s validator-based fee model.

Taurox IO Offers the Structural Upside That XRP Cannot Match Before the End of the Presale
For XRP to reach Standard Chartered’s $12.60 target, its market capitalization would need to exceed $700 billion, a figure that places it above every crypto asset except Bitcoin. The Fear and Greed Index has remained at 9 for more than 47 consecutive days, and the S&P 500 fell 5.1% in Q1, its worst first quarter since 2022. Tariff-driven volatility and compressed risk appetite make large-cap moonshots harder to justify.
Taurox operates on a different scale entirely. The protocol is still in its presale phase with a $0.015 entry, listing target of $0.08, and a path to $1 that represents a 100x return. Before the end of the presale, each closing round raises the floor price permanently. That is a structural advantage no large-cap token can offer at its current valuation.

Two Sold-Out Phases and a $0.015 Entry Make Taurox the Sharpest Position in This Market
Phase 1 sold out in under 24 hours at $0.01. Phase 2 sold out at $0.012. Phase 3 is live at $0.015, and the protocol has raised over $890K across all rounds. The listing price of $0.08 is a 5.33x multiple from current entry. The $1 target represents a 100x return. At a $1 billion pool, the implied TAUX value reaches $1.85. A $500 position at $0.015 buys 33,333 TAUX. At the $0.08 listing that is $2,666. At $1 that is $33,333. The protocol charges zero management fees with 5% taken from profits only. Thirty percent of all fee revenue is burned permanently, 70% flows to the DAO treasury. The total supply is fixed at 2 billion tokens with no minting capability. Every phase that closes removes the lowest entry point from the table.
Conclusion
XRP at $1.30 carries institutional momentum from ETF inflows and commodity classification, but the upside math at large-cap scale is measured, not sharp. Taurox at $0.015, with two sold-out phases, over $890K raised, AI agents that will trade pooled capital, and 80% profit share to stakers, compresses the same institutional thesis into a fraction of the entry cost.
FAQs
What is the Ripple (XRP) price prediction for 2026?
Standard Chartered projects XRP at $2.80 by end of 2026, driven by ETF inflows and the CLARITY Act passing with 72% odds. XRP is currently trading around $1.30 after a tariff-driven selloff.
Will XRP benefit from the CLARITY Act passing?
If the CLARITY Act passes markup in late April, it would formalize XRP’s digital commodity status and remove remaining regulatory uncertainty. That clarity could accelerate institutional allocation from the 25% of fund managers already planning XRP positions.
How does Taurox compare to holding XRP for returns?
Taurox Phase 3 is priced at $0.015 with a listing target of $0.08 and a $1 path that represents 100x. XRP at $1.30 targeting $2.80 offers roughly 2x. The structural gap in upside potential is the primary reason capital is rotating.
Learn More
Buy TAUX: https://taurox.io
Whitepaper: https://docs.taurox.io/
Official Telegram: https://t.me/tauroxlabs
Official X/Twitter: https://x.com/TauroxProtocol
Disclaimer: This is a Press Release provided by a third party who is responsible for the content. Please conduct your own research before taking any action based on the content.


Macro investor and former hedge fund manager James Lavish warns that markets may be pricing in a swift settlement to the Iran conflict, but a drawn-out flare-up could unleash renewed inflation pressures and a sweeping asset repricing across equities, bonds, and crypto. In a recent Cointelegraph interview, Lavish laid out how persistent geopolitical risk could shape the macro landscape and test Bitcoin’s role as a hedge in ways not seen since the early post-crisis era.
Lavish argued that if the conflict drags on and keeps oil prices elevated, inflation dynamics could reaccelerate and stoke fears of stagflation. That combination would complicate the Federal Reserve’s policy calculus: the central bank would face a difficult trade-off between avoiding recession through aggressive hikes and not stoking inflation by keeping rates too high for too long. In such a setting, Bitcoin’s behavior—already divergent from gold and traditional equities in recent months—could come under pressure if a broad risk-off regime takes hold and correlations across risky assets rise toward one.
Markets may be pricing in a quick resolution to the Iran conflict, but if that assumption proves wrong, the consequences could be severe,
Lavish noted that a deeper macro downturn could see Bitcoin retreat further, with a plausible path toward the low-to-mid 40,000s or the low 50,000s if risk-off dynamics intensify. He stressed, however, that his longer‑term view of Bitcoin remains constructive and that such a pullback would not automatically invalidate the asset’s underlying thesis. Instead, it could present a meaningful opportunity for investors who balance exposure and leverage amid headlines driven by war fears, bond stress, and shifting expectations about Fed policy.
The interview touches on a broad spectrum of themes that matter for crypto markets—safe-haven dynamics, energy markets, Treasury yields, and the broader money-printing debate. Lavish’s perspective is anchored in a wary reading of how geopolitics interact with inflation, policy, and asset pricing, offering a lens for traders to navigate a landscape where macro shocks can rewire correlations and reinvestment flows.
Readers who want the full context can watch the entire discussion on Cointelegraph’s YouTube channel, where Lavish expands on his framework for war risk, recession risk, and Bitcoin’s next move.
Key takeaways
- Prolonged Iran-related conflict and higher oil prices could reignite inflation, intensifying stagflation fears and prompting a broad market repricing.
- The Federal Reserve may face a policy conundrum: aggressive rate hikes risk recession, but persistent inflation complicates any easy path to rate cuts.
- Bitcoin’s recent resilience versus gold and equities may not hold in a genuine panic regime with rising correlations across risk assets.
- In a deeper drawdown, BTC could slide toward the high 40,000s to around 50,000, highlighting the importance of risk management and position sizing.
- Even with near-term risks, Lavish suggests a long-run constructive view on Bitcoin, advocating balanced exposure rather than extreme leverage or complete abstention.
Market backdrop and Bitcoin’s test in a macro shock
The core tension centers on how geopolitics translates into macro momentum. An extended Iran flare-up could push energy prices higher for longer, feeding a renewed inflation scare that rubs against central-bank normalization efforts. In Lavish’s framing, the market would be forced to price in a more complicated trajectory for the Fed: keep policy tight to prevent inflation from reigniting, while acknowledging the risk of growth deterioration if that stance triggers a recession.
This setting is particularly relevant for Bitcoin, which has carved out a narrative as a hedge or diversification asset in recent quarters. Yet the same conditions that helped BTC resist traditional sell-offs at times could reverse under a “correlation-to-one” shock, where equities, bonds, and crypto all move in lockstep toward risk-off territory. Lavish’s view underscores a key paradox for investors: BTC’s elasticity to macro risk can be situational, and its protective qualities are not guaranteed in a full-blown panic scenario.
What to watch next: signals, flows, and policy shifts
Looking ahead, the path for Bitcoin will be tethered to three intertwined factors. First, oil and energy markets will test the durability of inflation expectations. Second, the Fed’s response—how quickly it leans into or against inflation signals—will shape risk appetites and funding costs across markets. Third, hedging dynamics and the behavior of large funds and treasuries will influence whether BTC remains an uncorrelated alternative or simply another risk asset tethered to the broader cycle.
Lavish also emphasizes prudent risk management: avoid over-leveraged positions in a volatile macro environment and maintain some exposure to Bitcoin without letting single headlines dictate allocations. The broader takeaway is not a bearish call for crypto, but a reminder that macro-driven shocks can realign asset relationships in meaningful ways—and preparedness matters for traders and investors alike.
As the situation evolves, readers should monitor geopolitical developments, energy price trajectories, and inflation data, all of which will feed into Fed expectations and, by extension, Bitcoin’s price path in the near term.
In the meantime, the full interview offers a deeper dive into war risk, economic resilience, and Bitcoin’s strategic role in a shifting macro landscape. It serves as a reminder that the most consequential moves in crypto often hinge on how macro narratives unfold when headlines dominate headlines and policy signals follow a volatile, uncertain arc.
This analysis was adapted from James Lavish’s remarks in a Cointelegraph interview. The discussion continues to illuminate how macro uncertainty can redefine what qualifies as “safe” in crypto markets and where opportunities may arise as the narrative evolves.


Marex’s Nvidia‑linked “prediction market bond” pays 7% if NVDA stays the world’s most valuable company for a year, wrapping Polymarket‑style odds into principal‑protected credit.
Summary
- Marex issues a bond-like note that pays a 7% coupon if Nvidia remains the world’s most valuable company in one year while returning principal if it does not.
- The structure mirrors a principal‑protected structured note, shifting prediction‑market style bets into regulated credit markets with Marex as issuer and credit risk.
- The deal comes as prediction markets like Polymarket see institutional capital inflows and Nvidia’s market cap hovers around $4.3 trillion, cementing its role at the center of the AI trade.
Marex Group has created and sold what it calls the first “prediction market bond,” a structured note that pays a 7% annual coupon in $ if Nvidia Corp. is still the world’s largest company by market value in one year, and simply returns principal if it is not. London‑based Marex is marketing the instrument to institutional clients as a way to express views typically traded on event‑driven platforms such as Kalshi and Polymarket, but without the all‑or‑nothing loss profile of traditional prediction markets. According to Bloomberg, the payoff hinges on a single observable outcome: Nvidia’s standing in the global equity league table at maturity, with investors exposed primarily to Marex’s own credit risk rather than direct equity downside.
The structure blends a zero‑coupon bond with an embedded derivative replicating the odds implied by event markets and options desks, effectively “gambling the yield” while preserving principal, as several market commentators on X noted. One user, @trevorlasn, summarized the economics bluntly: “you get 7% upside with principal protection? that’s just a structured note with better marketing lol,” while @StephGuildNYC asked, “Isn’t this just a principal protected structured note? They’ve been around for ages.”
Another commentator, @JamesChristoph, cautioned that “the risk reward here sounds good, but the payoff is quite bad,” echoing longstanding criticism that structured notes often favor issuers over buyers. In a separate X thread, @MickBransfield framed the deal more expansively: “marex issued a bond that pays 7% if nvidia stays the world’s largest company for a year. prediction markets just got a prospectus.”
Nvidia, currently valued at roughly $4.3 trillion in market capitalization, sits at the center of the global AI trade and remains the world’s most valuable listed company by a margin of more than $400 billion over Apple, according to recent market data. The note’s 7% $ coupon effectively prices the probability that Nvidia can retain that top slot for another year, a question that has been actively traded on on‑chain prediction venues as investors debate how far the AI cycle can run. Those venues have grown rapidly: Polymarket alone saw about $12 billion in trading volume in January 2026, generating over $11 million in on‑chain fees as users speculated on politics, commodities, and crypto prices. Intercontinental Exchange, parent of the New York Stock Exchange, has committed $2 billion to the sector, including a fresh $600 million investment in Polymarket, underscoring how event contracts are bleeding into mainstream market infrastructure. In a recent crypto.news story on Polymarket’s integration with Solana via Jupiter, prediction markets were described as “expanding rapidly heading into 2026,” a backdrop that helps explain why Marex is now wrapping such outcomes into regulated credit products.
The Marex deal also lands as crypto‑native prediction markets deepen their ties to traditional assets, with Polymarket rolling out stock and commodity contracts powered by Pyth Network’s price feeds and centralized exchanges like Deepcoin integrating “event contracts” tied to macro and crypto outcomes. Another crypto.news story highlighted how Vitalik Buterin has deployed roughly $440,000 across Polymarket, booking about $70,000 profit by fading “crazy mode” tail‑risk bets, illustrating how sophisticated traders already treat these markets as yield‑like instruments rather than pure gambling. Against that backdrop, Marex’s bond can be read less as a one‑off curiosity and more as an explicit bridge between on‑chain event speculation and off‑chain structured credit, one that denominates prediction risk in $ coupons instead of tokens.

Europe’s next crypto battle is no longer about whether to regulate the industry, but who gets to hold the pen. European Union leaders are weighing a European Commission proposal to hand direct supervision of the bloc’s largest crypto asset service providers (CASPs) to the Paris-based European Securities and Markets Authority (ESMA), shifting front-line control away from national regulators.
France, Austria and Italy believe the move is overdue. In a joint September 2025 paper, their market authorities called for “a stronger European framework,” arguing centralized oversight is needed to address “major differences” in how countries authorize firms and curb regulatory shopping.
Malta’s Financial Services Authority (MFSA) is not convinced. A spokesperson told Cointelegraph it is “premature to introduce structural changes” like centralized supervision. The Markets in Crypto Assets Regulation (MiCA) regulation has only recently become fully applicable, and its “impact on the market and market players is still being assessed,” they said.
The dispute matters because MiCA lets companies win authorization in one member state and then passport services across the EU. That means the question of who supervises crypto firms is no longer just administrative, but goes to how Europe will balance market integration, investor protection and national regulatory authority.
While a recent Bloomberg report framed the fight as one small state against the commission, Ian Gauci of Maltese law firm GTG, one of the architects of Malta’s original crypto rulebook, told Cointelegraph, “That is not what this is.” He said Malta’s arguments “are not jurisdictional” and “go to the structure itself and how it will behave wherever it is applied in the Union.” The MFSA said its position was not about national advantage but about “regulatory timing and effectiveness” and preserving Europe’s attractiveness to crypto firms.
Related: What happens as Europe enforces MiCA and the US delays crypto rules
Centralizing supervision under one roof
The ESMA already leads the supervisory convergence work, coordinating peer reviews of national authorities, including a fast-track review of one of Malta’s CASP authorizations, widely reported to be OKX. The review found Malta met expectations on supervisory settings, but that the firm’s authorization “should have been more thorough.”

Supporters of centralization say that the episode makes the case. A spokesperson from the ESMA told Cointelegraph that a single supervisor for major cross-border companies would deliver “more efficient and harmonized supervision,” strengthen investor protection and reduce “the risk of forum shopping.” France, Austria and Italy similarly warned in their position paper that divergent practices could undermine investor protection and Europe’s digital asset market.
Gauci said he was not opposed to a stronger EU-level role where it is justified. But he argued that centralization should be targeted at genuinely systemic cross-border firms with clearly identified risks, rather than applied as a blanket fix for uneven supervision.
Malta warns centralization may go too far
OKX rejects the idea that companies pick smaller jurisdictions to capture regulators. Its European CEO, Erald Ghoos, told Cointelegraph that, unlike some competitors, the exchange had been supervised by Malta under a high-standard regime since 2021 and its MiCA authorization reflected a multi-year relationship, “not an expedited process.” With MiCA still rolling out, he argued that there was no evidence the current model is failing, making centralization look more like a “political decision.”
Related: What happens as Europe enforces MiCA and the US delays crypto rules
Ghoos said the case for concentrating supervisory power at the EU level had not yet been demonstrated.
Gauci accepts that inconsistencies exist but argues that the solution is to use existing tools. “Make peer reviews bite,” set timelines and impose consequences for persistent failure, rather than rewriting MiCA’s allocation of powers, he said.
His deeper concern is structural: Large firms operate as single systems, but the proposal would split oversight across ESMA, national authorities and the Anti-Money Laundering Authority (AMLA), while the Digital Operational Resilience Act (DORA) expects an integrated view of information technology risk. “Once you split supervision like this, that unity disappears,” he warned, leaving accountability fragmented in a crisis.
The real question, he said, is whether Europe values supervisory depth or scale. Early movers built expertise and proximity in a fast-moving industry; strip that away too quickly, and Europe risks replacing it with distance, removing the “incentive for jurisdictions to invest in serious supervisory capacity in the first place,” and encouraging the offshore drift policymakers want to avoid.
Magazine: 6 weirdest devices people have used to mine Bitcoin and crypto
Crypto World
XRP Price Prediction: Goldman Sachs Holds $153M in XRP ETFs While Pepeto’s 150x Presale Math Outpaces Every Large Cap Target
Goldman Sachs disclosed $153.8 million in spot XRP ETFs across four funds, making it the largest institutional XRP ETF holder at 73% of all disclosed positions combined, according to TheCCPress. The position sits inside a broader $2.36 billion crypto portfolio spanning BTC, ETH, XRP, and SOL.
The xrp price prediction turned bullish, but the wallets that built generational crypto wealth never did it watching a large cap grind from $1.31 to $4. They found the presale where the math worked and committed before the window sealed. That is Pepeto right now.
Goldman spread its position evenly across Bitwise, Franklin Templeton, Grayscale, and 21Shares, according to 24/7 Wall St. The May 13F will reveal whether the bank held through XRP’s 40% Q1 decline.
For the xrp price prediction, Goldman’s conviction is structurally bullish. But accumulating a regulated wrapper around an established coin delivers exposure, not the multiplier distance a presale to listing event creates.
XRP Price Prediction and the Best Exchange Presale of 2026
Pepeto
By the time most people hear about a token, the early multiplier is gone. Pepeto flips that timeline, placing the reader inside the presale before the Binance listing creates the gap everyone else chases.
Goldman holding $153 million validates the xrp price prediction, but generational crypto portfolios were built during presales where the founder had proven the thesis, the product was live, and the cost sat at fractions of a cent. Pepeto checks all three.
The project is a complete exchange from the architect behind Pepe’s $11 billion run on a 420 trillion supply with zero shipped features. PepetoSwap processes every trade at zero cost, and the bridge routes assets across Ethereum, BNB Chain, and Solana without gas.
SolidProof cleared every contract before the first commitment, a former Binance executive directs exchange operations, and 189% APY staking compounds daily for every wallet inside. $8.64 million flowing in at a Fear and Greed reading of 8 tells you who is committing: addresses that verified the codebase and modeled the listing before deploying.
The cofounder’s previous project reached $11 billion on a 420 trillion supply without a single working tool. Covering the distance between $0.0000001862 and that valuation is 150x, and the live infrastructure underneath makes the old ceiling look like the starting point. Every presale round that closes brings the Binance order book closer, and the addresses filling positions today did not commit without running the arithmetic first.
XRP
XRP trades at $1.31 on April 2 according to CoinMarketCap, down 30% year to date despite Goldman’s position and $1.44 billion in cumulative ETF inflows. The xrp price prediction hinges on the CLARITY Act advancing through the Senate Banking Committee in late April.
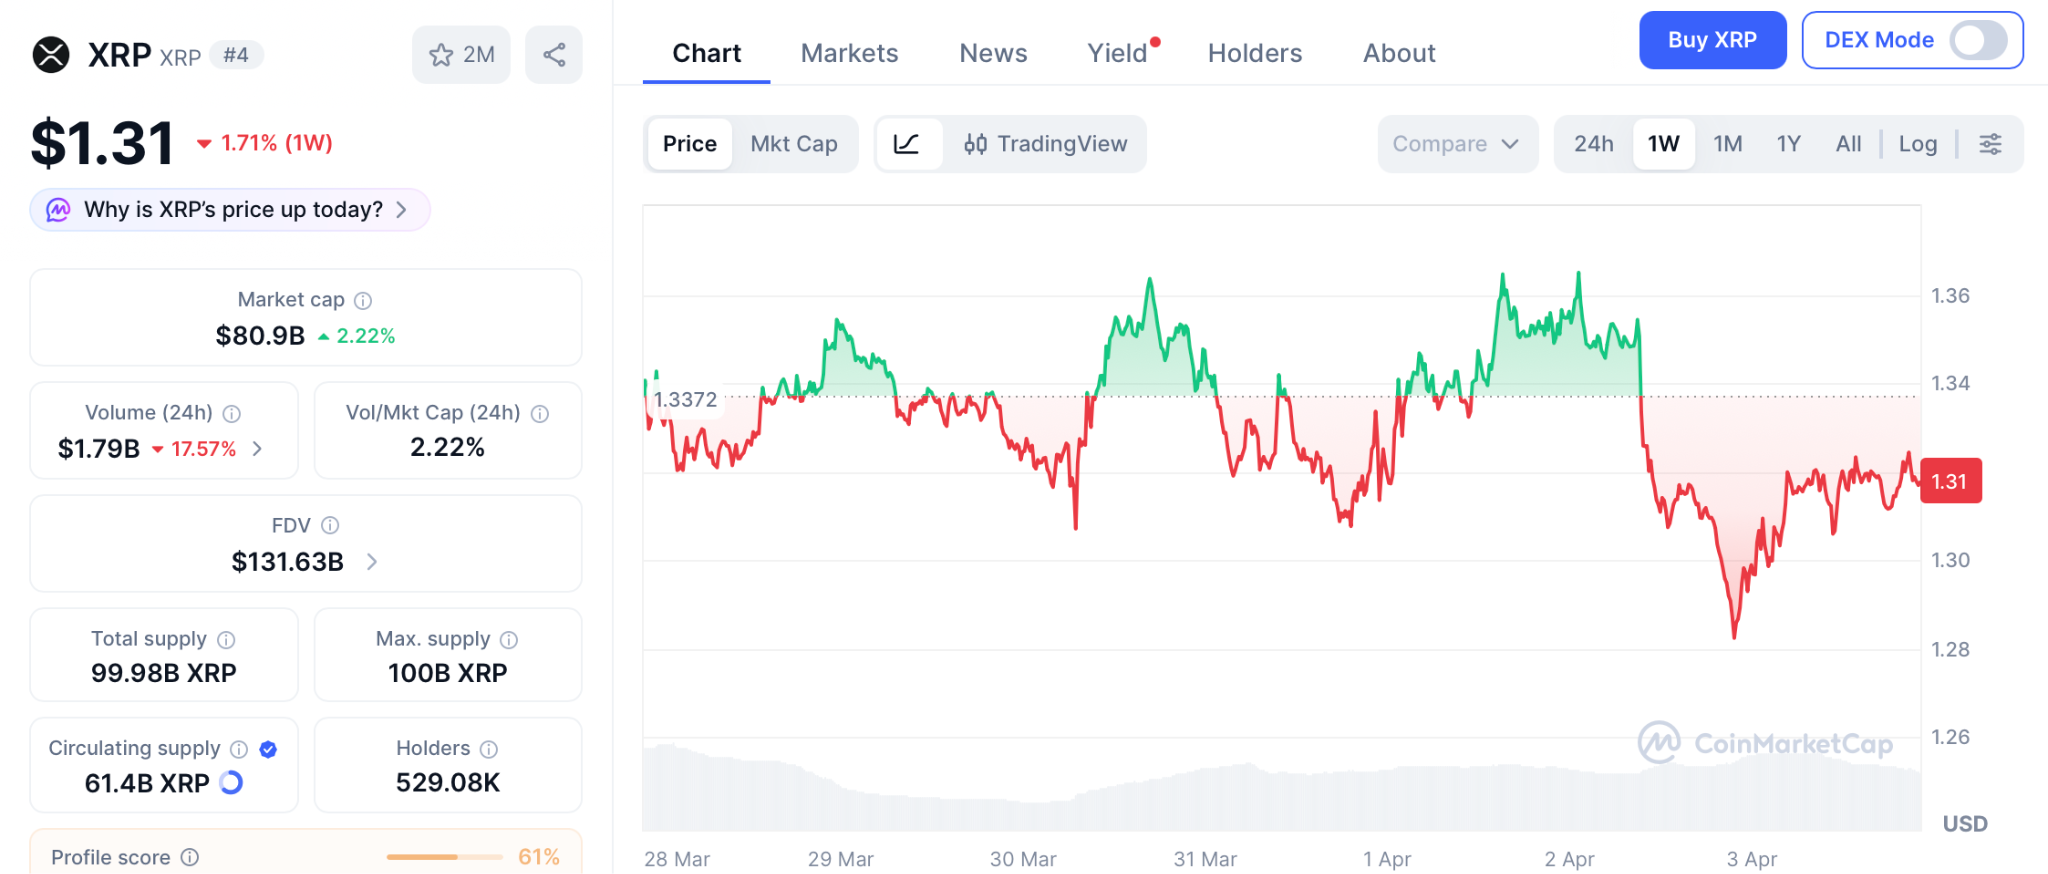
A breakout above $1.45 opens $1.80, roughly 37%. For holders, that is a welcome recovery. But the xrp price prediction math from $1.31 does not compare to a presale targeting the market cap the same cofounder already achieved.
Solana (SOL)
SOL sits at $79.81 on April 2 according to CoinMarketCap, pressured by the Drift exploit. Even a return to the $260 all time high is roughly 3.3x. The gap between that and presale to listing math is where portfolios diverge permanently.
XRP Price Prediction Is Bullish but the Presale Math Tells a Different Story
The xrp price prediction will unfold over quarters as Goldman’s next 13F lands and the CLARITY Act works through Congress. Pepeto’s presale will not wait for either.
Right now, $8.64 million sits inside the presale from wallets that moved during a Fear and Greed reading of 8. Those addresses are not guessing. They modeled the listing, verified the audit, and committed while the rest of the market was frozen. Every day that passes, the Binance listing gets one day closer and the presale gets one day shorter. There is no mechanism to extend it, no second round after it closes, and no way to buy at $0.0000001862 once the exchange opens.
The xrp price prediction conversation will still be running when Pepeto holders are already sitting on their returns. That is not a warning. It is a calendar fact. The Pepeto official website is the only place left to act on it, and the number of hours remaining is smaller than most people assume.
Enter the Pepeto presale before the Binance listing removes today’s entry

FAQs
What is the xrp price prediction after Goldman’s disclosure?
Goldman’s $153 million XRP ETF position is structurally bullish, with targets near $2.20 if the CLARITY Act passes. Pepeto at $0.0000001862 offers 150x from presale to the market cap its cofounder already reached with Pepe.
How does Goldman’s position affect the xrp price prediction?
Institutional accumulation reduces long term downside risk, but the largest returns come from presale entries before a confirmed listing, not from regulated ETF wrappers around established coins.
Is Pepeto a stronger entry than XRP right now?
$8.64 million committed during extreme fear with audited contracts, a live exchange, and the founding mind behind an $11 billion meme project. Visit the Pepeto official website before the Binance listing seals the presale.
Disclaimer: This is a Press Release provided by a third party who is responsible for the content. Please conduct your own research before taking any action based on the content.


In the latest interview with Cointelegraph, macro investor and former hedge fund manager James Lavish issued a stark warning to Bitcoin holders and global investors: markets may be pricing in a quick resolution to the Iran conflict — but if that assumption proves wrong, the consequences could be severe.
Lavish argued that if the conflict drags on and keeps pressure on oil prices, the result could be a fresh inflation shock, renewed fears of stagflation and a major repricing across global markets.
In his view, this scenario would put the Federal Reserve in an impossible position: unable to raise rates aggressively without risking recession, yet unable to cut rates due to persistent inflation.
That is where the conversation becomes especially relevant for Bitcoin (BTC). Lavish explains why Bitcoin has behaved differently from gold and equities in recent months, and why that relative resilience may not last in a true “correlation-to-one” panic event.
If markets suffer a deeper drawdown, he says, Bitcoin could fall another 10% to 20%, potentially revisiting the low $50,000 or even high $40,000 range.
And yet, Lavish is far from bearish in the long run.
One of the most compelling parts of the interview is his argument that such a sell-off would not destroy the Bitcoin thesis — it could actually create a major opportunity. He also explains why investors should avoid being either too levered or completely unexposed in a market driven by war headlines, bond stress and rapidly shifting expectations around Fed policy.
The interview also touches on safe haven investments, energy markets, Treasury yields and money printing.
If you want to understand how an experienced macro investor thinks about war risk, recession risk and Bitcoin’s next move, watch the full interview on our YouTube channel and don’t forget to subscribe!
This interview has been edited and condensed for clarity.


Gemini adds drag‑to‑modify tools to ActiveTrader, chasing speed‑focused traders even as GEMI stock trades well below its IPO price and users still complain about lag.
Summary
- Gemini’s ActiveTrader now lets users drag chart order lines and click “pills” to adjust price and size in real time.
- Tyler Winklevoss says the upgrade targets fast markets as Gemini stock trades under pressure post-IPO.
- The launch comes as Gemini’s GEMI shares lag Bitcoin’s rebound, raising questions about execution and product strategy.
Gemini has rolled out a new order modification feature for its ActiveTrader interface, allowing users to “drag order lines on charts to modify price and click order line pills to modify quantity,” according to co‑founder Tyler Winklevoss in a post on X. Winklevoss framed the update squarely around speed, telling followers that “markets move fast and you can too with @Gemini Active Trader,” alongside a short product demo video that had drawn roughly 29,400 views within hours of posting. The feature targets high‑frequency retail and professional users who need to adjust orders intraday without leaving the chart.
The enhancement builds on a broader Gemini push to make ActiveTrader more customizable, including earlier changes that let users drag and drop modules and activate a floating order form for chart‑centric workflows. On its support pages, Gemini notes that ActiveTrader already supports a full suite of market, limit, and advanced limit orders, including Immediate‑or‑Cancel (IOC), Fill‑or‑Kill (FOK), Maker‑or‑Cancel, and auction‑only instructions, in addition to stop‑limit functionality. By letting traders modify those orders directly from chart objects rather than static tickets, Gemini is closing the usability gap with established trading terminals that have long offered drag‑to‑adjust orders on price ladders and depth charts.
Early reactions on X highlight both enthusiasm and lingering pain points. “Fast moves fr,” wrote user @ZackD0x, while another former team member, @ignacio_ape, said the upgrade “brings me so much joy” and praised seeing ActiveTrader “continuing to grow even tho I’m no longer there.” Not all feedback was glowing: “Drag and drop is cool and all but I really just need the app to stop lagging during high volatility,” complained user @Steffan0xd, underscoring that execution reliability still matters more than interface polish when spreads blow out.
The product update lands as Gemini navigates a tougher market environment as a listed company. After a high‑profile Nasdaq debut in September 2025 that initially valued the exchange at about $4.4 billion, the firm’s GEMI stock has since fallen well below its IPO price, with Bloomberg reporting in February that Gemini “risks a hard landing” after a more than 40% plunge in Bitcoin and mounting operating losses. More recently, crypto.news reported that GEMI is trading below $6—down roughly 76% since the IPO—even as Bitcoin and Ethereum have rebounded, suggesting a growing decoupling between the exchange’s equity and the broader crypto rally.
That disconnect has forced the Winklevoss‑led platform to lean harder on product differentiation, rolling out features such as a self‑custody wallet, prediction markets and a more modular ActiveTrader interface in a bid to convert volatility into higher fee revenue. Whether the new drag‑to‑modify tools meaningfully move the needle will depend less on X engagement metrics and more on whether active traders actually route orders through Gemini instead of rival venues when the next leg of crypto volatility hits.


Bitcoin held above $67,000 on Good Friday as U.S. employers added 178,000 jobs in March — beating forecasts by a wide margin — while traditional markets sat closed for the Easter holiday, leaving crypto as the primary gauge of how investors are pricing the hawkish surprise.
Summary
- The U.S. added 178,000 nonfarm payrolls in March, well above consensus estimates, while unemployment fell to 4.3%, according to the Bureau of Labor Statistics.
- Bitcoin held above $67,000 on Good Friday with traditional markets closed, absorbing the hawkish macro signal with unusual composure.
- February’s payroll figure was simultaneously revised to a loss of 133,000 jobs, complicating the read on Fed policy going into Q2.
Bitcoin (BTC) held its footing above $67,000 on Good Friday, April 3, as the U.S. Bureau of Labor Statistics released a stronger-than-expected March jobs report that showed 178,000 nonfarm payrolls added last month — a figure that significantly exceeded consensus estimates of around 135,000. With traditional U.S. equity and bond markets closed for the Easter holiday, crypto was among the few liquid markets actively pricing in the data.
The BLS release, filed under code USDL-26-0580 and embargoed until 8:30 a.m. ET, showed the unemployment rate ticking down to 4.3% from 4.4% in February. At the same time, February’s payroll figure was sharply revised to a net loss of 133,000 jobs — a downward swing that softens the headline beat considerably and suggests the labor market has been weaker than previously reported entering 2026.
Bitcoin decouples — quietly
What stood out on Good Friday was what Bitcoin did not do. With stocks offline and macro traders watching from the sidelines, BTC held its ground rather than selling off on the hawkish implications of a strong jobs print. A 178,000-job print reduces the Federal Reserve’s urgency to cut rates, which typically pressures risk assets like crypto. But Bitcoin absorbed the signal without a meaningful downside.
That composure fits a pattern visible across recent weeks. As crypto.news has reported, Bitcoin has been trading primarily in response to geopolitical headlines around the ongoing U.S.–Iran conflict, with macro data playing a secondary role in near-term price discovery. The February jobs shock — when the economy shed 92,000 payrolls — had briefly pushed BTC below $70,000 before markets stabilized. Friday’s print delivered the opposite surprise, yet the price reaction was equally muted.
What this means for the Fed and crypto
“Relatively strong employment data means the Fed feels less pressure to reduce interest rates,” analysts at Bitfinex noted in a recent macro briefing. “It will likely remain laser-focused on inflation, which it sees as a major risk tied to Trump’s trade policy.” Higher rates tend to strengthen the dollar and weigh on Bitcoin ETF inflows — a dynamic that has shaped much of crypto’s performance in early 2026.
With U.S. markets closed until Monday, the full institutional reaction to Friday’s data will only become clear when equities reopen. Bitcoin’s ability to hold $67,000 through a holiday weekend — under both a strong jobs print and continued war risk from the Middle East — may offer early evidence that the asset is finding a floor.
Gold (XAU/USD) price trades near $4,676 on April 3, up roughly 17% since touching a low of $4,105 on March 23. The rally looks convincing. However, a proprietary correlation metric, shifting options positioning, and a nuanced reading of the latest Commitment of Traders report suggest the current advance may be building on the wrong foundation.
Gold’s strongest rallies have historically begun after the metal decoupled from oil, not while both moved higher together. The 17% bounce is riding the same trade that preceded every correction this cycle, and a controlled dip that breaks that link could end up being more constructive than further upside.
Gold Is Rising but the Correlation That Matters Is Already Turning
Since March 23, gold price has been climbing inside an ascending channel on the 8-hour chart. The structure is not a bear flag, as the channel has extended beyond the typical duration, but it is also not confirmed bullish until the upper boundary breaks decisively.
The XAU-WTI Correlation Matrix, a BeInCrypto custom indicator that measures the 50-period rolling correlation between gold spot (OANDA:XAUUSD) and WTI crude oil (TVC:USOIL), currently reads -0.10. The reading has declined from the positive zone it occupied in March but seems to be rising again.
The pattern is consistent. In mid-October, the correlation dropped to around -0.88. and stayed negative through early November. That was when gold price launched its strongest rally. This shows that Gold performs best when it decouples from oil entirely, acting as an independent safe haven.
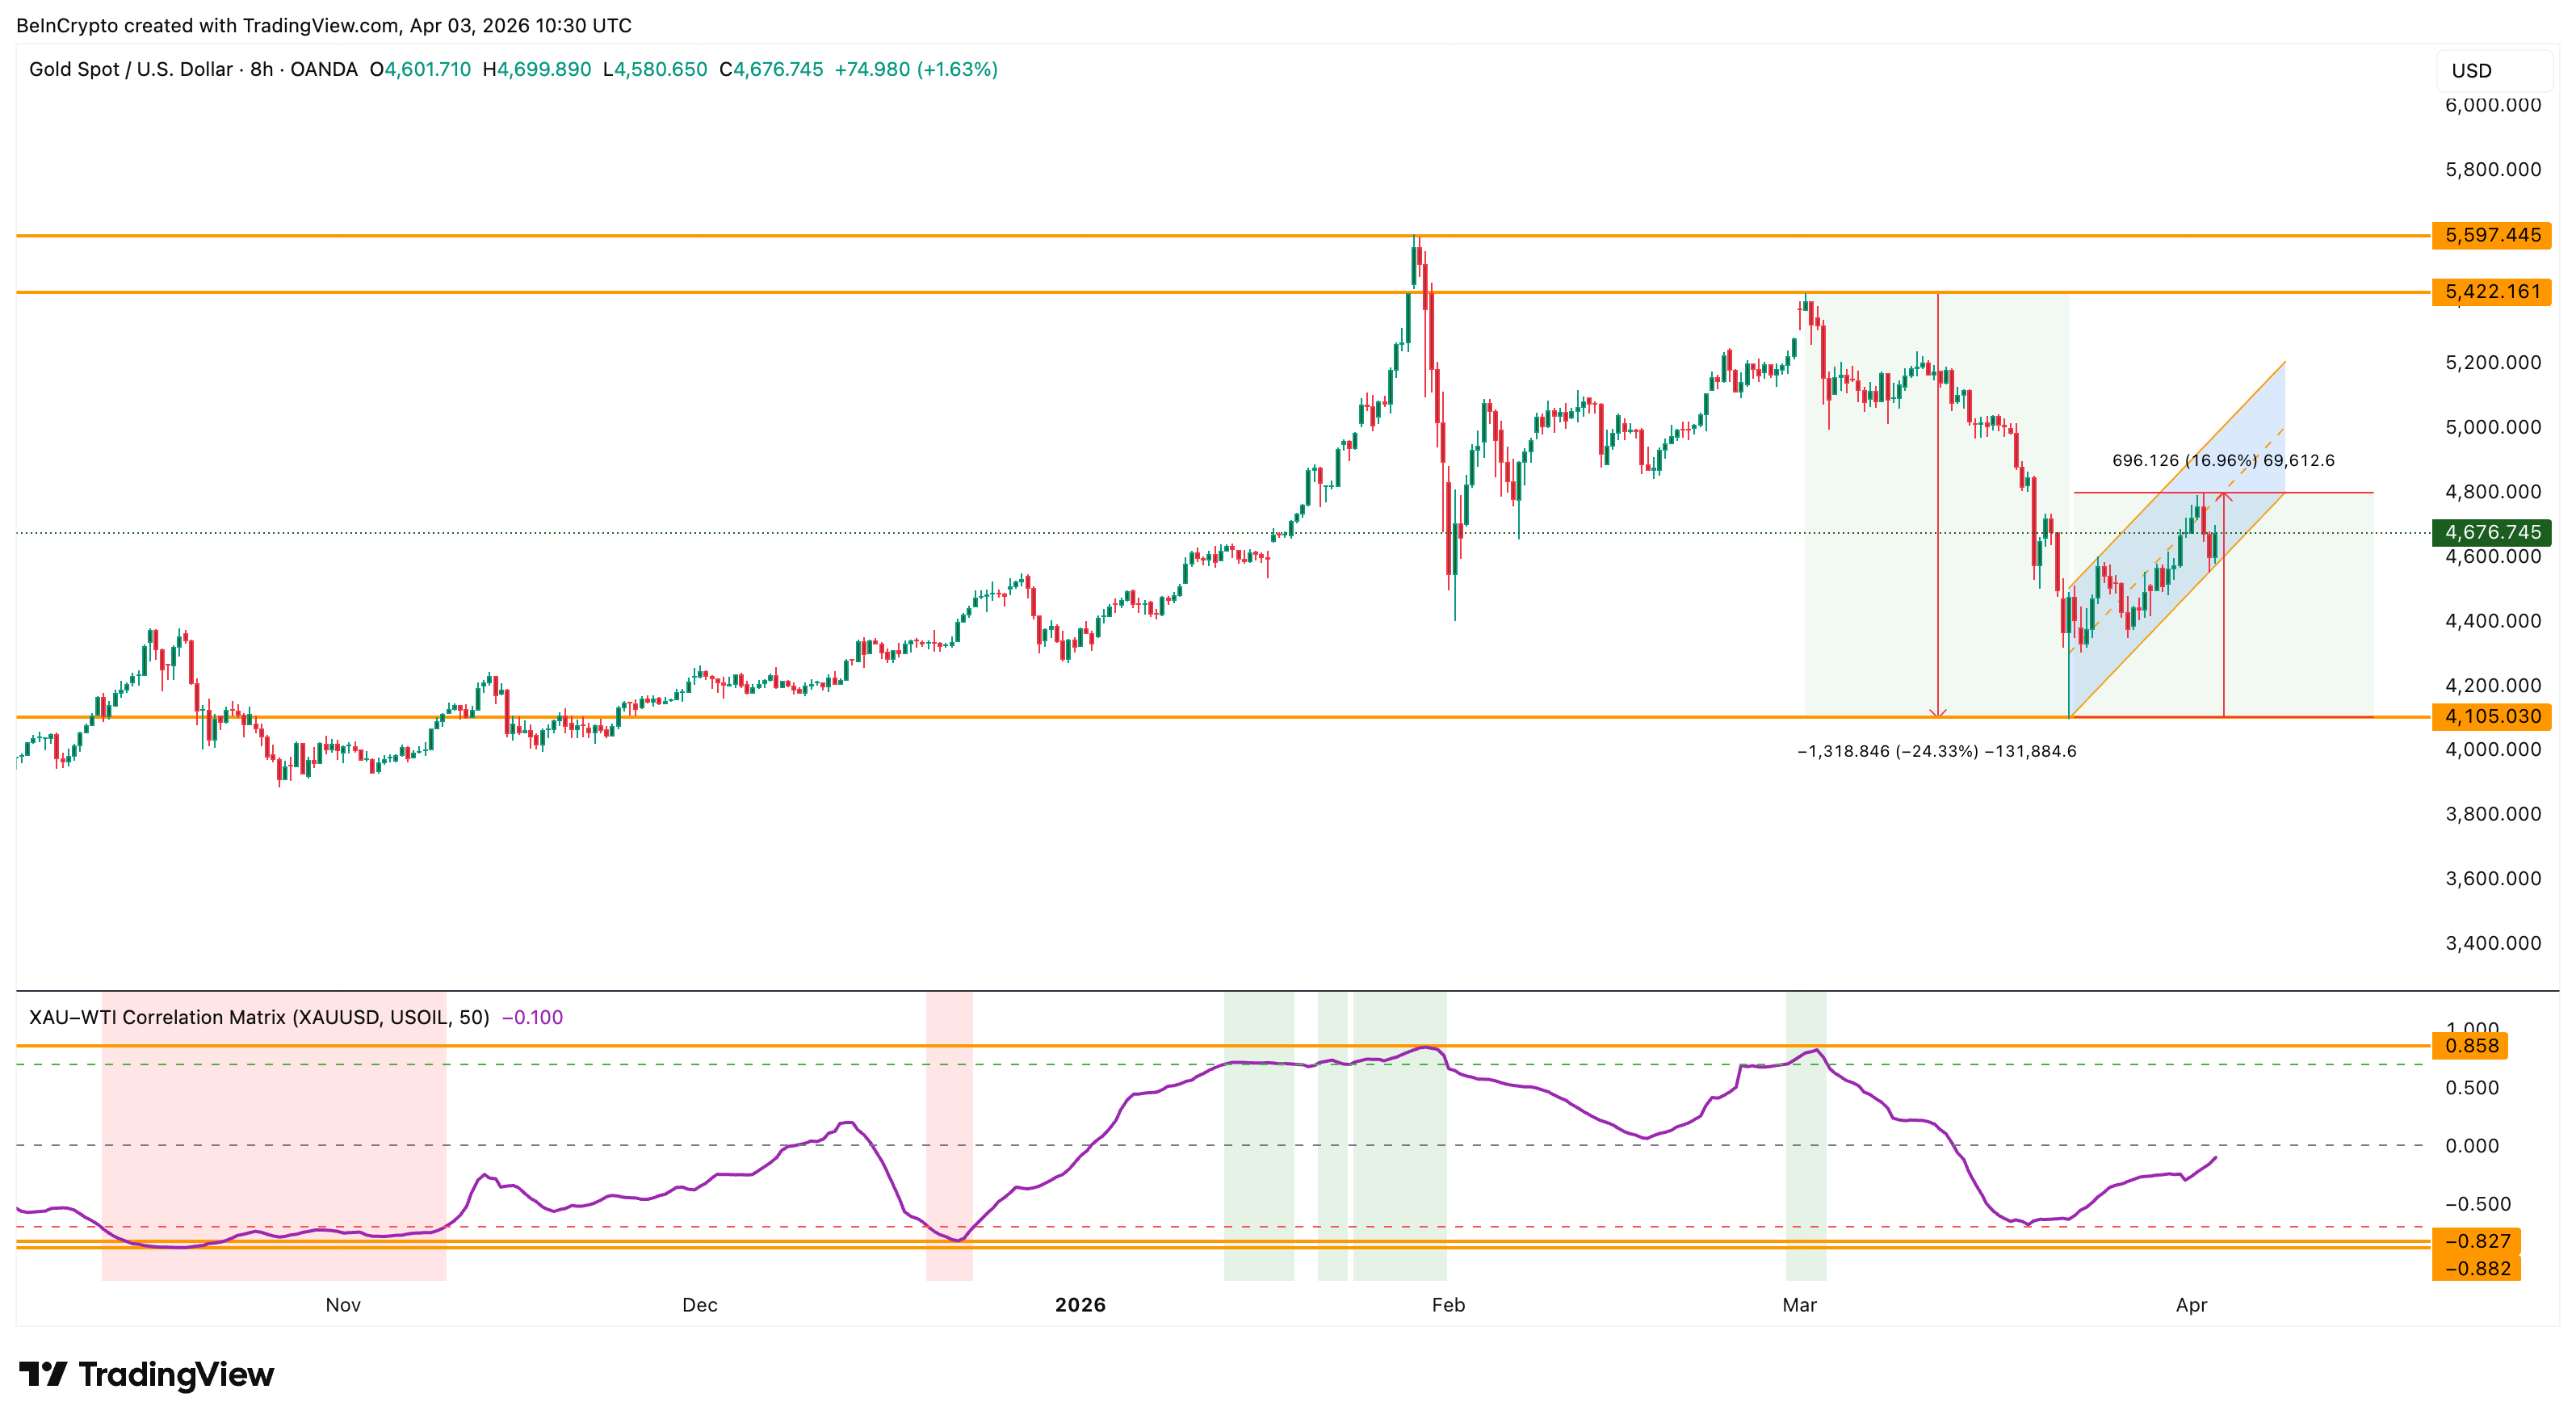
Every time the correlation peaked in positive territory, gold corrected. In late January, the reading hit approximately 0.85, and gold dropped over the following weeks. In early March, another positive peak aligned with the $5,422 high before the sell-off resumed.
The current -0.10 reading places the correlation in transition. The 17% bounce since March 23 happened during this transitional phase, which means it was partially driven by the same oil-linked sentiment rather than independent safe-haven demand.
This is why a controlled dip would be constructive. If gold price pulls back while oil continues to rise, the correlation would accelerate toward the -0.70 zone, exactly where gold has launched every sustained independent rally this cycle.
The rally does not need to continue to be bullish for gold. The correlation needs to finish resetting. Options traders have already begun reacting to the bounce, and their positioning reveals whether the current move has genuine conviction.
Bullish Bets Replaced Bearish Ones but the Foundation Is Reactive
The SPDR Gold Shares ETF (GLD) put-call ratio captures how options traders are positioning around gold price. On March 26, the put-call volume ratio stood at 1.35, meaning significantly more puts than calls were trading. Bearish sentiment dominated. The open interest ratio at the time was 0.53.
By April 2, the volume ratio had collapsed to 0.70 as call activity surged and put volume faded. The open interest ratio rose to 0.56, indicating new long positions were being opened. The bearish bets that dominated during the March sell-off have been replaced by fresh bullish exposure.
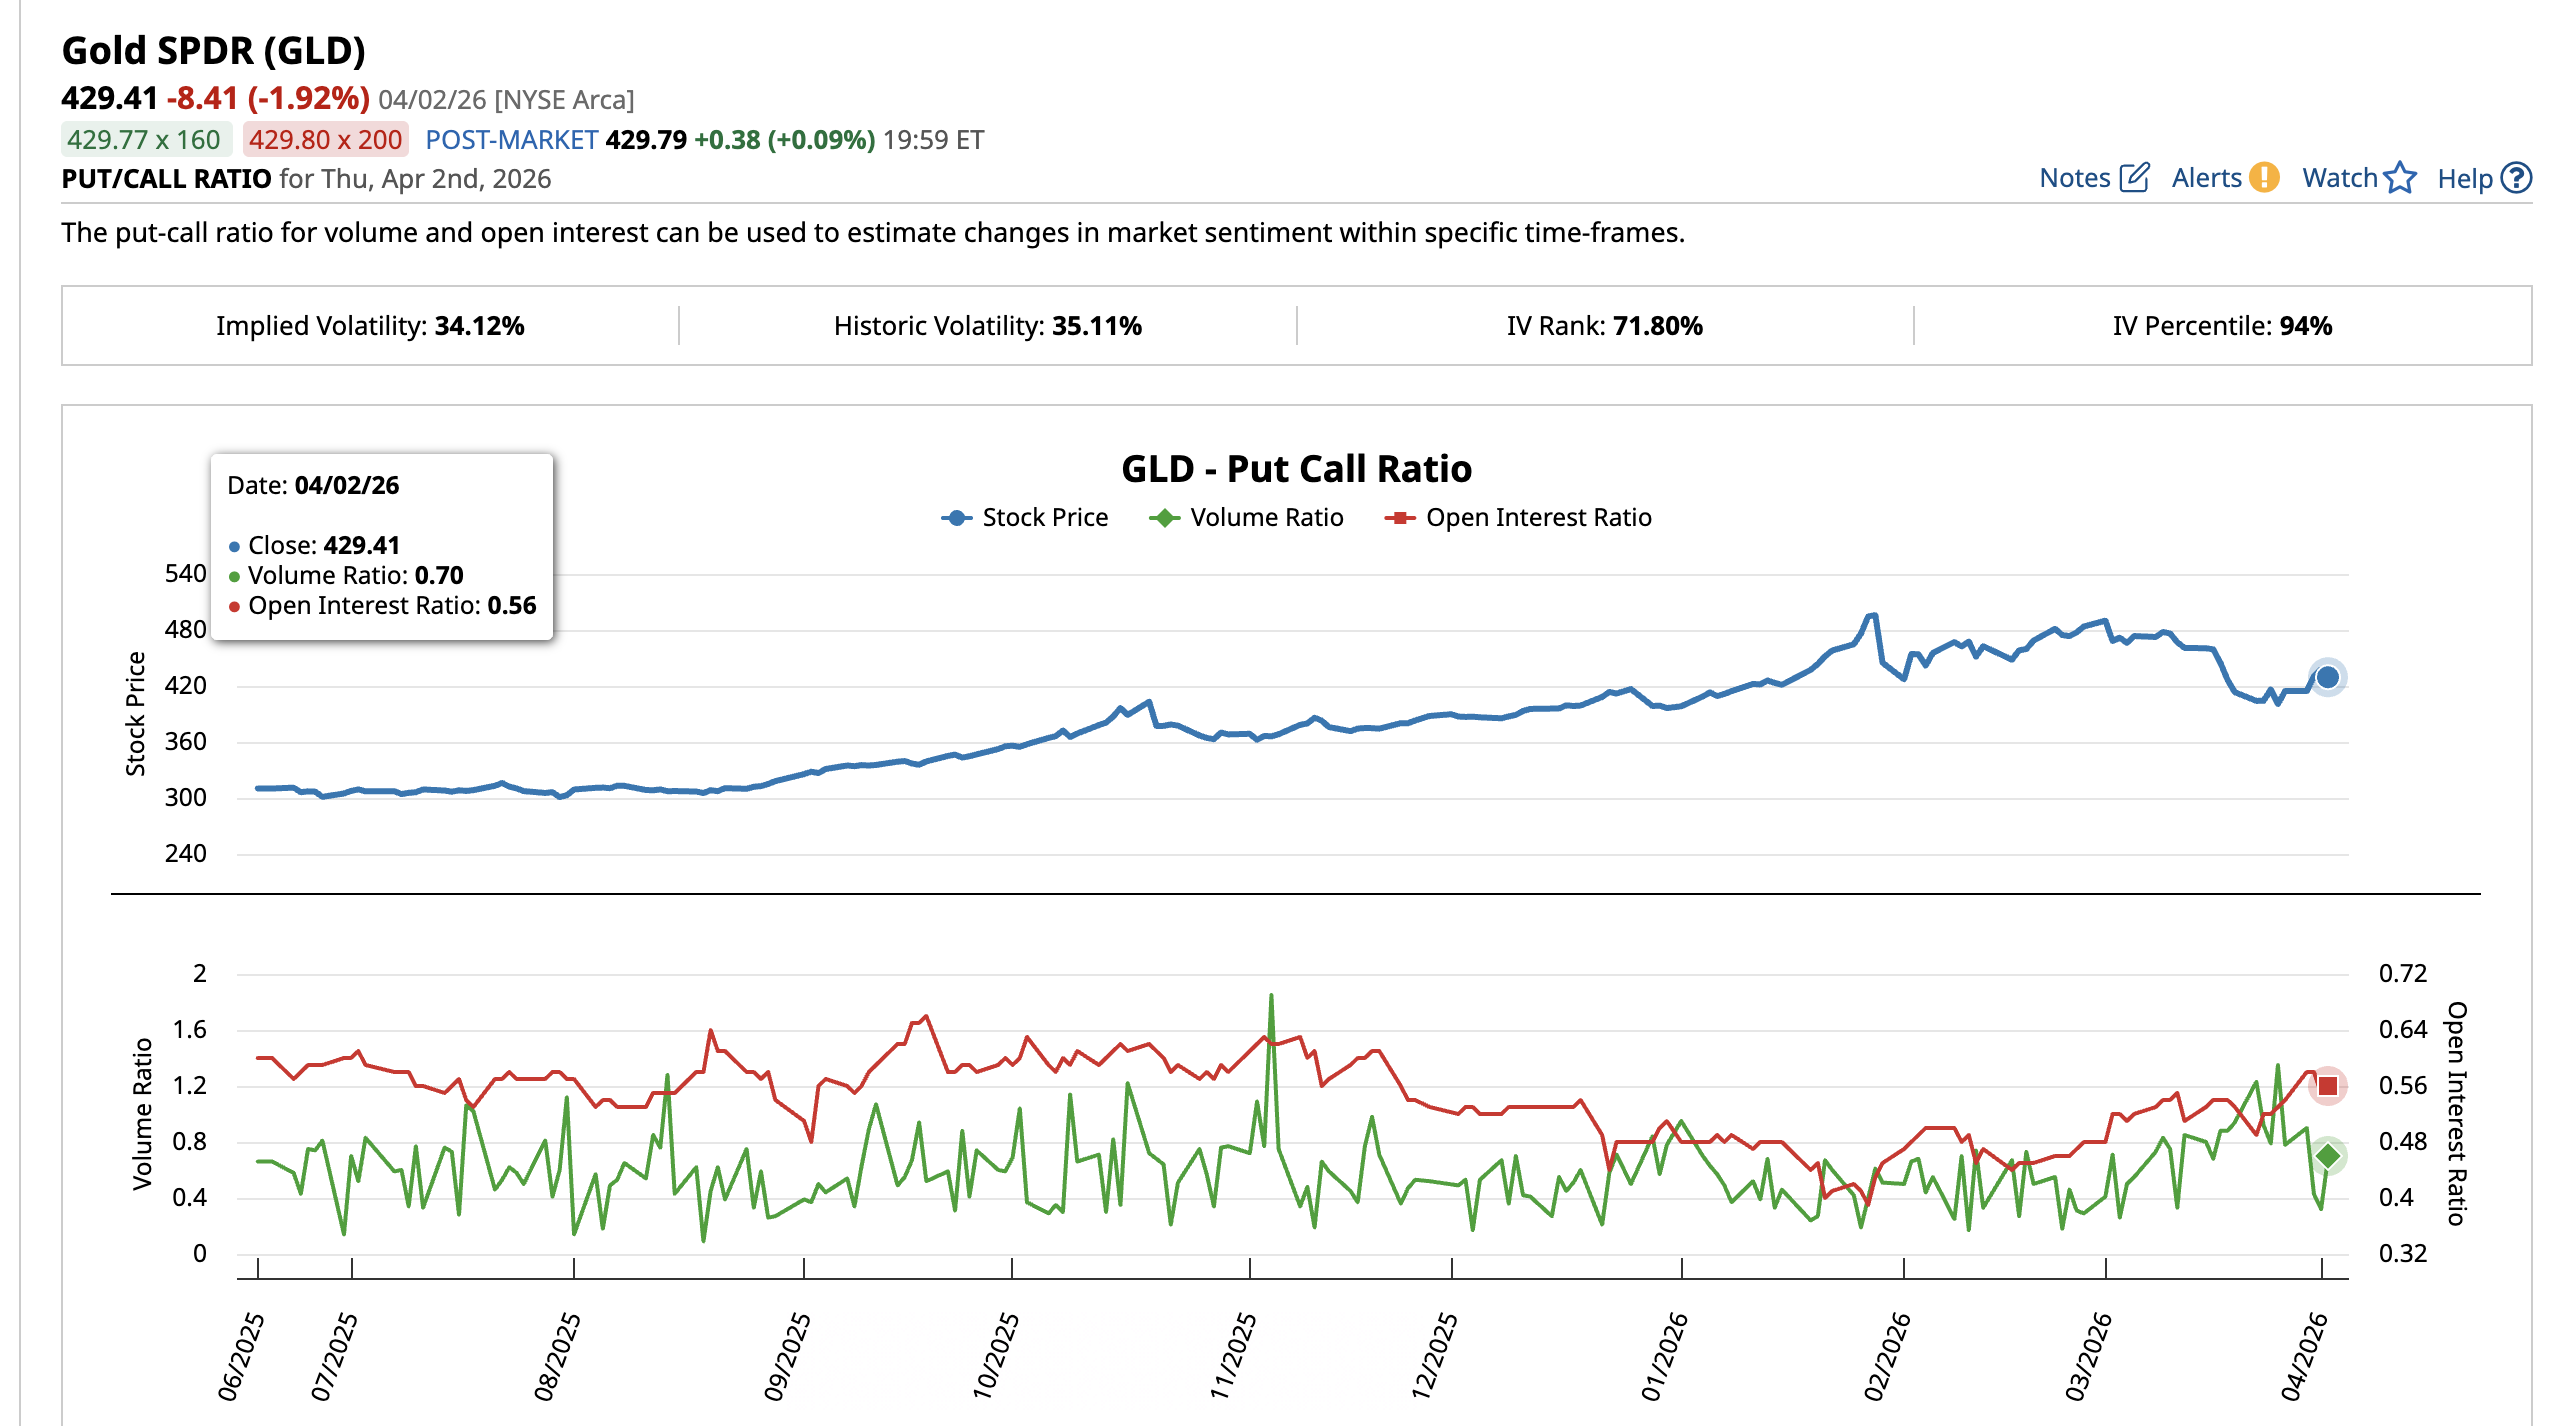
Traders likely responded to the 17% bounce by rotating from protective puts into directional calls. When bullish bets crowd in at the same time the oil correlation surges (current state), the newly opened long positions become vulnerable.
The Commitment of Traders (COT) report, published weekly by the Commodity Futures Trading Commission (CFTC), reinforces this reading. The March 24 report, the latest available, shows non-commercial (speculative) long positions increased by 4,900 contracts to 220,861. Short positions fell by 3,558 to 52,534. On the surface, this looks bullish.
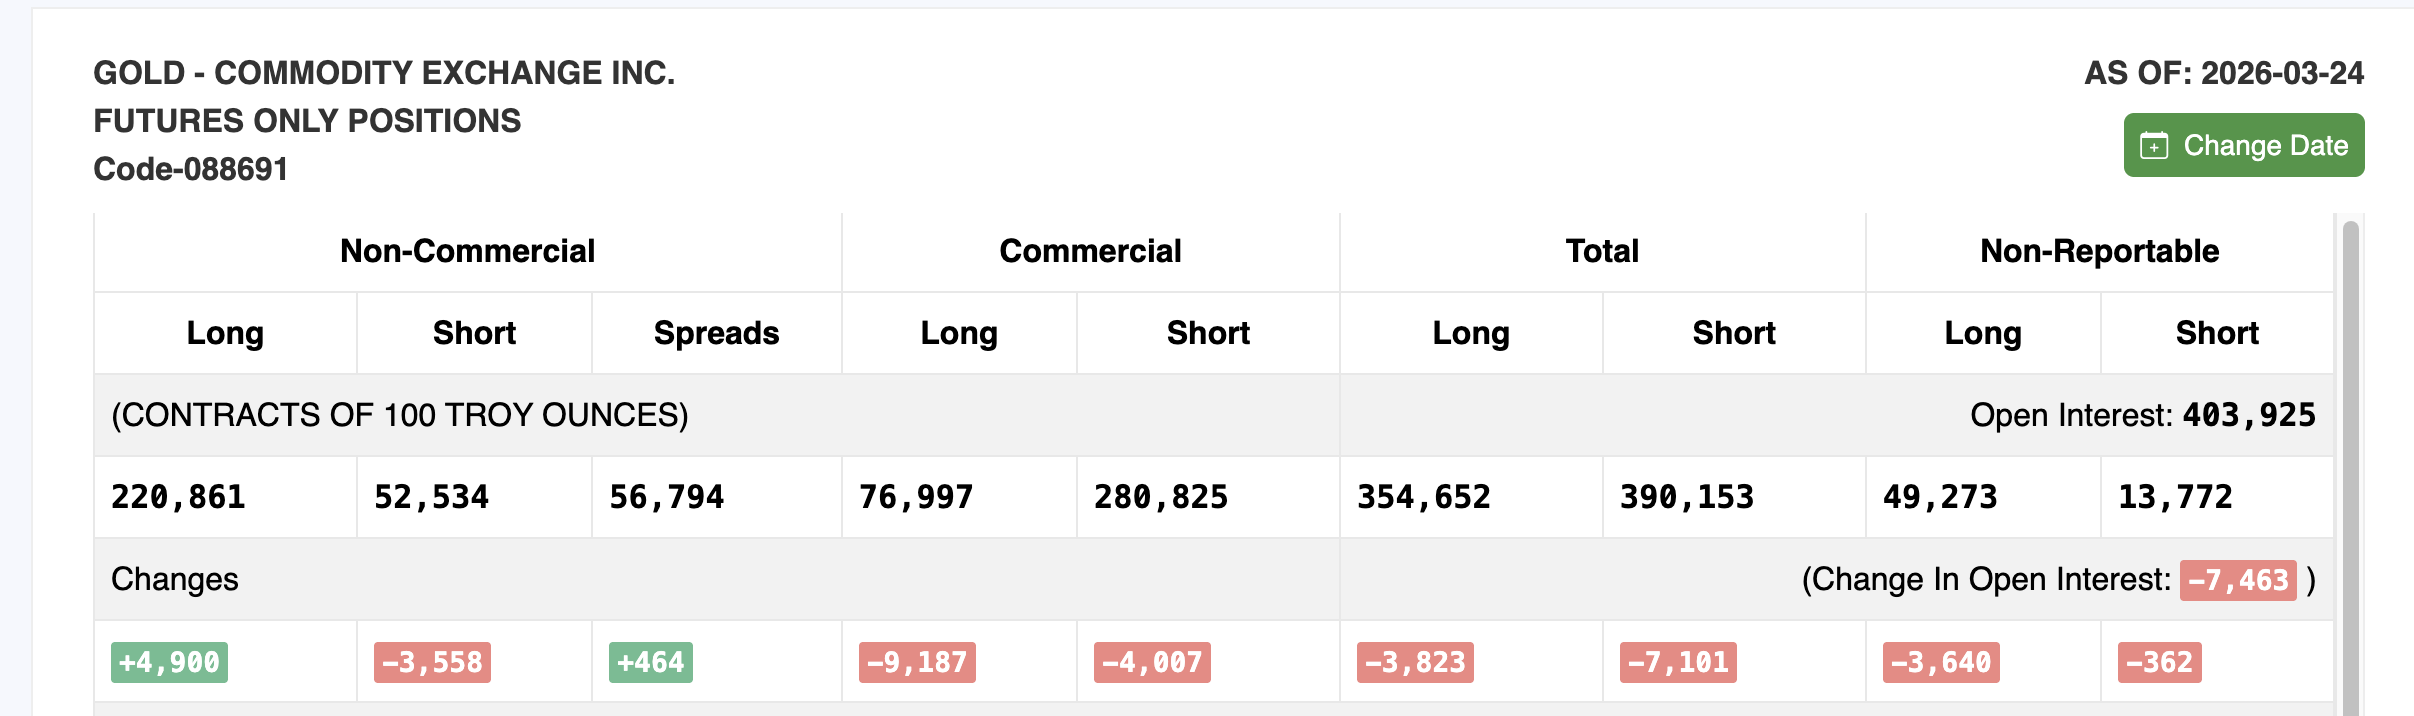
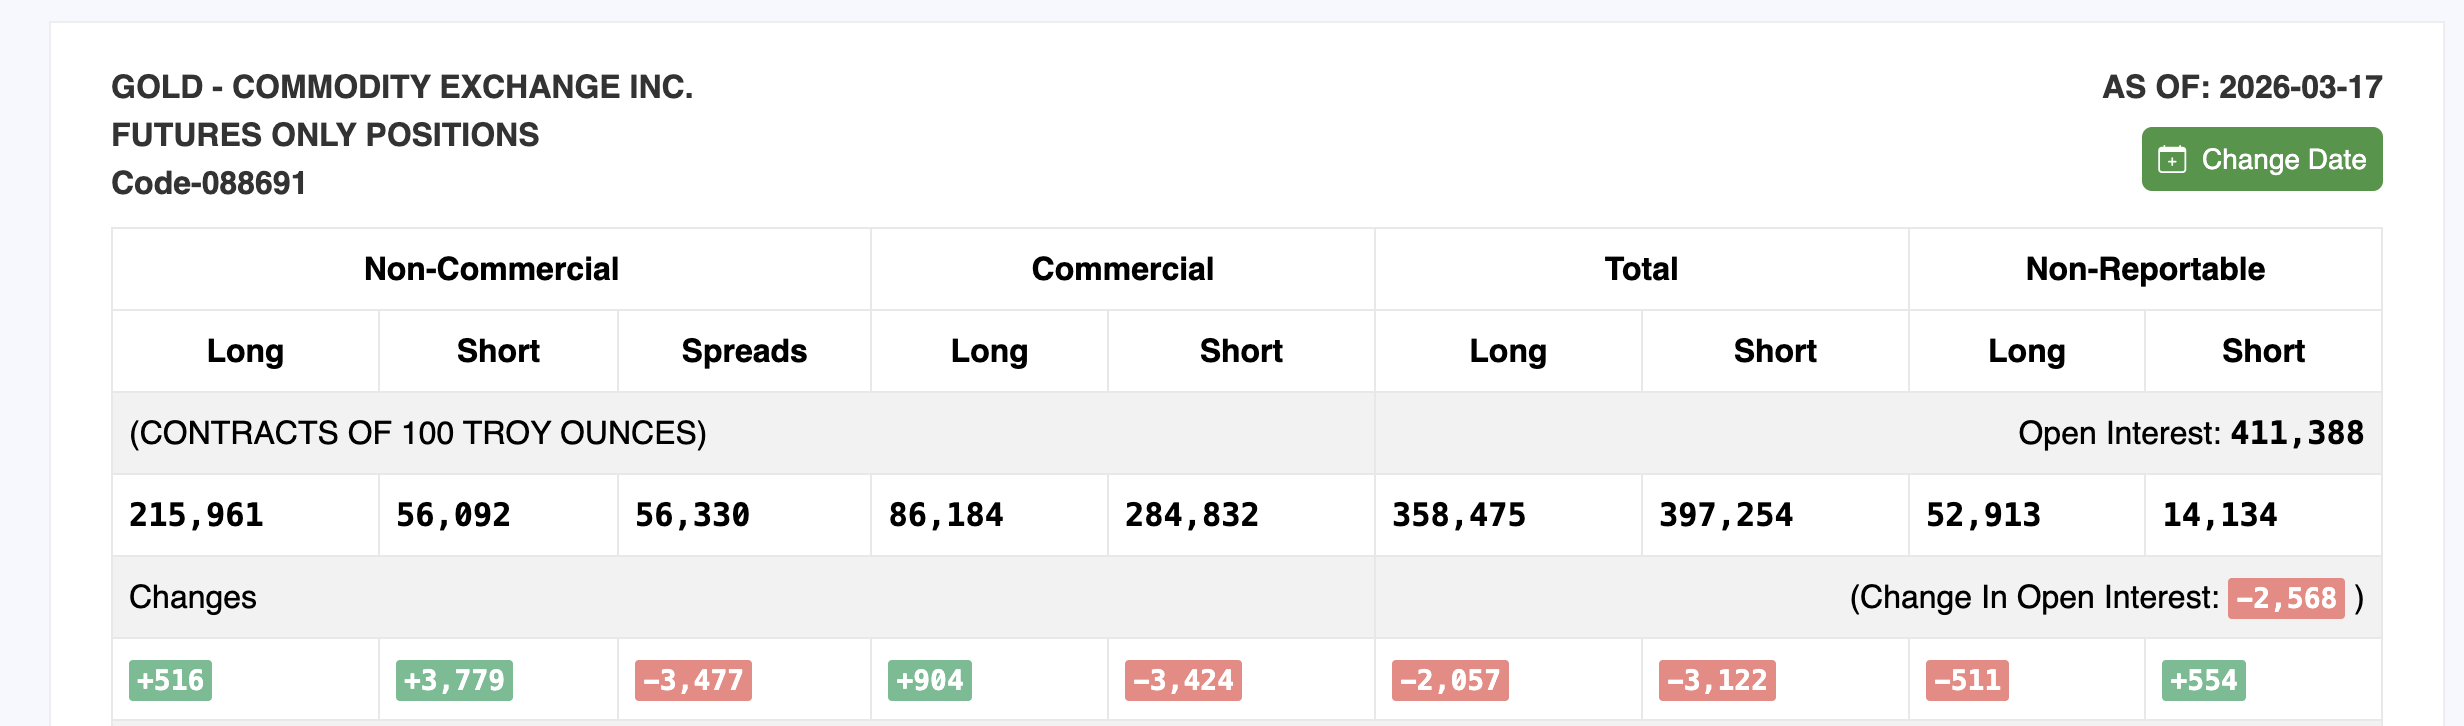
However, total open interest dropped by 7,463 contracts to 403,925 from the previous March 17 report. When longs increase but total open interest falls, it typically means the rally is being driven by short covering rather than fresh buying conviction.
The shift between the two reports aligns with what the GLD put-call data shows. Bearish participants were caught by the 17% rally and scrambled to reposition. This dynamic can sustain a move temporarily but historically does not provide the foundation for a durable gold price advance. The price levels now determine the next path for gold.
Gold Price and the Correlation Paradox
The 8-hour chart with Fibonacci levels frames every critical gold price level. Gold currently sits at $4,676 within the ascending channel.
For the rally to extend, gold needs an 8-hour close above $4,802. Above that, $5,043 acts as the next major resistance. A move through $5,043 would bring $5,422, the March 1 high, back into focus.
However, if gold reaches $5,043 or higher before the correlation completes its reset into deep negative territory, the rally risks repeating the same pattern that preceded both prior corrections. A move higher while the correlation lingers near neutral rather than resetting below -0.70 would leave the advance on an incomplete foundation.
On the downside, $4,490 at the 0.236 Fib represents the first support. Below that, $4,297 at the 0.382 Fib and $4,141 at the 0.5 level come into play. The $4,105 floor from March 23 aligns closely with the 0.5 zone and represents the base of the 17% rally.
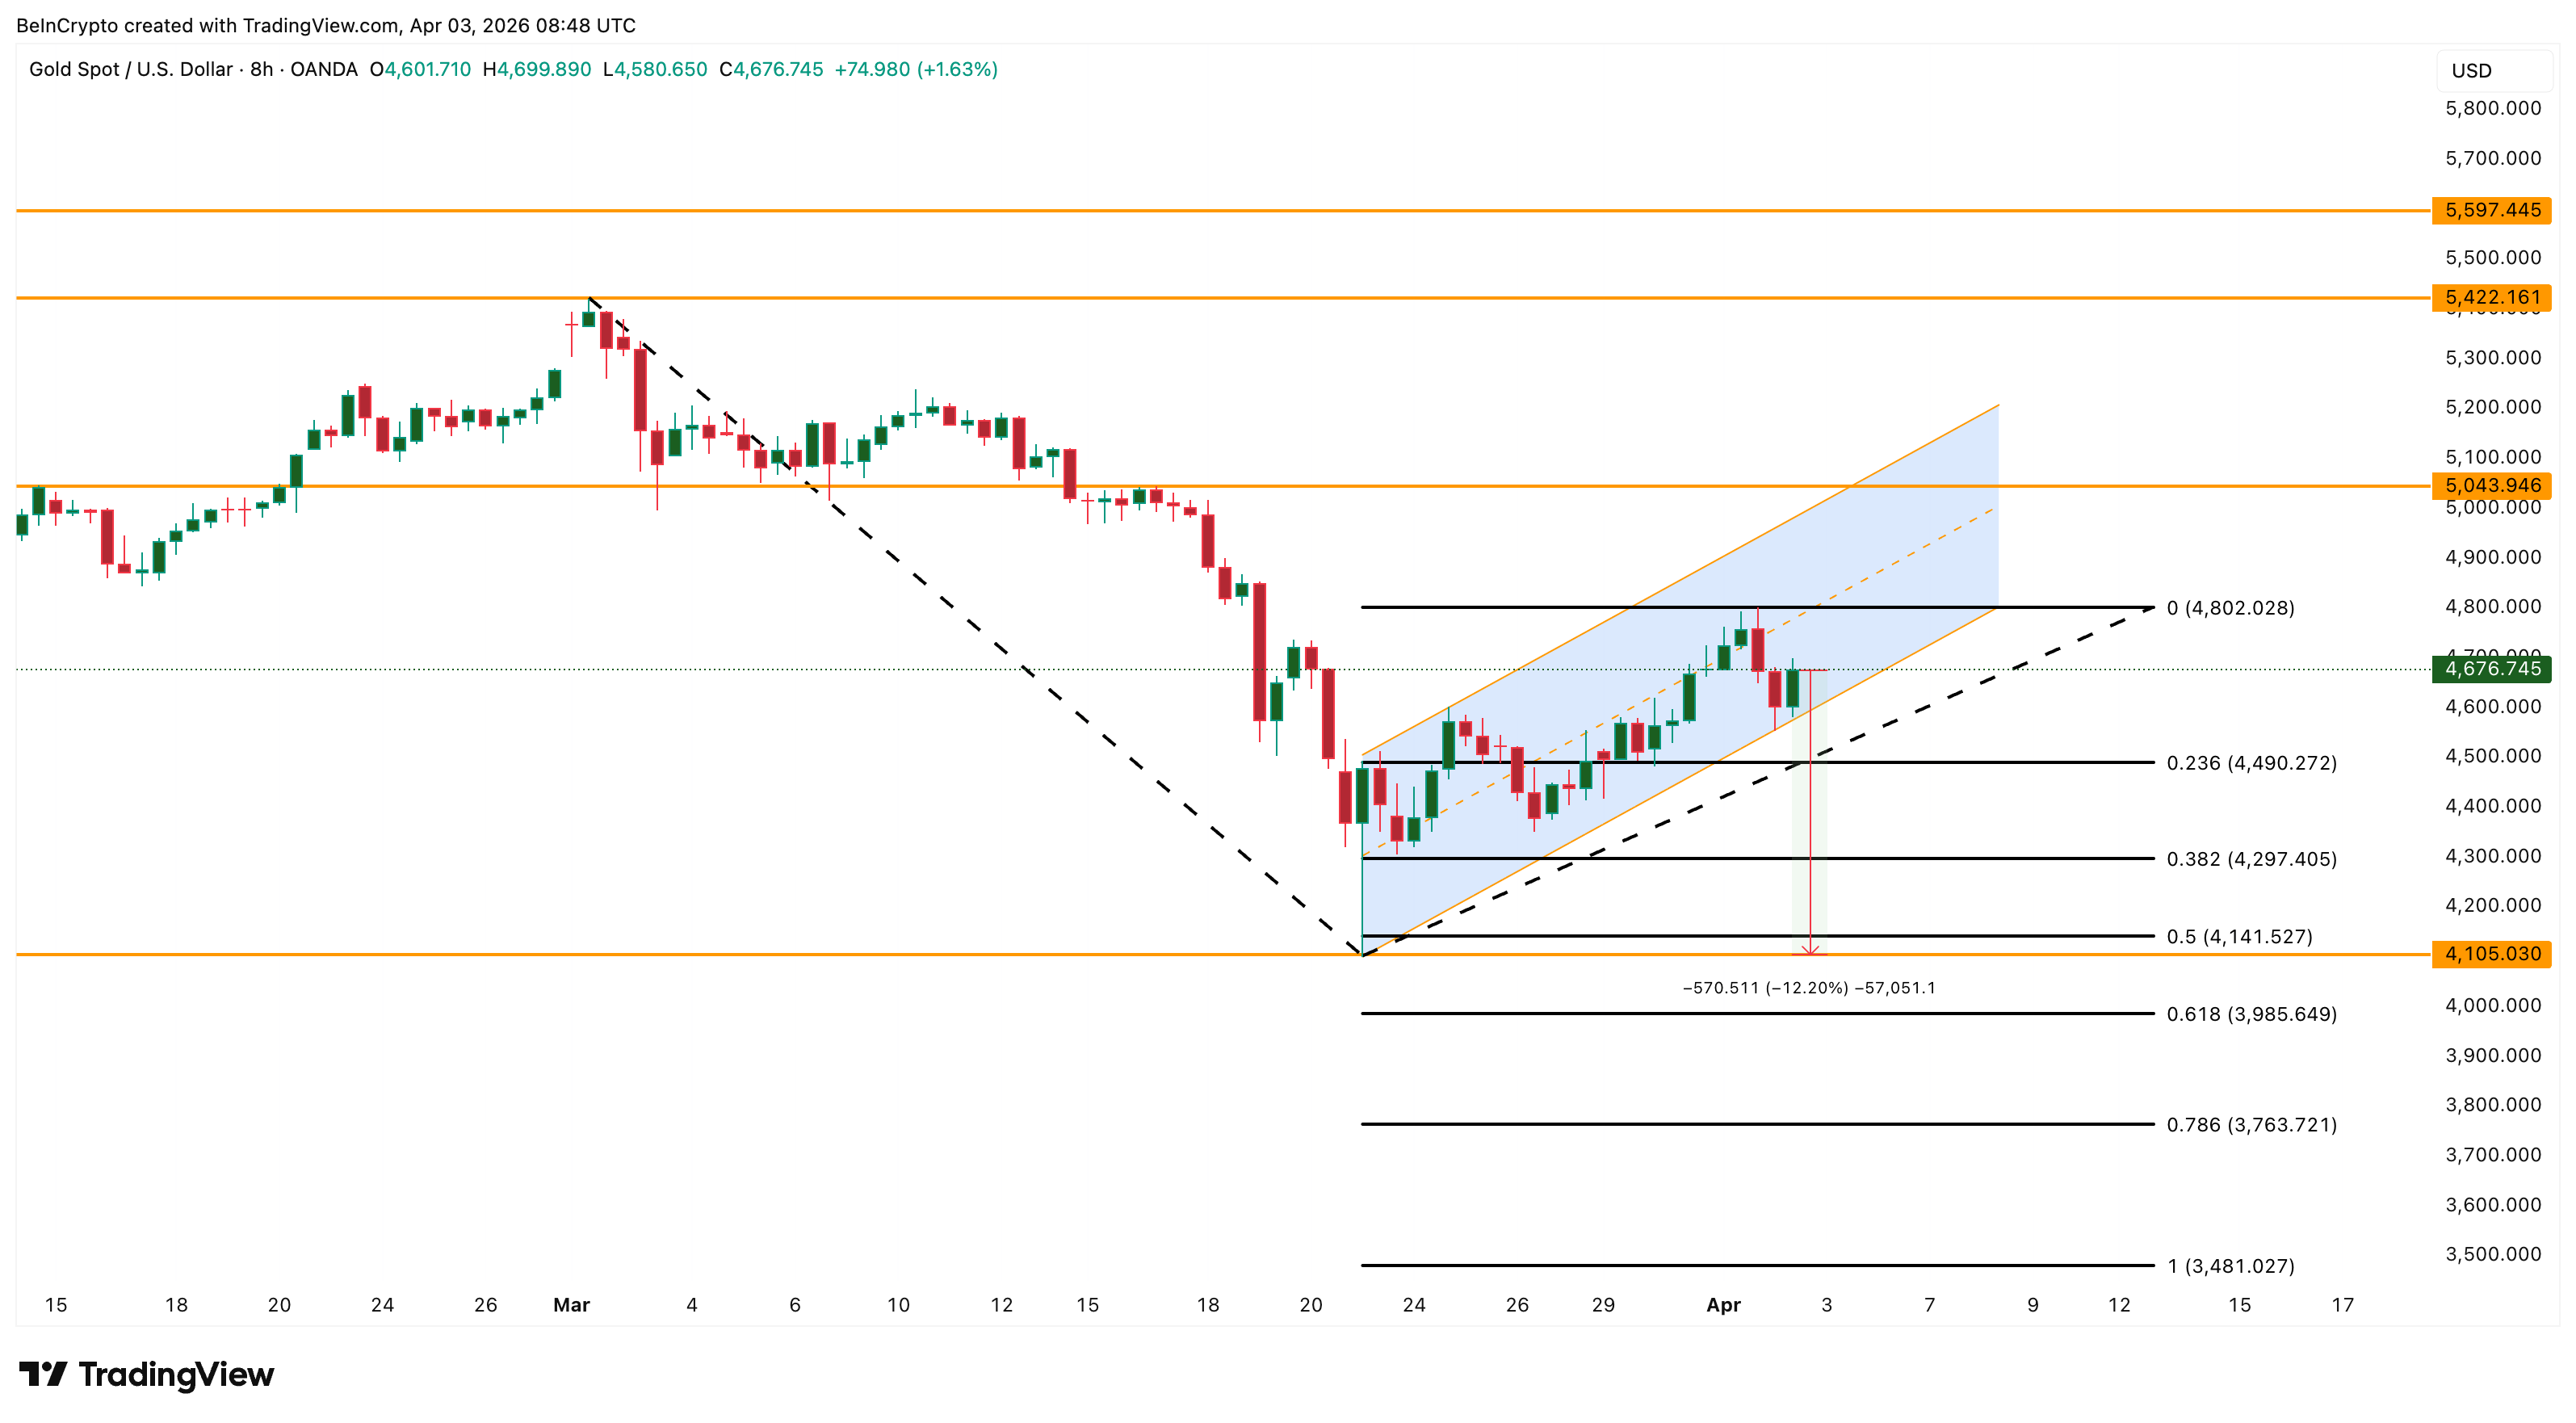
Here is where the paradox resolves. A gold price pullback toward $4,105 while oil continues to rise would possibly push the correlation back toward negative territory.
A dip that breaks the oil correlation sets up a stronger foundation for the next sustained move, while a continued rally that keeps both assets moving together leaves gold in the same overheated zone that triggered every correction this cycle. An 8-hour close above $4,802 extends the channel rally but keeps the correlation risk alive, while a pullback toward $4,105 that breaks the oil link could paradoxically be the most bullish outcome for gold’s medium-term path.
The post Why a Gold Price Dip Could Be More Bullish Than Its Current 17% Rally appeared first on BeInCrypto.

Why Workplace Culture Matters More Than You Think

Aave V3 Avoided Unrecovered Bad Debt From 2023 to 2025: Study

County Championship begins with England places on the line as McCullum and Stokes watch on


-

 NewsBeat7 days ago
The Story hosts event on Durham’s historic registers
-

 NewsBeat1 day ago
Steven Gerrard disagrees with Gary Neville over ‘shock’ Chelsea and Arsenal claim | Football
-

 Sports7 days ago
Sweet Sixteen Game Thread: Tide vs Michigan
-
Entertainment4 days ago
Fans slam 'heartbreaking' Barbie Dream Fest convention debacle with 'cardboard cutout' experience
-

 Business21 hours ago
No Jackpot Winner and $194 Million Prize Rolls Over
-

 Crypto World2 days ago
Gold Price Prediction: Worst Month in 17 Years fo Save Haven Rock
-
 Entertainment6 days ago
Lana Del Rey Celebrates Her Husband’s 51st Birthday In New Post
-
Crypto World3 days ago
Dems press CFTC, ethics board on prediction-market insider trades
-

 Tech5 days ago
The Pixel 10a doesn’t have a camera bump, and it’s great
-

 Tech5 days ago
Avatar Legends: The Fighting Game comes out in July and it looks pretty slick
-

 Sports3 days ago
Tallest college basketball player ever, standing at 7-foot-9, entering transfer portal
-

 Tech3 days ago
EE TV is using AI to help you find something to watch
-

 Fashion6 days ago
Amazon Sundays: Soft Spring Layers
-

 Business2 days ago
Login and Checkout Issues Spark Merchant Frustration
-

 Tech5 days ago
Elon Musk’s last co-founder reportedly leaves xAI
-

 Fashion7 days ago
When Evening Dressing Gets Colorful for Spring
-

 Tech3 days ago
How to back up your iPhone & iPad to your Mac before something goes wrong
-

 Tech4 days ago
Apple will hide your email address from apps and websites, but not cops
-

 Politics4 days ago
Should Trump Be Scared Strait?
-

 Crypto World4 days ago
U.S. rule change may open trillions in 401(k) funds to crypto
You must be logged in to post a comment Login