Crypto World
XRP Price Analysis: Critical $1 Support Level Under Pressure as July 2026 Approaches

Key Takeaways
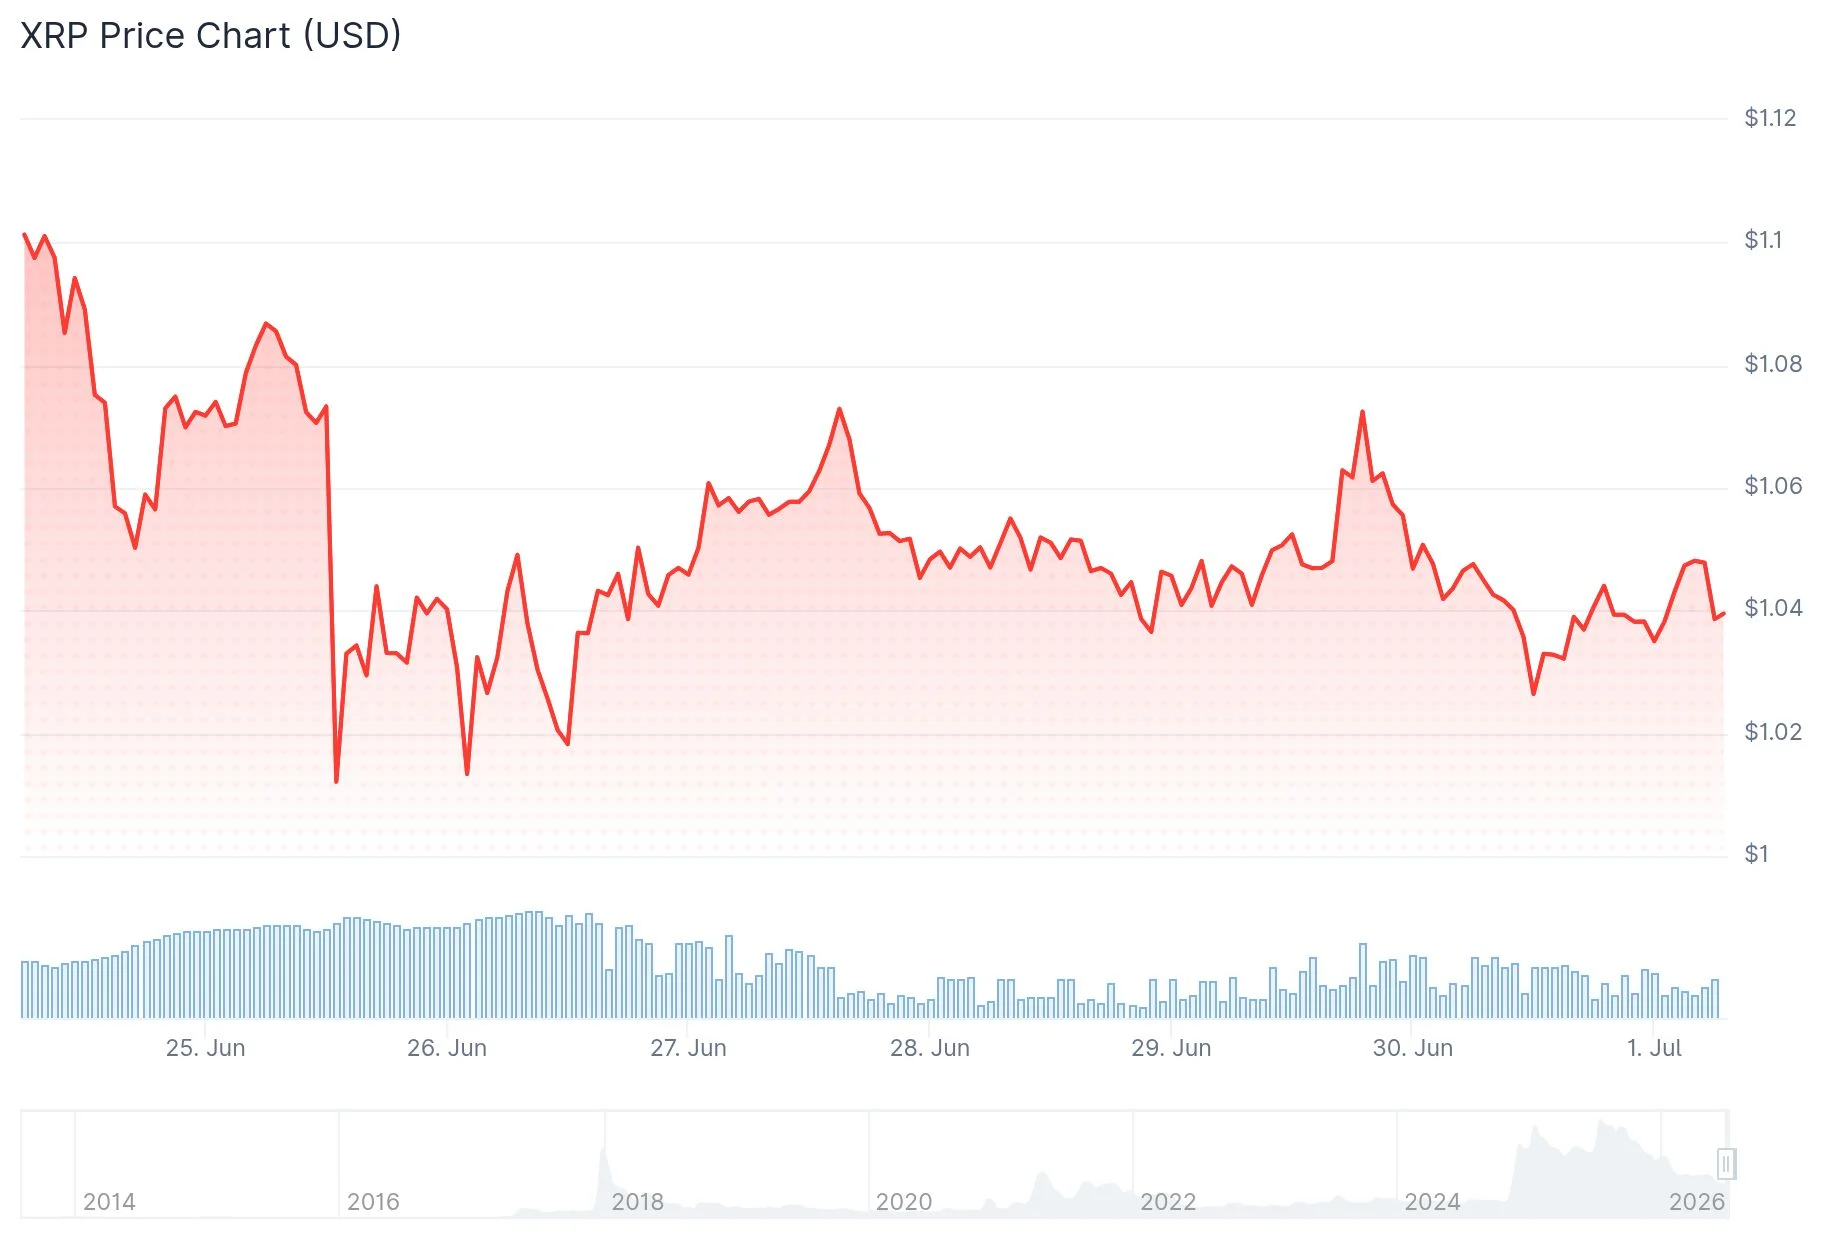
- On June 26, XRP touched $1.009, marking its lowest level since November 2024
- Despite the price decline, XRP spot ETF inflows remained in positive territory
- Technical analysis reveals a sustained downtrend originating from July 2025
- Open Interest has found equilibrium around 400 million XRP, indicating reduced speculative fervor
- Bullish divergence patterns on daily timeframes hint at potentially weakening bearish momentum near the $1 threshold
On June 26, 2026, XRP declined to $1.009, representing the token’s lowest point since it last visited these levels in November 2024.

The decline occurred against a backdrop of continuing positive flows into XRP spot exchange-traded funds. Market participants continued accumulating through these investment vehicles despite downward price momentum.
While ETF accumulation reduces circulating supply available for trading, this dynamic has yet to catalyze upward price movement given prevailing market sentiment.
Overall market appetite for XRP has diminished considerably over recent months, accompanied by a notable contraction in speculative trading activity.
Technical Analysis Overview
The daily timeframe reveals XRP locked in a downward trajectory that originated in July 2025. The decisive break beneath the April 2025 swing low at $1.61, which occurred in February, validated the bearish market structure.
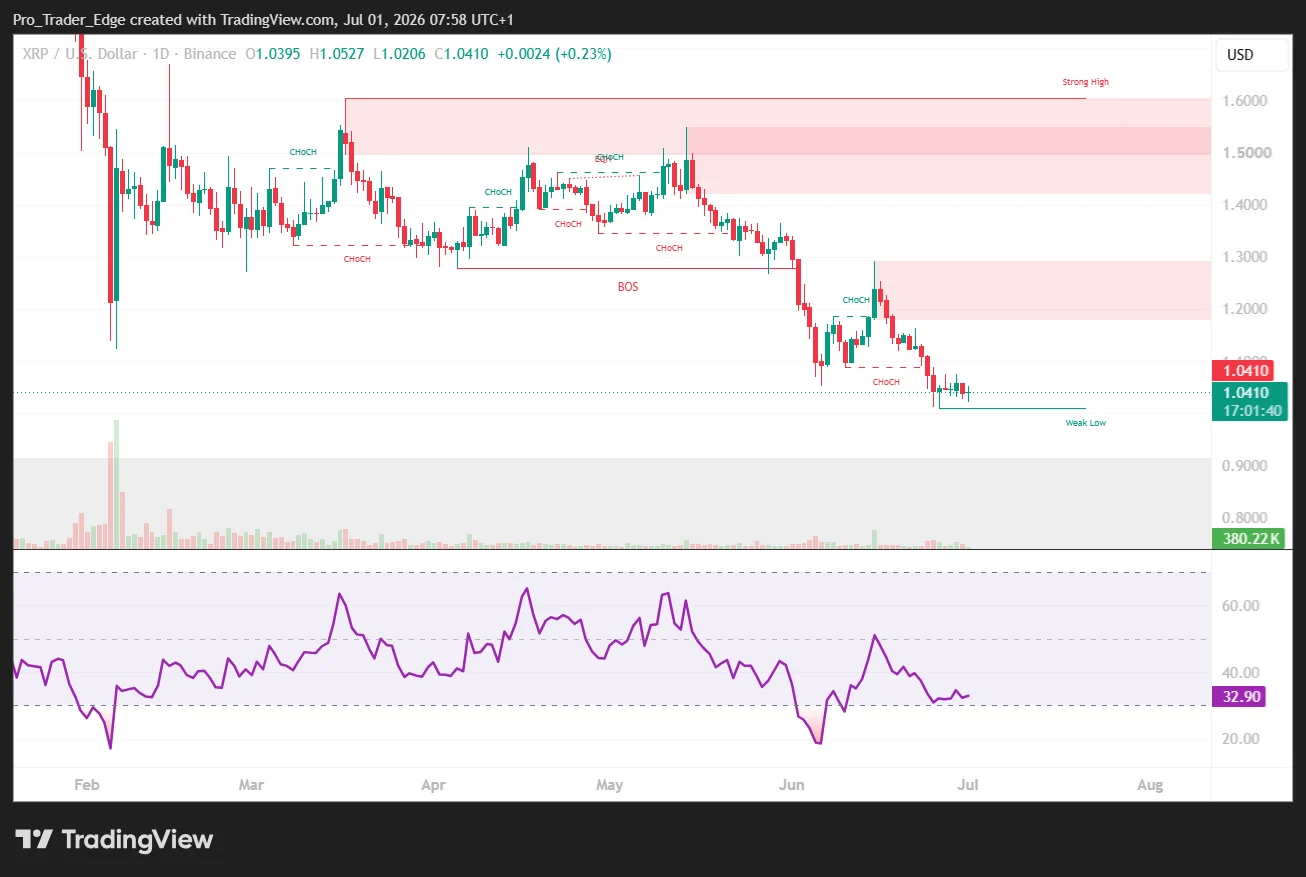

Following this breakdown, XRP consolidated within a defined range for multiple months. Late May witnessed an aggressive selling wave that shattered this consolidation pattern and accelerated the downside move.
A temporary recovery pushed prices toward $1.30 before momentum faded, leaving XRP hovering around $1.05.
Futures market data indicates Open Interest has stabilized at approximately 400 million XRP. The corresponding Open Interest Turnover Ratio has maintained levels near 0.71.
According to analyst Arab Chain, market participants should monitor these indicators for sudden increases. Rapid expansion in either Open Interest or turnover ratio typically precedes elevated volatility periods.
Examining the 4-hour chart, XRP rallied to $1.2935 during mid-June. This advance reached the 78.6% Fibonacci retracement zone around $1.2985 before encountering renewed selling pressure.
Should the bearish trajectory persist, potential downside objectives emerge at $0.975 and $0.854. Market probabilities favored a breach below $1 during July.
Potential Support Dynamics
An alternative technical interpretation presents a more constructive outlook. XRP has consistently rebounded from the $0.90-$1.00 zone, establishing this region as durable support through multiple challenges.
The $1.13 level has transitioned from support into resistance. A successful reclaim of this threshold would indicate emerging bullish momentum.
A bullish divergence pattern on daily charts has persisted for approximately one week. Such formations typically suggest diminishing selling intensity rather than imminent capitulation.
On social platforms, trader Celal Kucuker stated XRP should maintain current support levels and projected a potential climb to $10 within the next twelve months, acknowledging significant volatility along that path.
Technical analyst ChartNerd identified a repeating accumulation structure observed during previous bear cycles, highlighting historical drawdowns ranging from 85% to 96% spanning 14 to 37 months, contrasting with the current 72% retracement over 11 months.
The immediate focus centers on the $1.00 threshold. Maintaining this level preserves the possibility of retesting $1.13 resistance, while a breakdown would expose the $0.87-$0.90 support zone.


You must be logged in to post a comment Login