
Crypto World
XRP price breaks local bearish structure as rising volume targets $1.70
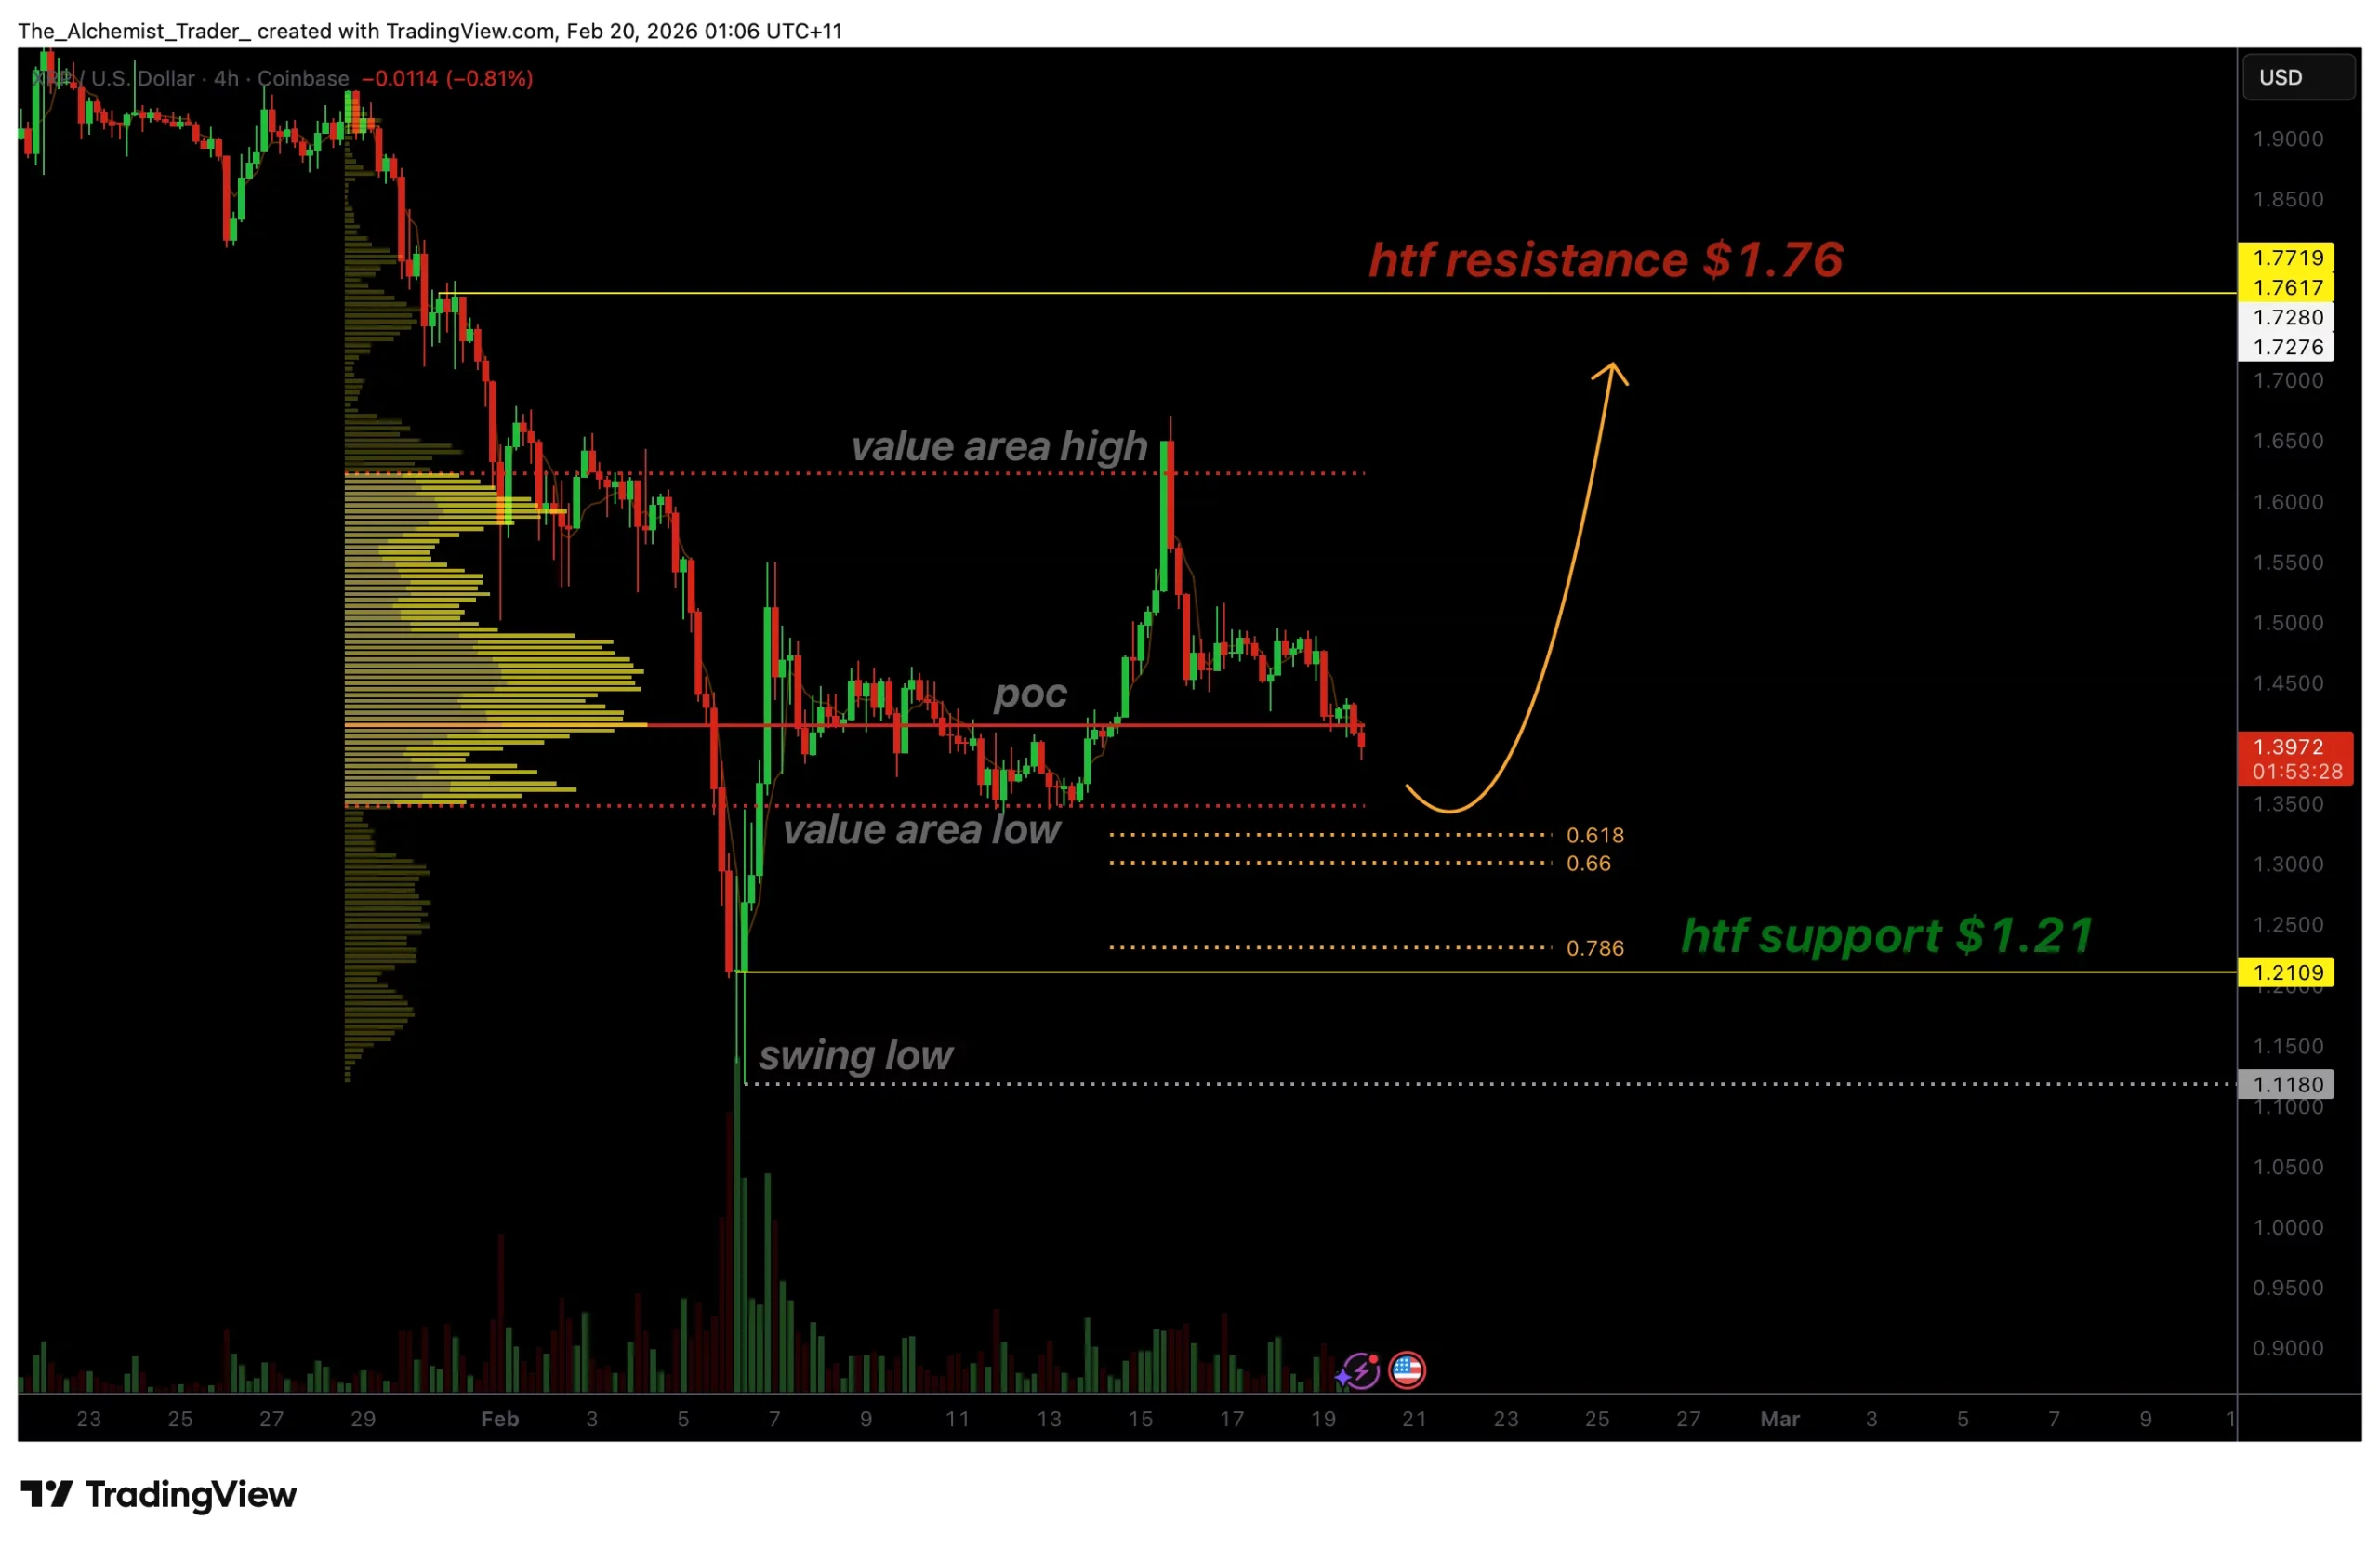
XRP price breaks local bearish market structure, shifting momentum, with price now testing a key volume support zone that could establish a higher low for higher prices.
Summary
- Local bearish structure invalidated, signaling momentum shift
- Key volume support zone being defended, favoring higher-low formation
- $1.76 resistance becomes upside target, if bullish volume confirms continuation
XRP (XRP) Price action has begun to show early signs of recovery after breaking its local bearish market structure. Following a period of sustained downside pressure, the market has transitioned back into a technically significant support region where buyers are attempting to regain control. This development suggests that the corrective phase may be nearing completion, provided key support levels continue to hold.
Markets often transition through phases of imbalance before stabilizing around high-liquidity zones. The current move back into a major volume support cluster highlights a potential shift away from bearish continuation toward rotational price behavior. Whether this develops into sustained upside momentum will depend heavily on how price reacts within this support region.
XRP price key technical points
- Local bearish market structure has been broken, signaling momentum shift
- Major volume support cluster is being tested, including POC and Fibonacci confluence
- $1.76 high-timeframe resistance becomes the upside target, if higher low confirms
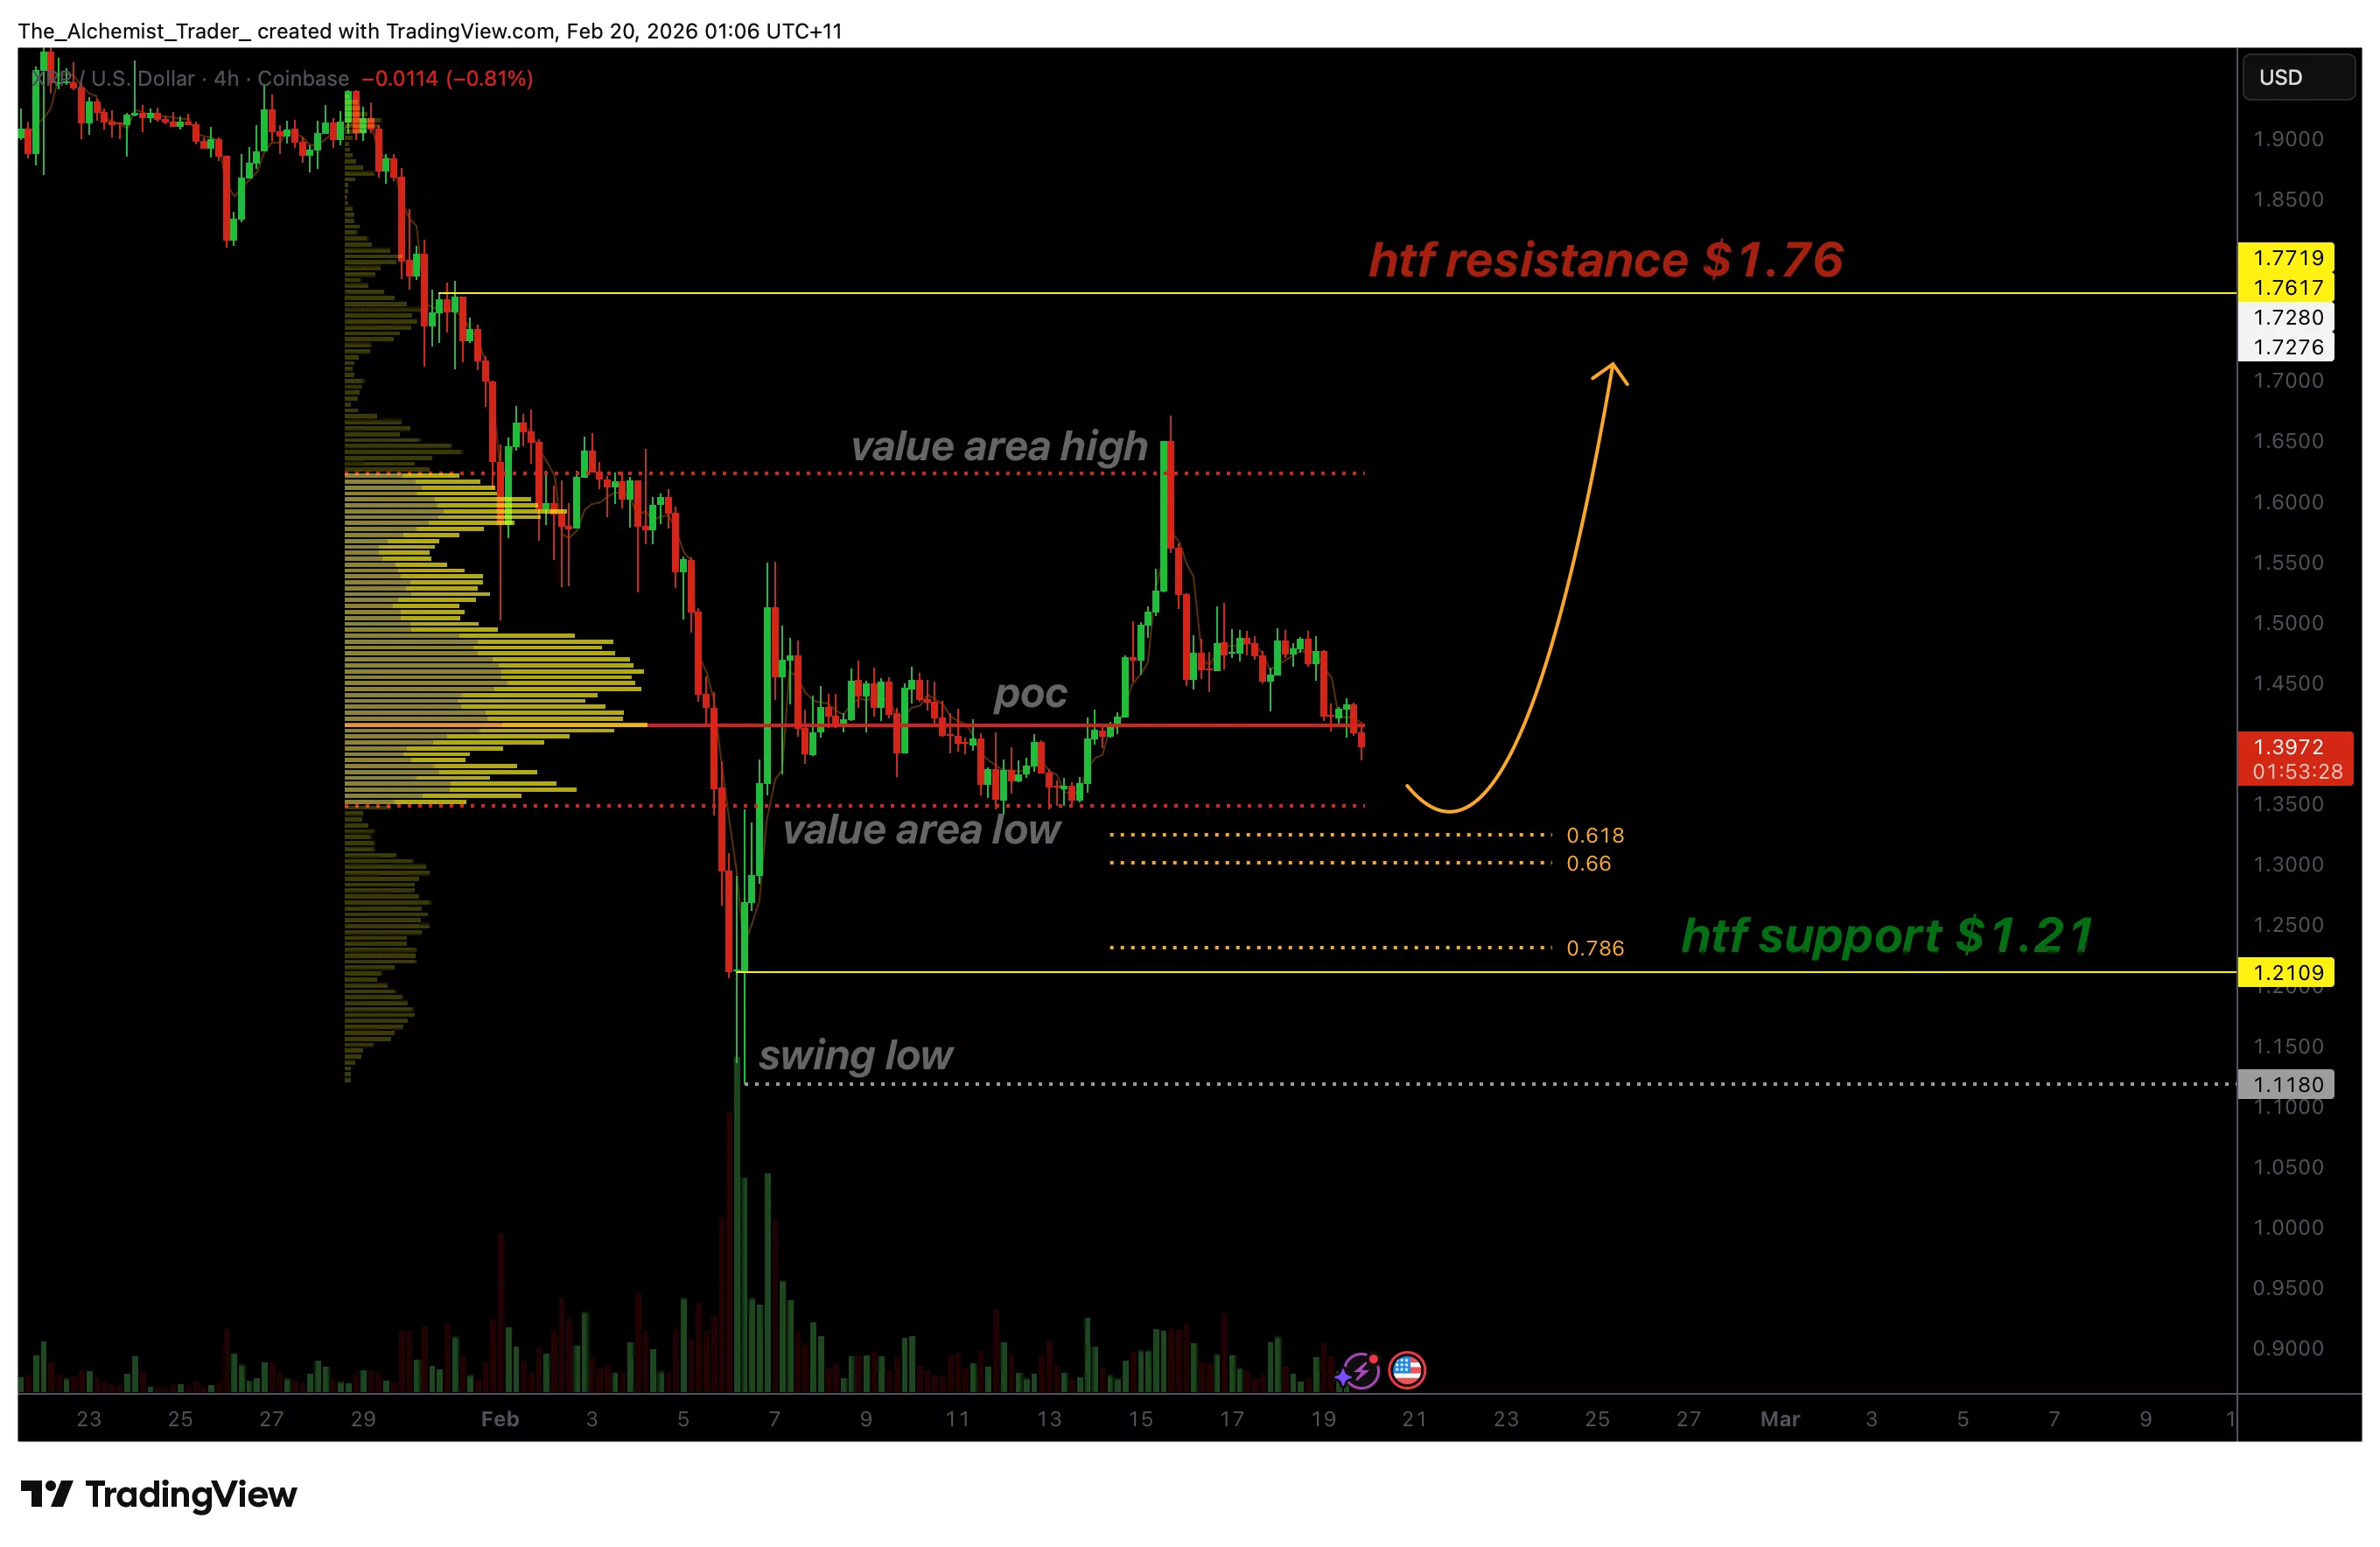
XRP price has rotated back into an important technical region defined by strong volume participation. This zone includes the point of control (POC), the value area high, and the 0.618 Fibonacci retracement, creating a powerful confluence of support levels.
When multiple technical indicators align in one region, it often increases the probability of price stabilization. Such areas typically attract liquidity and institutional interest, making them ideal locations for higher lows to form during trend transitions.
The return to this volume area indicates that sellers are losing immediate dominance, while buyers are beginning to defend price more aggressively.
Establishing a higher low is critical
The most important technical requirement moving forward is the confirmation of a higher low. A higher low represents a shift in market structure from bearish to constructive and often marks the early stages of trend continuation to the upside.
For this scenario to remain valid, the value area low must continue acting as support. Acceptance below this level would weaken the bullish thesis and reopen downside risks. However, sustained holding above value strengthens the probability that accumulation is taking place.
Once a higher low is confirmed, XRP gains structural support for continuation within the newly developing trend.
Market structure transition underway
The recent break of local bearish structure is a meaningful technical event. Previously, price action was characterized by lower highs and continued weakness. That pattern has now been disrupted, indicating a transition from distribution toward potential accumulation.
Market structure shifts rarely occur instantly. Instead, they typically unfold through rotations between support and resistance levels. The current consolidation within the volume support region may represent the early phase of this transition.
As buyers defend support and absorb supply, momentum can gradually build for a larger expansion move.
Resistance at $1.76 comes into focus
If the higher low successfully forms, attention shifts toward high-timeframe resistance near $1.76. This level represents the next major technical objective and aligns with prior rejection zones within the broader trading range.
A rotational move toward resistance would confirm that the market has transitioned out of its corrective phase and into a recovery structure. However, reaching this target will require strong bullish participation.
Bullish volume is the deciding factor
While structural signals are improving, confirmation ultimately depends on bullish volume expansion. Breakouts or rotations without volume often fail, leading to renewed consolidation or reversals.
Increasing buy-side volume would validate demand returning to the market and strengthen the probability of continuation toward resistance. Without this confirmation, price may remain range-bound despite structural improvement.
What to expect in the coming price action
From a technical, price-action, and market-structure perspective, the market is attempting to transition from bearish control into a more constructive environment. The break of the local bearish structure, combined with strong volume support, suggests that a higher low may be forming.
In the near term, consolidation around the volume support zone is likely as the market searches for equilibrium. As long as the value area low holds, the probability favors a rotational move for XRP toward the $1.76 resistance level.
A decisive increase in bullish volume would confirm continuation, while failure to hold support would delay the recovery. For now, the technical landscape favors stabilization and potential upside rotation as the market attempts to establish a new structural trend.

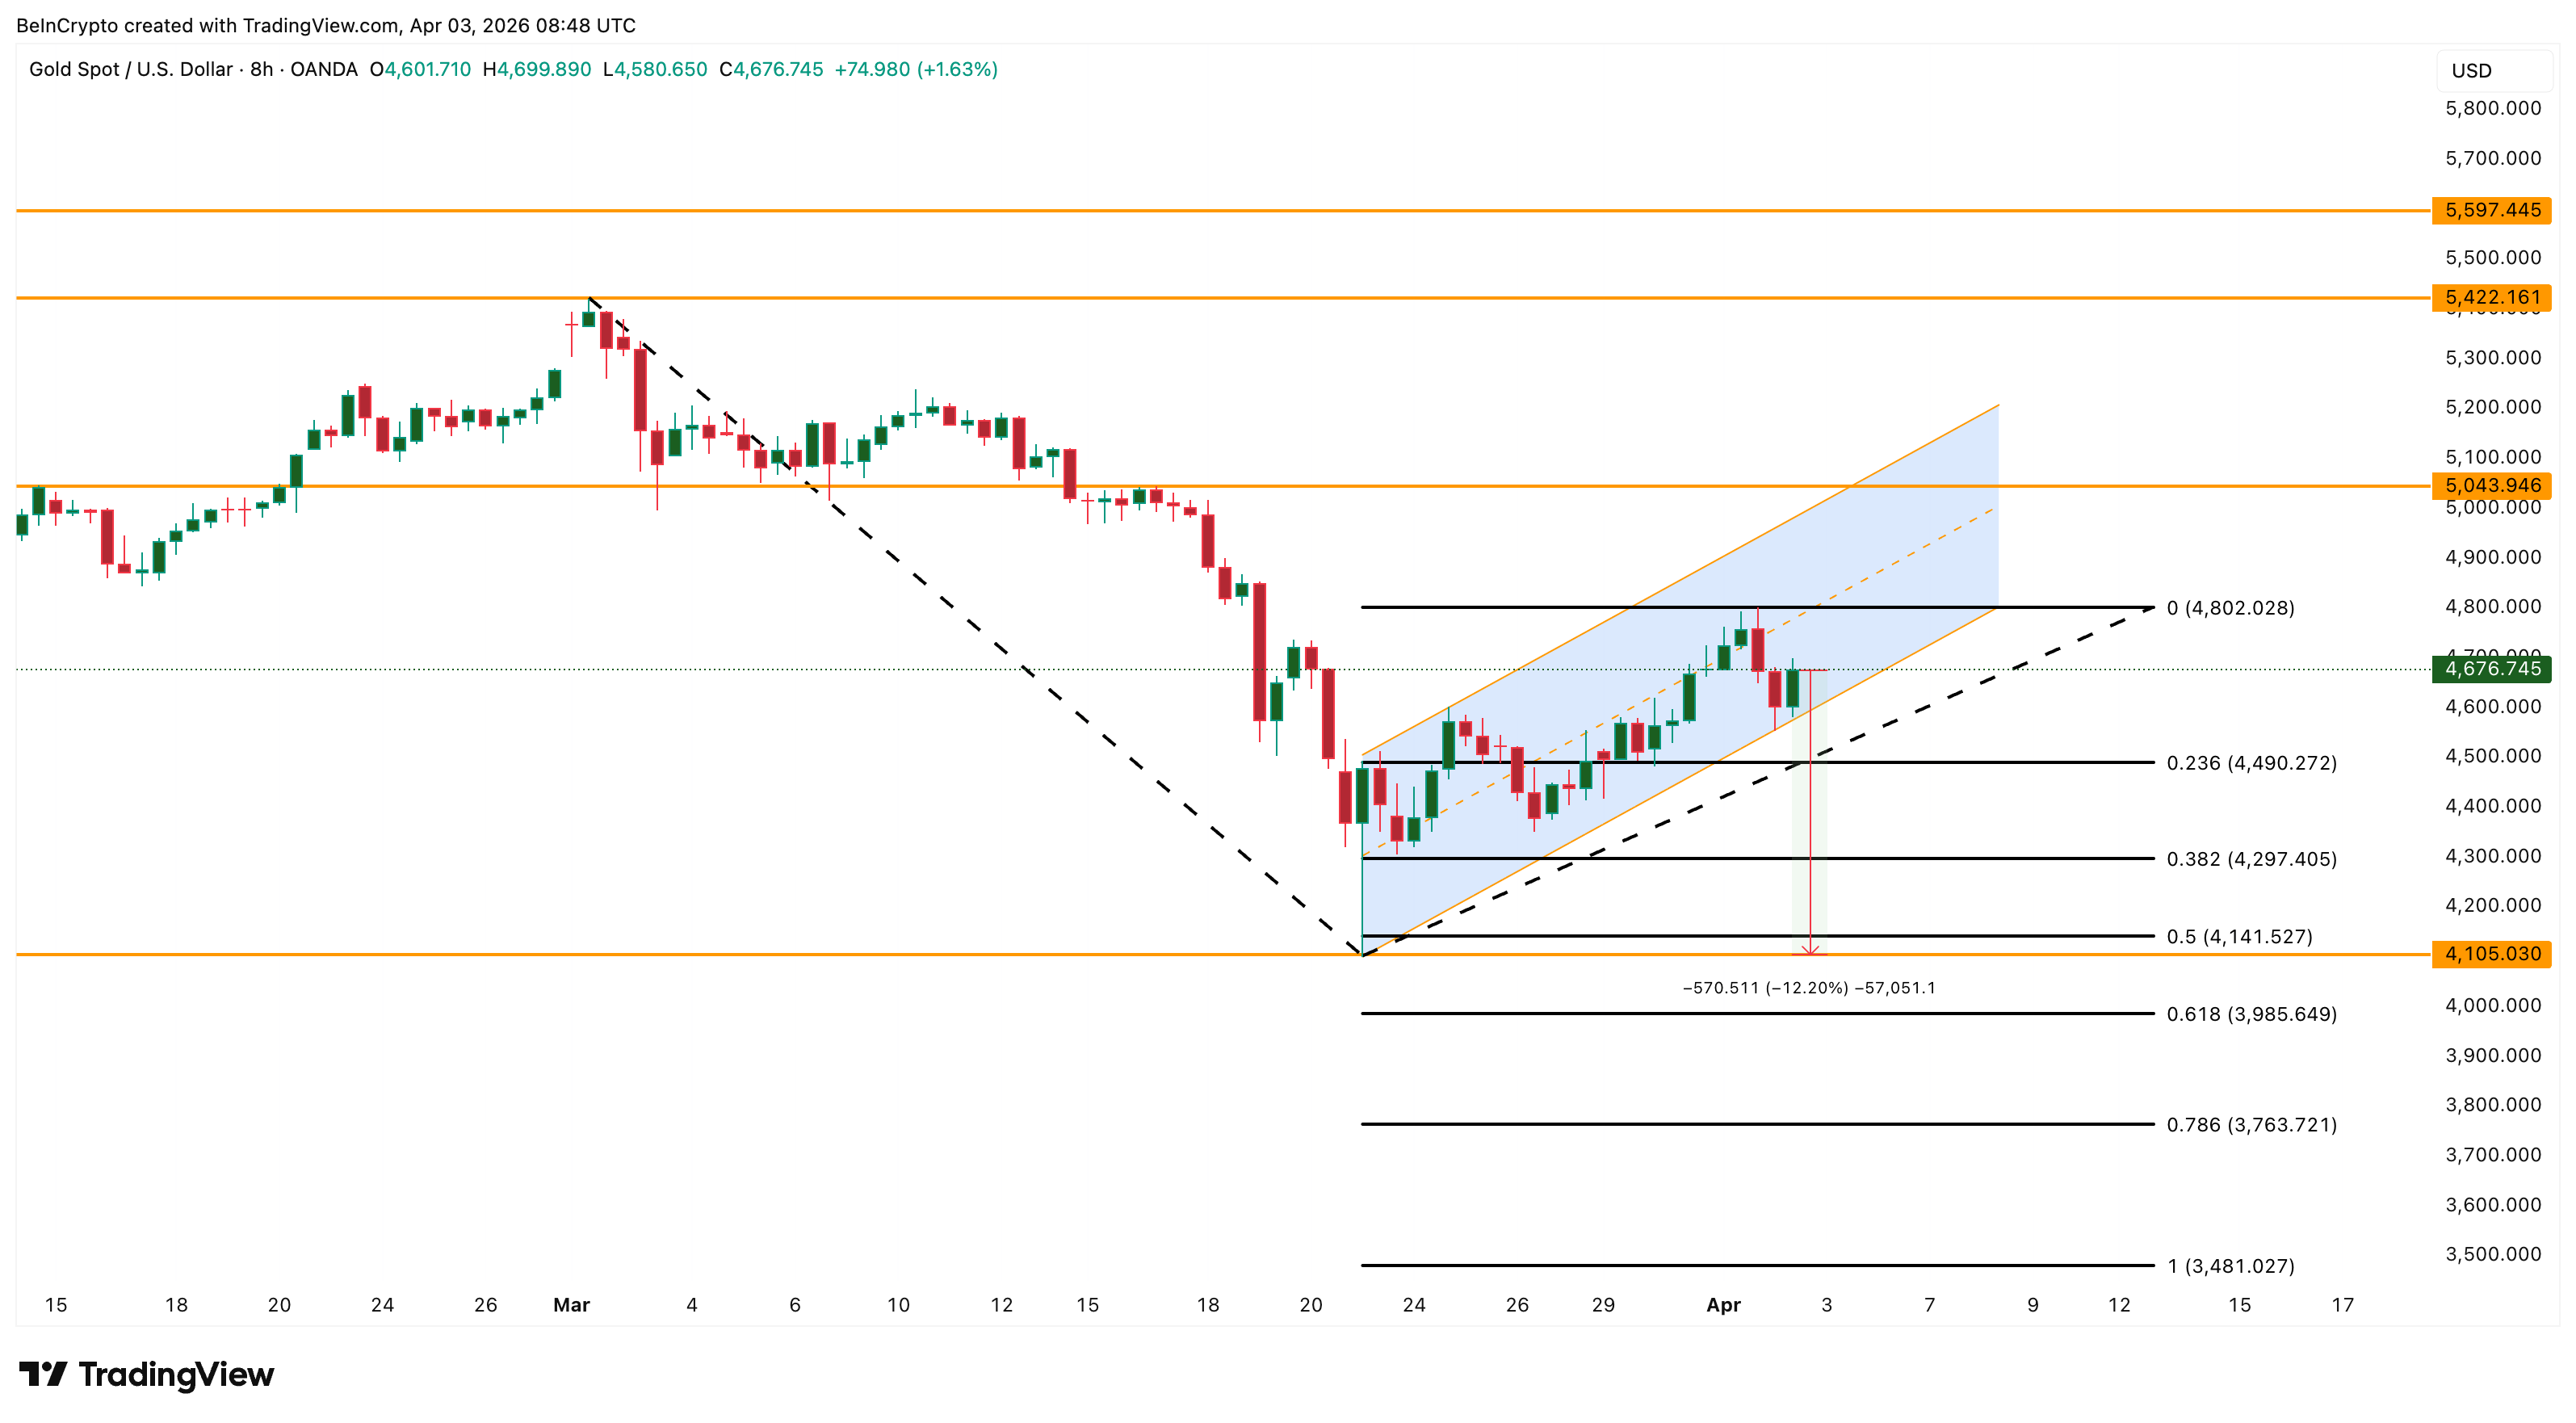
Gold (XAU/USD) price trades near $4,676 on April 3, up roughly 17% since touching a low of $4,105 on March 23. The rally looks convincing. However, a proprietary correlation metric, shifting options positioning, and a nuanced reading of the latest Commitment of Traders report suggest the current advance may be building on the wrong foundation.
Gold’s strongest rallies have historically begun after the metal decoupled from oil, not while both moved higher together. The 17% bounce is riding the same trade that preceded every correction this cycle, and a controlled dip that breaks that link could end up being more constructive than further upside.
Gold Is Rising but the Correlation That Matters Is Already Turning
Since March 23, gold price has been climbing inside an ascending channel on the 8-hour chart. The structure is not a bear flag, as the channel has extended beyond the typical duration, but it is also not confirmed bullish until the upper boundary breaks decisively.
The XAU-WTI Correlation Matrix, a BeInCrypto custom indicator that measures the 50-period rolling correlation between gold spot (OANDA:XAUUSD) and WTI crude oil (TVC:USOIL), currently reads -0.10. The reading has declined from the positive zone it occupied in March but seems to be rising again.
The pattern is consistent. In mid-October, the correlation dropped to around -0.88. and stayed negative through early November. That was when gold price launched its strongest rally. This shows that Gold performs best when it decouples from oil entirely, acting as an independent safe haven.
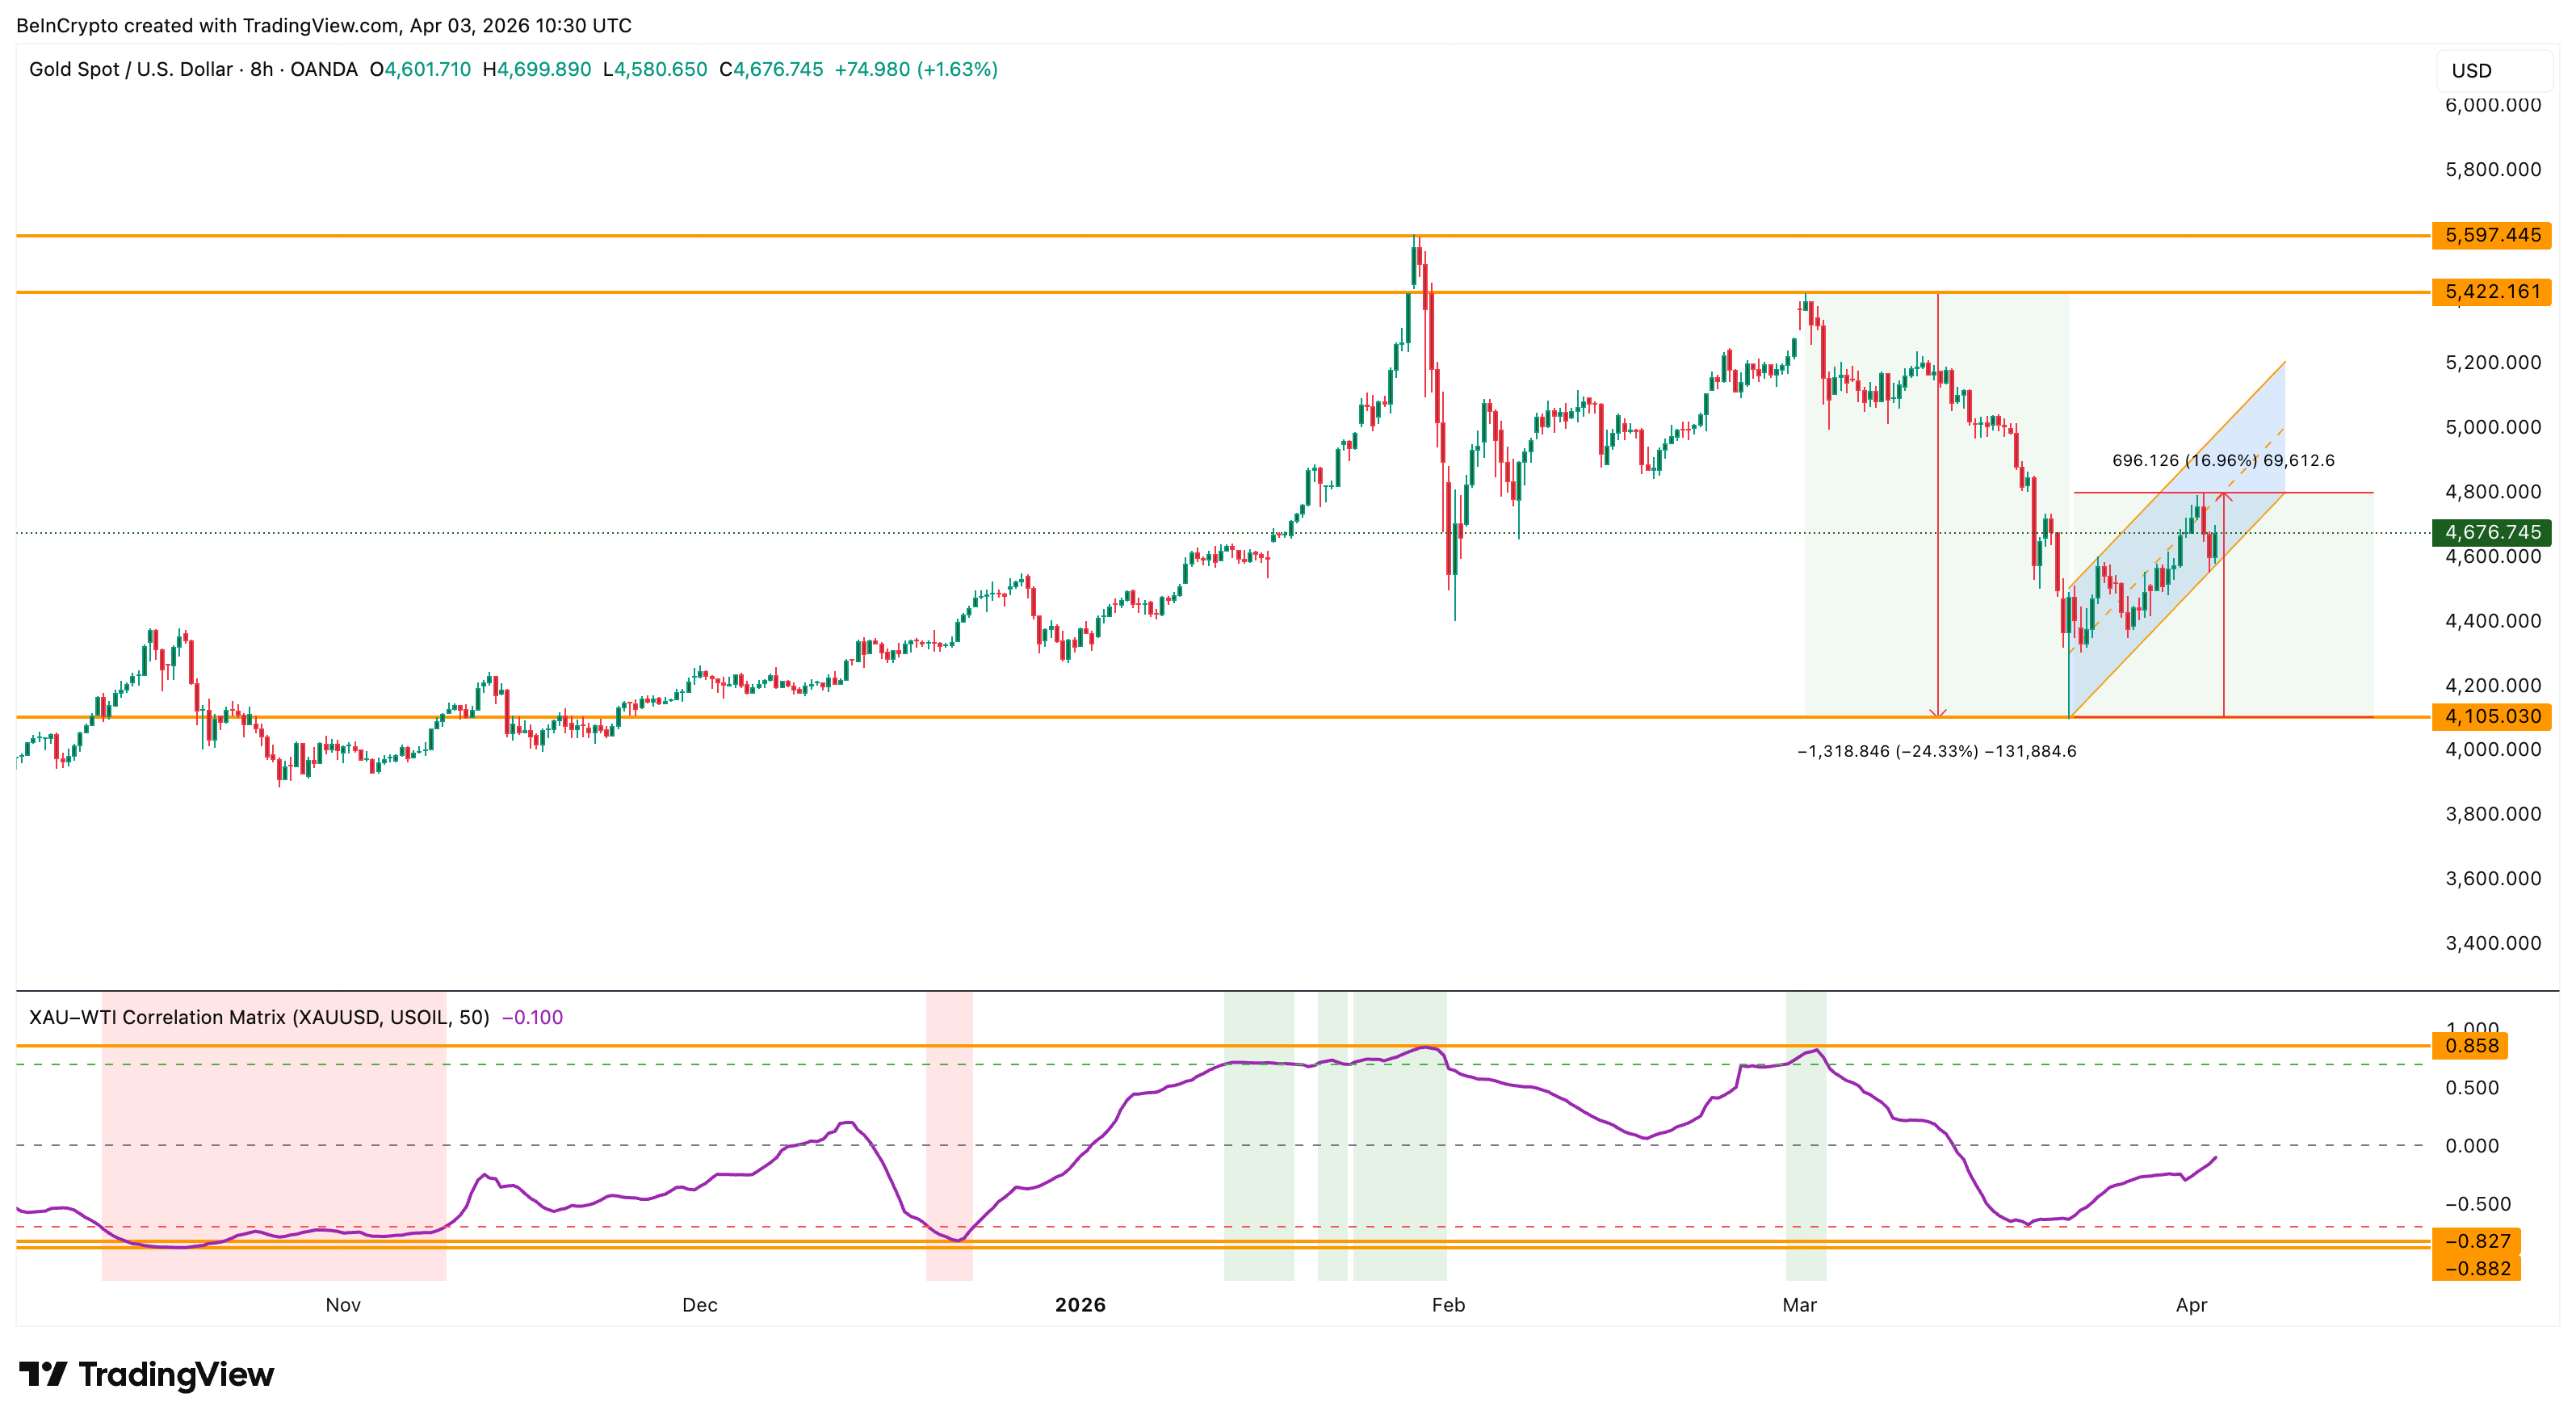
Every time the correlation peaked in positive territory, gold corrected. In late January, the reading hit approximately 0.85, and gold dropped over the following weeks. In early March, another positive peak aligned with the $5,422 high before the sell-off resumed.
The current -0.10 reading places the correlation in transition. The 17% bounce since March 23 happened during this transitional phase, which means it was partially driven by the same oil-linked sentiment rather than independent safe-haven demand.
This is why a controlled dip would be constructive. If gold price pulls back while oil continues to rise, the correlation would accelerate toward the -0.70 zone, exactly where gold has launched every sustained independent rally this cycle.
The rally does not need to continue to be bullish for gold. The correlation needs to finish resetting. Options traders have already begun reacting to the bounce, and their positioning reveals whether the current move has genuine conviction.
Bullish Bets Replaced Bearish Ones but the Foundation Is Reactive
The SPDR Gold Shares ETF (GLD) put-call ratio captures how options traders are positioning around gold price. On March 26, the put-call volume ratio stood at 1.35, meaning significantly more puts than calls were trading. Bearish sentiment dominated. The open interest ratio at the time was 0.53.
By April 2, the volume ratio had collapsed to 0.70 as call activity surged and put volume faded. The open interest ratio rose to 0.56, indicating new long positions were being opened. The bearish bets that dominated during the March sell-off have been replaced by fresh bullish exposure.
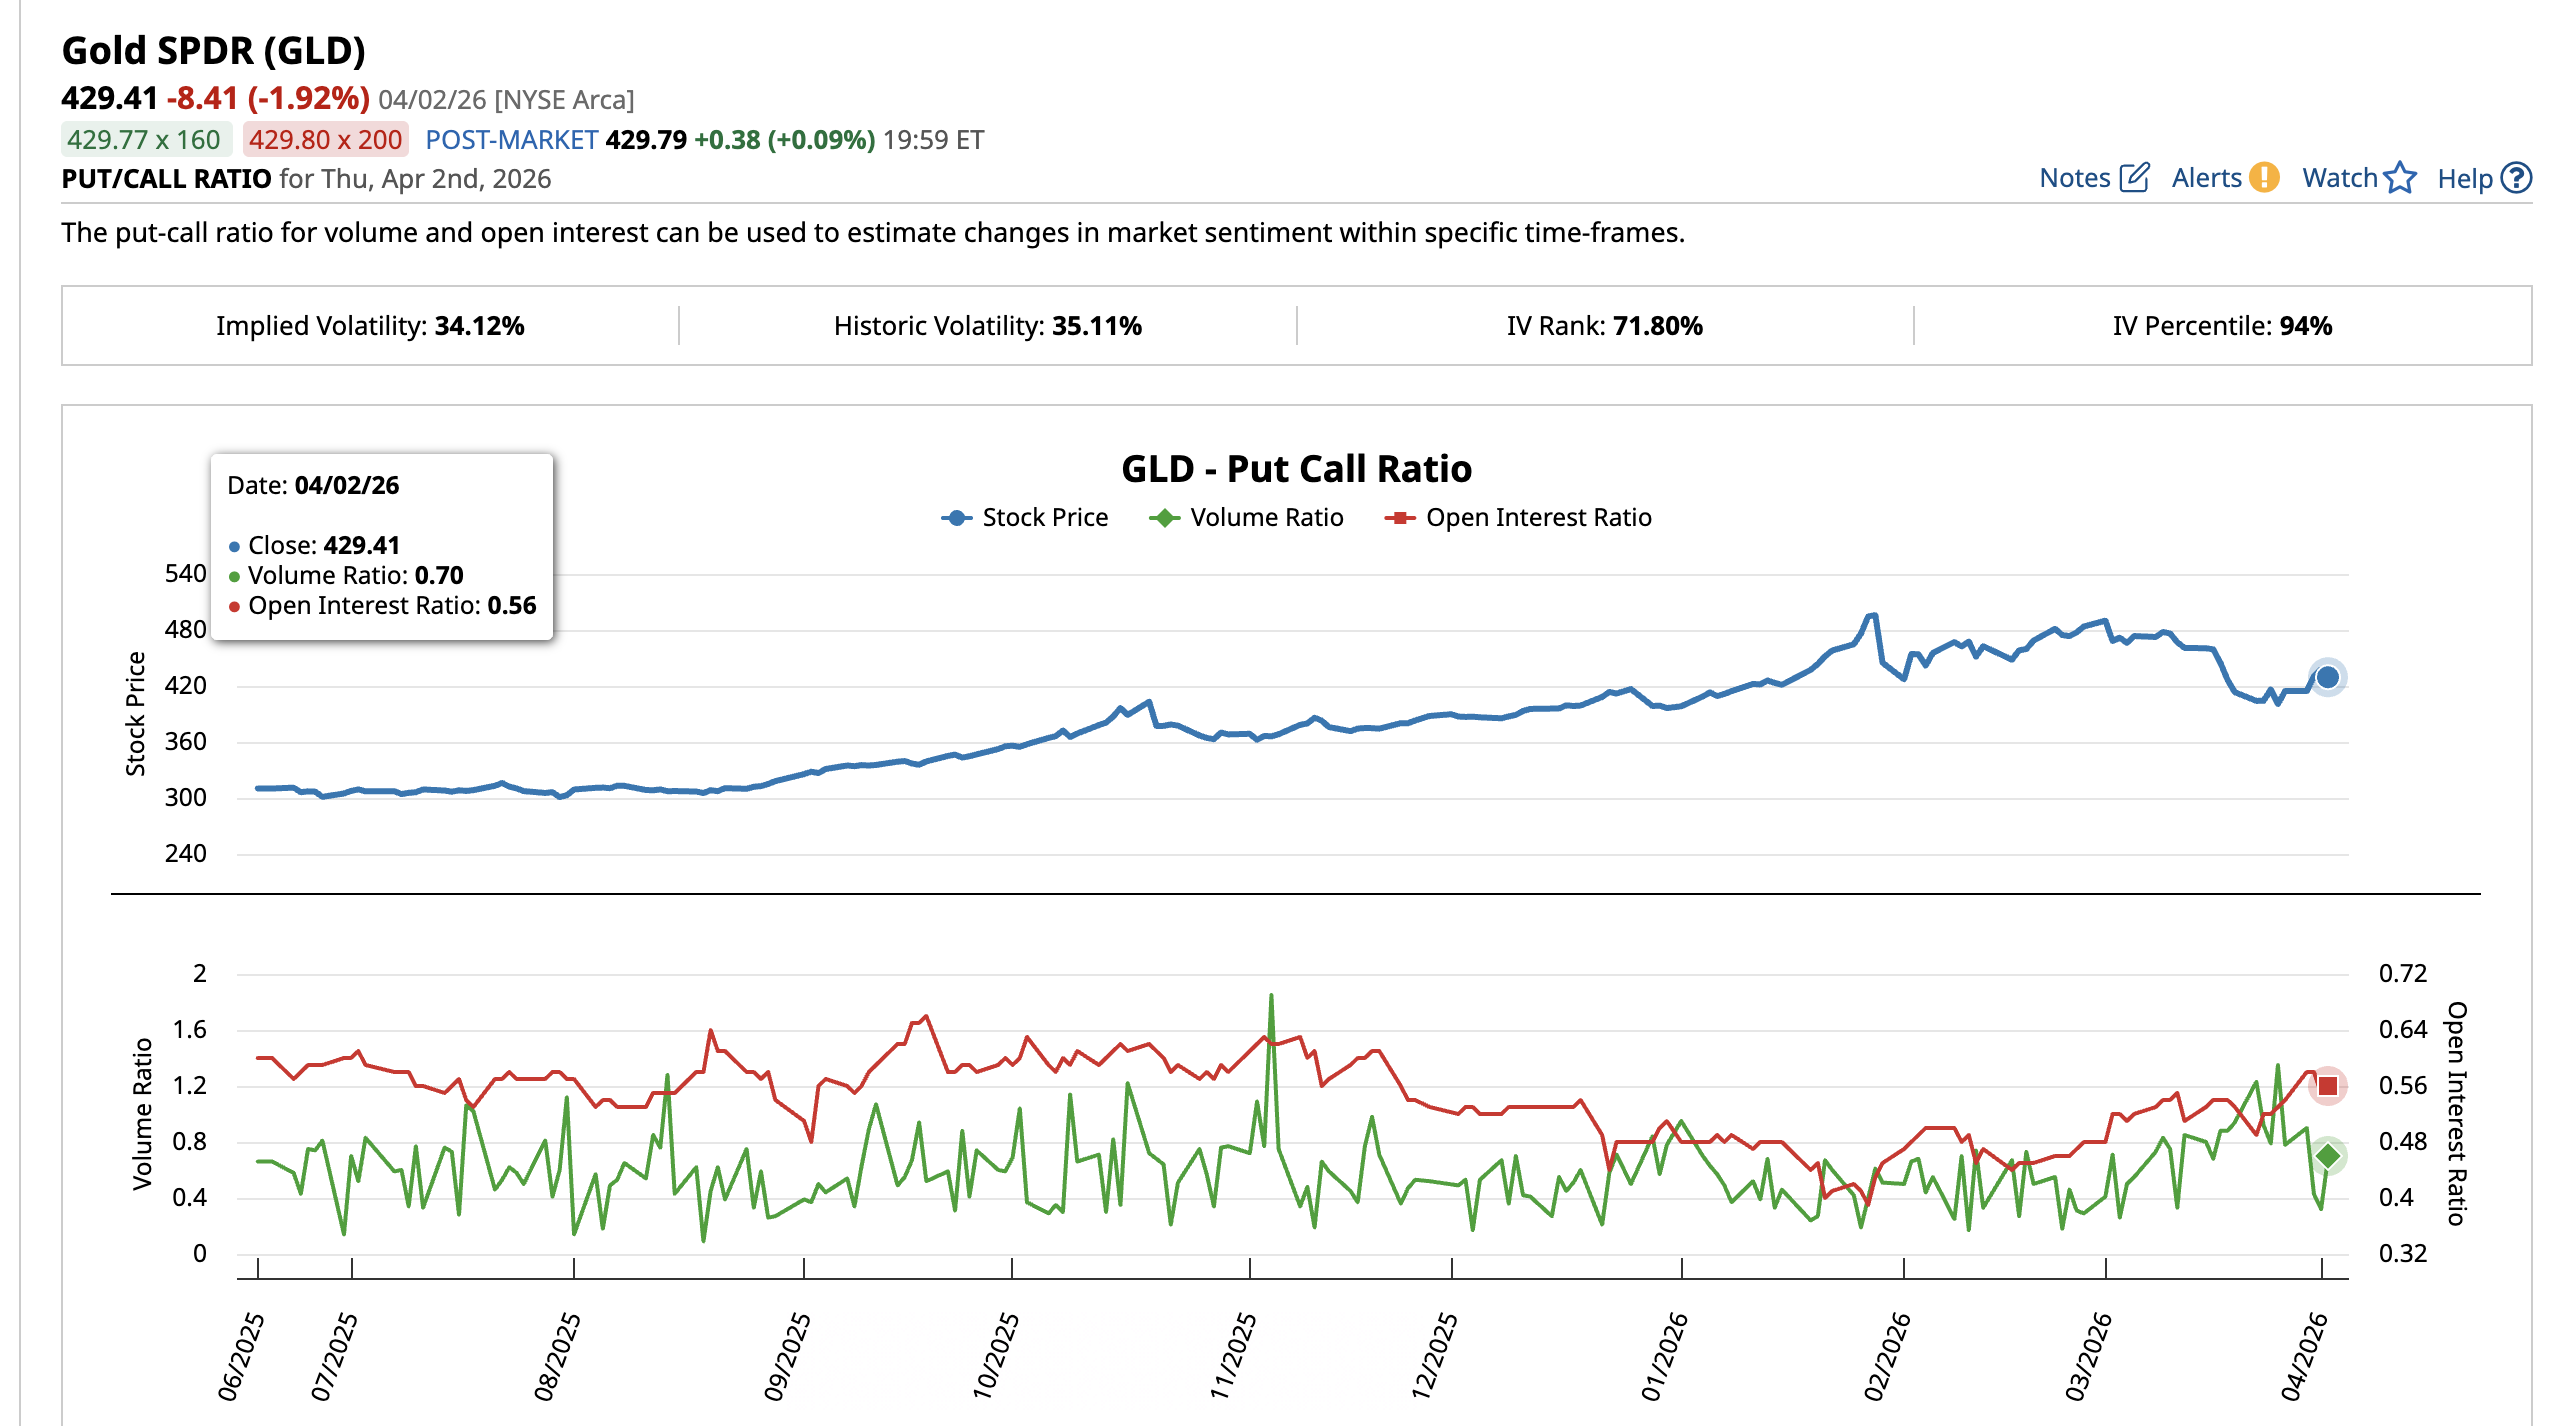
Traders likely responded to the 17% bounce by rotating from protective puts into directional calls. When bullish bets crowd in at the same time the oil correlation surges (current state), the newly opened long positions become vulnerable.
The Commitment of Traders (COT) report, published weekly by the Commodity Futures Trading Commission (CFTC), reinforces this reading. The March 24 report, the latest available, shows non-commercial (speculative) long positions increased by 4,900 contracts to 220,861. Short positions fell by 3,558 to 52,534. On the surface, this looks bullish.
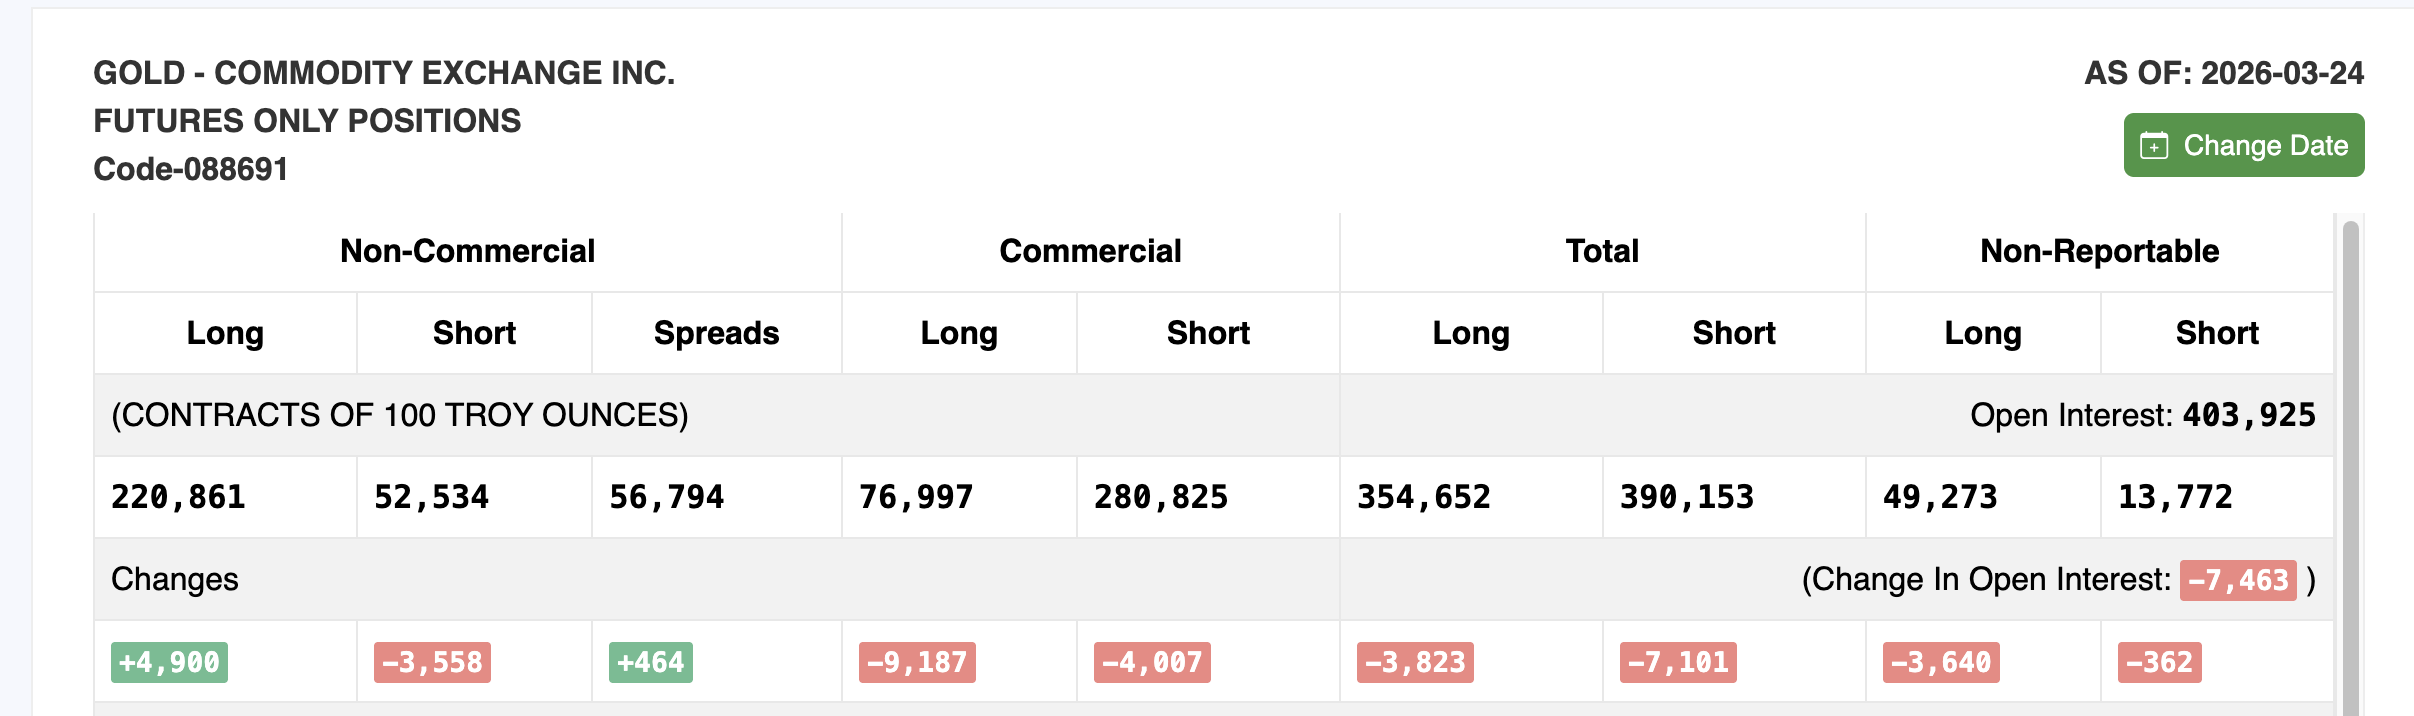
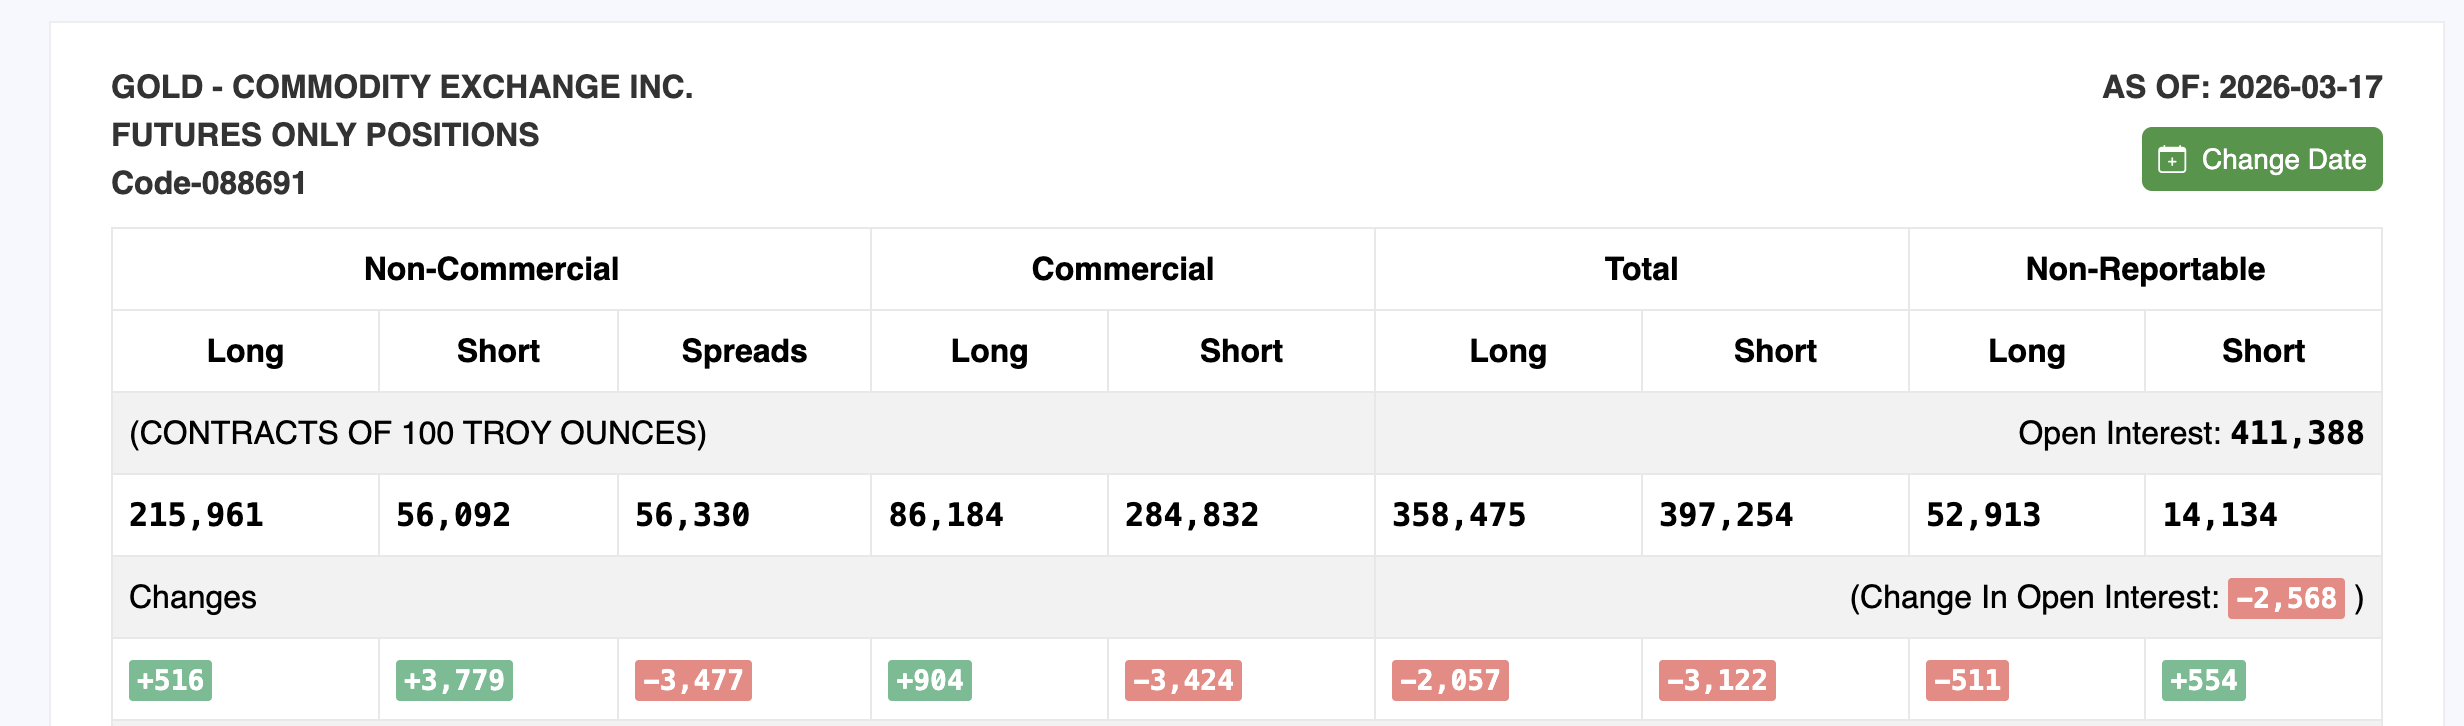
However, total open interest dropped by 7,463 contracts to 403,925 from the previous March 17 report. When longs increase but total open interest falls, it typically means the rally is being driven by short covering rather than fresh buying conviction.
The shift between the two reports aligns with what the GLD put-call data shows. Bearish participants were caught by the 17% rally and scrambled to reposition. This dynamic can sustain a move temporarily but historically does not provide the foundation for a durable gold price advance. The price levels now determine the next path for gold.
Gold Price and the Correlation Paradox
The 8-hour chart with Fibonacci levels frames every critical gold price level. Gold currently sits at $4,676 within the ascending channel.
For the rally to extend, gold needs an 8-hour close above $4,802. Above that, $5,043 acts as the next major resistance. A move through $5,043 would bring $5,422, the March 1 high, back into focus.
However, if gold reaches $5,043 or higher before the correlation completes its reset into deep negative territory, the rally risks repeating the same pattern that preceded both prior corrections. A move higher while the correlation lingers near neutral rather than resetting below -0.70 would leave the advance on an incomplete foundation.
On the downside, $4,490 at the 0.236 Fib represents the first support. Below that, $4,297 at the 0.382 Fib and $4,141 at the 0.5 level come into play. The $4,105 floor from March 23 aligns closely with the 0.5 zone and represents the base of the 17% rally.
Here is where the paradox resolves. A gold price pullback toward $4,105 while oil continues to rise would possibly push the correlation back toward negative territory.
A dip that breaks the oil correlation sets up a stronger foundation for the next sustained move, while a continued rally that keeps both assets moving together leaves gold in the same overheated zone that triggered every correction this cycle. An 8-hour close above $4,802 extends the channel rally but keeps the correlation risk alive, while a pullback toward $4,105 that breaks the oil link could paradoxically be the most bullish outcome for gold’s medium-term path.
The post Why a Gold Price Dip Could Be More Bullish Than Its Current 17% Rally appeared first on BeInCrypto.
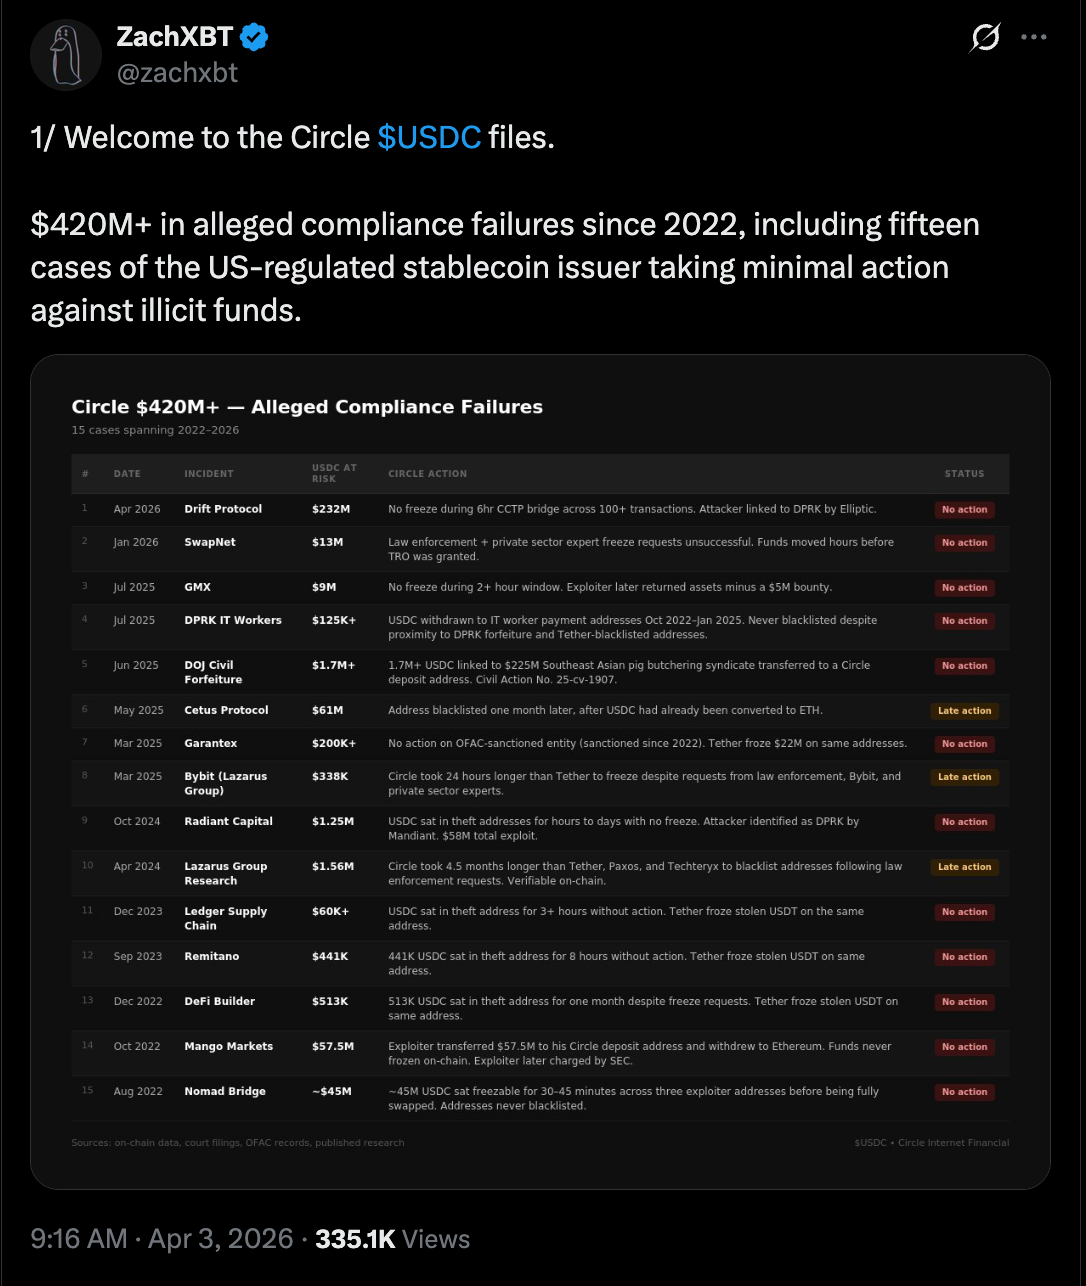
Onchain detective ZachXBT claims that Circle, the issuer of the USDC (USDC) stablecoin, has failed to freeze or blacklist about $420 million in illicit fund flows since 2022.
Circle can freeze illicit funds and blacklist wallet addresses, but either took “minimal” action to freeze illicit flows or failed to act in 15 separate hack-and-fraud cases, including those linked to North Korean (DPRK) state-affiliated hackers, ZachXBT said.
The stablecoin issuer allegedly failed to freeze $9 million in USDC from the GMX decentralized exchange (DEX) hack in July 2025, and blacklisted wallets linked to the $200 million Cetus DEX hack in May 2025 after USDC was converted into Ether (ETH), according to ZackXBT.

Circle failed to freeze $232 million in illicit flows from the Drift Protocol Hack on Wednesday, despite a six-hour window in which the attackers converted USDC to ETH in over 100 separate transactions, he added.
“Circle builds good products, and I hold USDC myself. This isn’t a post about hoping they collapse,” he said, adding that the failure to freeze these illicit flows has had “real consequences for real people.” He said:
“Nine figures were lost from the ecosystem because of repeated inaction across three years on law enforcement requests, private sector requests, and their own infrastructure. The $420 million-plus only accounts for major public cases. The real figure is likely significantly higher.”
Cointelegraph reached out to Circle but did not receive an immediate response by the time of publication.

The lack of asset freezes has sparked an online debate in the crypto community about the role and responsibilities of centralized service providers, as blockchain protocols and users continue to be targeted in hacks and cybersecurity exploits that drain funds.
Related: ZachXBT claims Circle wrongfully freezing exchange wallets
Circle explores “reversible” USDC transactions
In September 2025, Heath Tarbert, the president of Circle, said that the company was exploring “reversible” USDC transactions that could be rolled back or amended in the event of hacks, theft and fraud.
Circle has frozen USDC funds and blacklisted wallets on multiple occasions, including freezing USDC held by Tornado Cash addresses sanctioned by the US Office of Foreign Assets Control in 2022.
Magazine: Meet the onchain crypto detectives fighting crime better than the cops


Brokerage services giant Charles Schwab plans to roll out spot cryptocurrency trading in the first half of 2026, pushing it deeper into digital assets.
“We remain on track to launch our spot crypto offer in the first half of 2026, starting with bitcoin and ether (ETH),” a company spokesperson told CoinDesk on Friday.
The firm has opened a waitlist for clients seeking early access to what it calls a “Schwab Crypto” account, which will allow users to buy and sell the two largest cryptocurrencies. The firm will offer the service via Charles Schwab Premier Bank, SSB.
The move builds on comments from CEO Rick Wurster, who said last July that Schwab aimed to introduce crypto trading “sometime soon” in response to client demand. He framed the effort as a way to bring digital assets into the same account view as stocks and bonds in a push toward a more unified investment platform.
Schwab’s scale could give it an edge as it enters a market long dominated by crypto-native exchanges. The firm reported $11.9 trillion in client assets in 2025, offering a built-in base of retail and institutional investors who may prefer trading crypto within a familiar brokerage environment rather than using standalone platforms.
The firm already allows clients to invest in ETFs linked to cryptocurrencies and trade bitcoin futures on its platform. It also launched the Schwab Crypto Thematic Index (STCE), an ETF that tracks the performance of companies linked to the digital asset sector.

TLDR
- Charles Schwab plans to launch spot Bitcoin and Ethereum trading later this quarter through its brokerage platform.
- The firm manages over $12 trillion in client assets and will roll out the service in phases.
- Employees will receive early access, followed by invited clients, before a full public release.
- Clients will trade Bitcoin and Ethereum directly without using a separate crypto wallet or exchange.
- Charles Schwab Premier Bank, SSB, will operate the new crypto trading service.
Charles Schwab will introduce spot Bitcoin and Ethereum trading later this quarter through its brokerage platform. The firm manages more than $12 trillion in client assets and plans a phased rollout. CEO Rick Wurster confirmed the timeline during a prior earnings call and outlined internal testing before public access.
Charles Schwab to Enable Direct Bitcoin and Ethereum Trades
Charles Schwab will allow retail clients to buy and sell Bitcoin directly within existing brokerage accounts. The company will not require a separate crypto wallet or third-party exchange account. Instead, it will integrate spot trading into its current infrastructure for easier access.
The service will operate through Charles Schwab Premier Bank, SSB, which serves as a regulated banking subsidiary. Employees will receive early access during an internal testing phase before invited clients join. After that, Schwab will open the service to all eligible customers in stages.
Wurster confirmed the launch window during an earlier earnings call with analysts. He said Schwab expects spot crypto trading to go live later this quarter. He also stated that the firm prepared for this move as regulatory conditions evolved.
Brokerage Shifts From Indirect Exposure to Spot Crypto Access
Until now, Charles Schwab has offered digital asset exposure through exchange-traded products and crypto-linked equities. The firm also provided futures contracts and thematic investment portfolios tied to blockchain companies. However, clients could not trade Bitcoin or Ethereum directly on the platform.
The upcoming launch will change that structure by enabling direct spot transactions. Clients will execute trades within their standard brokerage accounts. Schwab will process orders without routing them to an external crypto exchange.
Wurster first signaled interest in spot crypto trading in late 2024. He said the firm monitored regulatory developments closely before expanding services. He added that Schwab positioned itself to act when conditions allowed.
The firm aims to compete with established crypto trading platforms. Schwab will offer Bitcoin and Ethereum trading alongside traditional securities. This structure places Schwab in direct competition with Coinbase, Robinhood, and Webull.
Wurster addressed competition during prior remarks about the rollout. He said, “We are ready to compete in spot Bitcoin and Ethereum trading.” He emphasized that Schwab intends to provide a familiar and regulated environment for clients.
Schwab already supports crypto-linked ETFs and futures within its brokerage accounts. However, the firm will now expand into direct ownership of digital assets. The rollout will follow internal testing and controlled client access before full availability.
The brokerage also plans to introduce a stablecoin product in the future. Wurster confirmed this plan after lawmakers passed the GENIUS stablecoin bill. He said the company will move forward once it finalizes operational details.
Charles Schwab expects to complete the phased rollout later this quarter. The company will announce broader access once testing concludes. For now, the firm continues internal preparations ahead of the public debut.

TLDR
- The tokenized real-world asset market reached $27.65 billion in April 2026 after a 4.07% monthly increase.
- Tokenized US Treasuries led the growth within the real-world asset sector during the crypto downturn.
- Bitcoin target markets showed low odds of reaching $100,000 by June 30.
- The US-Israel-Iran conflict contributed to a broader risk-off sentiment across crypto markets.
- Institutional inflows into Bitcoin products remained flat throughout April.
The tokenized real-world asset market climbed to $27.65 billion in April 2026 despite a broader crypto downturn. Data showed a 4.07% monthly increase even as digital asset prices weakened. At the same time, Bitcoin price target markets reflected low odds of reaching $100,000 by June 30.
Real-world Asset Growth Reflects Demand for Stability
The real-world asset sector expanded to $27.65 billion in April, according to market trackers. The market posted a 4.07% rise despite falling cryptocurrency valuations. Analysts attributed the increase to sustained demand for tokenized US Treasuries and similar products.
US Treasuries led issuance volumes within tokenized offerings during the month. Market data showed steady allocations from institutional participants. One market analyst said, “Institutions continue to allocate toward tokenized Treasuries for stability and liquidity.”
Trading volumes in tokenized debt products held firm during April. Platforms reported consistent settlement activity across blockchain networks. This flow supported the sector’s growth while crypto prices faced pressure.
Market participants shifted capital toward blockchain-based representations of traditional assets. As a result, tokenized Treasury products gained higher on-chain balances. The data showed continued expansion even as Bitcoin prices fluctuated.
Bitcoin Struggles as Geopolitical Tensions Weigh on Sentiment
Bitcoin target markets showed thin activity for the $100,000 June 30 contracts. Order books reflected limited participation from large traders. Pricing implied a low probability for the six-figure milestone within the set timeframe.
The US-Israel-Iran conflict contributed to a broader risk-off environment. Traders reduced exposure to volatile assets during heightened geopolitical tensions. A derivatives strategist said, “Geopolitical uncertainty has reduced appetite for leveraged crypto positions.”
On-chain metrics showed no major institutional inflows during the period. Exchange-traded products linked to Bitcoin recorded flat subscription data. This lack of fresh capital limited upward price momentum.
Futures market positioning indicated restrained leverage across major exchanges. Funding rates remained neutral to slightly negative through late April. These metrics aligned with subdued expectations for short-term price rallies.


After the $285 million Drift hack, the focus is shifting to Circle (CRCL) and whether it could have done more to stop the money.
The attacker siphoned off roughly $71 million in USDC as part of the exploit Wednesday, according to blockchain security firm PeckShield. After converting most of the rest of the stolen assets to USDC, the hacker used Circle’s cross-chain transfer protocol, CCTP, to bridge about $232 million in USDC from Solana to Ethereum, making recovery efforts more difficult.
That movement has drawn criticism from parts of the crypto community, including prominent blockchain investigator ZachXBT, who argued Circle could have acted faster to limit the damage.
“Why should crypto businesses continue to build on Circle when a project with 9 fig[ure] TVL [total value locked] could not get support during a major incident?,” he said in an X post following the attack.
To freeze or not to freeze
The company had tools at its disposal, ZachXBT pointed out. Under its own terms, Circle reserves the right to blacklist addresses and freeze USDC tied to any suspicious activity.
Preemptively freezing wallets linked to the exploit could have slowed or stopped the attacker’s ability to move funds, one stablecoin infrastructure firm founder told CoinDesk.
However, acting without a court order or law enforcement request might expose Circle to legal risk, the person added.
Salman Banei, general counsel of tokenized asset network Plume, said freezing assets without formal authorization could expose issuers to liability if done incorrectly. He argued regulators should address that legal gap.
“Lawmakers should provide a safe harbor from civil liability if digital asset issuers freeze assets when, in their reasonable judgment, there is strong basis to believe that illicit transfers have occurred,” Banei said.
That constraint was central to the company’s response.
“Circle is a regulated company that complies with sanctions, law enforcement orders, and court-mandated requirements,” a spokesperson said in an email to CoinDesk. “We freeze assets when legally required, consistent with the rule of law and with strong protections for user rights and privacy.”
‘Gray zone’
The episode highlights a deeper tension that’s drawing increasing scrutiny as stablecoins grow.
Tokens like USDC are becoming a core part of global money flows, especially for cross-border payments and trading. At the same time, they are also used in illicit activity, putting issuers under pressure to act quickly when things go wrong.
According to TRM Labs, roughly $141 billion in stablecoin transactions in 2025 were linked to illicit activity, including sanctions evasion and money laundering.
Blockchain security firms pointed to North Korean hackers as likely being behind the Drift exploit.
Stablecoins issued by centralized, regulated entities like Circle’s USDC are designed to be programmable and controllable, a feature that can help stop illicit flows but could also raise concerns about overreach and due process.
In the Drift exploit’s case, the situation isn’t that clear-cut, said Ben Levit, founder and CEO of stablecoin ratings agency Bluechip.
“I think people are framing this too simplistically as ‘Circle should’ve frozen,’” he said. “This wasn’t a clean hack, it was more of a market/oracle exploit, which puts it in a gray zone.”
“So any action by Circle becomes a judgment call, not just a compliance decision,” he added.
To him, the bigger issue is consistency. “USDC can’t be positioned as neutral infrastructure while also allowing discretionary intervention without clear rules,” Levit said. “Markets can handle strict policies or no intervention, but ambiguity is much harder to price.”
That leaves issuers in a difficult position. Moving too slowly risks criticism that they are enabling bad actors, while acting too quickly without legal backing raises concerns about overreach.
And in fast-moving exploits, that trade-off becomes especially stark, with the window to act often measured in minutes rather than weeks or months of legal processes.
The Independent Community Bankers of America has opposed the Office of the Comptroller of the Currency’s (OCC) conditional approval of Coinbase’s national trust bank charter, warning the application falls short of regulatory standards and could pose risks to consumers and the financial system.
On Thursday, ICBA said Coinbase’s application shows deficiencies in risk controls, profitability and resolution planning, and argued the OCC lacks statutory authority to expand trust powers for crypto-related activities without applying the full set of banking regulations.
The group said the decision reflects a broader trend of nonbank entities seeking access to the benefits of bank charters without meeting the same regulatory requirements. It wrote:
The sudden influx of applications demonstrates nonbank entities are seeking the benefits of a US bank charter without satisfying the full scope of US bank regulations.
Americans for Financial Reform Education Fund also criticized the decision, warning the approval departs from longstanding banking law and could expose the financial system to risks tied to crypto market volatility, fraud and money laundering.
The objections follows the OCC’s conditional approval on Thursday of Coinbase’s application to establish a national trust bank, after six months of review by the US regulator.

Coinbase released a statement on Thursday saying the charter would bring its custody and market infrastructure business under federal oversight, emphasizing that it does not plan to hold customer deposits or engage in fractional reserve lending, and adding that “the right path forward for crypto is through the system — not around it.”
Related: Crypto awareness tops 80% among young people in UK: Coinbase survey
Stablecoin yield dispute stalls crypto market structure bill
The opposition is part of a broader dispute between banking groups and crypto companies over the role of digital assets in the financial system, particularly around stablecoins and yield-bearing products.
In January, CEO of Bank of America Brian Moynihan warned that allowing stablecoin issuers to offer interest could draw as much as $6 trillion in deposits out of the banking system, reducing lending capacity and pushing borrowing costs higher.
Industry groups such as the Bank Policy Institute have also raised similar concerns in letters to lawmakers, arguing that regulatory gaps could allow yield-bearing stablecoin products to bypass restrictions and disrupt traditional credit channels.
The debate is currently playing out in Washington, where Coinbase is engaged in policy discussions over the US Digital Asset Market Clarity Act, a bill aimed at establishing federal rules for crypto oversight.

While Coinbase CEO Brian Armstrong said in January that the company could not support the legislation as drafted due to restrictions on stablecoin rewards, Coinbase chief legal officer Paul Grewal said on Thursday that lawmakers are nearing agreement on core elements of the bill, though the yield issue remains a key sticking point.
The dispute has delayed a Senate Banking Committee markup, a required step before the bill can advance to a full Senate vote, leaving broader efforts to establish a federal framework for digital assets unresolved.
Magazine: Nobody knows if quantum secure cryptography will even work
TLDR
- Cardano founder Charles Hoskinson publicly praised the new Midnight advertisement on his official X account.
- Hoskinson shared the 47-second clip and wrote, “I love these new Midnight ads,” in his post.
- The advertisement highlights privacy risks linked to public blockchain transactions and data exposure.
- The video promotes selective disclosure as a solution to protect sensitive on-chain information.
- Midnight operates as a privacy-focused Cardano sidechain that uses zero-knowledge proofs.
Cardano founder Charles Hoskinson praised a new Midnight advertisement that promotes blockchain privacy. He shared the 47-second clip on X and wrote, “I love these new Midnight ads.” The video frames privacy as essential and presents Midnight as a practical solution.
Midnight Ad Highlights Privacy Concerns
Hoskinson reposted the Matrix-themed advertisement on Friday through his official X account. He captioned the post, “I love these new Midnight ads,” and drew attention from the crypto community. The clip runs for 47 seconds and centers on privacy risks in public blockchains.
The advertisement uses scenes inspired by The Matrix and features characters Neo and Morpheus. It references the moment when Morpheus explains hidden realities to Neo. The voice-over states that every click, search, and purchase is monitored on digital networks.
The video explains that blockchain records remain public and transparent by design. It states that anyone can trace transactions on an open ledger. It then argues that such exposure can place personal data at risk.
The advertisement introduces selective disclosure as a safeguard for users. It tells viewers they can choose what information others can access. It positions Midnight as the network that enables this control.
The clip also mentions crypto-related kidnappings and thefts. It links those crimes to exposed on-chain data. It stresses that leaked personal information can lead to real-world harm.
Midnight Positions Itself as Privacy-Focused Infrastructure
Midnight operates as a privacy-centered sidechain within the Cardano ecosystem. The network uses zero-knowledge proofs to protect sensitive data. It allows users to verify transactions without exposing full details.
The project describes itself as a fourth-generation blockchain platform. It aims to balance compliance standards with data protection tools. It supports selective disclosure while maintaining blockchain transparency.
Midnight launched its mainnet on March 30 after months of beta testing. The team completed earlier testing phases before activating the network. Hoskinson has described the sidechain as a key step for broader crypto adoption.
He has stated that privacy tools can attract institutions to blockchain systems. Traditional financial firms require strict data protection measures. Midnight seeks to offer similar safeguards on decentralized infrastructure.
In March, Monument became the first UK-regulated bank to tokenize retail deposits on Midnight. The bank recorded those deposits on a public ledger using the network. This move marked an early institutional use case for the platform.
Midnight continues to promote privacy features through marketing campaigns. The latest advertisement highlights user control and protection tools. Hoskinson’s public endorsement amplified the campaign across social media platforms.

In February 2026, Felix Fan took over as CEO of Trust Wallet, succeeding Eowyn Chen. More often than not, a new CEO spends months getting to know the company, but Fan started by shipping new features to significantly improve the user experience for Trust Wallet’s 220 million users.
Trust Wallet shipped the Trade Menu shortly after he arrived. Within 48 hours, four more products followed, including swap price impact protection, an updated Trending Page, prediction markets through predict.fun, and 1-click swaps.
“I didn’t need months to audit Trust Wallet,” he told BeInCrypto. “I came in with a clear point of view, and the team had already been doing the hard work. My job was to accelerate innovation, not hesitate.”
What’s less obvious is why Fan sees this moment as urgent, and what he thinks Trust Wallet is actually becoming.
He Thinks the Category Has Missed a Few Things
Fan came to Trust Wallet from OKX, where he ran product. He’s seen the space from multiple angles, and when asked where self-custodial wallets have fallen short, he doesn’t hedge.
Speed is the first thing he names. “When you see a market move, you should be able to act in seconds. Most wallets still make that unnecessarily hard,” he said.
Then there’s the user nobody built for. People who’ve done a few trades and want to go deeper, not beginners, not power users, just somewhere in the middle with no clear trajectory.
“The industry obsesses over first-timers and power users,” Fan noted. “The people who’ve done a few trades and want to go deeper? They’re largely underserved. There’s no natural progression.” That’s less a design gap than a product philosophy gap. The middle tier got skipped.
And then trust signals, which Fan frames as a responsibility the wallet itself should carry. Users sign transactions they can’t fully parse, get exposed to scam contracts without any warning from the app. “The wallet should be a layer of protection,” he said. “That’s an area the whole industry has under-invested in, and it’s something we’re taking seriously — being the most secure wallet is a core part of our identity.”
Why the Trade Menu, Why Now
Something shifted in how people trade crypto. They don’t sit down and decide between swapping and perps. They see a market move and want in. The decision is intent-based, not product-based. Most wallets didn’t get that memo. Features are scattered. Execution is buried. The moment of action gets slowed down by the interface.
The Trade Menu is the fix for that, at least the beginning of one. Swap, perpetuals, predictions, trending plays are in one place and only require one tap.
“That friction has a real cost,” Fan said. “The Trade Menu removes it. One entry point for everything. That’s not a small UX tweak — that’s a statement about what kind of wallet we’re building. A command center for decentralized finance, not just a balance checker.”
Some of what’s coming on the roadmap isn’t new territory. Live charts, transparent fee structures — CEX traders have had these for years. Fan said as much. “Fair challenge. Yes, some of what’s coming are things CEX users expect as baseline. We should have had them. We’re fixing that. But that’s the foundation, not the destination.”
The destination is harder to categorize. Fan describes a wallet where users broadcast intent and the network handles execution — self-custodial by default, cross-chain natively, not routed through any centralized order book.
“That’s not a CEX or a DEX. That’s a new category,” he said. “The Trade Menu is the first step toward that.”
“Simple by Default” Might Be Harder Than It Sounds
The principle running through the product is “simple by default, advanced by choice.” Fan doesn’t dress it up.
What does the user see first? That’s the decision everything comes back to. Show too much and you overwhelm. Show too little and power users hit a wall immediately.
“The hardest part is entry points,” Fan explained. “Every extra option you surface adds cognitive load. Every option you hide risks frustrating a power user.”
With the Trade Menu, the call was to optimize for the moment of intent — clean default view, advanced controls there when you want them. The middle-tier user complicates that. The one who’s past basic swapping but not yet doing anything sophisticated.
“We have to earn their trust gradually and give them more as they’re ready,” Fan said. “That’s a sequencing challenge as much as a design one. We’re not perfect at it yet. But that’s exactly the kind of thing we’ll keep iterating on.”
On Independence
Fan’s target to enhance Trust Wallet comes when CEX-backed wallets have gotten serious. Several now offer real self-custody, deep liquidity behind them, user bases fed directly from their parent exchanges.
Yet, he doesn’t think that makes the case for self-custodial wallets any harder. If anything, it makes it more important.
“CEX-backed wallets have a structural ceiling. They will always be optimized — consciously or not — for their parent exchange’s liquidity, products, and interests. That’s just the reality,” he said. “Our only job is to give users the best available prices from decentralized markets, the best experience, and full control over their own assets. We can integrate the best liquidity sources, not just the ones we own. Independence is a feature. And 220 million people have already voted for it.”
The Number Trust Wallet Is Actually Building Toward
Under his leadership, Trust Wallet has flagged trading, UX, and AI as H1 priorities. On sequencing, Fan is clear that UX comes first because it affects every user right now.
“AI is only as good as the product it’s built on. If the swapping experience is clunky, the AI inherits that friction. So better UX isn’t just good for users today — it’s the foundation that makes AI actually work tomorrow,” Fan said.
Trust Wallet has begun building out developer-facing AI infrastructure. In late February, the team shipped an MCP server for instant access to its documentation, an open-source Claude Code skills marketplace. That was followed by the launch of the Developer Portal, giving AI agents read-only access to data across more than 100 chains.
Most recently, Trust Wallet launched the Agent Kit, a toolkit that lets AI agents execute real crypto transactions across more than 25 blockchains within permissions defined by the user.
Consumer-facing features come after.
And when asked about the early signals that they’re moving in the right direction, Fan watches engagement depth, trader retention, and qualitative signals on whether the app feels faster.
“We want to be the number one mobile wallet with over 40% active users. Not just downloads. Not just installs. People who open Trust Wallet because it’s genuinely the best place to act on crypto. That’s the bar we’re building toward,” he said.
The post Trust Wallet CEO Felix Fan on Building a Crypto Wallet That Keeps Up With the Market appeared first on BeInCrypto.
Kalshi, the prediction market platform, announced that Stephanie Cutter—former Obama administration staffer and co-founder of Precision Strategies—will join the company as a policy adviser. The appointment, disclosed in a Thursday notice, comes as Kalshi seeks to deepen its political and regulatory engagement in Washington, D.C., and across the country. Cutter’s arrival adds a veteran of Democratic campaigns to Kalshi’s policy team at a moment when the industry faces intensifying regulatory scrutiny and evolving questions about the role of politics in prediction markets.
Kalshi said Cutter’s move would help the firm “deepen its relationships in DC and across the country.” CEO and co-founder Tarek Mansour highlighted Cutter’s governmental and political experience as a bridge to policymakers and other stakeholders. Cutter’s hiring follows Kalshi’s strategy of embedding itself more firmly in political circles as it navigates a regulatory landscape that has grown more complex over the past year.
Kalshi’s roster already includes staff with government ties, including the appointment of Donald Trump Jr. as a strategic adviser in January 2025, a development noted in the market’s broader push to align with political figures ahead of a changing regulatory climate. The recruitment of Cutter signals Kalshi’s intent to bring experienced policy voices directly into its decision-making as it seeks to balance growth with compliance in a jurisdiction that has seen ongoing legal and legislative debate surrounding event-based markets.
At the same time, the legal and regulatory environment for prediction markets remains unsettled. State-level authorities have pursued lawsuits against Kalshi and other platforms offering event contracts, arguing that such markets amount to illegal gambling or betting. In Washington, the U.S. Commodity Futures Trading Commission (CFTC), led by Michael Selig, has asserted that it holds exclusive jurisdiction over these markets and has pursued cases against state gaming regulators over the matter. The tension underscores a broader push by lawmakers to scrutinize, and potentially constrain, prediction markets—especially those tied to political events.
Key takeaways
- Kalshi hires Stephanie Cutter as policy adviser to strengthen policy outreach amid ongoing regulatory scrutiny of prediction markets.
- Cutter’s background in government and political campaigns is intended to help Kalshi communicate its position to policymakers and the public, per the company.
- The platform already counts high-profile political advisers, including Donald Trump Jr., illustrating Kalshi’s bid to embed in political circles during a sensitive regulatory era.
- Regulatory friction persists: the CFTC claims exclusive oversight of prediction markets, while state regulators challenge or enforce their own regimes, prompting lawsuits and legislative proposals.
Policy push in a contested space
The timing of Cutter’s arrival underscores Kalshi’s ambition to leverage policy expertise as a differentiator in a market where regulatory clarity remains elusive. Kalshi’s notice frames the hire as part of a broader effort to cultivate relationships with lawmakers, regulators, and stakeholders who will shape the framework governing event-based contracts. Mansour’s remark—emphasizing Cutter’s ability to “get the message to the right people”—illustrates how Kalshi views policy engagement as central to its long-term viability and competitive positioning.
The broader governance context is clear: while Kalshi positions itself as a legitimate financial technology, it operates in a space where opinions diverge on whether prediction markets should be permitted to operate with fewer restrictions, and if so, what guardrails are necessary to prevent manipulation or insider trading. The presence of political advisers on Kalshi’s payroll reflects a strategic bet that shaping policy conversations could yield a more favorable operating environment, or at least greater predictability for a product that depends on real-world events occurring as forecasted.
Regulatory battleground: courts, commissions, and state actions
Industry observers note that the past year has seen a wave of legal activity at the state level, where regulators have challenged or restricted prediction-market-like offerings. Proponents argue such markets can improve price discovery and information flows, while opponents point to concerns about gambling law, consumer protection, and the potential for insider information to drive bets. Kalshi and peers such as Polymarket have publicly discussed implementing guardrails intended to curb use by insiders, but legislative progress remains uneven.
On the federal side, the CFTC has framed the issue within the agency’s core remit: it asserts exclusive jurisdiction over derivative-like markets tied to events and has taken action against state authorities in other contexts to defend that stance. This legal backdrop matters for Kalshi’s strategy, because a clearer federal framework could reduce intergovernmental friction and open the door for broader user participation under explicit guidelines. For investors and users, the outcome of ongoing court fights and potential federal legislation will influence the platform’s risk profile and the types of markets Kalshi can legally offer in the coming years.
Meanwhile, congressional dynamics add another layer of potential change. Several bills have floated the idea of preventing politicians from participating in predictive markets and of imposing stricter disclosures around the use of such platforms. As of the latest developments, none of these proposals had been enacted into law, leaving a period of watchful waiting for operators, users, and policymakers alike. In this context, Kalshi’s move to strengthen its policy team can be viewed as a proactive approach to navigating a period of regulatory ambiguity, rather than a reaction to a discrete, imminent rule change.
Implications for users, builders, and investors
For users and market participants, the regulatory landscape remains the most consequential variable. A more defined federal framework could reduce the risk of sudden platform shutdowns or wholesale policy reversals, while also imposing stricter compliance requirements. For builders and operators in the prediction-market space, Cutter’s appointment highlights the increasing professionalization of policy oversight and the growing importance of credible governmental liaison functions in a sector where public perception and political legitimacy matter as much as product design.
Investors and observers should weigh the potential upside of regulatory clarity against the risk that stricter rules could curb certain market types or restrict access to insider-sensitive information. The presence of political advisers on Kalshi’s team signals a belief that, even in a patchwork regulatory regime, a well-connected operator can navigate policy changes more smoothly and carve out a defensible niche with robust governance standards. As the debate over prediction markets continues, the key questions will be whether Congress and state authorities converge on guardrails that protect users without stifling innovation, and whether Kalshi’s ecosystem can demonstrate resilience through regulatory transitions.
What to watch next: the trajectory of state and federal actions on prediction markets, any new guardrails or prohibitions affecting political participation, and how Kalshi’s newly expanded policy function translates into concrete policy wins or clearer operational guidelines. The coming months will reveal whether this hiring signals a durable edge in policy access, or if the market must weather a more uncertain regulatory horizon before broader adoption can occur.

AI companies are building huge natural gas plants to power data centers. What could go wrong?

M61 employment park planned for green land

US Stock Market Closed Today April 3 2026 for Good Friday as Strong March Jobs Data Looms Over Iran War


-

 NewsBeat7 days ago
The Story hosts event on Durham’s historic registers
-

 NewsBeat1 day ago
Steven Gerrard disagrees with Gary Neville over ‘shock’ Chelsea and Arsenal claim | Football
-

 Sports7 days ago
Sweet Sixteen Game Thread: Tide vs Michigan
-
Entertainment4 days ago
Fans slam 'heartbreaking' Barbie Dream Fest convention debacle with 'cardboard cutout' experience
-

 Business20 hours ago
No Jackpot Winner and $194 Million Prize Rolls Over
-

 Crypto World2 days ago
Gold Price Prediction: Worst Month in 17 Years fo Save Haven Rock
-
 Entertainment6 days ago
Lana Del Rey Celebrates Her Husband’s 51st Birthday In New Post
-
Crypto World3 days ago
Dems press CFTC, ethics board on prediction-market insider trades
-

 Tech5 days ago
The Pixel 10a doesn’t have a camera bump, and it’s great
-

 Tech5 days ago
Avatar Legends: The Fighting Game comes out in July and it looks pretty slick
-

 Sports3 days ago
Tallest college basketball player ever, standing at 7-foot-9, entering transfer portal
-

 Tech3 days ago
EE TV is using AI to help you find something to watch
-

 Fashion6 days ago
Amazon Sundays: Soft Spring Layers
-

 Business2 days ago
Login and Checkout Issues Spark Merchant Frustration
-

 Tech5 days ago
Elon Musk’s last co-founder reportedly leaves xAI
-

 Fashion7 days ago
When Evening Dressing Gets Colorful for Spring
-

 Tech3 days ago
How to back up your iPhone & iPad to your Mac before something goes wrong
-

 Tech4 days ago
Apple will hide your email address from apps and websites, but not cops
-

 Politics4 days ago
Should Trump Be Scared Strait?
-

 Crypto World4 days ago
U.S. rule change may open trillions in 401(k) funds to crypto
You must be logged in to post a comment Login