

Crypto World
XRP price forms gartley pattern at $1.30: Bullish bottom?
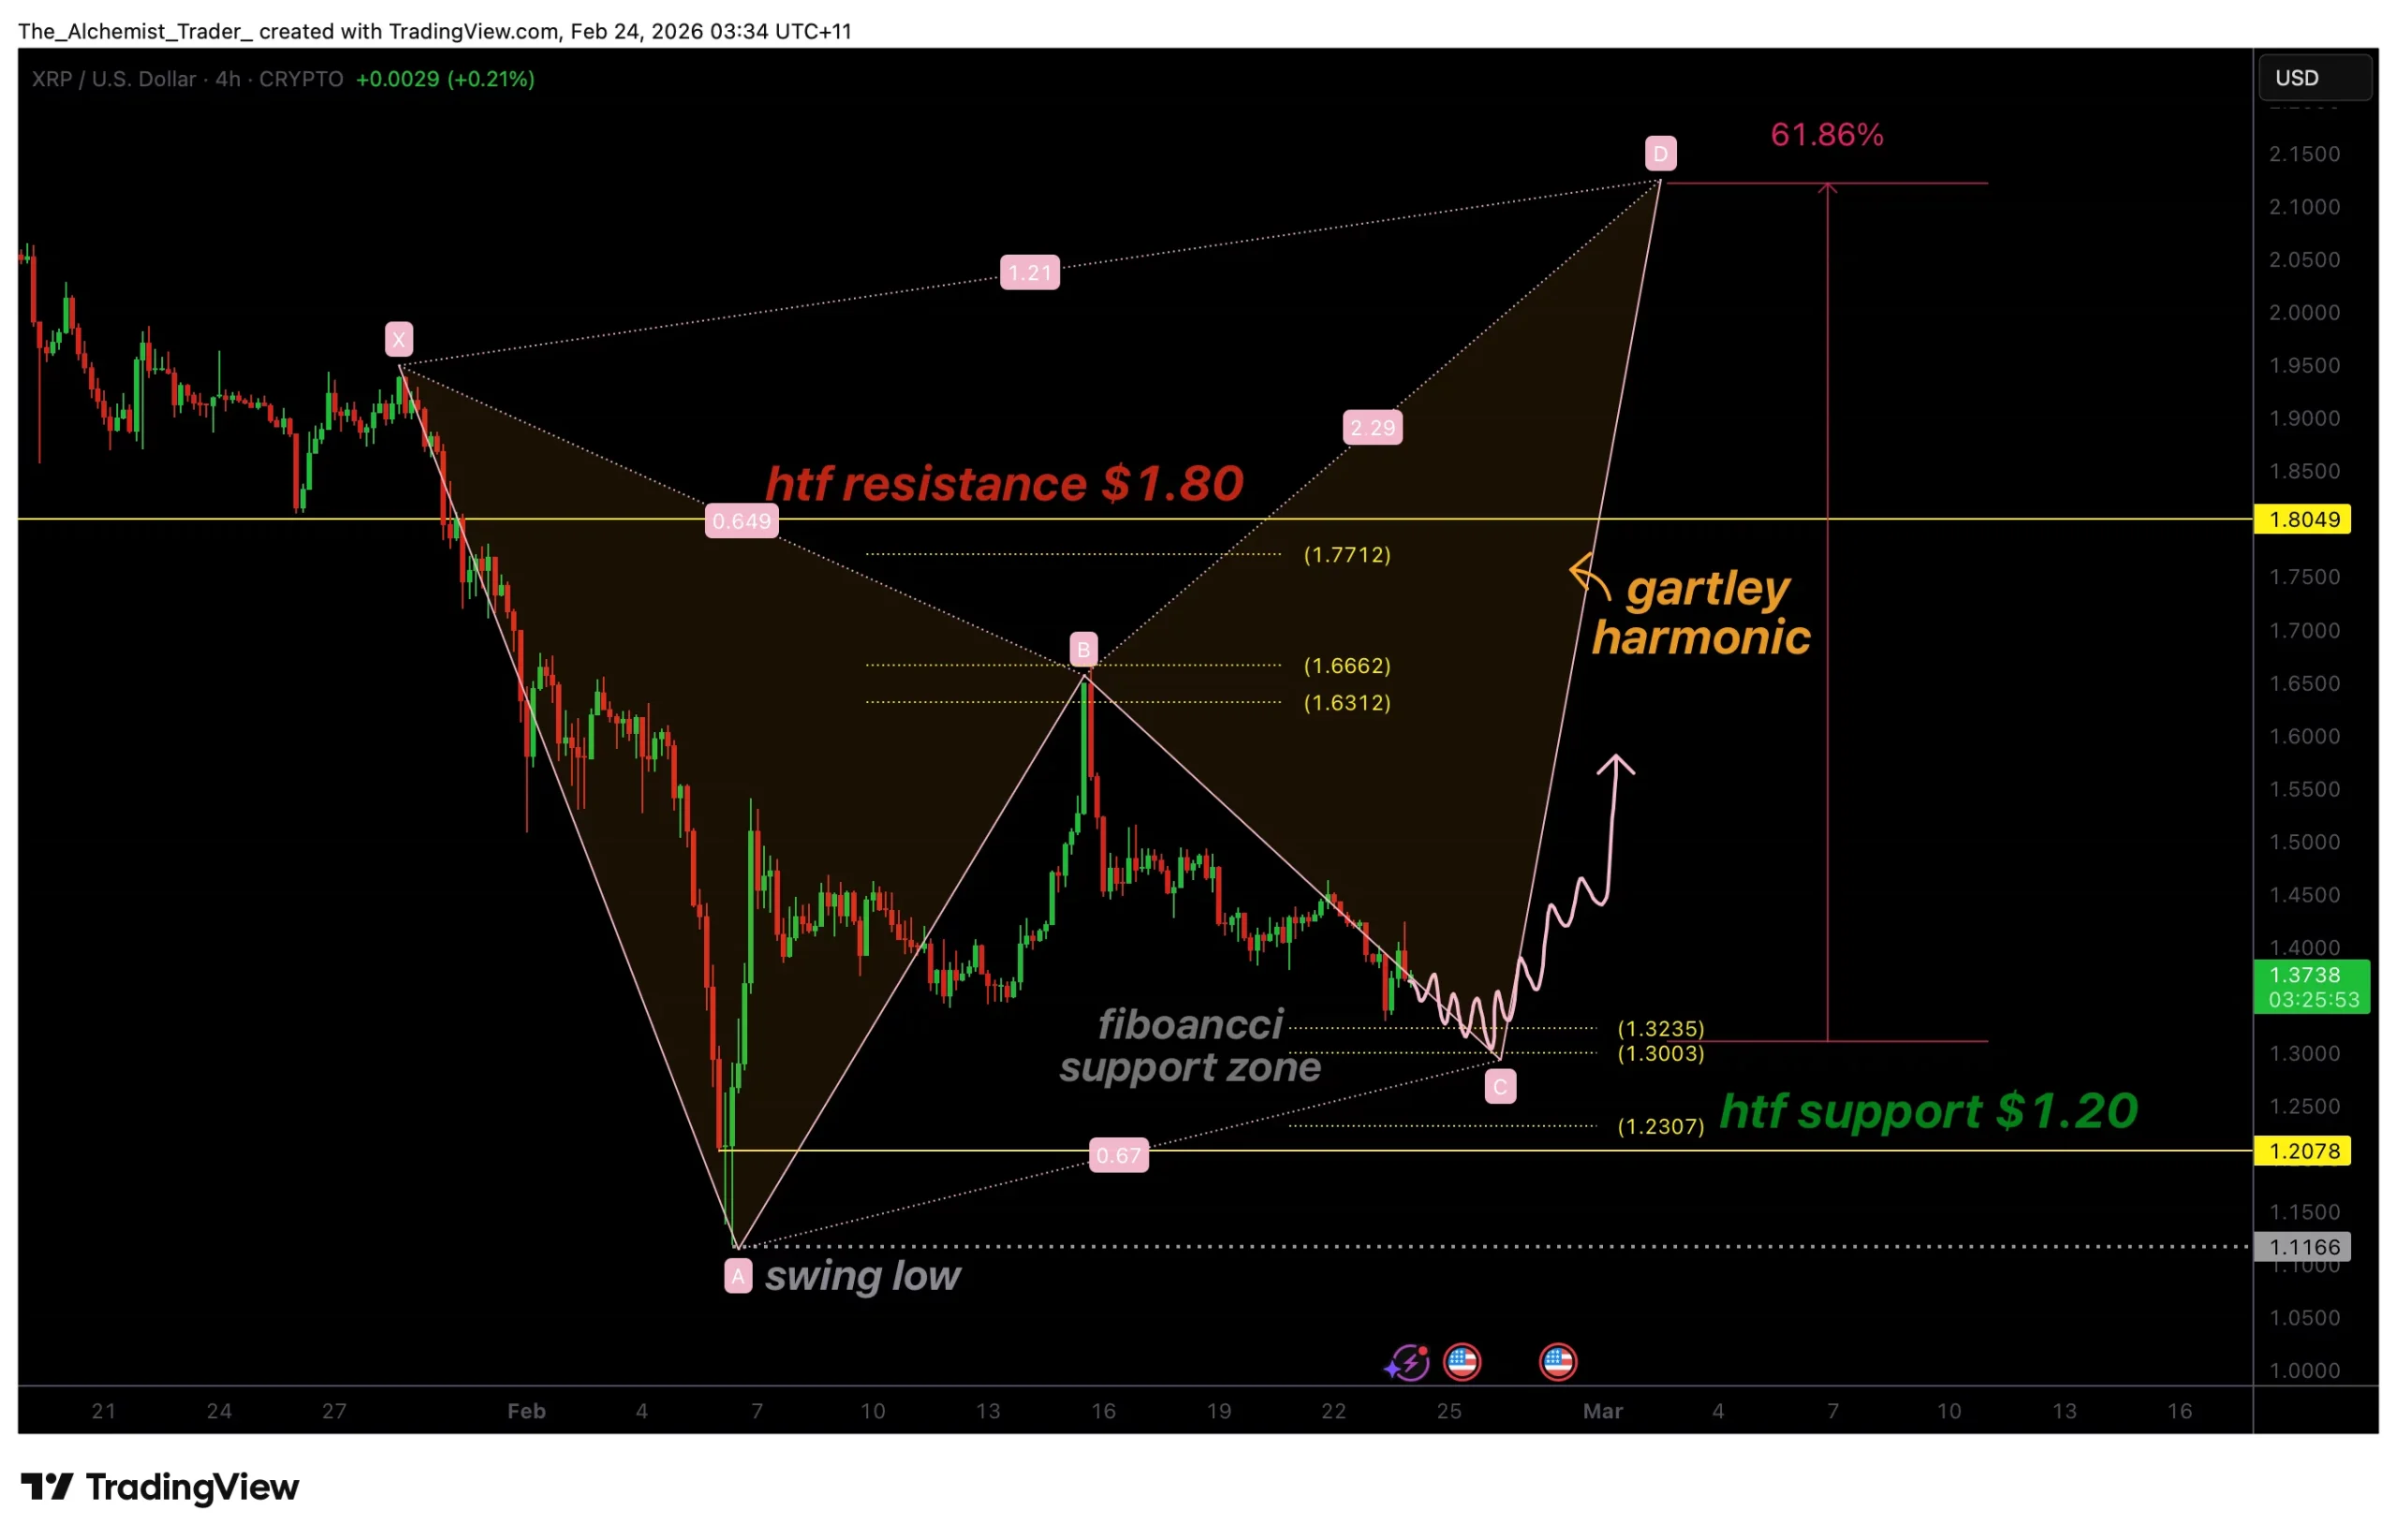
XRP price is forming a potential Gartley harmonic pattern near $1.30 support, signaling a possible bullish bottom as price rotates within a broader range.
Summary
- XRP developing Gartley harmonic pattern near $1.30 support
- Holding above $1.20 keeps bullish reversal structure valid
- Completion of leg D could trigger a strong upside rally
XRP (XRP) price action is beginning to show technical structure as a potential Gartley harmonic pattern develops near the $1.30 region. After weeks of rotational trading between high-timeframe resistance near $1.80 and strong support around $1.20, the market now appears to be transitioning into a pattern-driven consolidation phase that could precede a larger directional move.
Harmonic patterns, particularly the Gartley structure, rely heavily on Fibonacci relationships and precise price pivots. Recent XRP movements align closely with these technical requirements, with price rejecting key Fibonacci levels and forming recognizable swing structures. This evolving setup raises the question whether XRP is establishing a bullish bottom within its current range.
While confirmation is still required, the ongoing formation suggests a growing upside potential if support continues to hold.
XRP price key technical points
- Gartley pattern forming near $1.30: Fibonacci reactions are shaping harmonic structure development
- Range environment intact: XRP continues rotating between $1.80 resistance and $1.20 support
- Potential 60% upside projection: Completion of leg D could trigger a strong bullish rally
XRP has spent recent months trading within a well-defined range, oscillating between high-timeframe resistance at $1.80 and major structural support at $1.20. Rather than trending impulsively, price has displayed rotational behavior, a condition that often allows harmonic patterns to develop naturally.
The latest corrective move saw XRP reject the 0.618 Fibonacci retracement, an important technical reaction that supports the formation of a Gartley pattern. Price is currently trading below a local Fibonacci support zone, aligning with expectations for the ongoing development of the pattern’s internal legs.
In harmonic analysis, a Gartley pattern typically unfolds through multiple measured swings labeled X, A, B, C, and D. XRP appears to be progressing through the latter stages of this structure, with several clean pivots already established. These pivots reflect strong technical reactions at Fibonacci levels, reinforcing the validity of the developing setup.
Support defense critical for pattern validation
For the Gartley pattern to remain valid, XRP must continue to hold above the high-timeframe support near $1.20. This level represents a critical point of invalidation. Acceptance below it would weaken the harmonic structure and increase the probability of a deeper corrective move.
However, as long as price maintains support and reacts positively near the 0.618 Fibonacci region, the pattern continues to mature. The immediate focus shifts toward the completion of leg C, which typically precedes the impulsive move toward leg D, the final stage of the harmonic formation.
The significance of this stage lies in market psychology. Harmonic patterns often develop during periods of uncertainty, where both buyers and sellers test liquidity extremes before a clearer directional bias emerges. XRP’s repeated reactions at key Fibonacci zones suggest that market participants are actively responding to these technical levels.
Upside potential builds toward leg d completion
If XRP successfully completes leg C and establishes support in the current technical region, the probability increases for a bullish expansion toward the projected completion of leg D. Based on harmonic measurements, this move could represent a rally of approximately 60% from current price levels.
The projected upside aligns with higher resistance areas within the broader range structure, potentially revisiting zones closer to $1.80 and beyond. Importantly, this scenario does not require an immediate breakout but instead reflects a structured recovery within the existing market framework
Momentum confirmation will likely come through sustained higher lows, improved trading volume, and continued respect of Fibonacci retracement levels. These factors would signal that buyers are gaining confidence and positioning ahead of a larger move.
What to Expect in the Coming Price Action
From a technical, price-action, and market-structure perspective, XRP’s developing Gartley pattern suggests a bullish bottom may be forming near $1.30. As long as price remains above the $1.20 high-timeframe support and holds the 0.618 Fibonacci region, the probability favors completion of leg C followed by a rally toward leg D.


Bitcoin has faced a tougher trading stretch, dipping under 75,000 for 18 sessions and testing the market’s nerve as policy and macro signals diverge. The asset briefly retraced to around 64,200 after a broad stock retreat, while a decision by the Trump administration to raise baseline import tariffs to 15% added fresh uncertainty. Yet history cautions against assuming a permanent top when liquidity is in flux: Bitcoin has repeatedly outperformed other risk assets during stressed macro cycles, aided by persistent mining activity and a growing cohort of professional traders using volatility to adjust exposure. In this environment, Bitcoin remains a focal point for liquidity dynamics and institutional positioning, with fundamentals showing resilience even as headlines churn.
Key takeaways
- Historical data suggests Bitcoin often outperforms during trade wars and liquidity injections, even when macro fears are elevated.
- Mining activity has proven resilient, and a shift to net long positions on CME futures signals professional traders are adding exposure on dips.
- Policy shocks, such as tariffs implemented in early April 2025, coincide with sharp price moves—Bitcoin hit a five-month low near 74,600 before staging a subsequent rally.
- The U.S. Federal Reserve’s liquidity facilities have historically been a source of indirect support, with peak repo-like operations sometimes foreshadowing price rebounds in BTC.
- Hashrate recovery and profitable mining hardware at modest electricity costs have reduced tail risks from miner capitulations, helping sustain network fundamentals.
- Market positioning by large speculators flipped from net short to net long on BTC futures, a signal that has sometimes preceded major price bottoms.
Tickers mentioned: $BTC, $NVDA, $ORCL, $MARA, $CRWV
Sentiment: Bullish
Price impact: Positive. Dip-buying by institutions and improving mining fundamentals could support a move back toward key benchmarks.
Trading idea (Not Financial Advice): Hold. Given mixed macro cues, a cautious stance is warranted until price action and policy signals provide clearer direction.
Market context: Liquidity conditions and regulatory developments are shaping near-term outcomes, with network health and futures positioning acting as important indicators for BTC’s trajectory.
Why it matters
Bitcoin’s resilience amid policy jitters matters because it tests the narrative of crypto as a hedge in times of macro stress. When governments signal tighter control or aggressive tariff actions, liquidity dynamics often determine whether risk assets liquidate or rotate into alternatives with unique inflation-hedging characteristics. The fact that miners’ revenue streams have remained resilient, and that professional traders have shifted toward net long exposure on futures, adds a layer of credibility to the idea that BTC can stabilize and recover rather than cascade lower during periods of uncertainty.
Another dimension is the health of the mining sector. With 2024 and 2025 ASICs continuing to operate profitably at practical energy costs around $0.07 per kilowatt-hour, miners have less incentive to withdraw from the network even as AI-fueled tech equities face tighter funding. This reduces systemic risk linked to hash rate collapse and supports on-chain activity. The interplay between policy developments and the macro funding environment remains a central driver for BTC, and current data points suggest a favorable tilt for a potential retest of higher levels in the near term. For readers tracking the broader ecosystem, recent company dynamics—such as MARA’s stake in Exaion—underscore how mining-related investments are increasingly intertwining with data-center and AI-capital narratives.
In parallel, a shift in trader positioning has emerged as a recurring theme. A CFTC report published last week highlighted that large speculators on CME Bitcoin futures moved from a net short to a net long posture, a pattern that has, in past cycles, preceded sizeable price bottoms. While no single indicator confirms a bottom, the combination of improving miner fundamentals, a potential stabilization of liquidity metrics, and a cautious, yet constructive, positioning backdrop can augur a more constructive tone for the BTC market in the weeks ahead. The price action already reflected a bounce from the mid-60ks toward the 75k area in the near term, and market participants will be watching how this dynamic interacts with ongoing macro developments and policy updates.
What to watch next
- The latest CME Bitcoin futures positioning data from the CFTC showing net long shifts among large speculators.
- Hashrate and miner profitability trends, especially at around $0.07/kWh energy costs.
- Policy developments—new tariffs or liquidity actions—that could impact risk sentiment.
- Upcoming earnings or funding moves in the AI hardware and data-center space, including Nvidia results.
- Price action around the $75,000 level and whether BTC tests this midpoint in the coming weeks.
Sources & verification
- Executive orders on reciprocal tariffs issued in early April 2025 and subsequent tariff actions affecting major trading partners.
- CFTC report detailing the shift from net short to net long on CME Bitcoin futures.
- HashRateIndex data on miner gross profits at a power cost of $0.07/kWh.
- Bitcoin’s price responses during the 2020 COVID-19 crash and subsequent multi-month rally to the $42,000 level.
- Industry reference to MARA’s stake in Exaion and the broader mining sector’s status.
Bitcoin resilience amid policy jitters and miners’ rebound
Bitcoin (CRYPTO: BTC) has weathered a fresh bout of volatility as traders reassess risk in a climate of heightened policy scrutiny. After drifting below the psychological 75,000 mark for 18 sessions, the digital asset touched a low near 64,200 as global equities pulled back. The catalyst was a wave of tariff actions announced in early April 2025, including reciprocal duties across many trading partners and a 34% levy targeting China by April 9. The immediate backdrop was, in many ways, a reminder of how macro policy can ripple through risk assets even asBitcoin continues to attract a dedicated pool of long-term holders and enthusiasts. Yet the price reaction also underscored a familiar pattern: when liquidity conditions tighten, BTC often behaves unlike traditional equities, with the potential for outsized rebounds when sentiment stabilizes.
From a structural perspective, Bitcoin’s network has shown considerable resilience. The mining sector—with ASICs deployed in 2024 and 2025—has remained profitable at modest energy costs, reducing the risk of mass capitulations that could threaten hash rate. The observable improvement in the hashrate relative to earlier delays helped counter fears of a miner “death spiral” and supported on-chain activity. This improvement matters more than flat price moves because a robust hash rate underpins transaction throughput and security, which in turn sustains confidence among holders and developers alike. For investors following the mining landscape, the narrative has shifted from existential risk to a more nuanced assessment of profitability and supply dynamics, with miners continuing to contribute to BTC’s forward resilience.
The macro narrative around policy and liquidity remains a central force. The U.S. Federal Reserve’s liquidity facilities—lending against Treasuries to smooth funding markets—have historically influenced risk appetite, even if not always framed as direct injections. In past episodes, peaks in such operations have often coincided with safer moments for risk assets, including BTC, as market participants anticipate a policy environment that will eventually stabilize. In the current cycle, traders are poring over data on repo-like operations and balance-sheet conditions to gauge whether a more accommodative liquidity backdrop could re-emerge, providing a tailwind for BTC in the weeks ahead. The discussion around liquidity is complemented by linked policy moves, such as the tariff actions described above, which can amplify risk-off or risk-on impulses depending on how the broader economy absorbs the shocks and whether policymakers offer mitigants or liquidity backstops.
Adding another layer to the story, institutional players have started to reallocate exposure during pullbacks. A recent analysis noted that professional traders used the dip to add Bitcoin exposure, with long positions on CME futures expanding at a pace that historically signals a renewed appetite for BTC among sophisticated funds. That shift aligns with the broader narrative of a maturing market where liquidity, hedging demand, and macro risk sentiment converge to form potential baselines for a recovery. In parallel, the data points cited in industry commentary—such as MARA’s stake in Exaion—highlight how capital moves within the mining and AI infrastructure ecosystem can influence both sentiment and the capital flows into related hardware and data-center ventures. For traders and observers, this confluence of mining fundamentals, futures positioning, and policy dynamics provides a clearer, albeit still uncertain, path toward higher levels if the catalysts align.
Looking ahead, the near-term trajectory will likely hinge on how quickly the macro environment absorbs tariff signals, how the liquidity backdrop evolves, and whether Bitcoin can sustain a momentum lead beyond the 75,000 threshold. The market has shown a capacity to rally after drawdowns tied to policy shocks, as evidenced by the 38% rebound observed in the month following the initial low. If this dynamic persists, BTC could carve a path back toward the mid- to upper-70s in the coming weeks, aided by a combination of supportive hashrate trends, a possible shift in futures positioning, and any signs that macro liquidity will re-enter the system with a clear framework. In the meantime, investors will be watching for more granular signals—from CME futures data to mining profitability metrics—that can help distinguish a temporary bounce from the beginning of a sustained upcycle.
Spot Bitcoin exchange-traded funds (ETFs) are on track to post a fourth consecutive month of net outflows as Bitcoin (BTC) approaches a fifth negative monthly close in February. The slowdown is visible across the shrinking fund balances and the bearish rolling net flow data, especially when measured against competing asset ETFs.
With Bitcoin price and the spot ETF holdings trending lower since October, investors are searching for answers on what the future may hold for BTC.
Bitcoin ETFs dominate headlines
Net assets held in US spot Bitcoin ETFs peaked near $170 billion in October 2025 and now stand at $84.3 billion. The cumulative net inflows have fallen to roughly $54 billion from the $63 billion all-time high. Since July 2025, cumulative net flows have totaled just $5 billion, underscoring the sharp drop in capital inflows.
Bitcoin researcher Axel Adler Jr. tracked seven sessions between Feb. 12 and Feb. 19 and found the net ETF outflows totaled 11,042 BTC. Feb. 12 marked the largest single-day reduction at 6,120 BTC, or about $416 million. The Feb. 17 and Feb. 18 sessions saw back-to-back outflows of 1,520 and 1,980 BTC, respectively. Only two sessions were positive, with the Feb. 6 session adding 5,900 BTC to the funds.

Adler said that three consecutive positive sessions are needed to confirm renewed accumulation in the ETFs. Until then, the flows continue to act as a source of supply for the market.
The macroeconomic data align with the cooling trend. The ETFs have shed about 87,000 BTC since November 2025, including roughly 15,000 BTC in February. The total ETF balances now sit near 1.26 million BTC, down from the 1.36 million BTC peak.

The selling pressure from the largest BTC funds has been measured. BlackRock’s IBIT holdings declined to 759,000 BTC from 806,000 BTC, a 6% reduction. Fidelity’s FBTC dropped to 186,000 BTC from 213,000 BTC, a 12.6% decline.
Bitcoin price has fallen far more sharply than the ETF balances, while the spot market demand has appeared insufficient to fully absorb the broader market pressure.
Gold steals the spotlight from the BTC ETFs
Over the past two years, the Bitcoin and gold ETFs have rotated leadership based on the 90-day rolling flows. The Bitcoin 90-day inflows peaked near $16 billion in March 2024, cooled to $3 to $4 billion between June and October, and then surged to $21.6 billion in December 2024.

The gold ETFs took a different route. The flows stayed negative until July 2024, then accelerated to $30 billion by April 2025. During March and April 2025, the Bitcoin 90-day flows slipped to negative $2 billion.
Gold peaked again at $36 billion in October 2025, while the Bitcoin inflows faded into the final quarter. In January 2026, the gold flows reached $29 billion before easing to $21 billion by mid-February as Bitcoin flows remained in negative territory.
The data show a repeated handoff between the two assets. The periods of weakening Bitcoin ETF demand aligned with the surges in gold inflows, particularly between March and October 2025.
In relative terms, the gold ETFs captured incremental capital as investors leaned toward the asset with smaller price swings and the longer track record during risk-off phases.
Related: Bitcoin ETFs shed $166M as BTC heads for worst start in years
“Restrictive digestion” hits the Bitcoin demand
ITC Crypto founder Benjamin Cowen classifies the first quarter of 2026 as a “late-cycle restrictive digestion” phase for the equities and the crypto markets.
The US Federal Reserve ended quantitative tightening in December 2025, halting the balance sheet runoff, but the monetary policy remains restrictive relative to the market growth expectations. The federal funds rate still sits above the 2-year Treasury yield, while the 10-year yield trades near 4.1% and the 10-year real yield holds around 1.7%–1.8%, keeping the financial conditions tight.
The positive real yields mean investors can earn inflation-adjusted returns in the fixed income markets, raising the opportunity cost of holding non-yielding assets such as Bitcoin.

Cowen noted that in the prior tightening cycles, Bitcoin price weakened before equities showed stress. In 2019, BTC price rolled over months ahead of the broader weakness in equities.
Historically, the durable ETF inflows have followed the falling real yields or a clear easing cycle. Neither condition has developed yet, which may explain the slowdown in demand for Bitcoin ETFs since October 2025.
Related: Bitcoin ignores US Supreme Court Trump tariff strike amid talk of $150B refund
This article does not contain investment advice or recommendations. Every investment and trading move involves risk, and readers should conduct their own research when making a decision. While we strive to provide accurate and timely information, Cointelegraph does not guarantee the accuracy, completeness, or reliability of any information in this article. This article may contain forward-looking statements that are subject to risks and uncertainties. Cointelegraph will not be liable for any loss or damage arising from your reliance on this information.

Disclosure: The views and opinions expressed here belong solely to the author and do not represent the views and opinions of crypto.news’ editorial.
If institutional activity feels like it has quietened down in the current crypto market, that’s a signal, not a red flag. The period of headline-driven adoption, such as overly hyped announcements, symbolic pilot programs, and flashy token allocations designed more for marketing rather than exposure, is slowly winding down.
Summary
- Less noise, more capital discipline: Institutional crypto hasn’t slowed — it’s matured. The hype cycle is fading, replaced by strategic, long-term allocation.
- From validation to integration: Institutions are no longer asking if crypto belongs. They’re deciding how it fits — with custody, governance, and compliance now foundational.
- Regulation as an adoption engine: Clear frameworks in regions like the UAE and beyond are turning crypto from a narrative trade into permanent financial infrastructure.
What’s replacing it is far more meaningful and mature, and crypto is being absorbed into institutional finance as a system, rather than a spectacle. Serious capital has not left the market. What has changed is the communication strategy: fewer forward-looking vague announcements without execution, and a greater focus on actions that speak for themselves. It was only recently that the world’s largest asset manager, BlackRock, announced its first play with decentralized finance by listing its tokenized Treasury fund on Uniswap.
Public companies ramping up Bitcoin and Ethereum stack
In previous crypto cycles, institutional engagement was often loud by necessity. Crypto needed validation. Firms wanted to show they were “early,” innovative, or at least paying attention.
Allocations were framed as bold bets rather than portfolio decisions. Even modest exposure was marketed as a philosophical stance. The proof is in the pudding when you look at public companies stacking Bitcoin and Ether for their treasuries. More than 1.1 million Bitcoin (BTC) have now been scooped up, worth just under $77 billion. At the same time, public firms hold roughly 6.17 million Ethereum (ETH), valued at around $12.35 billion.
That phase served a purpose. But it was never going to be permanent. Today’s institutional crypto looks different because it is different. It’s no longer about proving crypto deserves a seat at the table. It’s about deciding where it sits.
Capital continues to flow, but increasingly through private structures, regulated platforms, and long-term strategies that are not designed for headlines. The absence of noise doesn’t reflect uncertainty. It reflects confidence.
One of the strongest signals of this shift is the rapid professionalisation of the market. Institutions are no longer asking whether crypto “works.” They’re refining how to hold it, secure it, and integrate it responsibly into existing investment frameworks. That vision may have passed the point of no return.
Institutional crypto is here to stay
Big four accounting firm PricewaterhouseCoopers said in a recent report that institutional interest in crypto has “crossed the point of reversibility.” Custody is no longer an afterthought. Neither is governance. Risk management, asset segregation, internal controls, auditability, and compliance are now foundational layers, and crypto infrastructure has evolved rapidly to meet those demands.
That evolution is deeply bullish. The more crypto conforms to institutional standards without losing its core advantages, portability, transparency, and settlement efficiency, the more capital it can absorb. What once lived on the margins as a specialist trade is steadily becoming a normalised asset class. This is also where a critical distinction has emerged: speculation versus investment.
Institutions no longer need to engage with crypto as a narrative trade, driven by cycles, sentiment, or social media momentum. Instead, they’re increasingly treating it as a strategic allocation, one that behaves differently from traditional assets, but still earns its place through risk-adjusted performance.
That move alone changes everything. When Bitcoin or crypto assets are evaluated alongside equities, commodities, and fixed income, rather than against hype expectations, they stop being experimental.
They become addictive. Even small, disciplined allocations can matter materially over long horizons, especially in a world where portfolio diversification is harder, not easier. The UAE offers a clear case study of how this plays out in practice. Far from chasing attention, the region has built one of the most institutionally coherent crypto frameworks globally. Licensing regimes are clear. Regulatory expectations are defined. Custody and market infrastructure have been treated as prerequisites, not afterthoughts.
This clarity has created a gravitational pull for serious participants. For firms operating in the region, including platforms like MidChains, the value isn’t just regulatory approval. It’s the ability to serve institutions that are ready to engage at scale, with confidence, and without uncertainty hanging over every allocation decision. That matters more than hype ever could.
Globally, regulation is playing a similarly constructive role. While often framed as a constraint, regulation is increasingly acting as an adoption engine. Clear rules allow institutions to move from “can we?” to “how do we?”
Crypto needs defined lanes to thrive
Crypto doesn’t need regulatory ambiguity to thrive. It needs defined lanes. As those frameworks solidify, engagement becomes less theatrical and more durable. Institutions don’t announce every bond purchase or FX hedge. Crypto is moving toward that same operational normalcy, and that’s a sign of success, not stagnation.
The future of institutional crypto won’t be shaped by dramatic announcements or sudden waves of capital. It will be built through infrastructure, liquidity depth, and integration into the financial system’s core rails.
And when that happens, the impact will be far larger than any headline cycle. Quiet accumulation, disciplined exposure, and institutional-grade infrastructure aren’t signs that crypto’s moment has passed. There are signs that crypto is becoming permanent. Institutional crypto isn’t stepping back. It’s just getting started.


Crypto.com said it received conditional approval from the U.S. Office of the Comptroller of the Currency (OCC) to establish a national trust bank, setting the stage for the exchange to expand its custody services under federal oversight.
The planned Foris Dax National Trust Bank, doing business as Crypto.com National Trust Bank, would operate as a limited-purpose national trust bank. It would not accept deposits or issue loans, instead offering services such as custody, staking and trade settlement for digital assets, including those on its in-house Cronos blockchain.
While Crypto.com already runs a qualified custodian, Crypto.com Custody Trust Co., regulated by New Hampshire’s banking department, the OCC charter brings its institutional offerings under a single federal framework.
That matters for issuers of exchange-traded funds (ETFs), asset managers and other institutional clients, who often prefer custodians with national oversight, which can streamline compliance and operational processes.
The national charter offers that one-stop-shop structure, though only for trust services, not for traditional banking.
Crypto.com filed its application with the OCC in October. While conditional approval is not final, it marks a significant step forward. Last week, Striple’s stablecoin firm Bridge won initial approval to form a national trust bank as well.
These approvals see the firms join a growing group of crypto firms looking to build within a federal framework. In December BitGo, Circle, Ripple, Paxos, and Fidelity Digital Assets all received similar conditional approvals.

TLDR
- Solana Company has started building a high-speed infrastructure network across the Asia Pacific region.
- The Pacific Backbone will connect Seoul, Tokyo, Singapore, and Hong Kong with low-latency systems.
- The network will support Solana staking validation and trading services for institutional clients.
- HSDT holds about 2.3 million SOL in its corporate treasury.
- The company plans to launch DeFi tools, liquid staking, and execution services within 18 months.
Solana Company has begun constructing a high-speed infrastructure network across the Asia-Pacific. The project aims to strengthen Solana staking, validation, and trading services. Executives say the buildout prepares SOL for its next “super cycle.”
Pacific Backbone Connects Key Asian Financial Hubs
The initiative, called Pacific Backbone, links Seoul, Tokyo, Singapore, and Hong Kong. It will operate a low-latency cluster for institutional users.
The company said it will start construction immediately. It expects optimization and product launches within 18 months.
Planned services include DeFi tools, liquid staking, and automated market makers. The firm will also provide execution services for finance partners.
Joseph Chee said the expansion prepares Solana for future growth. He described the plan as positioning for the next super cycle.
The network targets market makers and high-frequency trading firms. It seeks to cut latency and reduce reliance on outside providers.
Solana processes over 3,500 transactions per second. The blockchain supports millions of daily active wallets.
HSDT Expands Treasury Strategy and Regional Operations
HSDT trades on Nasdaq and backs the infrastructure push. Pantera Capital and Summer Capital co-led its $500 million funding round.
Cosmo Jiang said the roadmap will improve regional staking performance. He added it should diversify revenue across Asia.
Solana Company holds about 2.3 million SOL in treasury. The stake is worth more than $180 million at current prices.
The firm partnered with Anchorage Digital and Kamino on a lending venture. The venture lets institutions borrow against natively staked SOL.
Public companies have maintained steady SOL staking levels. Data shows treasury valuations have fallen to record lows.
HSDT shares fell over 8% in Monday trading. The stock has dropped more than 90% since September.
The buildout focuses on compliant infrastructure for regulated Asian markets with strict standards. Engineers will deploy state-of-the-art hardware across each data center location in the region.
The cluster will support validators, staking pools, and trading desks across major hubs. Management said the network will capture more stakeholder value internally for the company.
The company continues operating its neurotech and medical device units alongside blockchain initiatives. It rebranded from Helius Medical Technologies in September to pursue a Solana strategy.
Shares traded at $1.76 during the latest session on the Nasdaq exchange. Other crypto stocks also posted losses on Monday during early market hours.
Solana declined nearly 6% during the past 24 hours. Bitcoin also fell more than 4% over the same period.


TLDR
- Strategy completed its 100th Bitcoin purchase with a 592 BTC acquisition worth about $39.8 million.
- The company increased its total Bitcoin holdings to 717,722 BTC after the latest buy.
- Strategy funded the purchase through the market sales of its Class A common stock.
- The firm reported an average purchase price of $67,286 per Bitcoin for the latest tranche.
- MSTR stock traded lower in pre-market hours following the SEC filing disclosure.
Strategy confirmed its 100th Bitcoin acquisition in a new SEC filing on February 23, 2026. The company purchased 592 Bitcoin for about $39.8 million between February 17 and February 22. The disclosure arrives as MSTR stock trades lower and Bitcoin hovers near $66,000.
Strategy Expands Bitcoin Holdings With 592 BTC Purchase
Strategy reported that it paid an average of $67,286 per Bitcoin, including fees and expenses. The purchase increased total holdings to 717,722 Bitcoin.
The company funded the acquisition through at-the-market sales of Class A common stock. During the same week, it sold 297,940 shares for about $39.7 million and used the proceeds for the purchase.
Strategy stated that about $7.8 billion in shares remain available under the program. The company has used this mechanism for prior Bitcoin purchases.
One week earlier, Strategy disclosed the purchase of 2,486 Bitcoin for about $168 million. That transaction carried an average price of $67,710 per coin.
With the latest addition, Strategy reported total acquisition costs of about $54.56 billion. The company’s average purchase price across all holdings stands at $76,020 per Bitcoin.
At market prices near $66,000, the position reflects an unrealized loss based on reported averages. The gap equals roughly $10,000 per coin, or about $7 billion overall.
Michael Saylor, co-founder and executive chairman, previewed the milestone on social media. He wrote “The Orange Century” before the company released the filing.
Strategy began accumulating Bitcoin in August 2020 and has reported each transaction. The filings list purchase dates, amounts, and average prices.
MSTR Stock Reaction and Market Context
MSTR stock traded lower in pre-market hours following the disclosure. Shares have declined more than 50% year over year.
Bitcoin fell below $65,000 before recovering toward $66,000. The drop triggered over $360 million in leveraged liquidations across crypto markets.
Strategy stated that its holdings represent more than 3.4% of Bitcoin’s 21 million supply cap. The concentration places the company among the largest corporate holders.
Industry data lists 193 public companies that hold Bitcoin on their balance sheets. The group includes miners, exchanges, and firms with treasury allocation programs.
Saylor recently described the current phase as a “crypto winter.” He said it appears milder than prior cycles and may prove shorter.


The seemingly daily disruption of business models by advances in artificial intelligence continued Monday, sending stock market averages and crypto prices sharply lower.
Today’s victim (in addition to the usual ones) was IBM, after Anthropic said Claude code can automate COBOL modernization.
“COBOL [Common Business-Oriented Language] is everywhere,” said Anthropic. “It handles an estimated 95% of ATM transactions in the U.S.. Hundreds of billions of lines of COBOL run in production every day, powering critical systems in finance, airlines, and government.”
“The developers who built these systems retired years ago, and the institutional knowledge they carried left with them,” the company continued. “We aren’t exactly minting replacements—COBOL is taught at only a handful of universities, and finding engineers who can read it gets harder every quarter.”
“Modernizing a COBOL system once required armies of consultants spending years mapping workflows,” Anthropic continued. “Tools like Claude Code can automate the exploration and analysis phases that consume most of the effort in COBOL modernization.”
Think of “armies of consultants” as IBM, and the stock’s reaction is understandable. A bit less than an hour before the close, IBM was lower by 11.2%.
IBM’s decline, along with what’s now becoming regular AI-related tumbles in the overall software sector and private equity, has helped pull the Dow, S&P 500 and Nasdaq all lower by more than 1%.
“It’s becoming increasingly clear how pivotal the times we are in right now truly are,” wrote The Kobeissi Letter.
Tied at the hip in recent months to moves in software, crypto prices were under extreme pressure Monday, with many majors now within range of retouching their lows from the Feb. 5 panic.
Bitcoin was lower by 5% over the past 24 hours to $64,000, with ether (ETH) and solana (SOL) down similarly.
Coinbase (COIN), Strategy (MSTR), Circle (CRCL) and Galaxy Digital (GLXY) were all down 4%-7%.
The only names in the green were those bitcoin miners now running AI infrastructure business models, with IREN (IREN) ahead 5%, Cipher Mining (CIFR) up 3.4%, CleanSpark (CLSK) up 1.5%, and Hut 8 (HUT) gaining 0.7%.
Also moving higher on Monday were precious metals — gold gaining 3.2% to $5,243 per ounce and silver higher by 6.5% to $87.69.

Bitcoin (CRYPTO: BTC) closed a weekly candle below its 200-week exponential moving average for the first time since October 2023, ending an 882-day uptrend. The break redraws the deck for long-term traders, shifting attention to on-chain cost bases and how Bitcoin has historically interacted with this guardrail during prior cycles. The move underscores the risk of a longer, more drawn-out recovery, even as market focus rests on the asset’s price behavior around key macro and on-chain metrics.
Key takeaways
- Bitcoin closed below the 200-week EMA near $67,628, snapping an extensive uptrend that had persisted since late 2023 and signaling a potential shift in the long-run trend line.
- Historical recoveries back above the 200-week EMA varied in duration: roughly 14 weeks in 2018, about eight weeks after the Covid liquidity shock in March 2020, and nearly 30 weeks in 2022; the average spell below the EMA has hovered around 17–18 weeks.
- On-chain momentum has cooled. Liveliness, the metric that compares coin days destroyed to coin days created, has declined below its 30-day and 90-day moving averages, suggesting reduced spending activity and slowed capital rotation.
- The realized price band around $55,000 remains a central reference, with the shifted realization near $42,000 projecting the metric forward and highlighting deeper demand zones during drawdowns.
- A reclaim of the 200-week EMA would reestablish the long-term trend above a critical threshold; failure to reclaim keeps the focus on the $55,000 realized price and the lower band near $42,000 as potential liquidity zones.
Tickers mentioned: $BTC
Market context: The move comes amid a broader environment where on-chain indicators and macro liquidity shape risk sentiment. Traders are watching whether Bitcoin can stabilize near long-term anchors while macro noise—ranging from regulatory signals to liquidity cycles—adds a layer of caution to the next leg of any potential rally.
Why it matters
The weekly break below the 200-week EMA is not a call to panic; rather, it reframes the path of the next recovery. The 200-week EMA has functioned as a long-run dividing line between expansion and deeper correction. When price has dipped beneath it in past cycles, the duration before reclaiming the line varied, but the pattern often culminated in a prolonged accumulation phase rather than an immediate, V-shaped bounce. The current scenario awaits a similar test of resilience, with market participants evaluating whether history will repeat or diverge in a markedly different macro environment.
On-chain activity adds another layer to the interpretation. Liveliness, which measures the balance of coin days created versus destroyed after adjusting for internal transfers, has cooled from its earlier peak. A decline here points to a slowdown in active spending and a shift in capital rotation—factors that can slow the speed at which Bitcoin reclaims macro-level supports. The reading echoes past cycles where similar rollovers preceded extended periods of accumulation, a signal that investors may need to weather a more drawn-out corrective phase before new highs emerge.
Meanwhile, the realized price bands—around $55,000—and the shifted realized price near $42,000 provide a framework for identifying demand zones. These levels have historically delineated the major caches of value during drawdowns and have served as anchors for long-term investors seeking to accumulate on-chain cost bases. The convergence of price with these bands, especially while hovering between the 200-week EMA and the realized price cluster, has during prior cycles signaled a protracted period of consolidation before a renewed uptrend.
There is a broader ecosystem thread to track as well. A referenced analysis suggests that if Bitcoin can reclaim the 200-week EMA, the path toward reestablishing a long-term uptrend remains intact, with the threshold serving as a barometer for macro confidence. Conversely, failing to recapture the EMA keeps the focus on the $55k realized price and the lower $42k band, where liquidity concentration could come into play and influence the next move. The dynamic between these levels will likely shape market expectations for the next several months.
In the narrative of market storytelling, observers may recall related discussions around Bitcoin’s troughs and rallies. For instance, a separate analysis explored signals from Tether that some see as potential hints of a bottom or a prelude to a larger rally. While not deterministic, such signals contribute to the mosaic of factors traders weigh when assessing the durability of any price move and the potential for renewed demand as the market digests both on-chain and macro inputs.
What to watch next
- Watch for a weekly close back above the 200-week EMA (around $67,600) to signal a potential reversion of this test and the resilience of long-term support.
- Monitor shifts in on-chain liveliness: a sustained move above the key moving averages could indicate renewed activity and capital rotation supporting a longer-term revival.
- Track the realized price zone around $55,000 and the lower band near $42,000 for any congestion or liquidity concentration that could influence the next leg of the cycle.
- Observe potential catalysts—whether macro liquidity conditions soften, or on-chain fundamentals return to a more active phase—that could accelerate re-entry into the longer-term uptrend.
- Keep an eye on related market signals and sentiment indicators, including the behavior of other assets and ETF-related flows that may impact Bitcoin’s risk appetite in coming months.
Sources & verification
- Bitcoin price behavior around the 200-week EMA and corresponding price levels cited in the summary analysis.
- On-chain liveliness metrics and their interpretation in relation to price cycles, as discussed by market observers.
- Public posts and analyses referencing the 200-week EMA as a guide to long-term trend dynamics, including remarks by market commentators on potential resistance if the EMA loses its role as support.
- Realized price data and related interpretations of demand zones and liquidity bands used to frame the current accumulation context.
- Related discussions exploring signals such as those around Tether and Bitcoin bottom signals, which provide context for broader market narrative dynamics.
Bitcoin’s long-term trend in focus
Bitcoin’s recent weekly close beneath the 200-week EMA has nudged the market into a phase where long-horizon considerations gain prominence. The line, which traders monitor as an indicator of secular momentum, has historically separated periods of expansion from deeper contractions. The current reading does not automatically imply a new bear market; instead, it emphasizes the need for patience as the market tests whether prevailing on-chain and macro conditions can sustain a move back above the trend line.
From a broader perspective, the real guiding question is the durability of demand zones around the realized price bands. If that demand proves resilient and buying interest returns with conviction, a re-acceleration could unfold, with the 200-week EMA reclaim acting as a catalyst. If not, investors may expect a more protracted period of consolidation, during which accumulation phases could stretch across multiple quarters as market players calibrate entries and risk exposure in light of evolving liquidity conditions.
The central takeaway remains: the interaction between price, on-chain activity, and long-term trend markers will continue to shape Bitcoin’s trajectory. While a single weekly candle below a key moving average does not doom the market, it does reset the frame for what comes next, demanding disciplined risk assessment and a keen eye on the dynamics of demand, liquidity, and macro sentiment that drive the space.
Crypto World
IoTeX bridge exploit raises debate over losses and recovery prospects as CEO offers 10% bounty


IoTeX offered a 10% white-hat bounty to the hacker or hackers who exploited a private key on its cross-chain bridge ioTube, siphoning millions of dollars, in exchange for the voluntary return of funds within 48 hours.
With this move, IoTeX is offering the $440,000 if the malicious actor or actors return roughly $4.4 million they stole, according to an IoTeX X post, to which IoTeX co-founder and CEO Raullen Chai pointed “as a source of truth” on Monday.
Chai told CoinDesk that the team sent an onchain message offering not to pursue legal action or share identifying information with law enforcement if the remaining funds are returned.
“This is regarding the ioTube bridge exploit on Feb. 21, 2026,” Chai said in the message. “All fund movements across Ethereum, IoTeX, and bitcoin have been fully traced.”
The message states that exchange deposits have been flagged and frozen and offers a 10% bounty for the return of remaining funds.
Chai also said IoTeX is rolling out a new chain version, Mainnet v2.3.4, requiring node operators to upgrade. The update includes a default blacklist of malicious externally owned account (EOA) addresses.
“This blacklist contains a list of malicious or problematic EOA addresses that will be filtered by the node,” Chai said.
The offer comes after a Feb. 21 exploit in which a compromised validator owner private key enabled unauthorized control over ioTube’s bridge contracts.
IoTeX said the incident is “under control,” saying that its Layer 1 blockchain was not affected and that the breach was isolated to the Ethereum-side infrastructure of the bridge.
The IOTX token fell roughly 22% following the exploit, dropping from $0.0054 to below $0.0042 before partially rebounding.
Cross-chain bridges have been one of crypto’s main failure points, with several high-profile exploits in recent years. According to industry reports, more than $3.2 billion has been lost due to cross-chain bridge hacks, making them a prime target for advanced threat actors.
Responsibility and key control
IoTeX framed the exploit as an operational issue specific to the bridge rather than a failure of its Layer 1 network.
“IoTube is IoTeX’s own cross-chain bridge built and maintained by their team,” Nick Motz, CEO of ORQO Group and CIO of Soil, told CoinDesk. “The breach came down to a compromised validator owner private key on the Ethereum side, which is fundamentally an operational security failure, not a smart contract vulnerability discovered by an outside actor.”
Motz agreed that IoTeX’s Layer 1 was not compromised but said user funds were entrusted specifically to the bridge.
“When you build and operate the bridge infrastructure and the key management is what fails, it’s difficult to separate yourself from that outcome,” he said.
Nanak Nihal Khalsa, co-founder of human.tech, said responsibility in crypto often comes down to key custody.
“Yes, whoever holds the private key is responsible for securing it,” Khalsa said. “Is that a reasonable responsibility? It’s hard to say. But that’s how the industry works right now.”
He added that liability norms remain unsettled compared to traditional finance and called for stronger wallet and multisig setups to reduce similar risks.
The estimates diverge
On-chain analysis by security firm PeckShield estimated more than $8 million worth of assets were affected, saying the attacker swapped funds into ether (ETH) and began bridging them to bitcoin via THORChain.
“The hacker has swapped the stolen funds to $ETH and has started bridging them to #BTC via #Thorchain,” the firm wrote.
Another onchain investigator, Specter, said on X that “the private key of @iotex_io may have been compromised,” resulting in an estimated $4.3 million loss.
“Once assets are routed through THORChain […] recovery becomes extremely difficult,” Motz said.
IoTeX said it has identified four bitcoin addresses holding 66.78 BTC worth roughly $4.3 million at current prices and that the addresses are being monitored in cooperation with exchanges.
A CoinDesk review of those addresses on Feb. 23 confirmed they held roughly 66.6 BTC.
IoTeX did not immediately respond to CoinDesk’s request for comment.
“Containment is not the same as recovery,” he added. “The assets with actual market value were swapped and bridged. Those are, in my assessment, unlikely to be recovered.”
Khalsa similarly cautioned that recovery prospects are uncertain. “It’s hard to predict how much, if any, can be recovered,” he said.
IoTeX revised its figure upward to approximately $4.3 million, reflecting the direct asset drain but excluding minted tokens. Motz said broader estimates may better capture the severity of the breach.
“Private key compromise rather than smart contract bugs is emerging as a dominant attack vector,” Motz said, noting that such incidents target operational security rather than audited code.
Before offering the 10% bounty, IoTeX said a compensation plan would be in place within the next 48 hours.
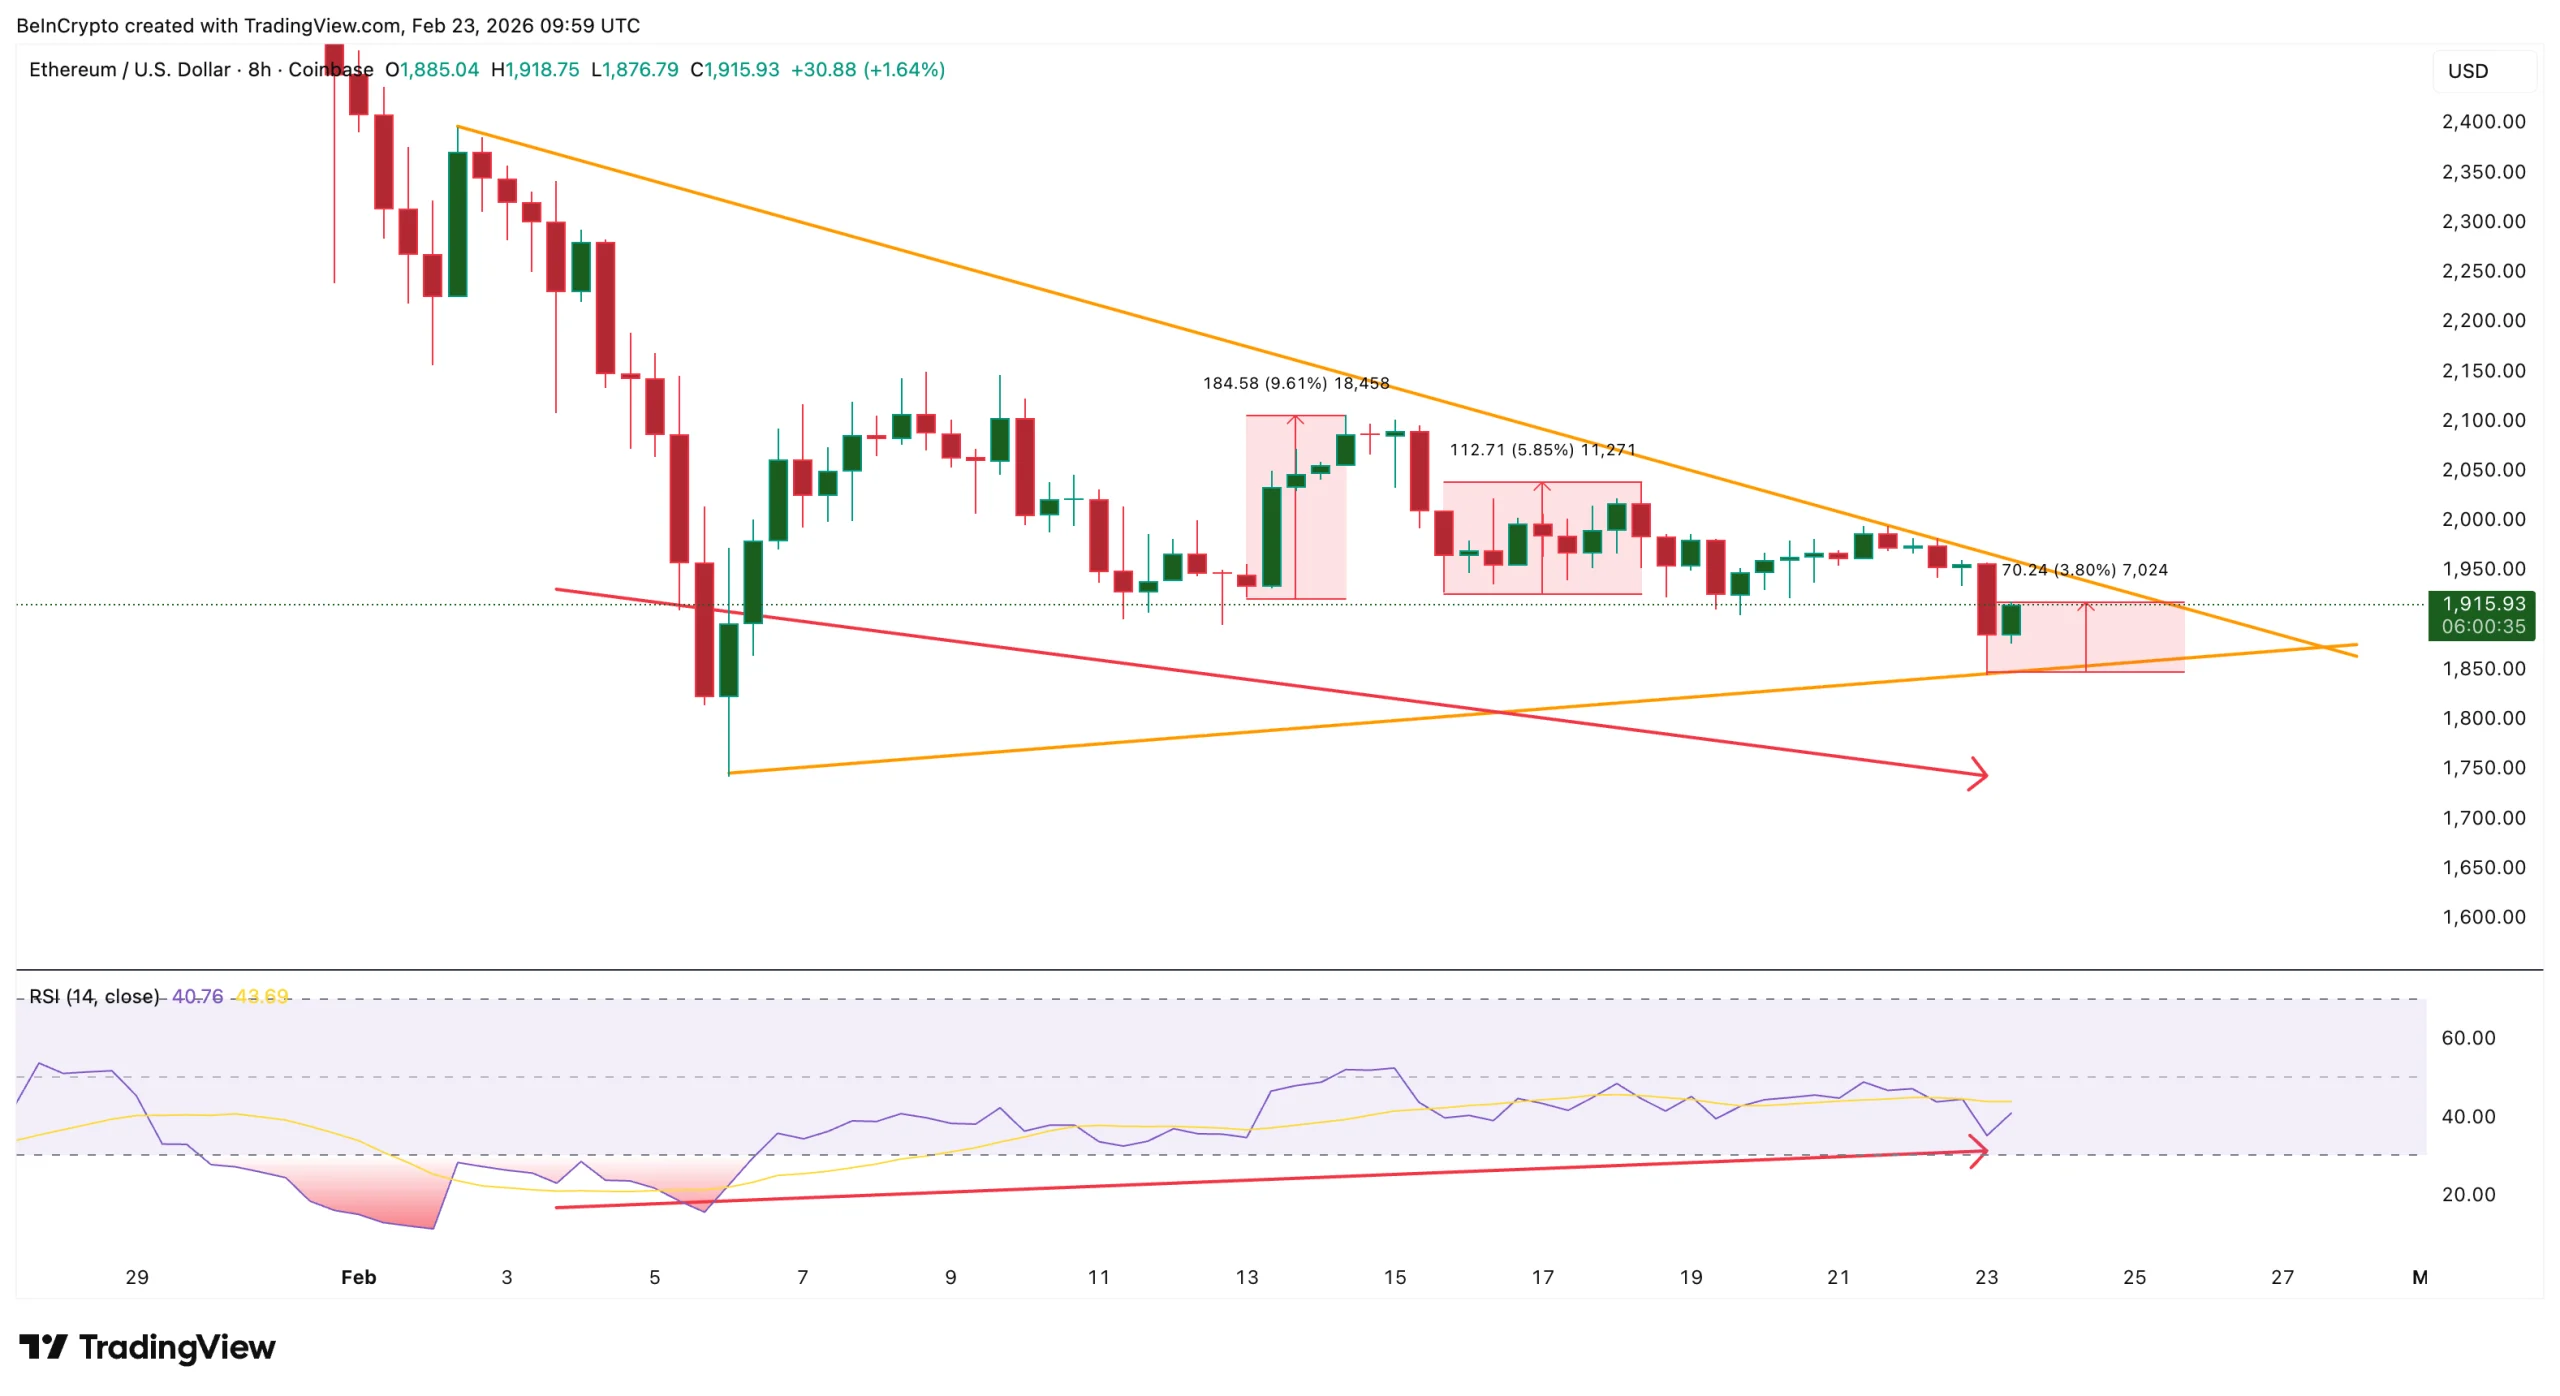
Ethereum is already showing early signs of recovery. Since a recent low near $1,840, Ethereum has climbed nearly 4%, signaling that buyers are beginning to step back in. This rebound is not happening randomly. The bounce setup has been quietly building for weeks.
Several underlying signals now point to a shift. Selling pressure has collapsed sharply. Derivatives traders have turned aggressively bearish without adding new positions. At the same time, long-term holders have started buying again after weeks of selling. Together, these forces suggest the current Ethereum bounce could extend further.
Ethereum Bounce Setup Emerges As Bullish Divergence Builds
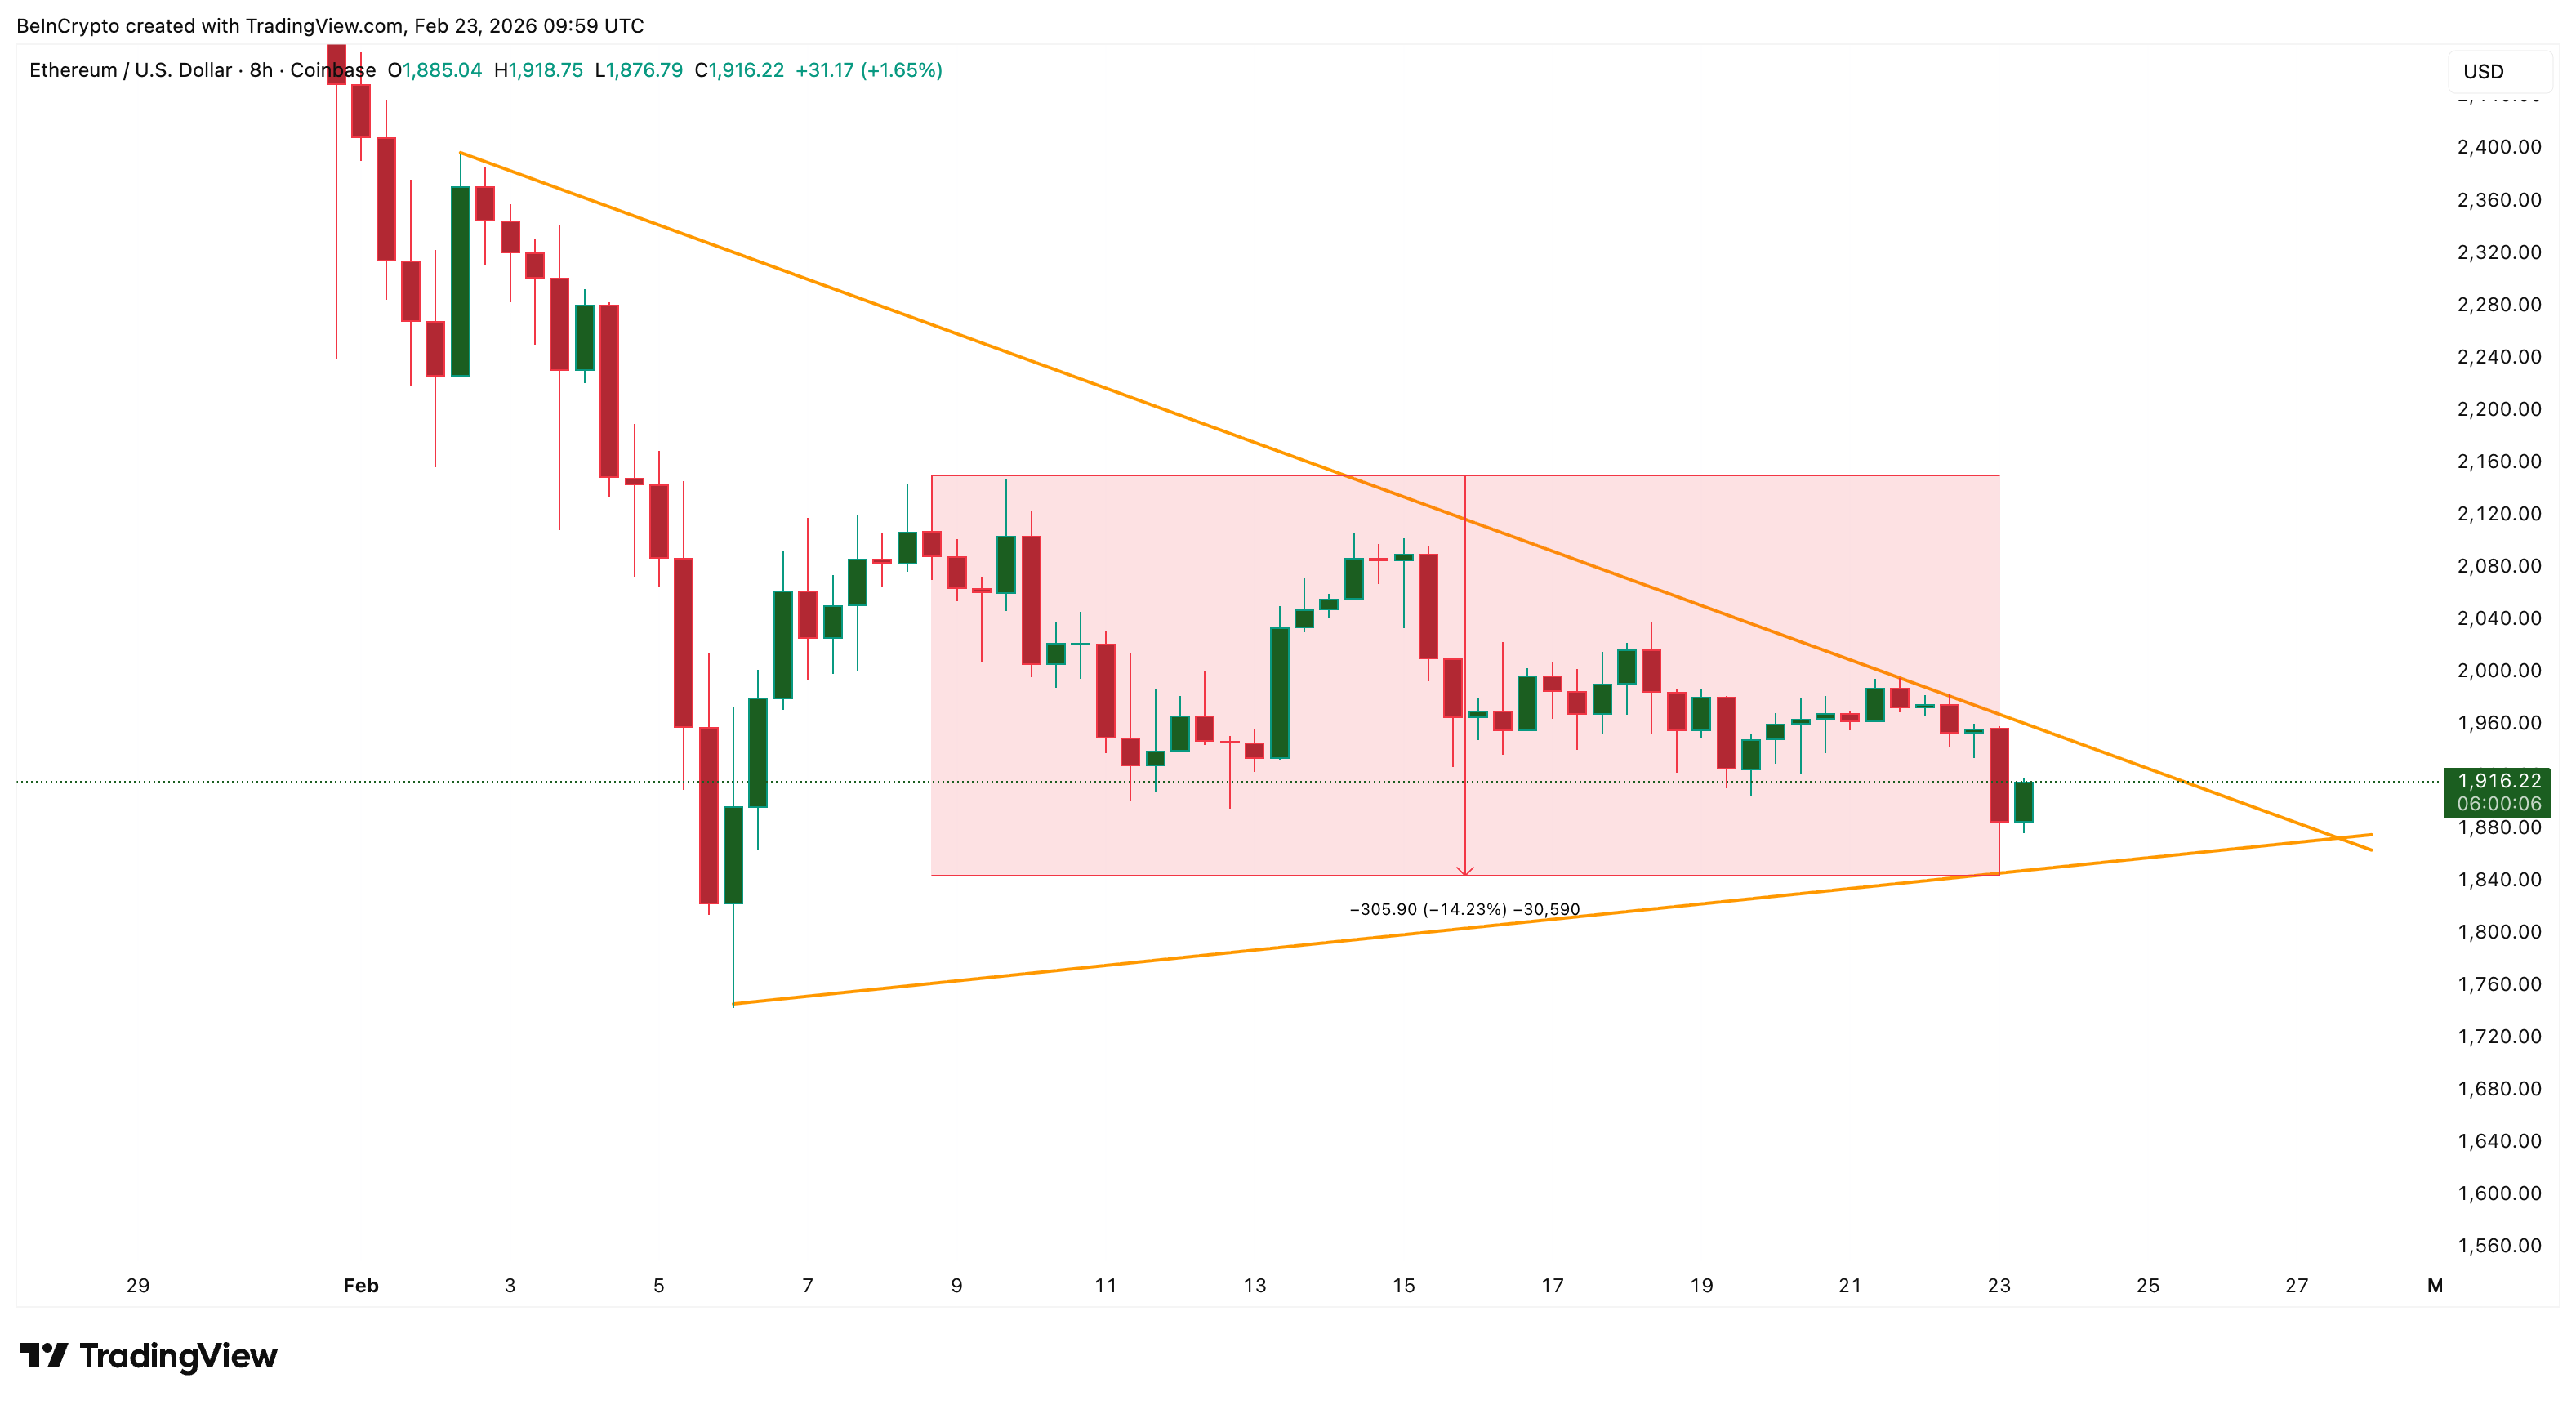
Ethereum’s short-term chart shows a symmetrical triangle. This pattern reflects indecision, where buyers and sellers are fighting for control.
At the same time, a bullish divergence has appeared between price and the Relative Strength Index (RSI). The RSI is a momentum indicator that measures whether selling pressure is strengthening or weakening. Between early February and today (February 23), Ethereum’s price has made lower lows, but the RSI has made higher lows. This pattern often signals that selling pressure is fading.

Want more token insights like this? Sign up for Editor Harsh Notariya’s Daily Crypto Newsletter here.
This same signal worked recently. Between February 3 and February 13, a similar divergence triggered a nearly 10% rebound. Another divergence between February 3 and February 15 led to a 6% move higher.
Ethereum has already started responding again. The recent 4% rebound shows buyers reacting to weakening downside momentum. But technical signals alone are not enough. The bigger question is what changed underneath the surface.
Selling Pressure Collapses 90% Even As Price Fell, Reveals Another Catalyst
The most important shift comes from exchange inflows. Exchange inflow measures the number of coins moving into exchanges. When coins move into exchanges, it usually signals intent to sell.
On February 7, Ethereum exchange inflows peaked near 1.06 million ETH. Since then, inflows have collapsed to just 126,000 ETH. This represents an almost 90% drop in potential selling pressure.
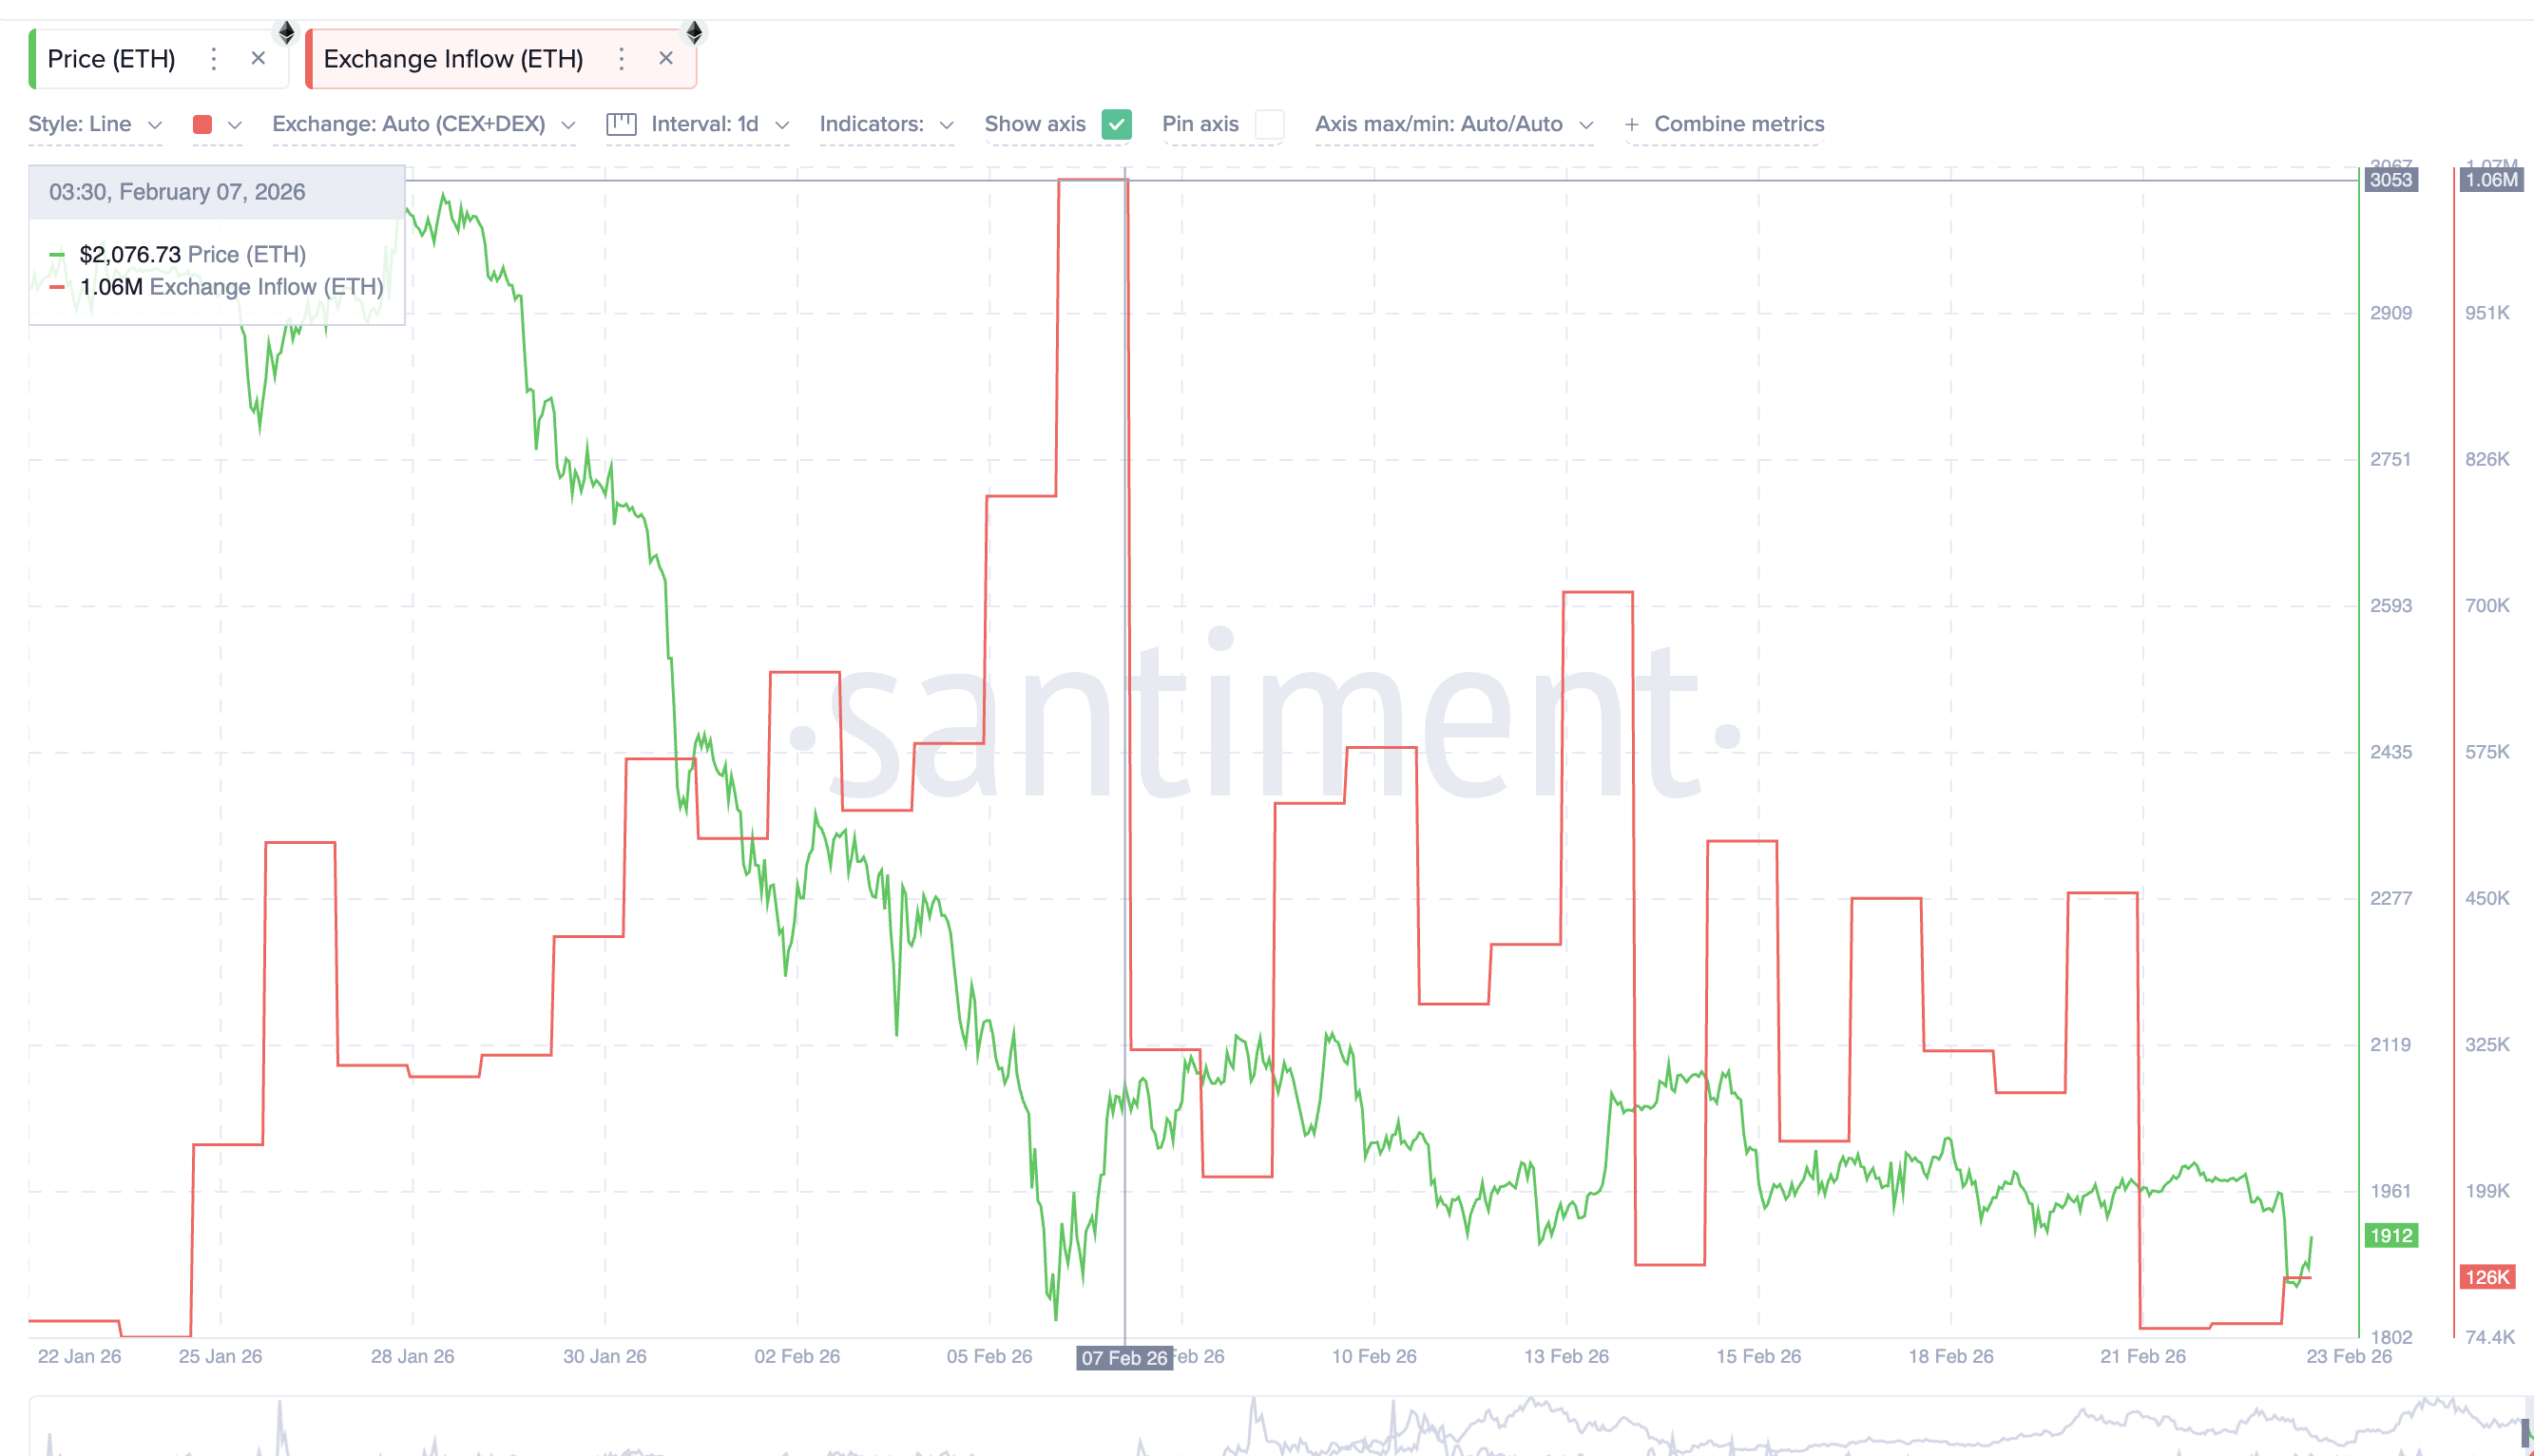
This change becomes even more important when compared to price. During the same period, Ethereum’s price still fell roughly 14%. Normally, price drops when selling pressure rises. But here, the price dropped while the selling pressure disappeared.
This shows the decline was not driven by aggressive spot selling. Instead, it suggests the weakness came from another source. That source appears to be derivatives traders. Ethereum’s funding rate has turned deeply negative. When funding is negative, short sellers are paying to maintain bearish positions.
Since February 7, funding rates dropped from slightly positive levels to around -0.02%. This marks one of the most bearish sentiment flips in recent weeks.
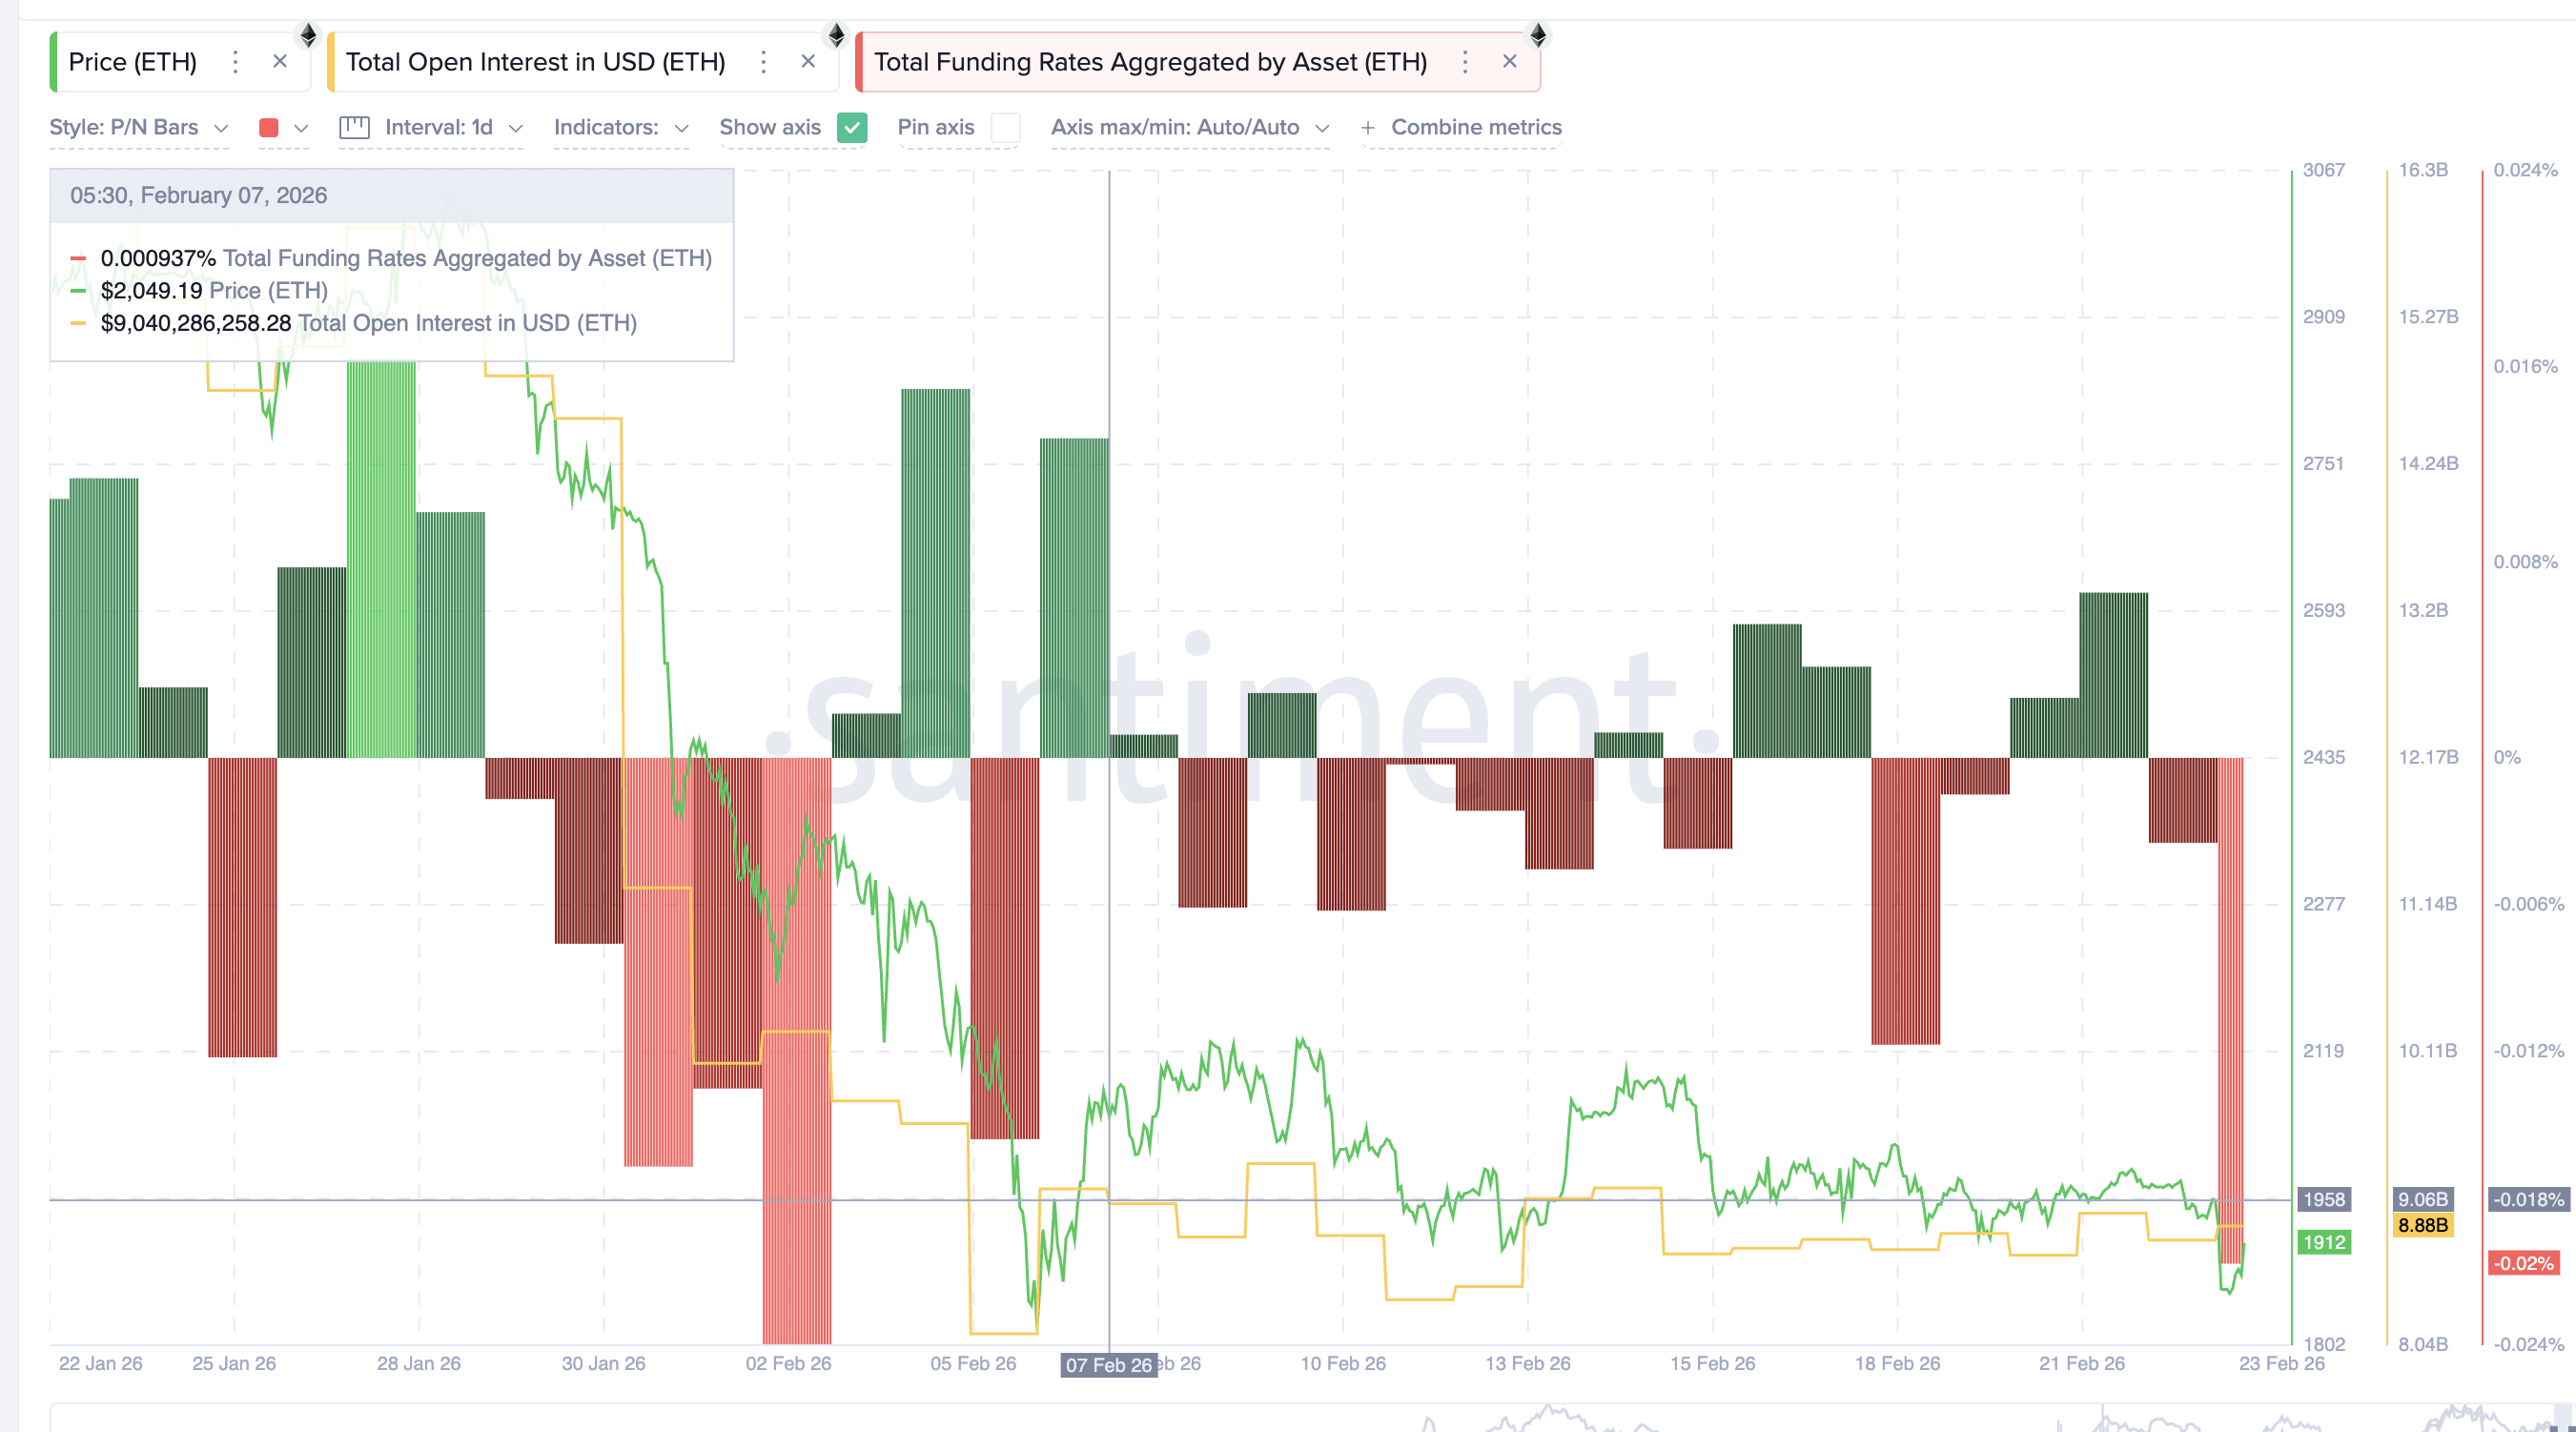
However, open interest tells a different story. Open interest measures the total value of active futures positions. During this period, open interest stayed mostly flat, falling only slightly from around $9.06 billion to $8.88 billion.
This combination is important. It shows that new short positions are not aggressively entering. Instead, existing traders have turned bearish, and long positions have likely exited.
This type of setup can be unstable. When bearish sentiment rises without large new positions, the market becomes vulnerable to a short squeeze. A short squeeze happens when rising prices force short sellers to close positions, pushing the price even higher.
This helps explain why Ethereum’s bounce could extend beyond a simple short-term rebound.
Long-Term Holders Suddenly Turn Buyers After Weeks of Selling
Another important shift comes from long-term holders. The Hodler Net Position Change metric measures whether long-term investors are buying or selling.
Between February 3 and February 20, this metric stayed negative. This showed sustained selling from experienced investors. At its peak, long-term holders sold more than 41,000 ETH on a net basis. But this trend has now reversed. Over the past two days, the metric turned positive, reaching a net accumulation of over 6,000 ETH.
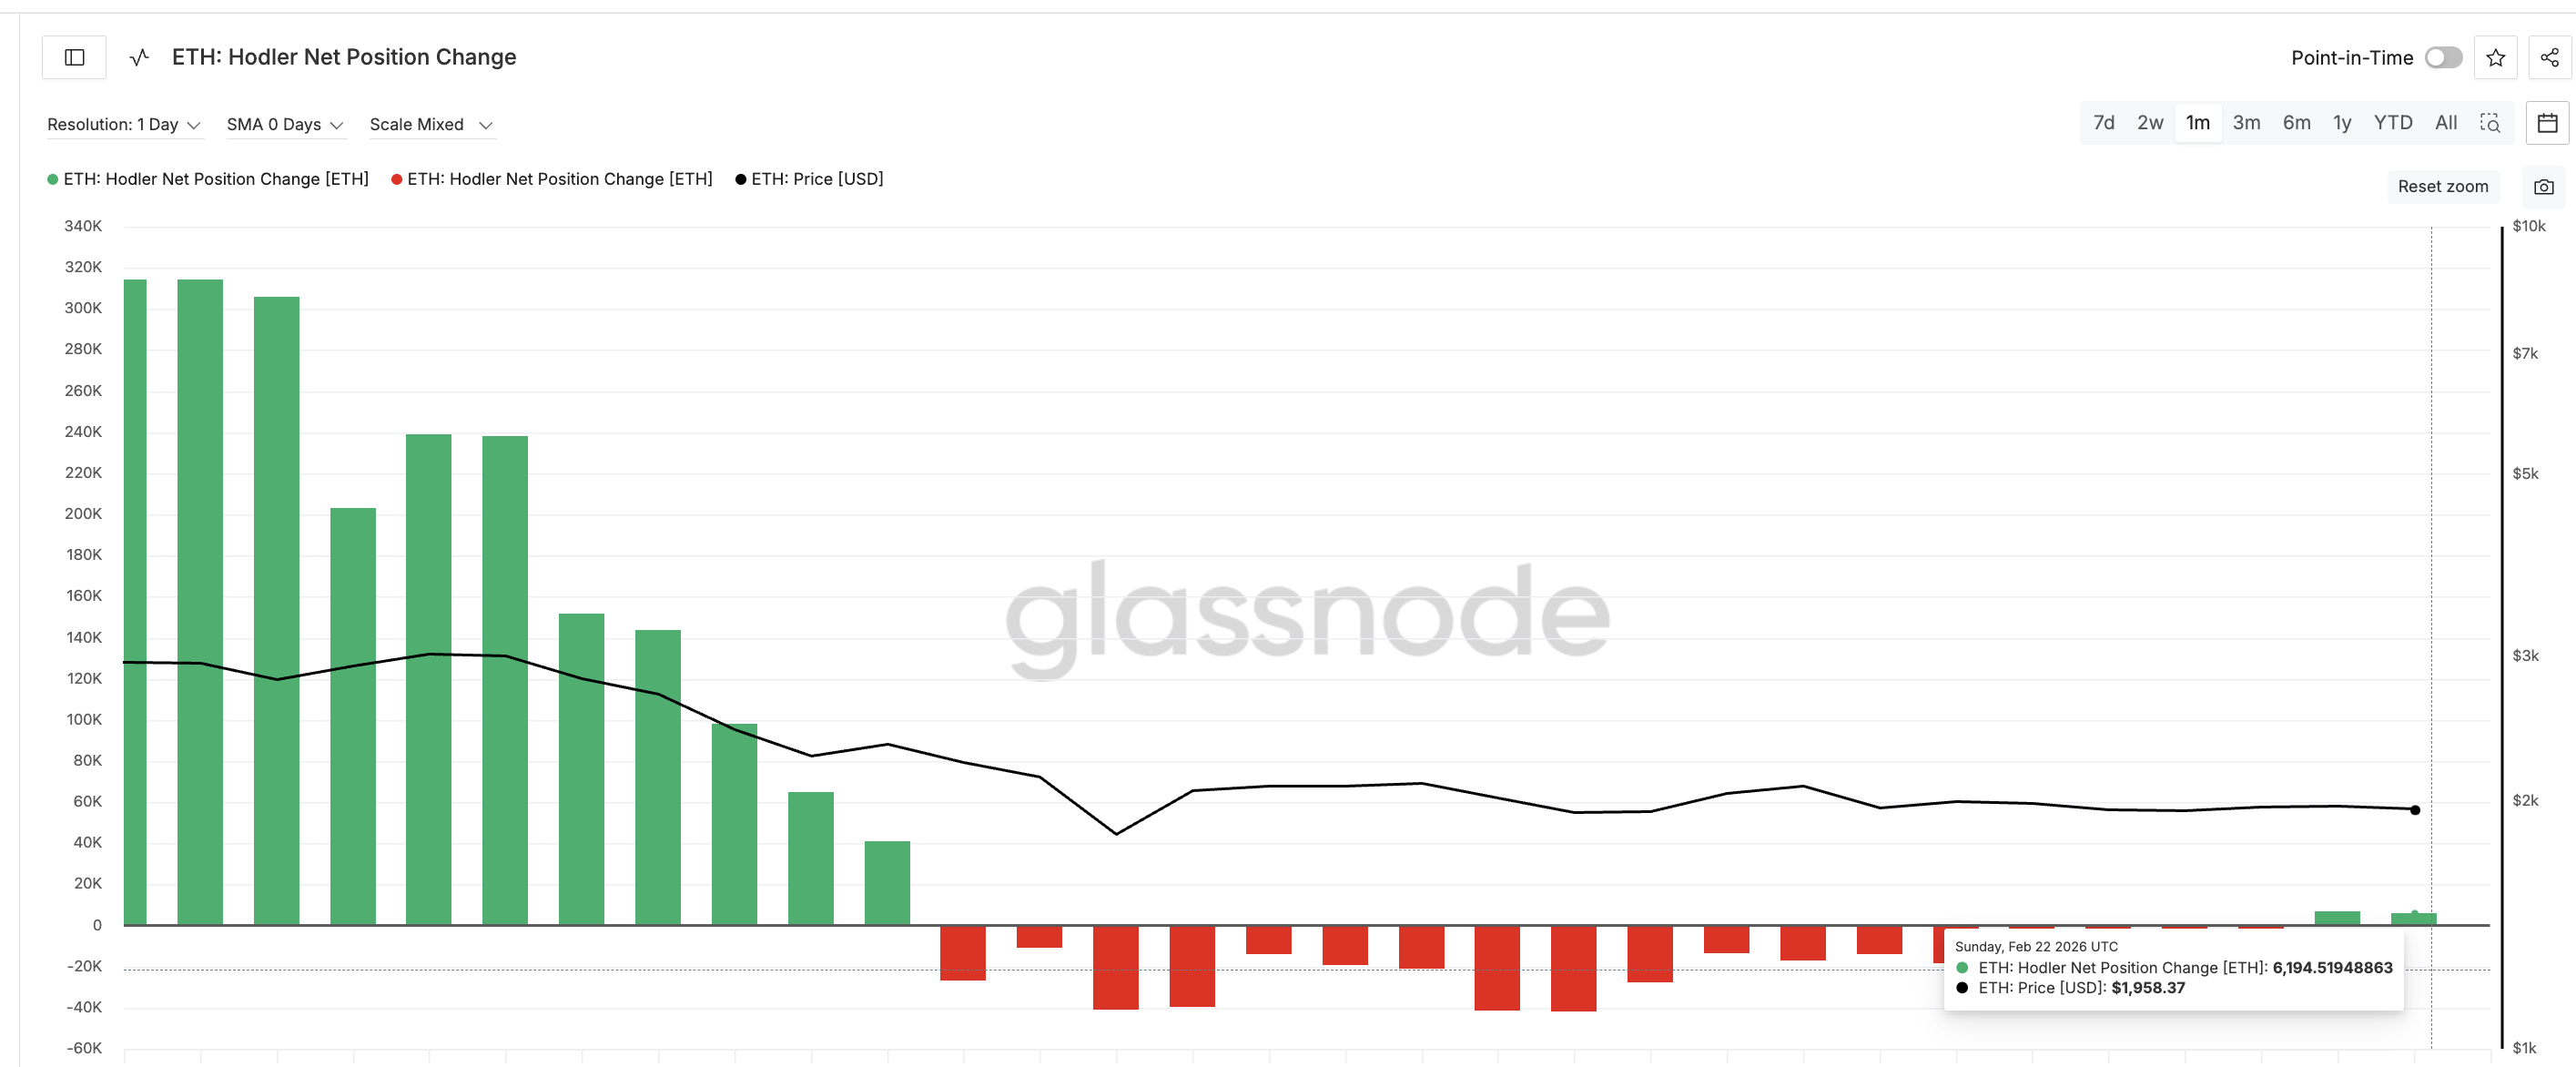
This confirms that experienced investors have resumed buying. This type of accumulation often happens near local bottoms, when long-term investors position early before broader recoveries begin.
With selling pressure falling, bearish derivatives sentiment stretched, and long-term buyers returning, Ethereum’s bounce setup now has stronger structural support.
Ethereum Price Faces Key Breakout Levels That Could Extend Bounce
Ethereum now faces several important resistance levels. The first key level sits at $1,920. Breaking above this level would confirm strengthening momentum. The next resistance appears at $2,020, followed by a major barrier near $2,060, a key technical level, where it can experience the most resistance.
If Ethereum breaks above $2,060, the bounce could accelerate toward $2,200 and potentially even $2,420.
However, the bullish setup depends on holding support. The critical downside level remains $1,840. If Ethereum falls below this level, the bounce structure would fail. In that case, the next downside target sits near $1,740.
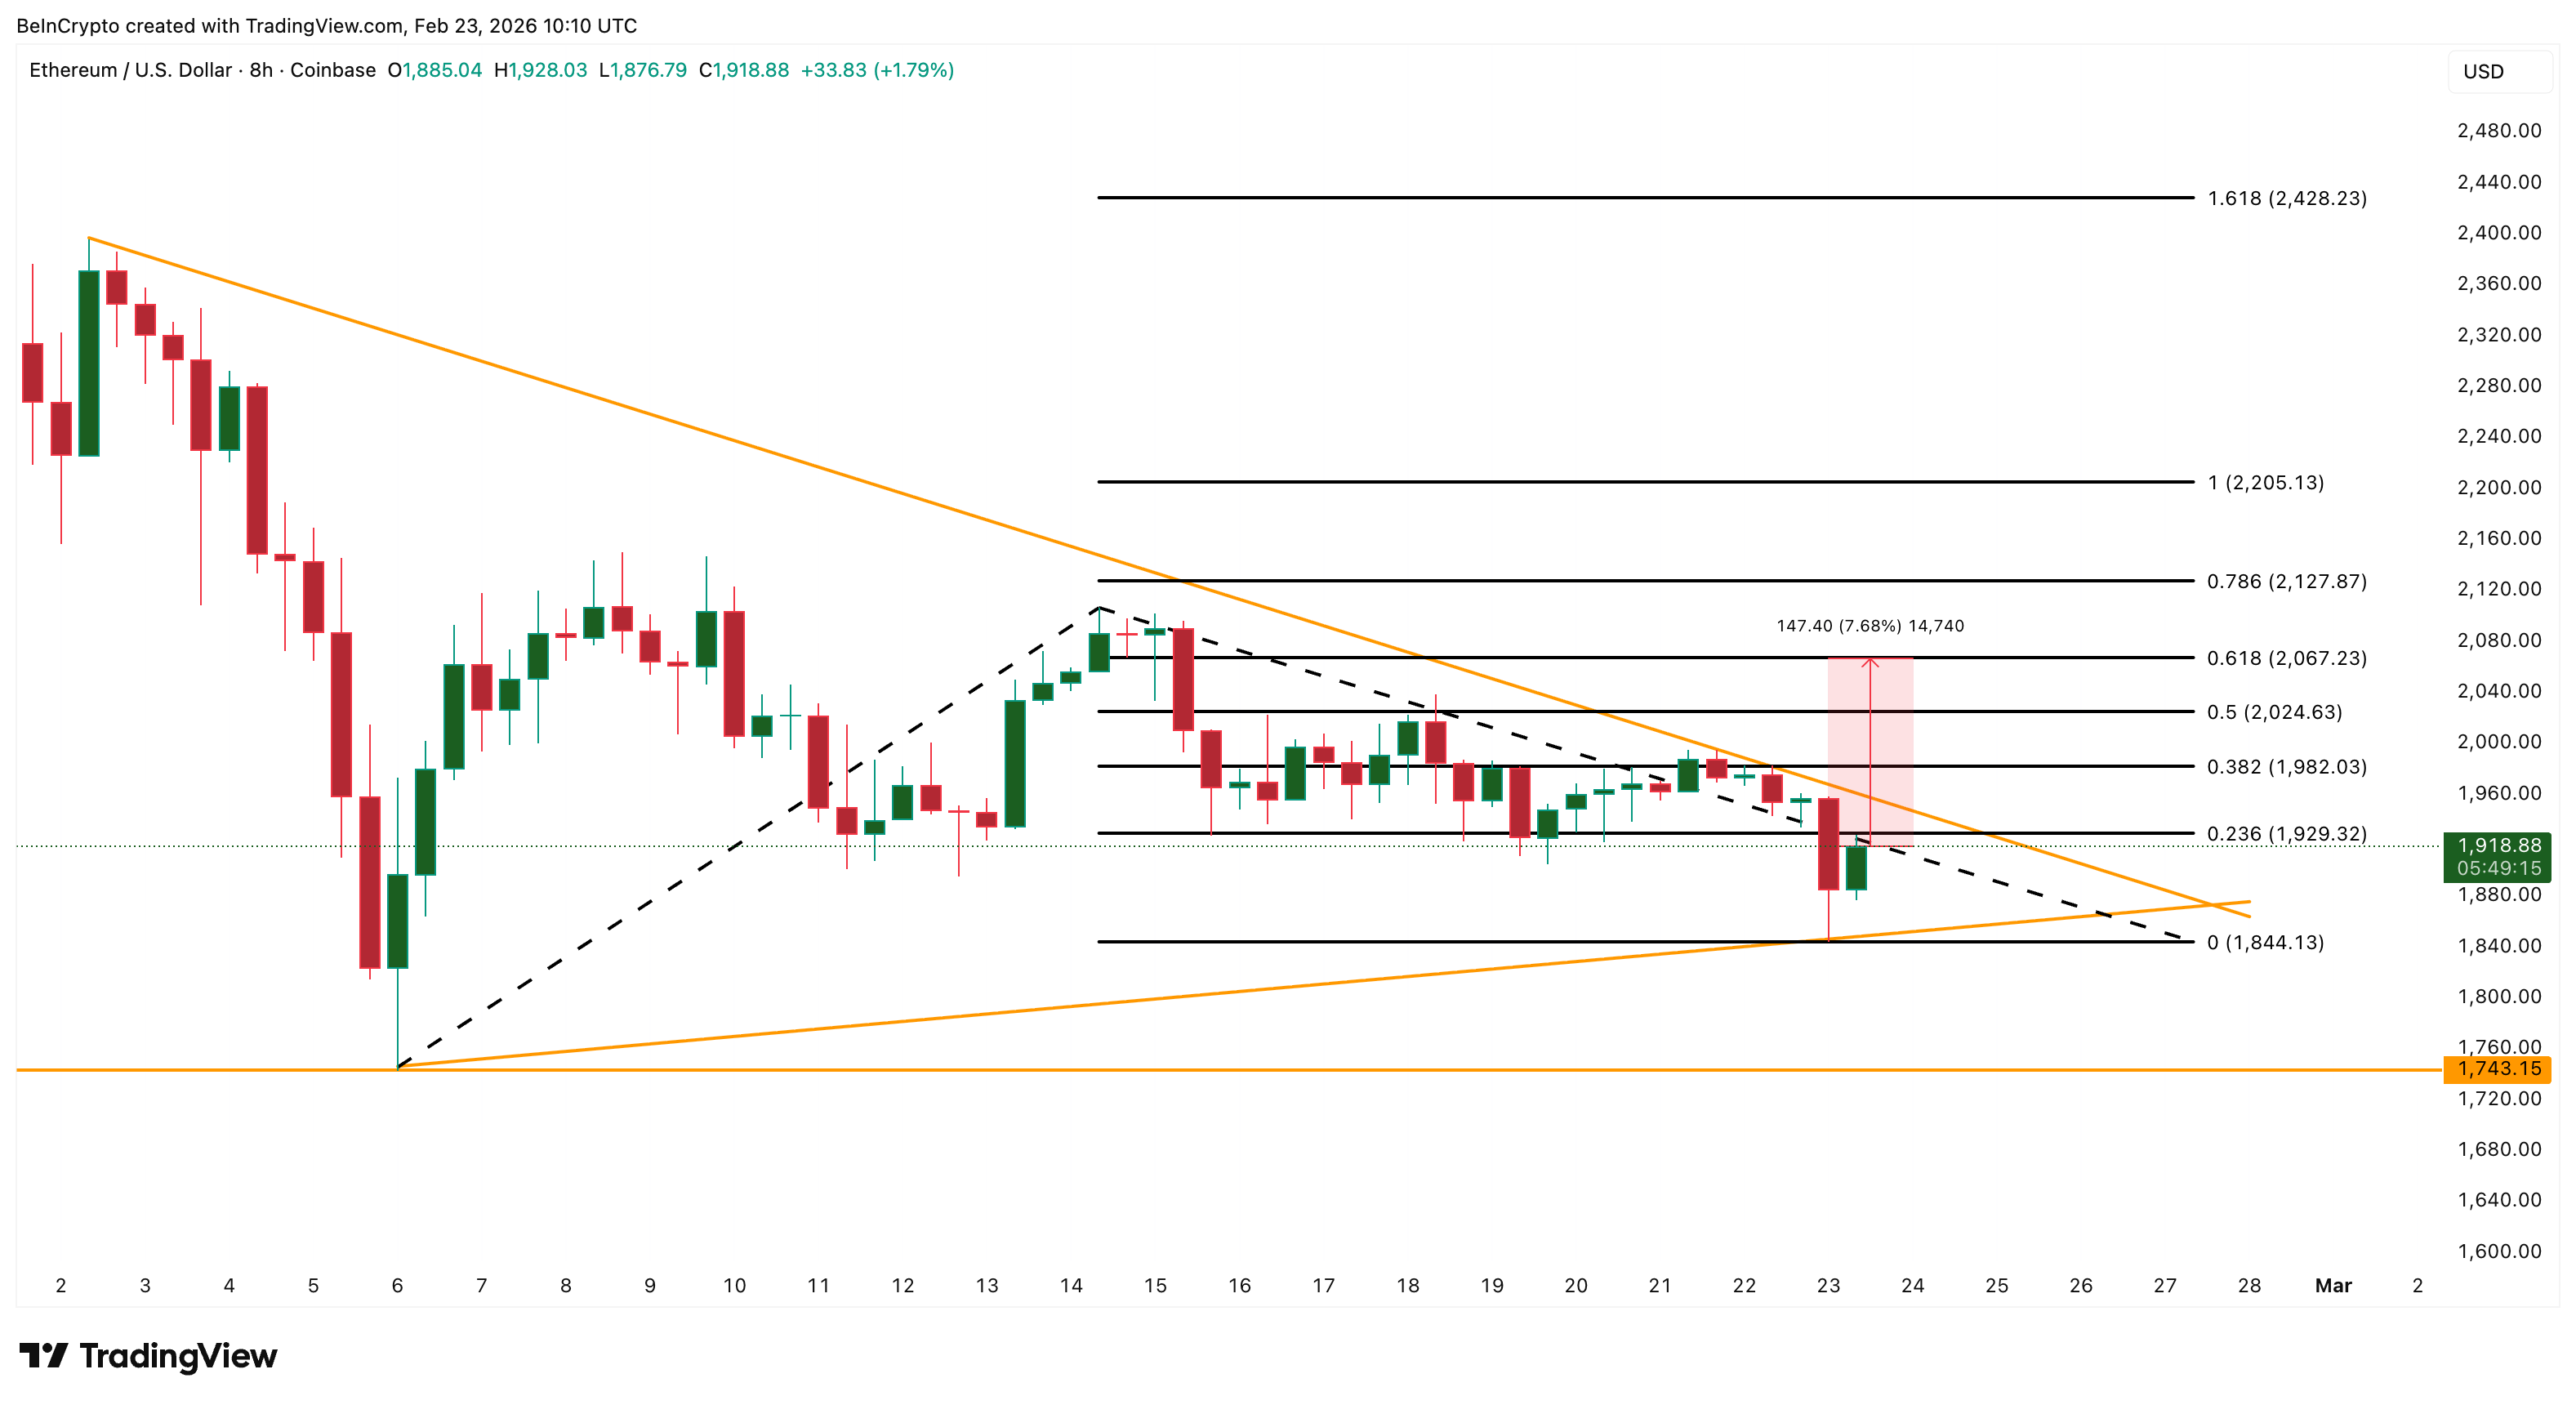
For now, Ethereum’s bounce is no longer just a simple relief rally. Selling pressure has collapsed by nearly 90%. Bearish sentiment increased without strong conviction. And long-term holders have quietly returned as buyers.
These combined forces suggest Ethereum’s current rebound may be the early stage of a larger move — with the next breakout level now becoming the decisive trigger.
Uninsured driver hit speeds of 114mph before killing mum in horror crash that ‘sounded like a bomb’

Neptune Insurance Holdings Inc. 2025 Q4 – Results – Earnings Call Presentation (NYSE:NP) 2026-02-23

Here’s How It Could Happen


-

 Crypto World7 days ago
Can XRP Price Successfully Register a 33% Breakout Past $2?
-

 Video4 days ago
XRP News: XRP Just Entered a New Phase (Almost Nobody Noticed)
-

 Fashion3 days ago
Weekend Open Thread: Boden – Corporette.com
-

 Sports7 days ago
GB's semi-final hopes hang by thread after loss to Switzerland
-

 Politics2 days ago
Baftas 2026: Awards Nominations, Presenters And Performers
-
 Tech7 days ago
The Music Industry Enters Its Less-Is-More Era
-

 Sports4 hours ago
Women’s college basketball rankings: Iowa reenters top 10, Auriemma makes history
-

 Politics5 hours ago
Nick Reiner Enters Plea In Deaths Of Parents Rob And Michele
-
 Business6 days ago
Infosys Limited (INFY) Discusses Tech Transitions and the Unique Aspects of the AI Era Transcript
-

 Entertainment5 days ago
Kunal Nayyar’s Secret Acts Of Kindness Sparks Online Discussion
-

 Video7 days ago
Financial Statement Analysis | Complete Chapter Revision in 10 Minutes | Class 12 Board exam 2026
-

 Tech6 days ago
Retro Rover: LT6502 Laptop Packs 8-Bit Power On The Go
-
 Sports5 days ago
Clearing the boundary, crossing into history: J&K end 67-year wait, enter maiden Ranji Trophy final | Cricket News
-

 Business1 day ago
Mattel’s American Girl brand turns 40, dolls enter a new era
-

 Business1 day ago
Law enforcement kills armed man seeking to enter Trump’s Mar-a-Lago resort, officials say
-

 Entertainment5 days ago
Dolores Catania Blasts Rob Rausch For Turning On ‘Housewives’ On ‘Traitors’
-
 NewsBeat13 hours ago
‘Hourly’ method from gastroenterologist ‘helps reduce air travel bloating’
-

 Business6 days ago
Tesla avoids California suspension after ending ‘autopilot’ marketing
-

 Politics7 days ago
Eurovision Announces UK Act For 2026 Song Contest
-

 Tech1 day ago
Anthropic-Backed Group Enters NY-12 AI PAC Fight