

Crypto World
XRP Price Sets 20% Bear Trap? Shorts and Whale Buying Collide

XRP price is up about 2% in the past 24 hours. This small move is part of a broader rebound of nearly 6% after XRP briefly broke below a critical support level. Yes, a breakdown.
That breakdown initially confirmed a bearish head-and-shoulders pattern, which projected a steep 20% decline. But the story did not end there. Instead of accelerating lower, XRP rebounded quickly. New data now shows this breakdown may have served as bearish bait, drawing in short sellers before reversing.
XRP’s 20% Bearish Breakdown Created the Perfect Trap Setup
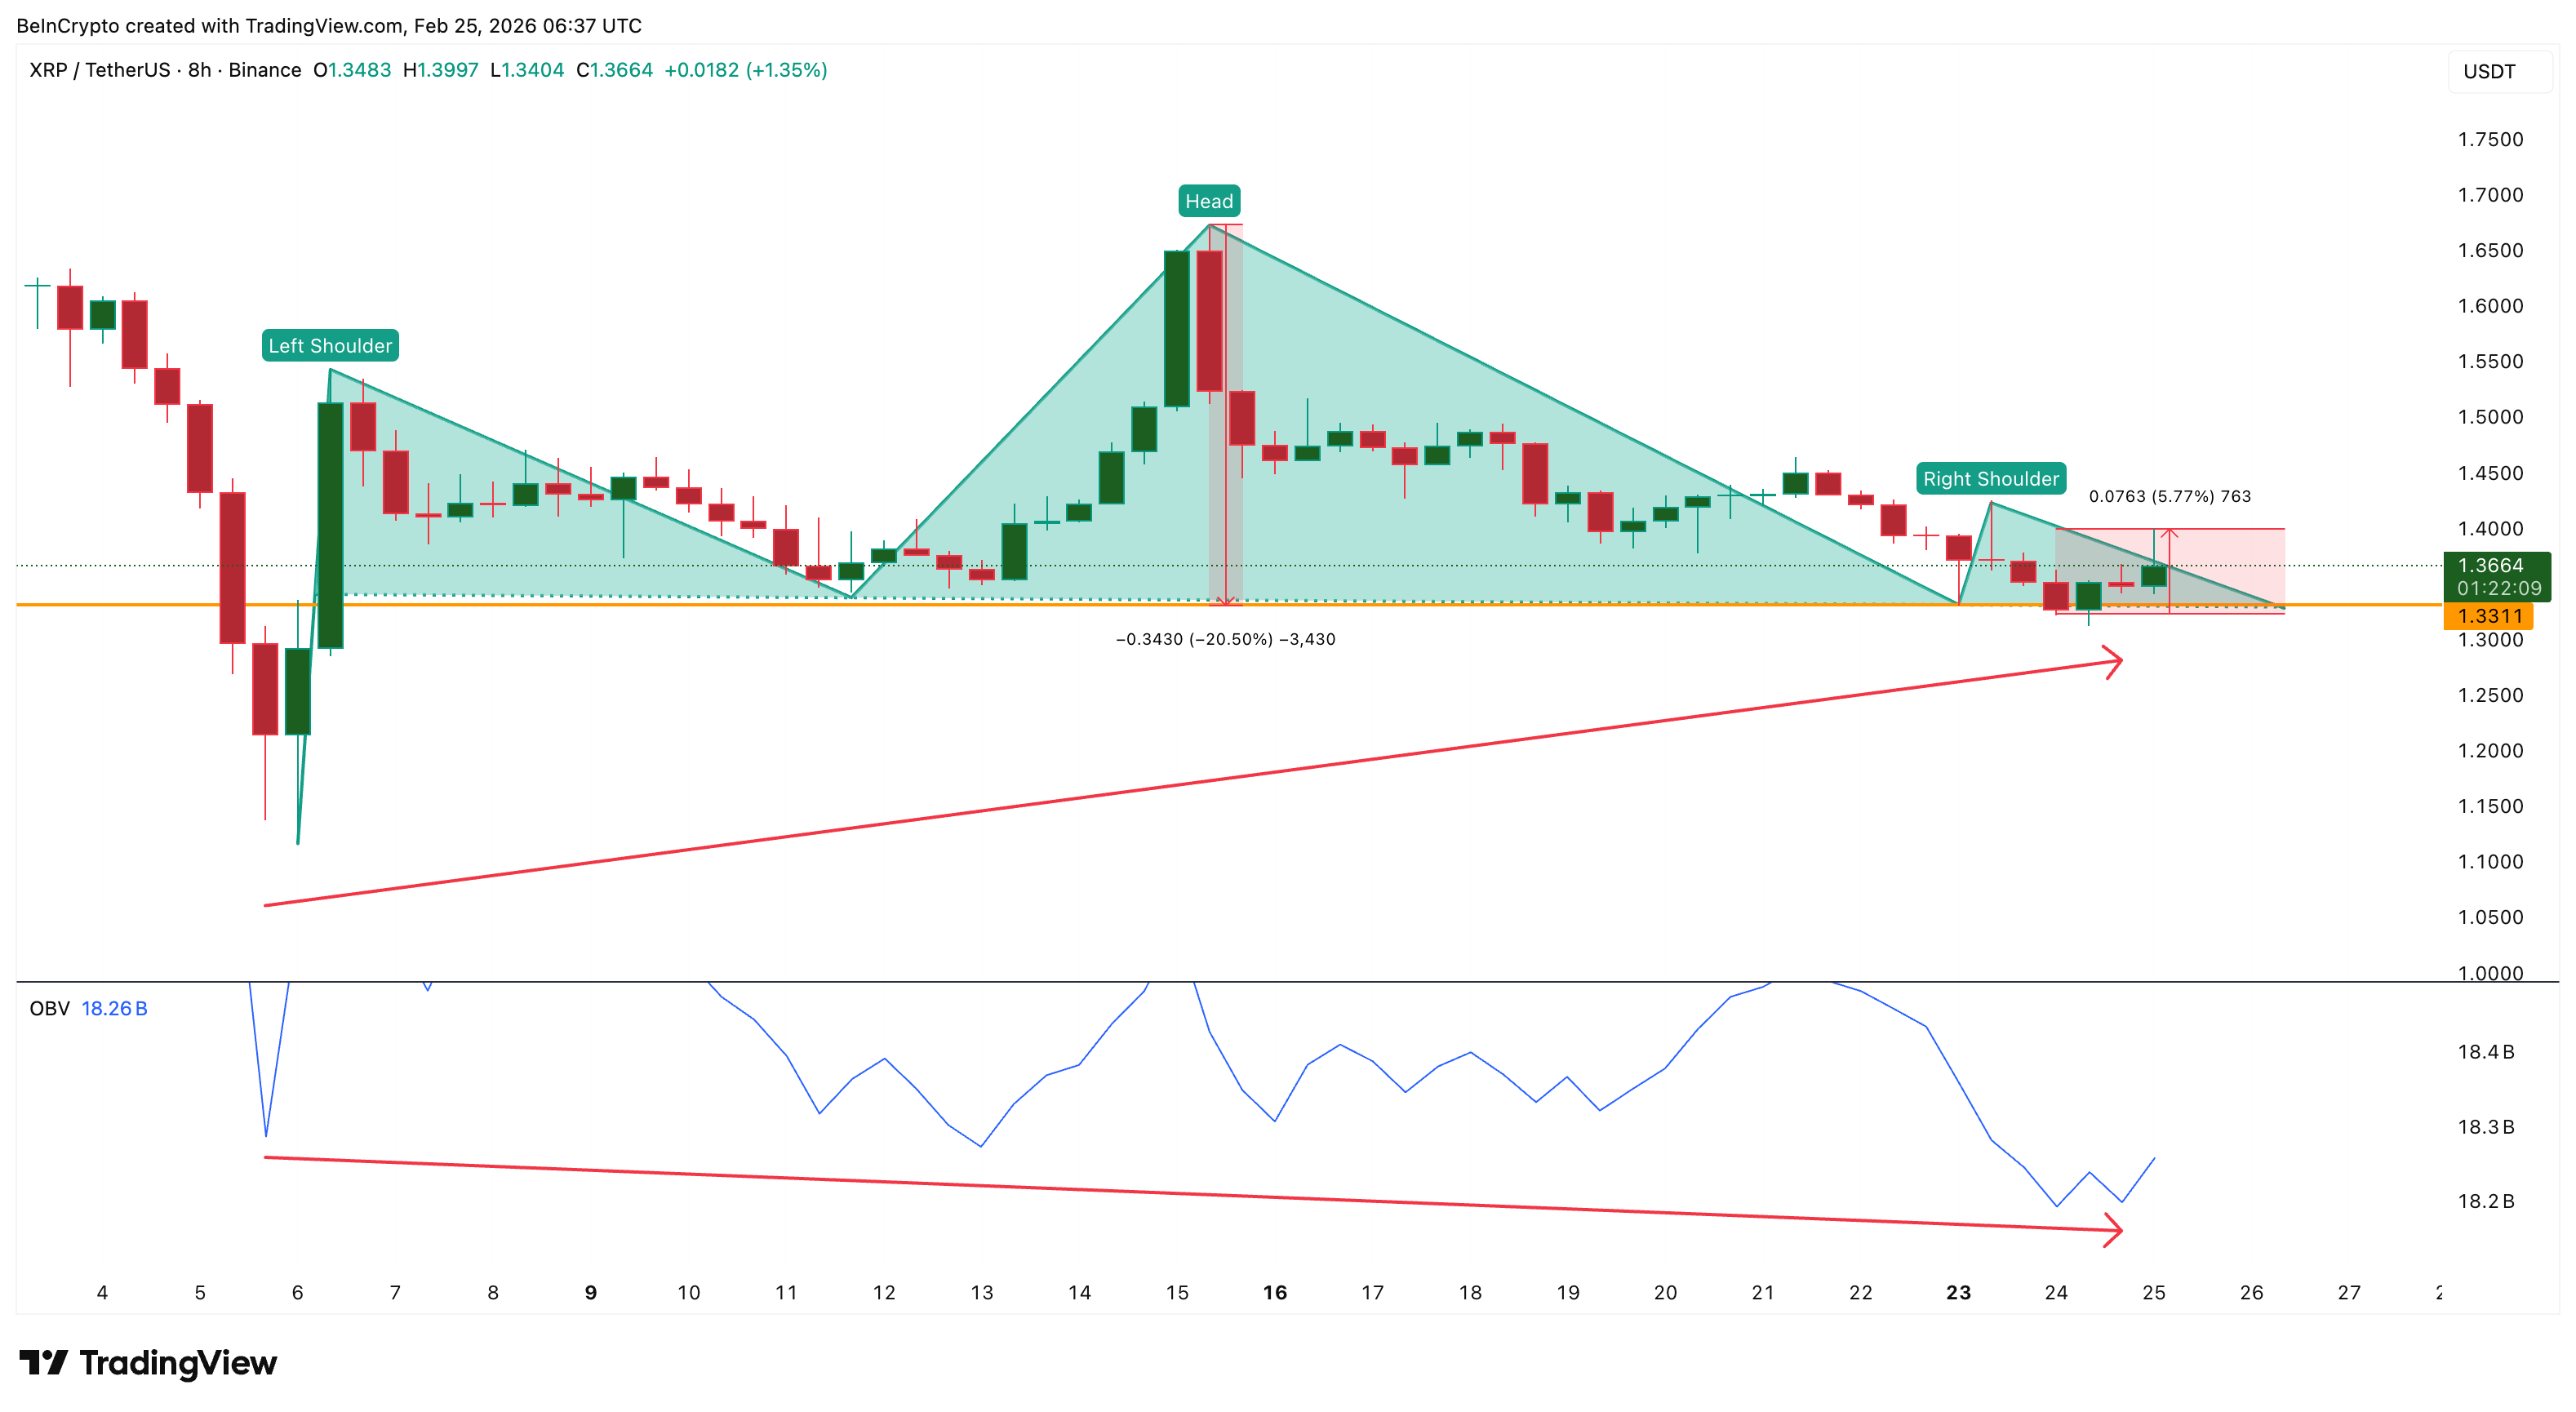
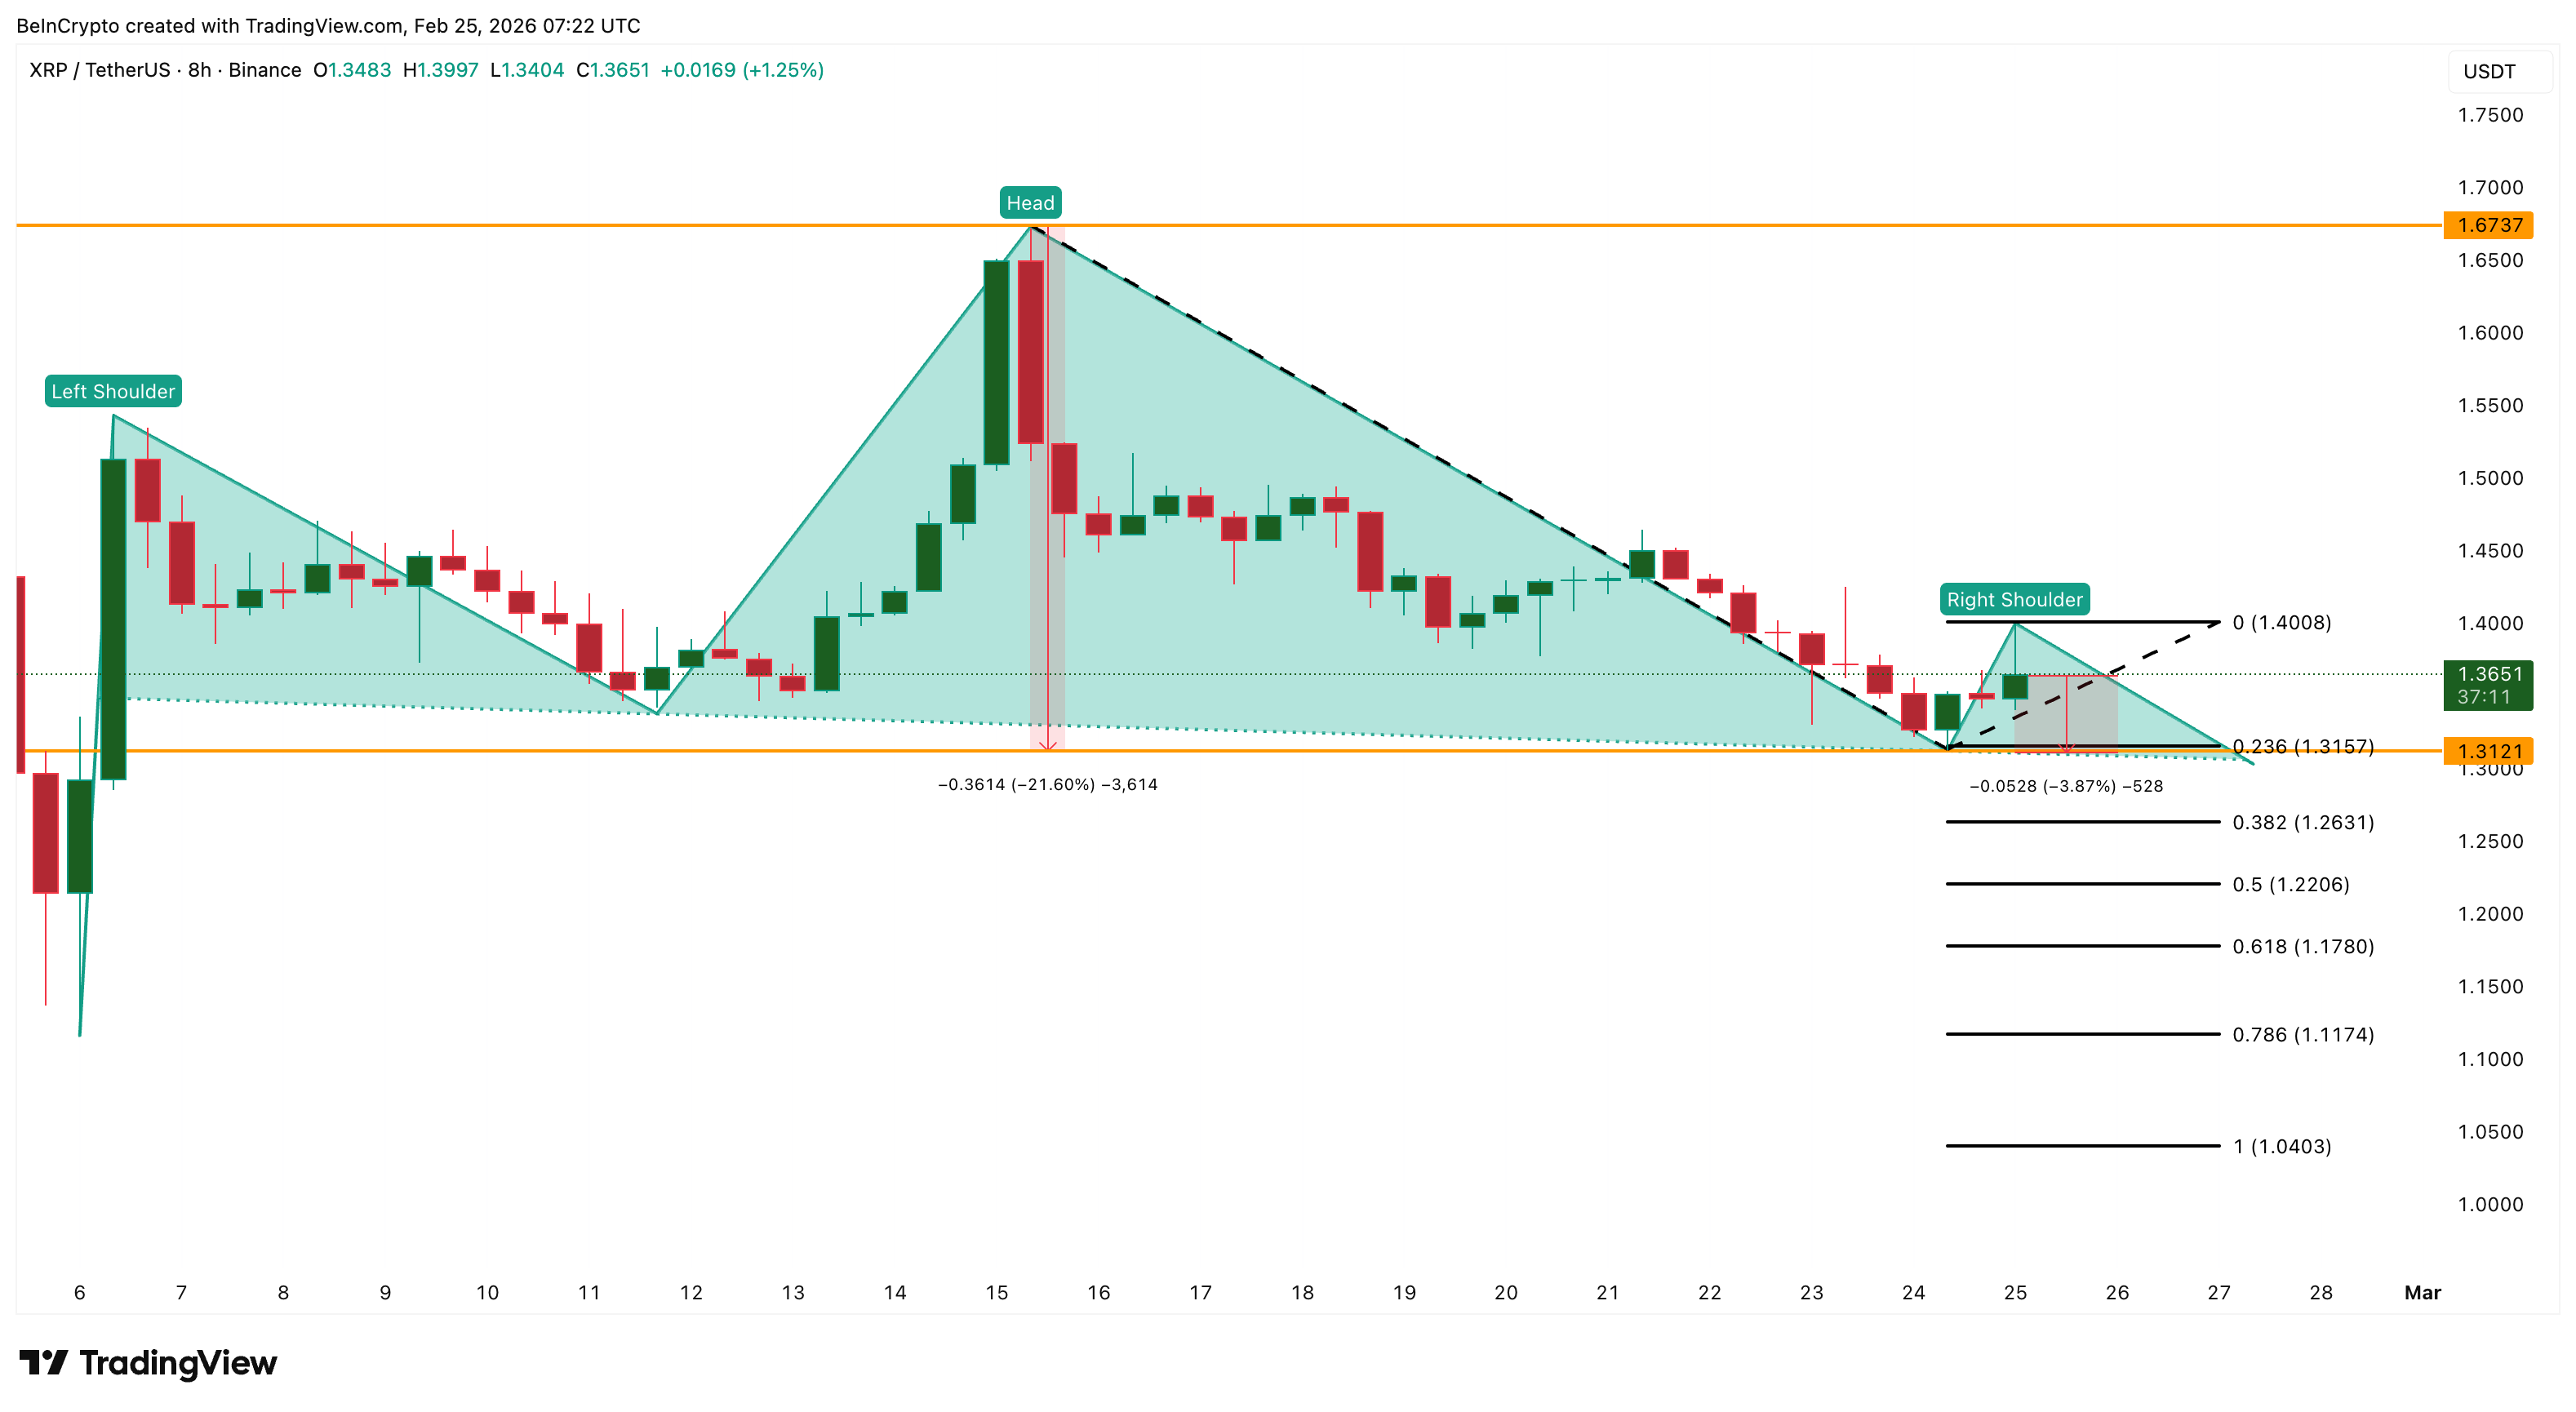
The bearish pattern began forming on the 8-hour chart on February 6. XRP created a head-and-shoulders pattern. It is one of the most widely watched bearish reversal patterns. The key level in this pattern is the neckline. For XRP, this support sat near $1.33.
When the XRP Ledger token broke below this level on February 24, it confirmed the bearish structure. Based on the height of the pattern, the projected downside target was about 20%. At the same time, another warning appeared, confirming the breakdown.
On-Balance Volume (OBV) was declining even as the XRP price was rising between February 5 and February 24. OBV measures buying and selling pressure using volume. When OBV falls while price rises, it shows weakening buyer strength. This made the breakdown look even more convincing.
Want more token insights like this? Sign up for Editor Harsh Notariya’s Daily Crypto Newsletter here.
But instead of continuing toward the 20% target, XRP quickly reversed and rebounded nearly 6%. This was the first sign that the breakdown had turned into a trap.
$770 Million Open Interest Surge Shows Traders Took the Bait
Open interest data confirms that traders reacted aggressively to the breakdown. Open interest, which measures the total value of active futures positions, surged from around $750 million on February 22 to nearly $770 million on February 23, just hours before the breakdown.
At the same time, funding rates dropped sharply from around –0.0025% to nearly –0.014%, a 460% surge in the short positioning intensity. This change is important.
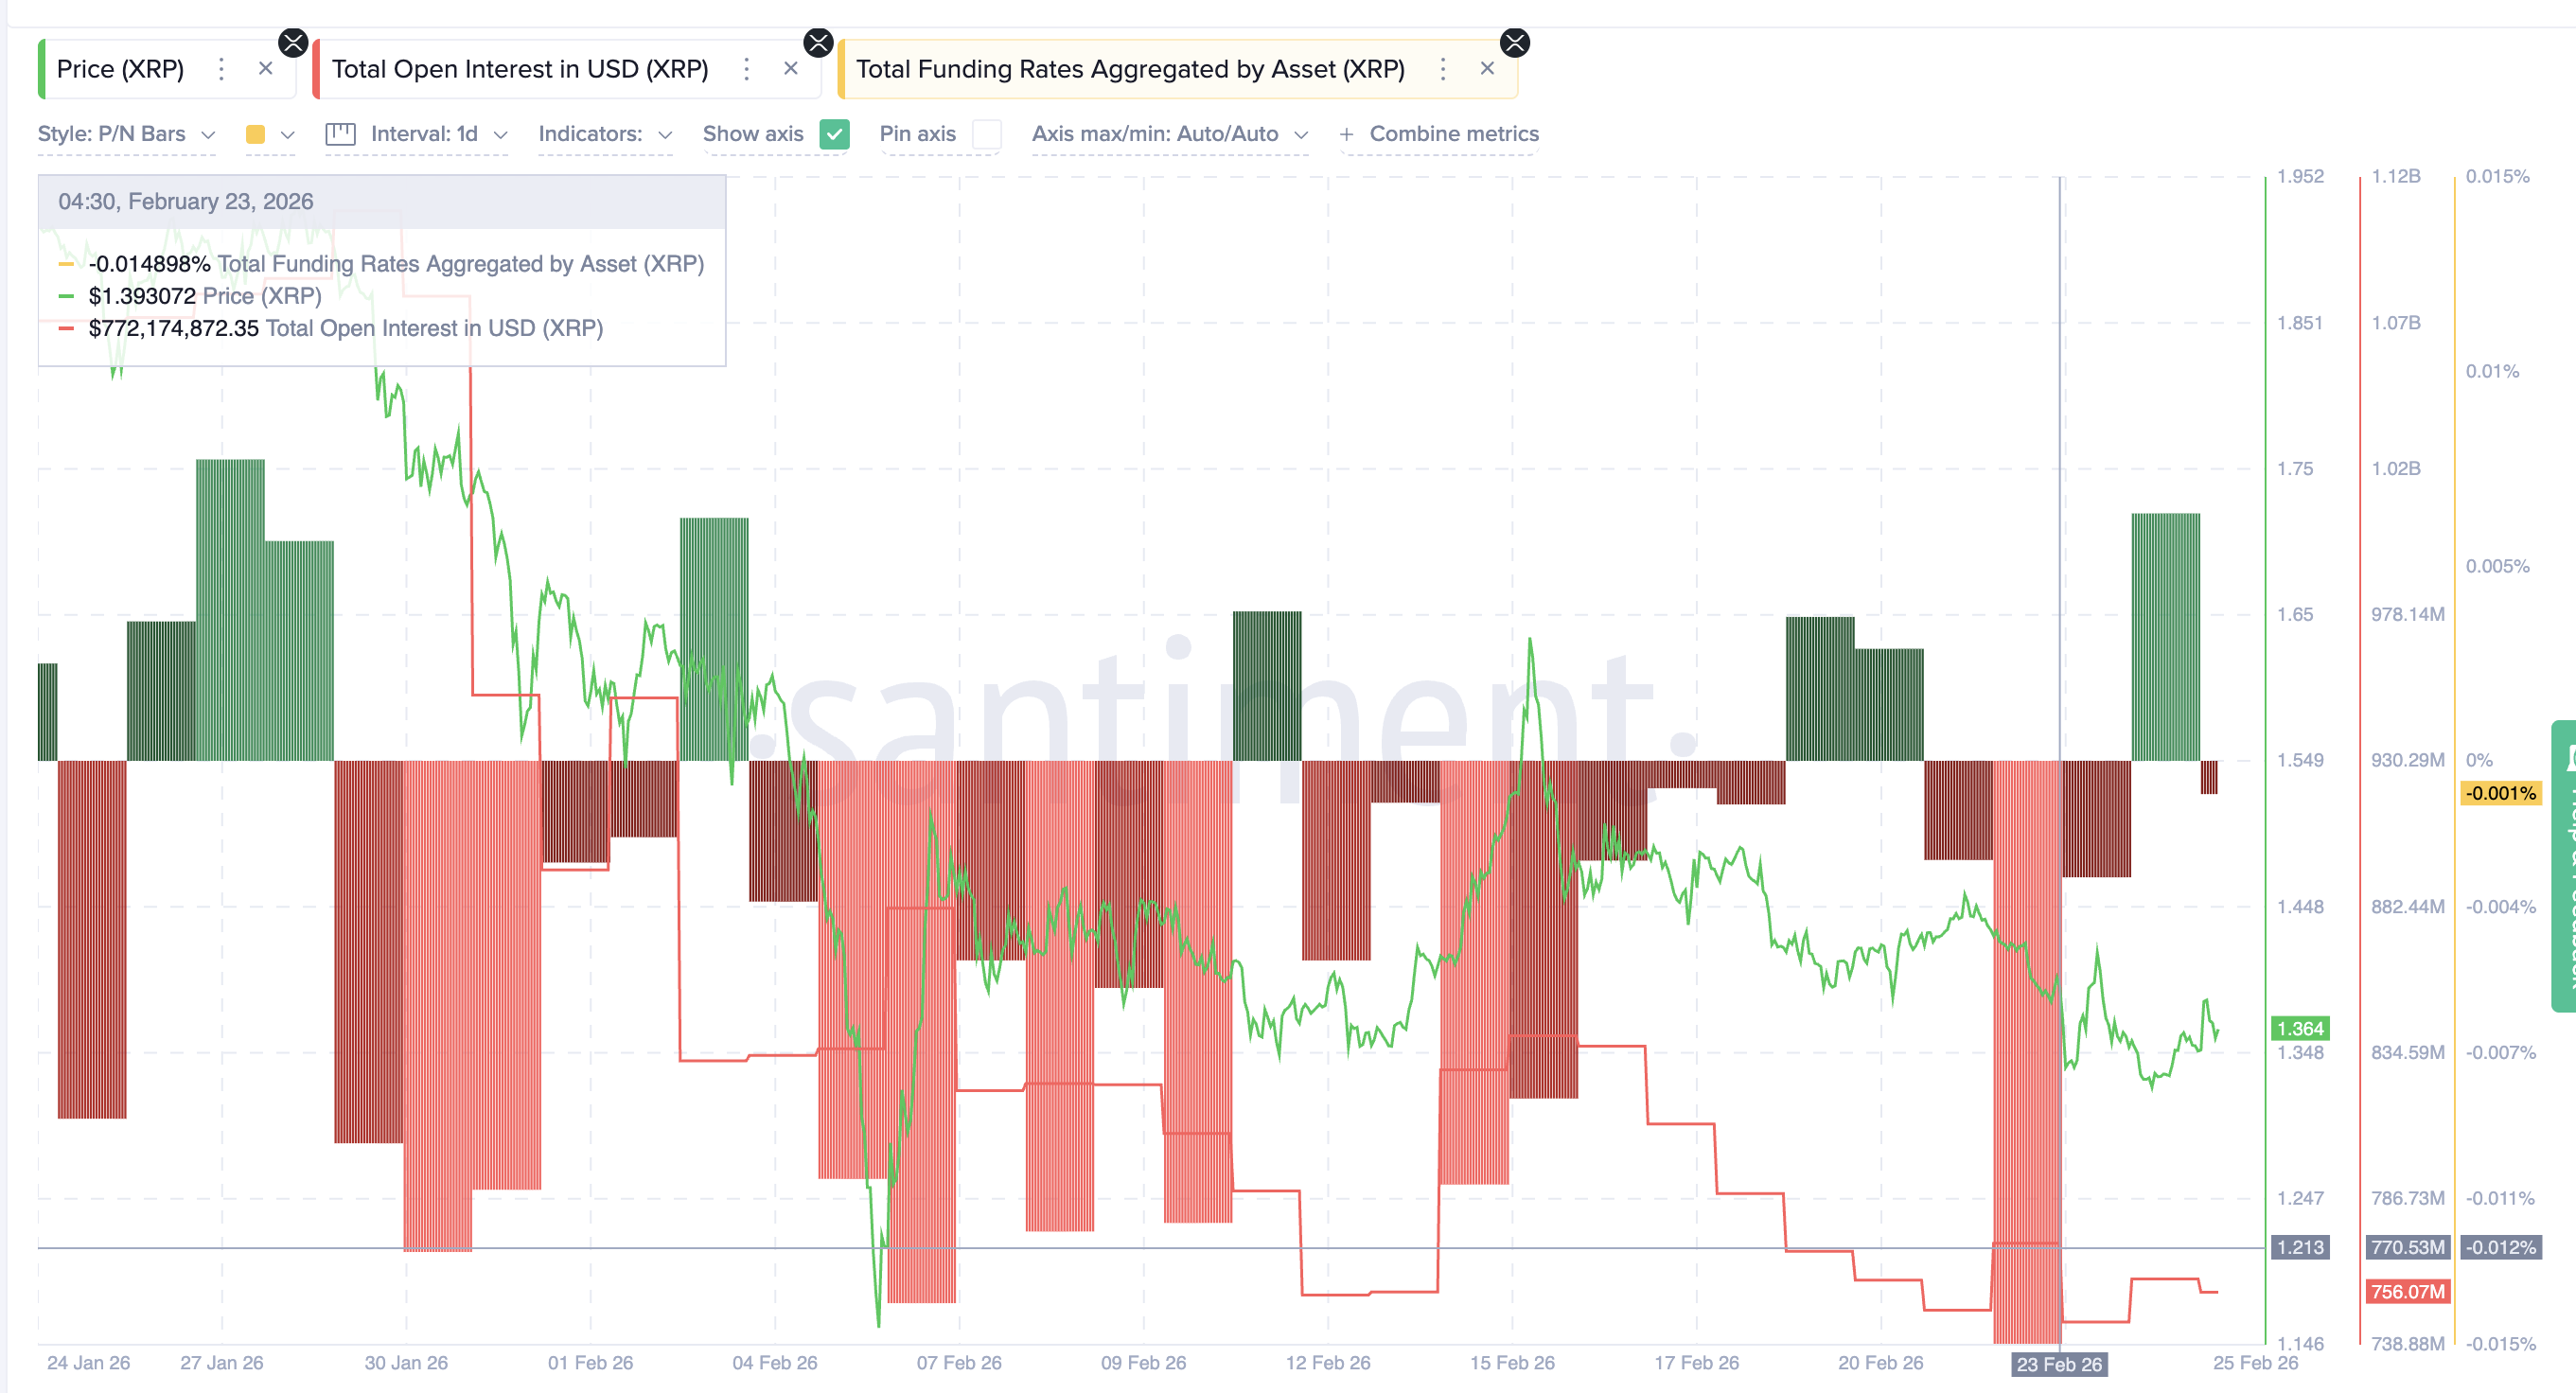
Funding rates becoming more negative means short sellers are increasing rapidly and are willing to pay a premium to hold those bearish bets. In simple terms, traders were aggressively betting on XRP to crash further.
This created a crowded short trade. But when XRP rebounded instead of collapsing, many of those short positions were likely forced to close or reduce exposure.
Open interest later dropped from $770 million to around $756 million as the price rebounded. This decline suggests leveraged positions were closed during the reversal. Open interest alone does not confirm whether longs or shorts exited.
However, because funding rates were heavily negative before the rebound, it indicates bearish positions were dominant, and some of those traders likely reduced exposure or got liquidated as the breakdown failed.
150 Million XRP Whale Buying Happened During the Trap — Not Before It
Whale behavior during this period adds another critical piece. Wallets holding between 1 million and 10 million XRP increased their holdings from 3.77 billion XRP to 3.81 billion XRP. At the same time, the largest whale group, holding between 100 million and 1 billion XRP, increased holdings from 8.35 billion XRP to 8.46 billion XRP.
Combined, these groups added approximately 150 million XRP over two days, from February 23 to February 25. At an average price of $1.35, this equals about $200 million in buying. Importantly, this accumulation happened during and immediately after the breakdown.
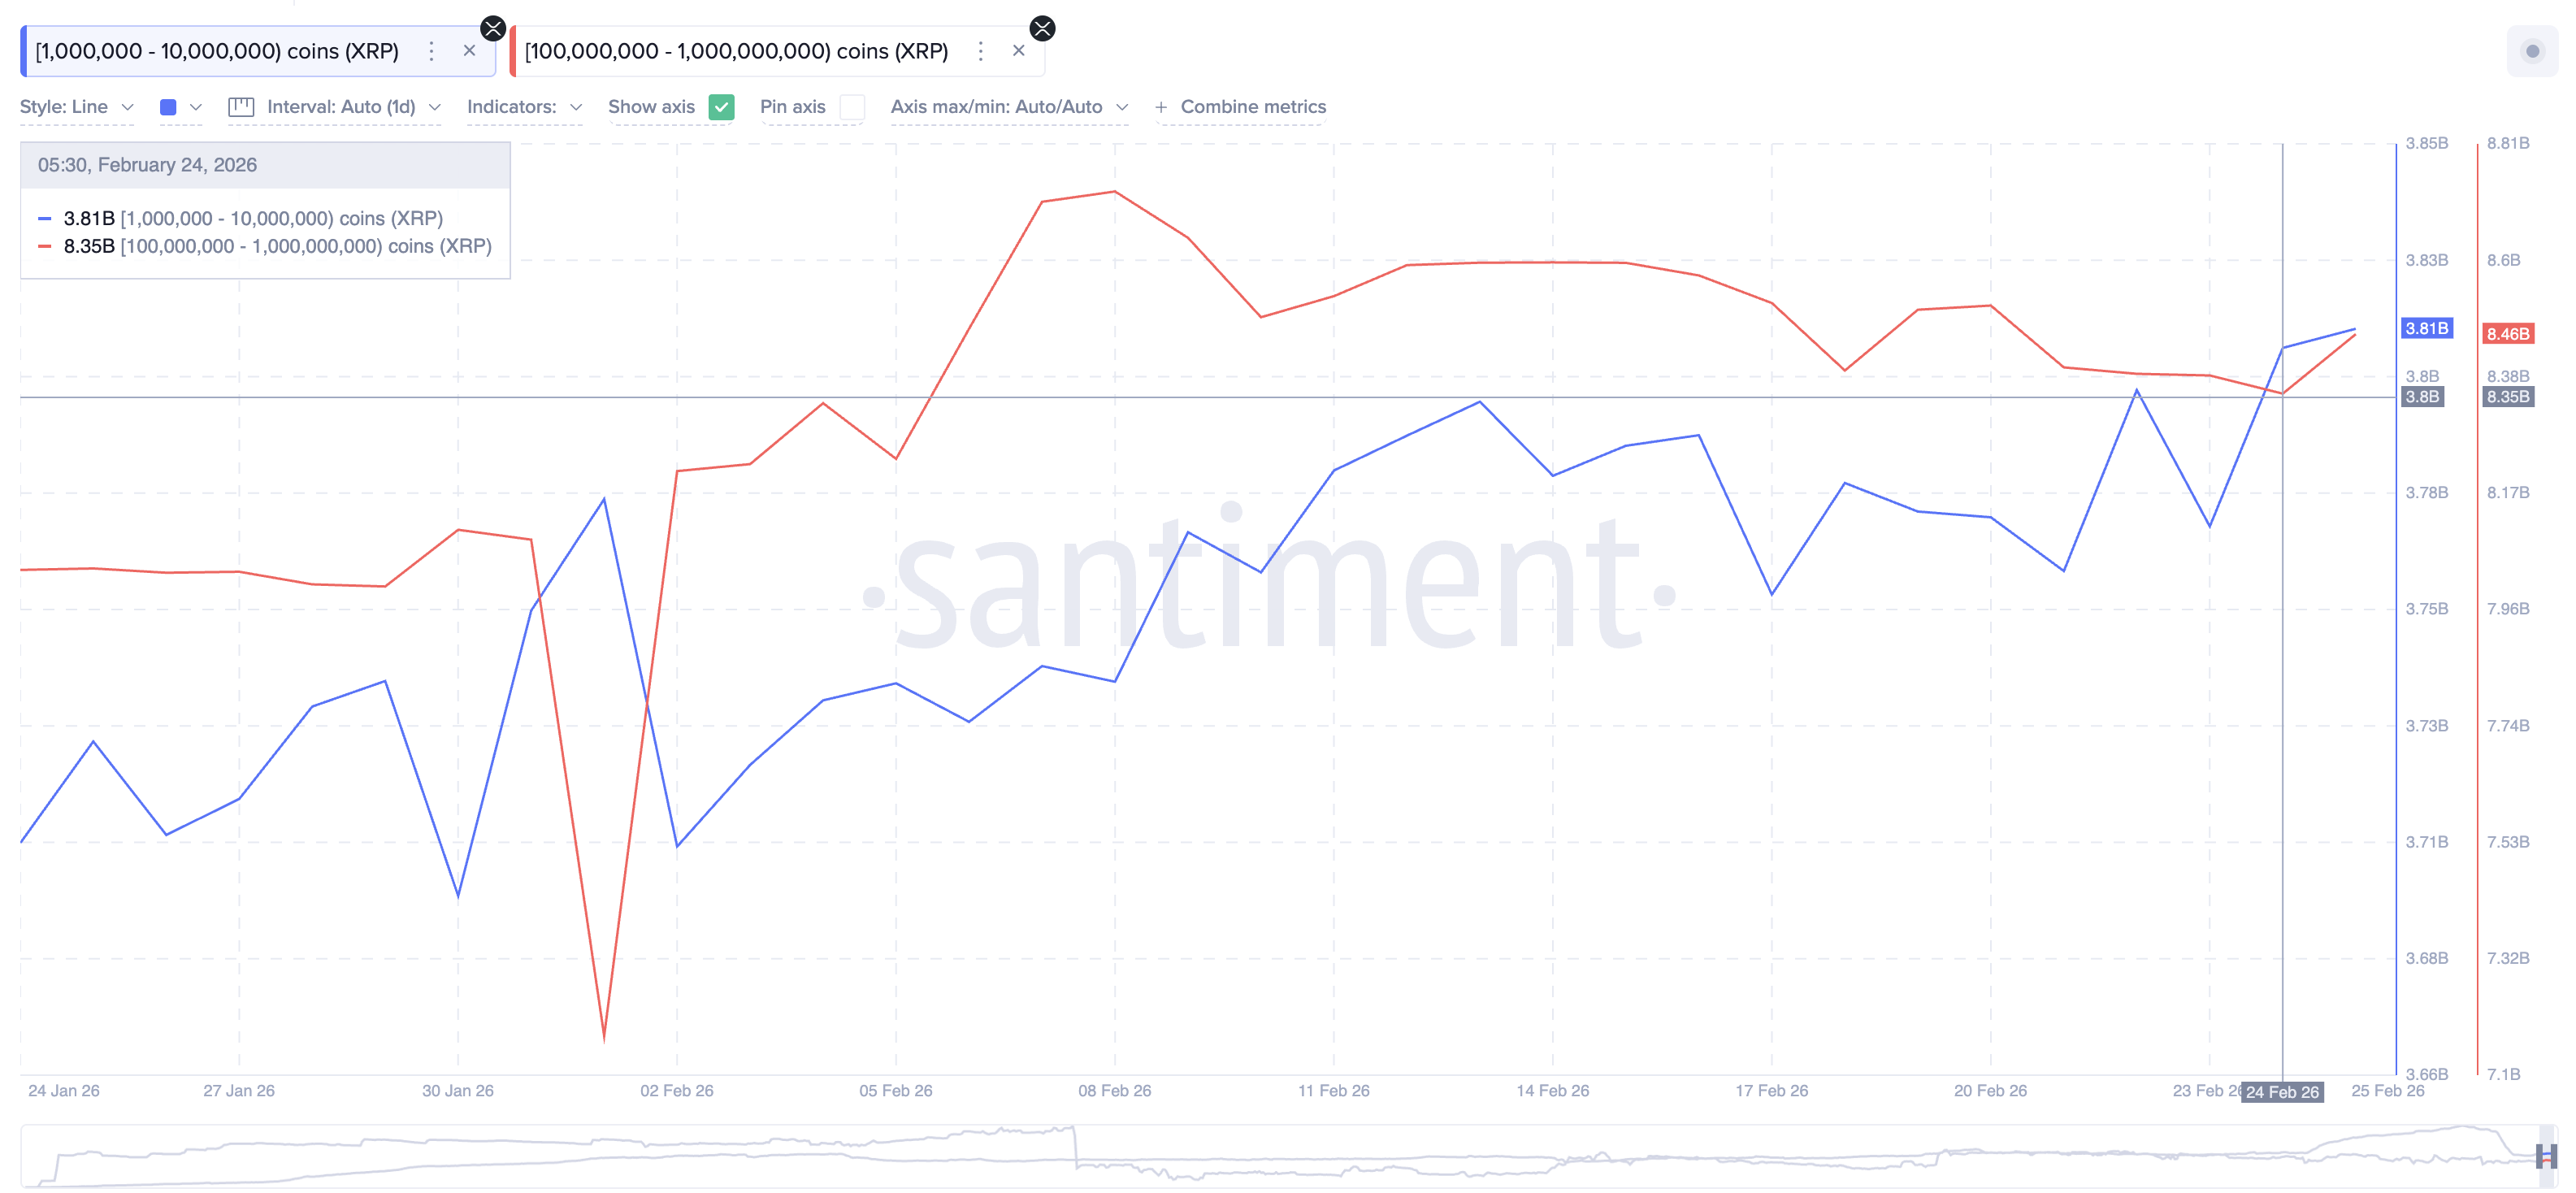
This means whales were not panic-selling. They were absorbing supply as traders exited positions.
This behavior often reflects positioning during periods of elevated market fear. It also increases the chances that breakdown continuation may remain limited unless whales begin selling.
XRP Price Now Approaches Another Breakdown Zone — But Trap Risk Remains High
XRP is now approaching another critical risk zone (the neckline), this time near $1.31 as another right shoulder forms. This level remains the most important support. If XRP breaks below $1.31 and holds below it, the bearish pattern, with another 20%+ breakdown path, could again get activated.
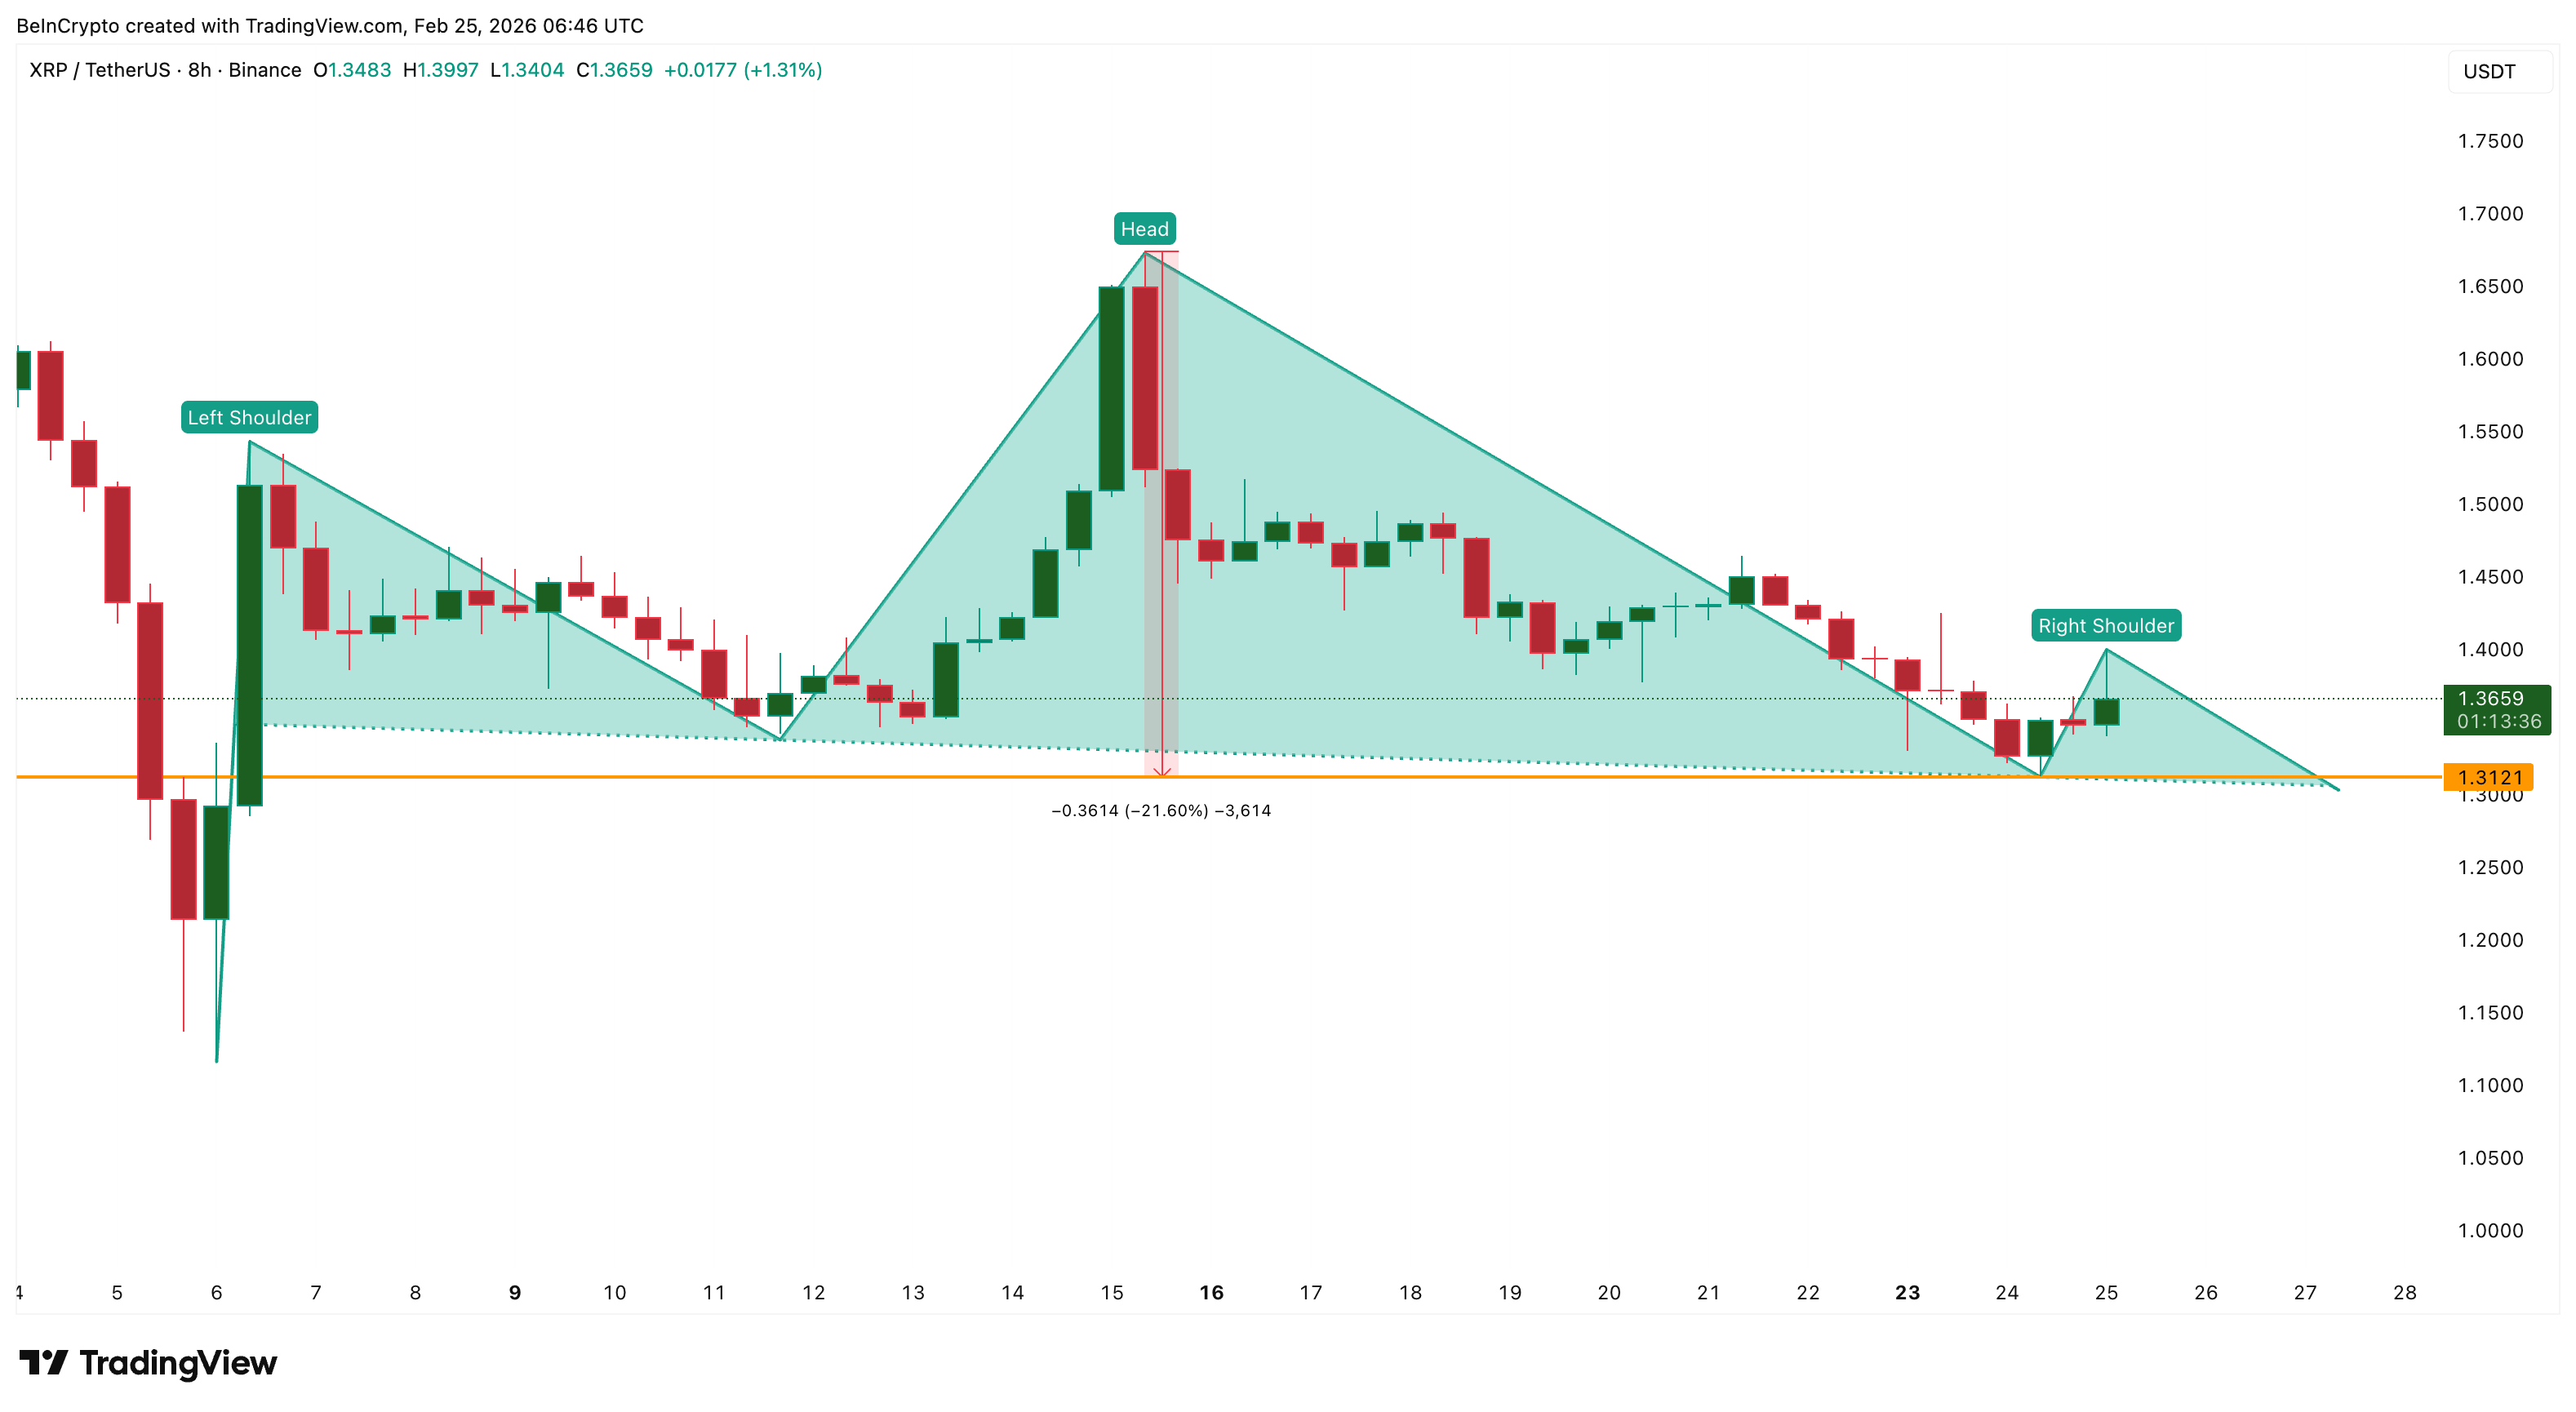
In that case, the next downside targets sit near $1.26 and $1.17, highlighted later. These levels align with key technical support zones.
However, recent trap behavior suggests another scenario is possible. If XRP briefly breaks below $1.31 but quickly recovers, it could trigger another short squeeze.
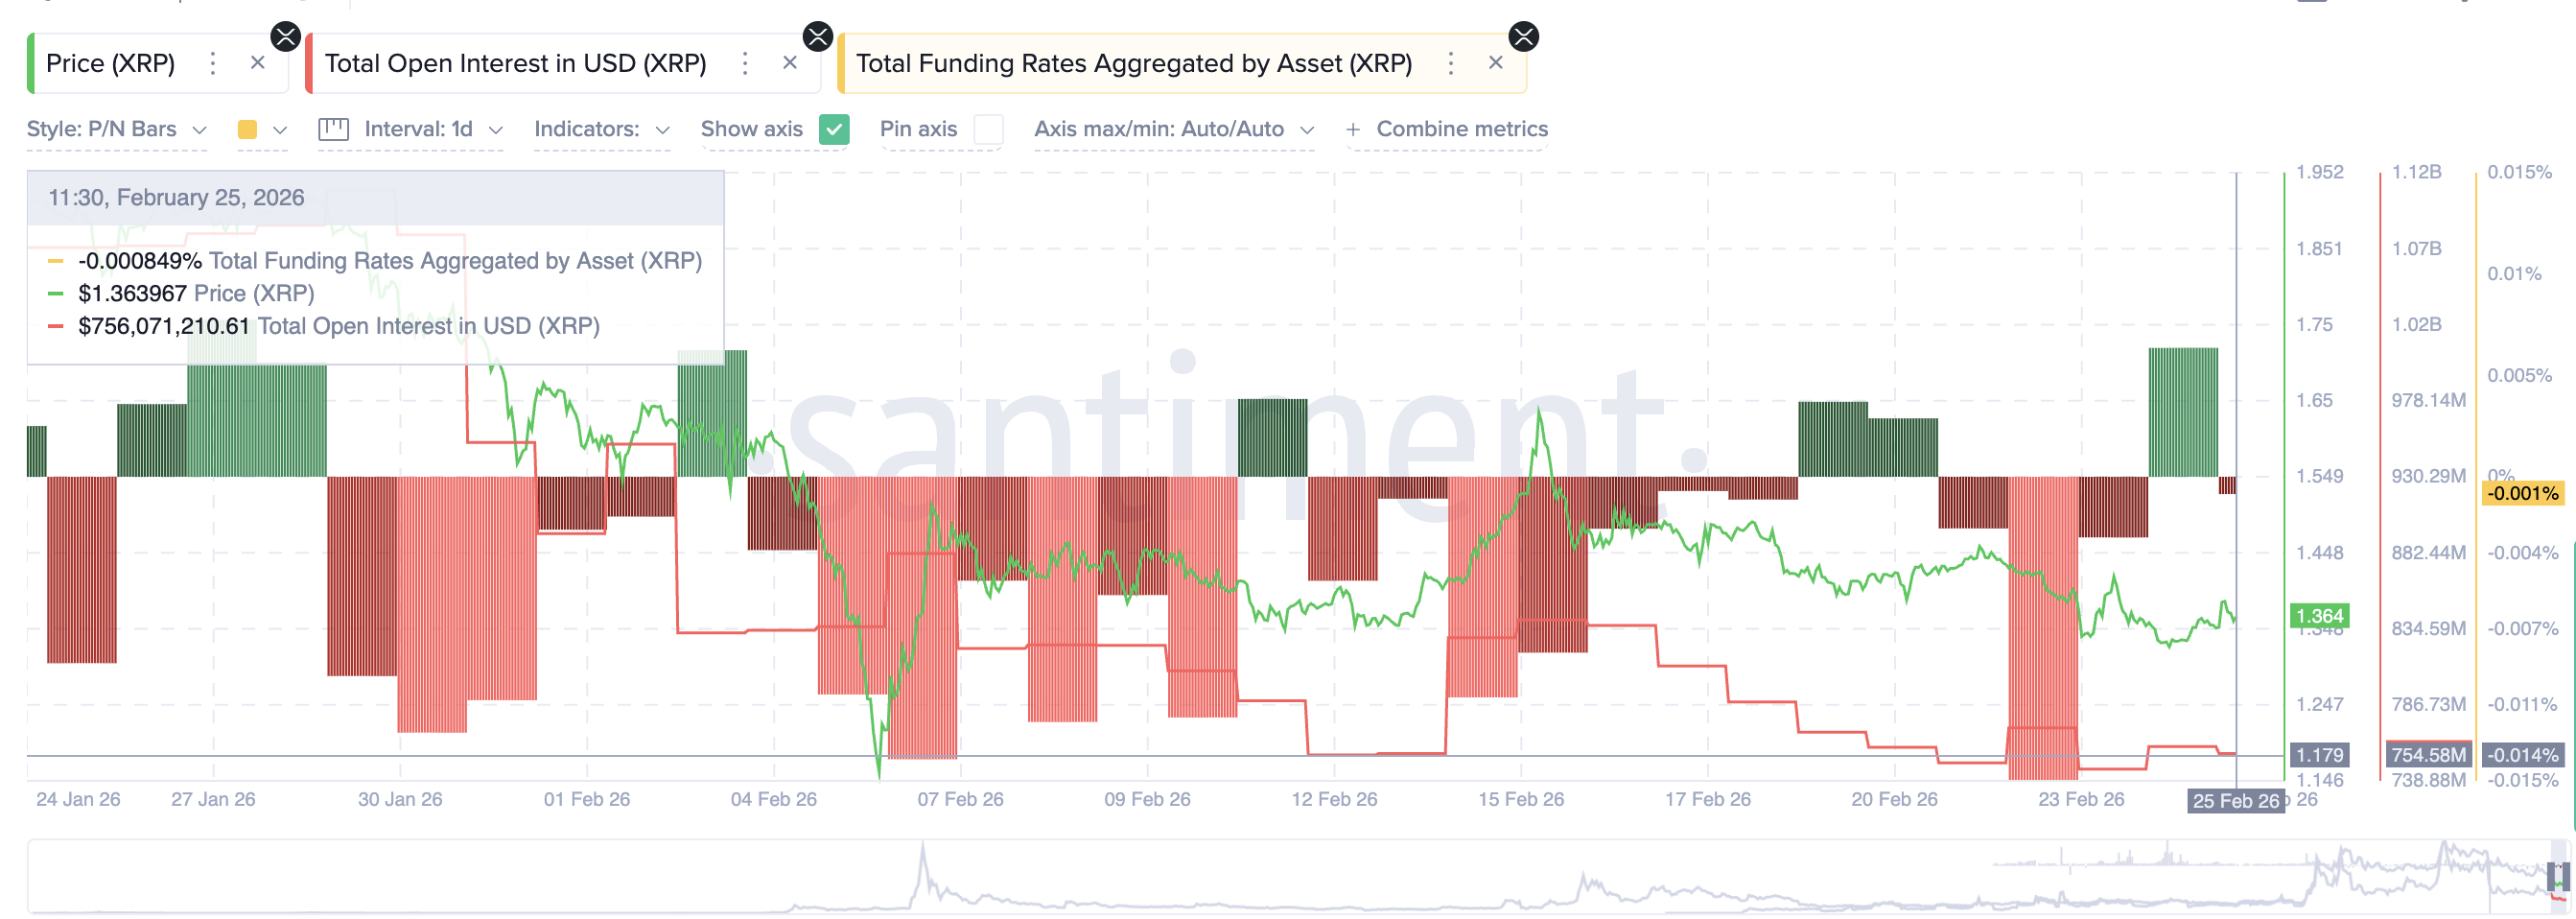
On the upside, reclaiming $1.40 would weaken the bearish setup. The trap may be forming, as open interest has risen again to $754 million, and funding rates have moved back into negative territory.
A move above $1.67 would fully invalidate the head-and-shoulders structure. Until either level breaks decisively, XRP may continue moving inside a trap-prone range. For now, the data shows a clear pattern.
A 20% breakdown projection attracted aggressive short positions. Open interest surged. Funding turned deeply negative. But whales accumulated 150 million XRP during the panic. This combination suggests XRP’s bearish breakdown may have acted more as bait than confirmation.
The next move will decide whether the pattern finally delivers its projected decline or becomes another trap in an increasingly volatile derivatives-driven market.


Decentralized finance protocol Aave has surpassed $1 trillion in cumulative lending volume, marking a historic first in the DeFi industry.
“A decade ago, DeFi and Aave didn’t exist. They were just ideas. Today, Aave stands as the backbone of onchain lending, powering a new financial system that is open, global, and unstoppable,” Aave Labs CEO Stani Kulechov said in an X post on Wednesday.
The feat marked another step toward Aave’s goal of becoming the “largest, most efficient liquidity network in the world,” Kulechov added. “One that builders, banks, and fintechs plug into by default, fundamentally improving liquidity and cost structures across global finance.”

In August, Aave Labs launched Aave Horizon, a new lending market on Ethereum, specifically for traditional finance firms and other institutional investors to borrow stablecoins against real-world assets.
VanEck, WisdomTree and Securitize were among the first participants to use Aave’s institutional offering.
On Feb. 15, Kulechov said DeFi lending could benefit from tokenizing “abundance assets,” like solar, batteries for energy storage and robotics for labor. He expects those assets to be worth a combined $50 trillion by 2050.
Kulechov originally launched Aave as ETHLend in November 2017 before rebranding to Aave in September 2018. It now secures over $27.2 billion in total value locked, enabling users to earn interest on deposits and borrow instantly using crypto as collateral.
Aave leads several prominent DeFi lending platforms in TVL, such as Morpho, JustLend, SparkLend, Maple, Kamin Lend and Compound Finance, each of which holds over $1 billion in total value locked.
Related: Tokenization without provenance is complicity
Aave has generated over $83.3 million in fees over the last 30 days, nearly four times that of its next-closest competitor, Morpho.
DAO proposal has caused division within Aave community
Aave’s milestone comes amid a protocol-wide feud over how much funding and revenue control Aave Labs should receive versus Aave’s decentralized autonomous organization.
Aave (AAVE) token holders have been asked to approve a package worth up to $42.5 million in stablecoins and 75,000 AAVE for Aave Labs.
In return, Aave Labs would route all revenue from Aave-branded products to the Aave DAO treasury under a DAO-funded operating model.
Magazine: A ‘tsunami’ of wealth is headed for crypto: Nansen’s Alex Svanevik


The crypto market cap rebounded 2.7% to $2.32 trillion on Wednesday after recovering some of the previous days’ losses as investors bought the dip.
Summary
- The crypto market recovered from Tuesday’s losses as institutional investors capitalized on the dip.
- A rally in tech stocks and improving geopolitical conditions have acted as a tailwind for risk assets like crypto.
Bitcoin (BTC), the industry’s primary bellwether, climbed 5.5% to hit an intraday peak of $66,233 before consolidating near $65,000, a level now serving as a vital psychological floor.
Ethereum (ETH) followed suit with a 4% rise, stabilizing around $1,900, while other major assets, including XRP, Tron (TRX), and Dogecoin (DOGE), recorded more modest gains between 1% and 3%.
Leading the large-cap pack, Solana (SOL) outperformed with a surge of nearly 7% and had successfully reclaimed the $80 threshold at the time of writing.
Crypto prices rebounded amid millions of liquidations across leveraged markets. Data from CoinGlass shows that around $154 million in short positions were liquidated across the futures market. Over the past 24-hour session, nearly $343 million was liquidated from the broader market, with the majority coming from short liquidations.
When short positions get liquidated, they force the exchange’s liquidation engine to buy back the underlying assets at current market prices to close out the positions, and thus result in an upward short squeeze that accelerates the price recovery.
Crypto market rebounds amid institutional dip buying
The crypto market recovery was primarily supported by investors buying into the recent dip.
Notably, Bitcoin plunged more than 7.5% yesterday, as it moved closer to the critical $60,000 support level. The move sparked a relief bounce, during which BTC successfully reclaimed the $65,000 threshold. The biggest tailwind for the jump was a surge in institutional buying spearheaded by Michael Saylor’s Strategy, which acquired additional BTC during the pullback.
Another key catalyst fueling the market rally came in the form of the Coinbase Premium becoming positive for the first time in 40 days. A positive reading on this metric means Bitcoin is more expensive on Coinbase than on global exchanges. Such a significant price gap is a classic signal of strong buying pressure from American investors and institutions.
As Bitcoin reclaimed the support that analysts believe is essential to avoid more downside volatility, the positive momentum rippled across the broader market.
Market rebound was supported by tech stocks rally
Crypto prices also rose after several Asian tech stocks rallied. South Korea’s KOSPI Index rose to record highs, signaling a broader risk-on sentiment among investors across global markets.
Major traditional U.S. stock indices, such as the S&P 500 and Russell 2000, also stood higher on the day. Cryptocurrencies often tend to rally when such equity markets show signs of strength and stability.
Meanwhile, the crypto market’s tight correlation with technology stocks remained evident, with software shares (IGV) rebounding nearly 1.7% over the past day after recent losses triggered by fears that generative AI tools could disrupt traditional software business models.
However, these concerns are easing as industry leaders like Intuit and DocuSign announce strategic partnerships with AI firm Anthropic, signaling that established companies may successfully adapt to the technology rather than being displaced by it.
Hopes of de-escalation in U.S. and Iran conflict
Another major catalyst for today’s rally is market hopes of a potential de-escalation of conflict between the U.S. and Iran. Reports cited that Iran’s deputy foreign minister has hinted that the country is looking to take any required step to reach a deal with the U.S., reducing fears of an imminent military conflict.
Earlier last Thursday, U.S. President Donald Trump had threatened to launch an attack within ten days from that time, spooking investors and reducing risk-on appetite.
With the latest positive headlines, investors are likely taking a breather as they await more clarity on the diplomatic front. As the geopolitical tensions eased, traditional safe-haven assets such as gold and crude oil lost the momentum they had been riding on, giving crypto assets the room to regain footing.
Disclosure: This article does not represent investment advice. The content and materials featured on this page are for educational purposes only.
Crypto World
Bitcoin Depot announces mandatory ID check for every crypto ATM transaction across U.S.


Bitcoin Depot has been implementing a new requirement across its crypto ATM network in the United States, and now requires users to provide identification for every transaction.
Summary
- Bitcoin Depot now requires identification for every transaction across its U.S. crypto ATM network.
- The rollout began in early February, with the company stating that continuous verification will help flag suspicious activity.
According to the official announcement, the new policy has been live since early February as it hopes to strengthen “safeguards against potential misuse.”
“By requiring identification for every transaction, the enhancement adds another layer of protection designed to help prevent account sharing, identity theft, and account takeover attempts as deployment continues,” the company said.
According to the firm’s CEO, Scott Buchanan, using continuous verification will help detect suspicious activity based on “customers, locations, or transaction amount.”
The mandate comes as Bitcoin Depot faces increased scrutiny from regulators. Earlier this month, the Massachusetts Attorney General Andrea Campbell sued the company for not implementing proper safeguards to prevent scams.
Bitcoin Depot was also targeted by Iowa Attorney General Brenna Bird last year for similar reasons.
According to data from Coin ATM Radar, Bitcoin Depot is the largest crypto ATM operator in the U.S., with 9,019 kiosks in operation. It first started implementing ID requirements in October, but the measure was limited to new users only.
Reports from the FBI and other third-party agencies have warned that bad actors have continued to misuse crypto ATMs to conduct fraud, impersonation scams, and other illicit transfers, often targeting elderly victims and pressuring them to convert cash into digital assets that are difficult to trace or recover. As a result, lawmakers across the U.S. have moved to tighten oversight.
Last year, Washington’s Spokane city implemented a ban on all crypto ATMs. Elsewhere, in North Dakota, a bill was introduced to implement daily transaction caps and mandatory fraud warnings. Nebraska has also taken similar steps.


Anchorage Digital, the federally chartered U.S. crypto bank, signaled deepening institutional conviction in Bitcoin by disclosing it holds perpetual preferred stock issued by Strategy on its balance sheet.
Summary
- Anchorage Digital disclosed holdings of Strategy’s Nasdaq-listed perpetual preferred stock (STRC), signaling strategic alignment with the leading corporate Bitcoin treasury firm.
- Strategy recently completed its 100th Bitcoin purchase, bringing total holdings to over 717,000 BTC and reinforcing its role in institutional Bitcoin accumulation.
- The move follows Anchorage’s $100 million equity investment from Tether and may support its broader strategic initiatives ahead of a potential IPO.
Anchorage Digital backs Strategy’s Bitcoin play with STRC bet
CEO Nathan McCauley framed the move as a meaningful alignment between the company that “operationalizes Bitcoin infrastructure” and the firm that has become synonymous with corporate Bitcoin accumulation.
McCauley posted on social platform X that the investment in STRC, Strategy’s perpetual preferred security, underscored conviction rather than casual interest in digital assets.
STRC is a Nasdaq-listed perpetual preferred security that pays an attractive annual dividend, roughly 11.25% before expenses, and is closely tied to Strategy’s Bitcoin treasury strategy.
Strategy, led by executive chairman Michael Saylor, has aggressively expanded its Bitcoin holdings through regular purchases funded by equity and preferred stock offerings. The firm recently marked its 100th Bitcoin acquisition, adding another 592 BTC and bringing its total to more than 717,000 coins, roughly 3% of all Bitcoin in circulation.
McCauley’s post was met with affirmation from Saylor himself, who echoed the sentiment that “conviction is contagious,” offering a rare glimpse into how significant institutional actors are positioning around Bitcoin beyond simple custodial services or trading exposure.
Anchorage Digital declined to disclose the size or timing of its holdings, but McCauley described the move as more than symbolic, suggesting that when a regulated crypto bank puts capital alongside the world’s largest dedicated corporate Bitcoin holder, it speaks to confidence in Bitcoin’s long-term relevance.
The bank’s move follows a $100 million equity investment from stablecoin issuer Tether and precedes Anchorage’s planned IPO.


Hong Kong will introduce sweeping reforms to strengthen its position as a global digital asset hub, Financial Secretary Paul Chan announced in his 2026-27 Budget speech, outlining new licensing rules, stablecoin approvals and tokenization initiatives.
Summary
- Hong Kong will introduce a bill this year to establish licensing regimes for digital asset dealers and custodians as part of its expanded regulatory framework.
- The government confirmed the first batch of fiat-referenced stablecoin issuer licenses will be granted next month, marking a key milestone in its crypto roadmap.
- Authorities will support tokenized bond issuance, enhance digital asset market liquidity, and implement the OECD’s Crypto-Asset Reporting Framework to boost tax transparency.
The government will table a bill this year establishing licensing regimes for digital asset dealing platforms and custodian service providers, expanding the city’s regulatory perimeter beyond exchanges.
The move follows Hong Kong’s second policy statement on digital assets, which aims to create what officials describe as a “comprehensive regulatory framework” for innovation and investor protection.
Chan also confirmed that Hong Kong has implemented a licensing regime for issuers of fiat-referenced stablecoins, with the first batch of licenses set to be issued next month. Authorities said they will work with approved issuers to explore compliant, risk-controlled use cases, signaling a shift from policy design to real-world deployment.
The Securities and Futures Commission (SFC) will take additional steps to deepen liquidity in the city’s digital asset market, particularly for professional investors. The regulator plans to broaden the range of products and services available and launch an accelerator program aimed at fast-tracking innovation within regulatory guardrails.
Tokenization is another key focus. The government will publish guidance clarifying that debenture holder registers can be maintained using distributed ledger technology, while exploring electronic signatures for bond issuance documents and the digitalization of bearer bonds.
In parallel, Hong Kong will amend its Inland Revenue Ordinance to implement the OECD’s Crypto-Asset Reporting Framework and updated Common Reporting Standard over the next two years. The changes, with a bill expected in the first half of this year, are designed to enhance tax transparency and combat cross-border tax evasion.
Together, the measures mark one of Hong Kong’s most comprehensive digital asset policy pushes to date, reinforcing its ambition to compete with major global crypto financial centers.
Ethereum co-founder Vitalik Buterin has added to a newly released roadmap outlining how Ethereum plans to dramatically speed up the production of new blocks and the confirmation of transactions.
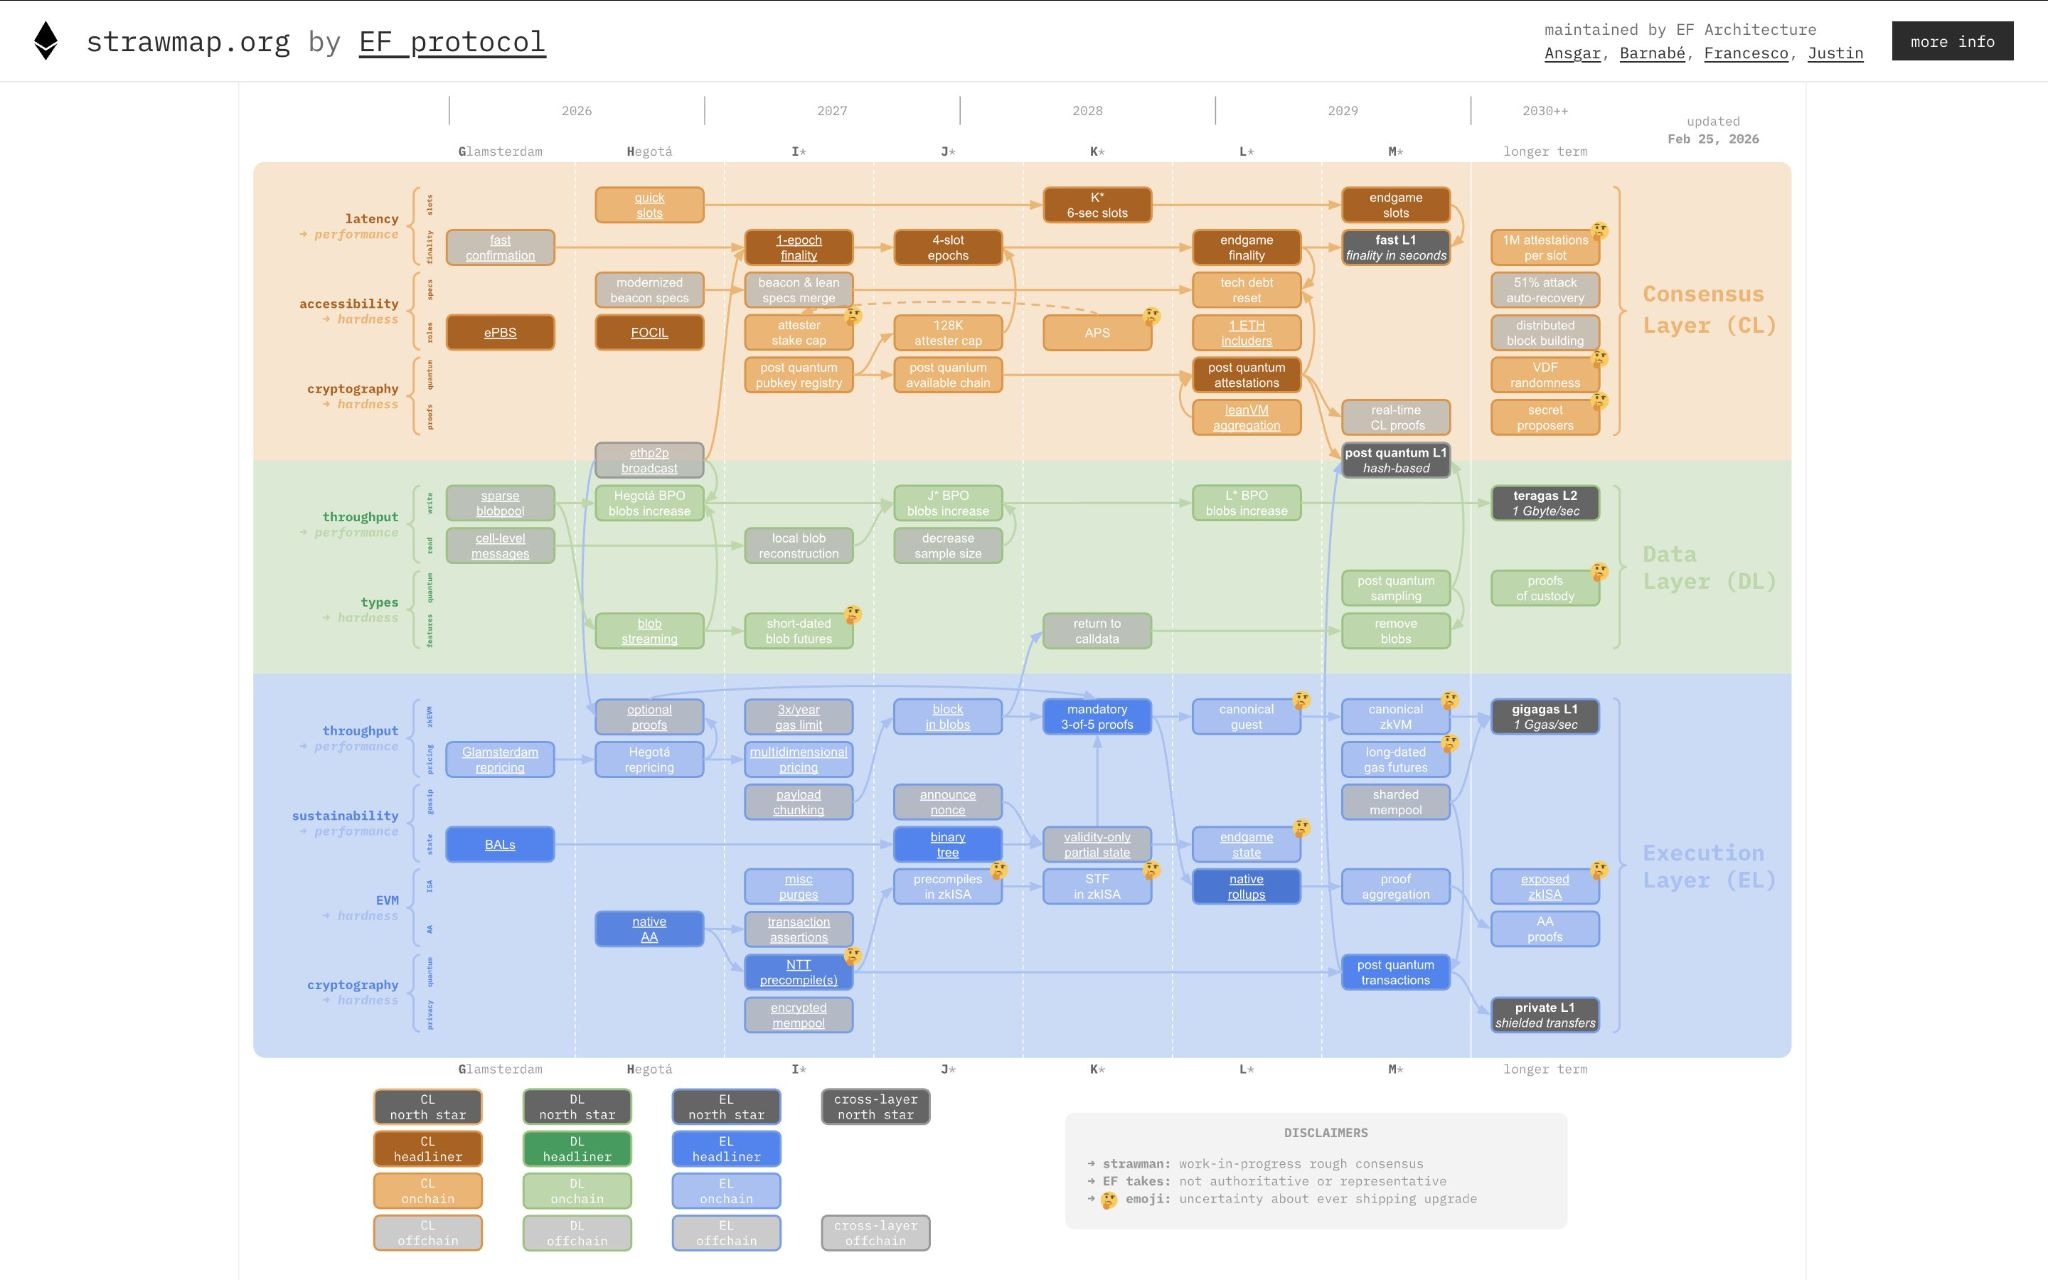
Vitalik’s comments on Thursday offered more detail on a visual public roadmap called “Strawmap” released by the Ethereum Foundation’s Protocol team.
“Fast slots are off in their own lane at the top of the roadmap, and do not really seem to connect to anything,” said Buterin, noting that the rest of the roadmap is “pretty independent of the slot time.”
Slot time is the time it takes for Ethereum to produce new blocks, currently around 12 seconds. The roadmap aims to get this down to as fast as 2 seconds, so the blockchain feels more like a live, responsive system rather than something that has to be waited for.
“I expect that we’ll reduce slot time in an incremental fashion,” said Buterin, suggesting reductions following a roughly square-root-of-two formula from 12 seconds down through 8, 6, 4, and eventually as low as 2 seconds.
He also suggested that p2p improvements, or upgrades to how Ethereum nodes communicate with each other — such as sharing new blocks and data without the need to download repeated data — can greatly reduce block propagation time, “making shorter slots viable with no security tradeoffs.”

Finality from minutes to seconds
The second major improvement in the roadmap is to finality, or the point at which a transaction is mathematically guaranteed to be irreversible, which is currently around 16 minutes.
The future goal is finality between 6 and 16 seconds, achieved by replacing the current complicated confirmation system with a cleaner, simpler one that’s also quantum-resistant.
Related: Ethereum Foundation lists ‘quantum readiness,’ gas limits as 2026 priorities
“The goal is to decouple slots and finality, to allow us to reason about both separately,” explained Buterin.
He said this was a “very invasive set of changes,” so the plan is to bundle the largest step in each change with a “switch of the cryptography, notably to post-quantum hash-based signatures.”
Quantum resistance of slots before finality
Buterin said that a consequence of this approach would be quantum-resistant slots before finality.
“One interesting consequence of the incremental approach is that there is a pathway to making the slots quantum-resistant much sooner than making the finality quantum-resistant.”
The network might “quite quickly” get to a regime where, if quantum computers suddenly appear, “we lose the finality guarantee, but the chain keeps chugging along,” he said.
“Expect to see progressive decreases of both slot time and finality time,” Buterin summarized.
The “component-by-component replacement” of Ethereum’s slot structure and consensus will produce a “cleaner, simpler, quantum-resistant, prover-friendly, end-to-end formally-verified alternative.”
The timescale for these changes is over the next four years, with seven forks planned roughly every six months. Glamsterdam and Hegotá are already confirmed and slated for later this year.
Magazine: Bitcoin may take 7 years to upgrade to post-quantum: BIP-360 co-author

Forum Markets, formerly ETHZilla (EXCHANGE: ETHZ), unveiled a comprehensive rebranding on Wednesday that signals a strategic departure from a crypto-treasury play toward tokenizing real-world assets on-chain. The company said it will operate under the Forum brand and will begin trading as FRMM (EXCHANGE: FRMM) once Nasdaq approves the ticker switch for market open next week. The move reflects a broader shift in the market as investors weigh the sustainability of crypto-backed balance sheets against regulated infrastructure that can support asset tokenization, governance transparency, and scalable on-chain settlement. The leadership frames the pivot as a move toward institutional-grade, on-chain products backed by real assets, governed by transparency, and delivered through regulated infrastructure.
The stock reaction on Wednesday offered a snapshot of investor sentiment: ETHZilla shares rose about 13% to close near $3.91, a move that underscored either relief or curiosity about the pivot. After-hours trading remained flat relative to the day’s close, signaling cautious enthusiasm rather than a sustained breakout. Year-to-date, the stock has fallen more than 20%, mirroring a broader rout in assets tied to digital markets and a disconnect between crypto prices and traditional equities.
The company’s evolution traces back to a bold bet on ether and tokenized assets. The entity originally acquired Ether (CRYPTO: ETH) holdings after extending its biotech roots into the crypto space around mid-2025. The strategy later evolved toward tokenized real assets, with a notable pivot announced in December to bring real-world assets on-chain through tokenization rather than maintaining a crypto-heavy treasury alone. This pivot laid the groundwork for tangible experiments in asset-backed tokenization, including ventures into tokenized aircraft assets.
Among the notable initiatives is Eurus Aero Token I, a token tied to two commercial jet engines leased to a major U.S. carrier. The engines are among the first tangible asset classes on Forum’s radar as it builds a platform intended to connect real-world assets with on-chain representation. The approach seeks to marry investor access to physical assets with the efficiency and transparency of blockchain-based issuance and settlement. The move also includes expanding the company’s asset register, with Ether holdings forming a historical base for its capitalization strategy and governance framework.
Industry observers have noted that the crypto-treasury concept, once a darling of speculative investors, has faced headwinds amid a broader downturn in crypto markets. As a result, Forum’s rebranding appears part of a larger trend toward tokenization firms seeking regulated, asset-backed exposure rather than concentrated bets on cryptocurrency prices. The strategy also aligns with market demand for governance structures and regulatory-compliant pathways to on-chain asset ownership, which could appeal to institutional participants wary of crypto volatility while still seeking on-chain liquidity and transparency.
The story of ETHZilla’s evolution—from biotech–crypto hybrid to a tokenization-focused platform—also reflects how market perception has shifted since the height of the crypto treasury trend. The company’s investor base has included notable names such as Peter Thiel’s Founders Fund, which had taken a stake in ETHZilla but subsequently exited amid the sector-wide reevaluation of crypto treasury holdings. That exit underscores the risk-reward calculus now guiding capital toward on-chain representations of real assets rather than pure crypto holdings.
As Forum Markets advances, the road ahead will hinge on regulatory clarity, Nasdaq’s approval of the FRMM ticker, and the platform’s ability to demonstrate scalable integrations with traditional financial markets. The company’s financials, asset mix, and partnerships will be closely watched for signs that tokenization can deliver predictable income streams and governance that investors can rely on within a regulated context. The pivot is ambitious, but it sits at the nexus of what many see as the future of capital markets: on-chain, asset-backed, and governed by transparent rules.
Key takeaways
- The rebrand marks a strategic shift from a crypto-treasury approach to a tokenization-focused platform aiming to connect traditional capital markets with blockchain-backed real assets.
- Forum Markets will trade under FRMM after Nasdaq approval, reflecting the company’s transition to a regulated, asset-backed model rather than a pure crypto-positioning strategy.
- Investor reaction was positive in the short term, with ETHZilla’s shares rising about 13% on the news, though the year-to-date performance remains negative amid broader crypto market volatility.
- The pivot encompasses tangible asset ventures, including Eurus Aero Token I tied to two jet engines leased to a U.S. air carrier, illustrating the real-world use case the company envisions for on-chain tokenization.
- Past investor dynamics—such as the exit of notable backers like Founders Fund—highlight evolving risk assessments as markets shift toward regulated asset-backed on-chain structures.
Tickers mentioned: $ETH, $FRMM, $ETHZ
Sentiment: Neutral
Price impact: Positive. The rebrand news drove ETHZilla shares up about 13% intraday, signaling initial investor optimism about the strategic pivot.
Market context: The move comes as crypto equities face volatility and a broader reassessment of crypto-treasury strategies, with a growing interest in tokenization of real-world assets as a potential hedge against crypto price swings and as a path to regulated, on-chain liquidity.
Why it matters
The Forum Markets transformation is significant because it signals a broader shift in how market participants view on-chain access to real assets. Tokenization promises to unlock liquidity for otherwise illiquid assets, provided there is a robust governance and regulatory framework. If Forum can demonstrate scale, transparent custody, and reliable on-chain settlement for assets like engines or other tangible collateral, it could provide a template for other asset-backed token offerings, attracting institutional capital that has remained cautious about direct crypto exposure.
The narrative around real-world asset (RWA) tokenization is gaining traction as a way to marry the efficiency and transparency of blockchain with the familiar governance structures of traditional markets. Forum’s emphasis on regulated infrastructure and on-chain governance aims to address concerns about custody, valuation, and compliance that have historically limited institutional participation in tokenized assets. While the path to broad adoption remains uncertain, the company’s approach aligns with investor interest in assets that combine on-chain accessibility with real-world collateral and governed frameworks.
On a practical level, the Jet Engine token and other RWAs under development could serve as early proofs of concept for what tokenized asset markets can look like in the near term. However, the sector’s success will depend on regulatory clarity, the demonstration of credible risk controls, and the ability to deliver consistent, scalable tokenization that adheres to traditional financial standards. Forum’s leadership has framed the pivot as a deliberate move to build institutional-grade products, which could attract larger clients if the platform proves capable of meeting stringent due diligence and reporting requirements.
What to watch next
- Nasdaq approval and the market open date for the FRMM ticker, signaling the formal transition to Forum Markets’ new branding and platform focus.
- Progress and governance milestones around Eurus Aero Token I and other RWAs, including third-party audits and asset-backed valuation disclosures.
- Updates on partnerships or client onboarding that demonstrate real-world use cases for tokenized assets within regulated ecosystems.
- Regulatory developments related to tokenized assets and on-chain infrastructure that could impact custody, settlement, and reporting requirements.
- Subsequent trading performance of FRMM and any material changes in the company’s asset mix or financing structure.
Sources & verification
- Official press release announcing ETHZilla’s rename to Forum Markets and the FRMM ticker transition.
- Details on Eurus Aero Token I and the tokenization of two commercial jet engines.
- CoinGecko data on ETH holdings and ETHZilla’s ranking as a corporate holder of Ether.
- Cointelegraph coverage of ETHZilla’s pivot, including discussions of Founders Fund’s stake adjustments.
- Public market data showing Wednesday’s stock move to about $3.91 and after-hours trading behavior.
What the story means for investors and the market
Forum Markets’ rebranding to FRMM and its pivot toward real-world asset tokenization could shape how investors assess crypto-linked equities. If the company can demonstrate credible asset backing, regulatory compliance, and scalable on-chain processes, it may attract institutional participants seeking regulated exposure to tokenized assets rather than pure crypto bets. The path requires navigating the complexities of asset valuation, custody, and governance, but the potential payoff—broader market liquidity for tangible assets via on-chain tools—could be meaningful for the trajectory of tokenization across traditional markets.
What to watch next
- Nasdaq approval and FRMM trading start date
- Progress on Eurus Aero Token I and other RWAs
- Regulatory guidance impacting on-chain asset tokenization
- Institutional partnerships and asset pipelines announced by Forum

TLDR
- 21Shares has listed the STRC ETP on Euronext Amsterdam under the ticker STRC NA.
- The product gives European investors exposure to Strategy’s preferred stock linked to its Bitcoin treasury.
- Strategy currently holds 717,722 BTC valued at about $47 billion dollars.
- The preferred stock offers a variable dividend set at an annualized rate of 11.25%.
- 21Shares designed the ETP to allow access through standard brokerage accounts.
21Shares has launched a new exchange-traded product that gives European investors exposure to Strategy’s preferred stock. The product trades under the ticker STRC NA on Euronext Amsterdam. The listing expands access to Strategy’s Bitcoin-backed yield structure through a regulated exchange vehicle.
The company will list the 21Shares Strategy Yield ETP on Thursday. It will offer both institutional and retail investors access through standard brokerage accounts.
21Shares structured the product to track Strategy’s Variable Rate Series A Perpetual “Stretch” Preferred Stock. The firm designed the wrapper to simplify access to the underlying preferred shares.
Strategy holds 717,722 BTC in its corporate treasury. The holdings carry a market value of about $47 billion.
The preferred stock offers a variable dividend set at an annualized rate of 11.25%. The dividend links to Strategy’s Bitcoin treasury operations.
21Shares said the ETP acts as a cash-flow bridge between traditional finance and digital assets. The firm aims to combine equity exposure with crypto-linked yield.
Strategy, STRC ETP Expands Bitcoin-Linked Equity Access
21Shares confirmed that the STRC ETP provides exposure to Strategy’s preferred equity rather than direct Bitcoin ownership. The product references the same income stream tied to Strategy’s Bitcoin reserves. However, investors access it through an exchange-traded structure. The listing takes place on Euronext Amsterdam under the ticker STRC NA.
The company stated that the structure removes the need to purchase the preferred shares directly. As a result, investors can trade the instrument through conventional brokerage platforms. The firm said the wrapper increases operational ease for European market participants. It also aligns the product with existing exchange standards.
21Shares President Duncan Moir addressed the launch in a company statement. He said, “By combining high income potential with a familiar exchange-traded structure, STRC offers both institutional and retail investors an efficient and accessible way to add yield to their portfolios.”
Moir added that the product marks the company’s first equity-linked instrument. He said it extends the firm’s digital asset expertise into equity exposure tied to the Bitcoin ecosystem.
21Shares Broadens Product Suite Across Europe and the US
21Shares has operated since 2018 and manages about $5.3 billion in assets. The firm oversees 60 ETPs listed across 13 exchanges as of Monday.
The company continues to expand its global footprint through new listings. It launched the 21Shares Spot SUI ETF under the ticker TSUI on Nasdaq this week.
The new US listing follows a series of recent exchange-traded launches. The firm has focused on regulated crypto-linked products for institutional and retail investors.
21Shares described the Strategy yield product as part of its broader access strategy. The company said it seeks to provide straightforward exposure to digital asset markets.
Moir stated, “Since our inception, we have focused on providing straightforward access to digital assets.” He added that the new product extends that approach into equity-linked exposure tied to Strategy’s Bitcoin treasury.

TLDR:
- Bitcoin faces continued structural pressure amid inactive stablecoin liquidity.
- Stablecoin Supply Ratio shows negative readings across short, medium, and long-term oscillators.
- Price rebounds struggle as capital remains in stablecoins instead of spot exposure.
- Market shift depends on renewed stablecoin demand, not short-term price momentum.
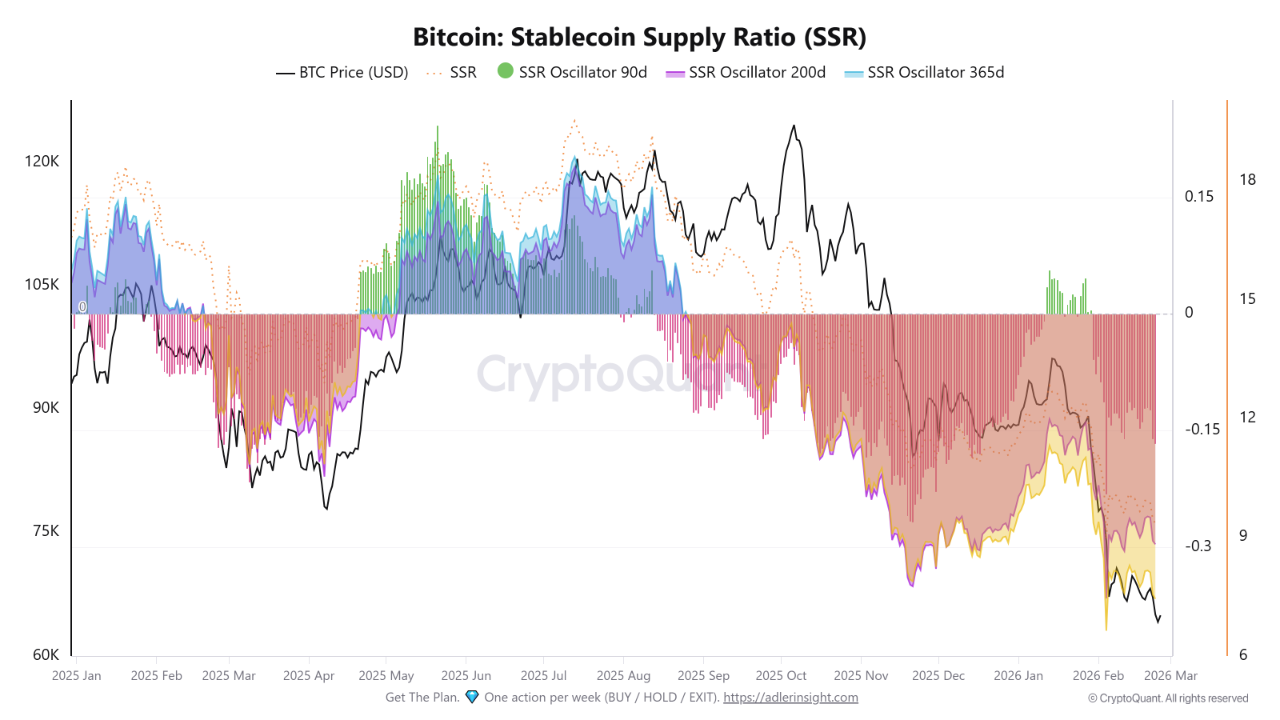
Bitcoin continues to trade under structural pressure, with the Stablecoin Supply Ratio (SSR) remaining negative across 90-day, 200-day, and 365-day oscillators.
Following a peak above $120,000 mid-year, Bitcoin’s price shifted from expansion to contraction, producing successive lower highs into late Q4 and early Q1.
The break below the zero line signaled a structural change in liquidity, reflecting deeper market conditions rather than temporary fluctuations.
Stablecoin Supply Remains Dormant Despite Available Capital
A compressed SSR indicates that stablecoin supply is large compared to Bitcoin’s market capitalization. During expansion phases, rising oscillator readings signal capital moving from stablecoins into Bitcoin, supporting upward momentum.
Currently, stablecoin liquidity exists but remains largely inactive, failing to convert into spot exposure.
The negative SSR across all timeframes suggests that defensive positioning dominates the market. Investors appear hesitant, even as substantial capital remains ready to deploy.

Source: Cryptoquant
This creates a divergence where available liquidity does not translate into buying pressure or price support.
Earlier in the year, positive oscillator readings correlated with strong price structure and controlled volatility. Sustained upside movement occurred as stablecoin demand actively entered Bitcoin, reinforcing momentum. The current absence of such behavior demonstrates passive liquidity conditions.
Downside Volatility Persists Amid Limited Demand
Following the rollover of SSR readings across short, medium, and long-term oscillators, downside volatility has increased.
Price rebounds have lacked follow-through, reflecting insufficient absorption of supply during corrective phases. This trend shows that market participants are not actively deploying stablecoin capital to stabilize Bitcoin.
Historical on-chain data shows extended negative SSR regimes often precede larger inflection points. However, confirmation requires changes in investor behavior and renewed stablecoin deployment.
Without this, the market may continue under structural pressure, as liquidity remains passive despite readiness.
Market observers note that the next meaningful shift in Bitcoin will likely coincide with renewed stablecoin demand rather than purely price-driven momentum.
The system’s current configuration emphasizes the need for capital rotation to support price recovery. Recent market commentary also reflects the cautious stance of investors waiting for clearer signals.


The International Monetary Fund said Wednesday that US inflation will not return to the Federal Reserve’s 2% target until early 2027.
The assessment, part of the IMF’s first Article IV review of the Trump administration, signals that meaningful rate relief remains distant despite the president’s optimism.
IMF Flags Fiscal Risks
IMF Managing Director Kristalina Georgieva told reporters the US current account deficit is “too big.” The Fund estimates it at 3.5% to 4% of GDP in the near term.
But the IMF’s prescription clashes with the administration’s approach. Nigel Chalk, the Fund’s Western Hemisphere Director, said fiscal consolidation — not tariffs — is the best path to narrowing the deficit. The recommendation comes after the Supreme Court struck down Trump’s broad emergency tariffs as illegal, forcing the administration to invoke Section 122 of the Trade Act of 1974 for replacement levies.
The fiscal picture is stark. The IMF projects US federal deficits will remain between 7% and 8% of GDP in the coming years. That is more than double the levels targeted by Treasury Secretary Scott Bessent. Consolidated government debt is on track to reach 140% of GDP by 2031.
“The upward path for the public debt-GDP ratio and increasing levels of short-term debt-GDP represent a growing stability risk to the US and global economy,” the Fund warned.
Trump’s Rate Optimism vs. Structural Reality
The IMF review landed one day after Trump’s State of the Union address, where the president painted a rosy picture on borrowing costs. He claimed mortgage rates had hit four-year lows and that annual mortgage costs had dropped nearly $5,000 since he took office. He framed lower rates as the solution to what he called the “Biden-created housing problem.”
Yet the IMF’s numbers tell a different story. With inflation not reaching the Fed’s target until 2027 and fiscal deficits running at twice the administration’s own goals, the structural case for higher-for-longer rates is strengthening. The Fund pegged 2026 US growth at a resilient 2.4%, leaving the Fed little urgency to ease.
What It Means for Crypto
The implications for risk assets are clear. Sticky inflation and an expanding fiscal deficit reduce the probability of aggressive rate cuts this year. For crypto markets, which rallied on rate-cut expectations through late 2025, the IMF’s assessment reinforces caution.
The deeper irony is that the administration’s own fiscal expansion — including what the IMF notes are historically large tax cuts — is the primary driver of the deficit that keeps rates elevated. Trump wants lower rates but is pursuing policies that structurally prevent them.
The IMF stopped short of predicting a crisis, noting that “the risk of sovereign stress in the US is low.” But the trajectory it describes — rising debt, persistent deficits, delayed disinflation — points to an environment where rate relief comes slowly, if at all.

Aave Notches $1T in Lending Volume, an Industry First

Man United’s stunning saving after Alejandro Garnacho and Marcus Rashford decisions

The AirPods Pro 3 Are $20 Off


-

 Video6 days ago
XRP News: XRP Just Entered a New Phase (Almost Nobody Noticed)
-

 Politics4 days ago
Baftas 2026: Awards Nominations, Presenters And Performers
-

 Fashion5 days ago
Weekend Open Thread: Boden – Corporette.com
-

 Sports2 days ago
Women’s college basketball rankings: Iowa reenters top 10, Auriemma makes history
-

 Politics2 days ago
Nick Reiner Enters Plea In Deaths Of Parents Rob And Michele
-
 Sports7 days ago
Clearing the boundary, crossing into history: J&K end 67-year wait, enter maiden Ranji Trophy final | Cricket News
-

 Crypto World2 days ago
XRP price enters “dead zone” as Binance leverage hits lows
-

 Business4 days ago
Mattel’s American Girl brand turns 40, dolls enter a new era
-

 Business3 days ago
Law enforcement kills armed man seeking to enter Trump’s Mar-a-Lago resort, officials say
-

 Tech1 day ago
Unsurprisingly, Apple's board gets what it wants in 2026 shareholder meeting
-
 NewsBeat5 hours ago
Manchester Central Mosque issues statement as it imposes new measures ‘with immediate effect’ after armed men enter
-

 NewsBeat3 hours ago
Cuba says its forces have killed four on US-registered speedboat | World News
-
 NewsBeat3 days ago
‘Hourly’ method from gastroenterologist ‘helps reduce air travel bloating’
-

 Tech3 days ago
Anthropic-Backed Group Enters NY-12 AI PAC Fight
-

 NewsBeat3 days ago
Armed man killed after entering secure perimeter of Mar-a-Lago, Secret Service says
-

 Business1 day ago
True Citrus debuts functional drink mix collection
-

 Politics4 days ago
Maine has a long track record of electing moderates. Enter Graham Platner.
-
 NewsBeat1 day ago
Police latest as search for missing woman enters day nine
-

 Crypto World1 day ago
Entering new markets without increasing payment costs
-
 Sports3 days ago
2026 NFL mock draft: WRs fly off the board in first round entering combine week