
Crypto World
YouTube Views are About to Explode, But Your Money Won’t



YouTube will count a view the moment a video starts playing from August 24. There is no minimum watch time. The rule covers uploads, Shorts, and live streams worldwide.
Public view totals will climb fast. However, the number that decides pay moves into a submenu that most creators never open. For anyone not yet monetized, the bar is about to get higher.
Follow us on X to get the latest news as it happens
The Old Standard Becomes “Engaged Views”
YouTube is not deleting the old count. It is renaming it. The stricter method now sits in YouTube Analytics under Advanced Mode, labeled Engaged views.
Shorts went first. YouTube switched Shorts to the play-based standard last year and kept the tighter version for payouts. It is now copying that split to every other format.
The volume being recounted is enormous. CEO Neal Mohan put average daily Shorts views at 200 billion in a January letter.
YouTube defines the metric that actually matters in its own documentation.
the viewer stayed to watch past the initial seconds, and does not include any loops
Not every play makes that cut. Loops do not count. Nor do private uploads, unlisted uploads, deleted videos, or clips watched as ads.
YouTube has never published a hard threshold for long-form video. The Monday announcement does not add one. Creators have guessed at these rules for years, much like the platform engagement myths that spread on X (Twitter).
Why Creator Pay Does Not Move
Money still runs on strict numbers. Long-form and live pay are based on engaged watch hours. Shorts pay is based on engaged Shorts views.
Both live in Advanced Mode. Neither changes next Monday. A channel could post a much bigger view count in September and earn exactly the same.
The stakes are large. YouTube ads brought in $11.06 billion last quarter, up 13% from a year earlier, according to Alphabet’s results from big tech earnings week.
YouTube says it has paid creators and partners more than $100 billion over four years.
YouTube also says this change leaves Partner Program eligibility alone. That is true of this change.
A second announcement, published two weeks earlier, does move the bar. From February 1, 2027, new applicants will need 8,000 qualified watch hours over 365 days, YouTube said in an update. The Shorts route rises to 20 million qualified views over 90 days.
Both figures double today’s requirements of 4,000 hours and 10 million views. The 1,000-subscriber minimum stays. Creators already inside the program are not affected.
What the Split Means for Sponsorship Deals
YouTube tied the view change to brand deals in its Monday announcement. Consistent counting, it argued, helps creators show sponsors their real reach.
That argument cuts both ways. An inflated public figure is easier to pitch. It is also easier for an experienced media buyer to discount.
Expect sponsors to start asking for Advanced Mode screenshots. Creators who cannot produce them may find the headline number counts for less than they did.
Some rivals skip the measurement problem entirely. Rumble added Bitcoin tipping for creators, paying channels straight from their audience.
Two clocks are now running. The public number inflates on August 24. The bar that pays doubles on February 1, 2027. Creators still outside the program have until February to qualify under the lower one.
The post YouTube Views are About to Explode, But Your Money Won’t appeared first on BeInCrypto.



Deel said on Aug. 17 that its DLUSD stablecoin wallet is live in more than 80 countries, 11 weeks after a launch limited to Argentina. The expansion routes a payroll platform that processes $22 billion a year into distributing dollar balances to contractors in markets where local banks make dollar… Read the full story at The Defiant
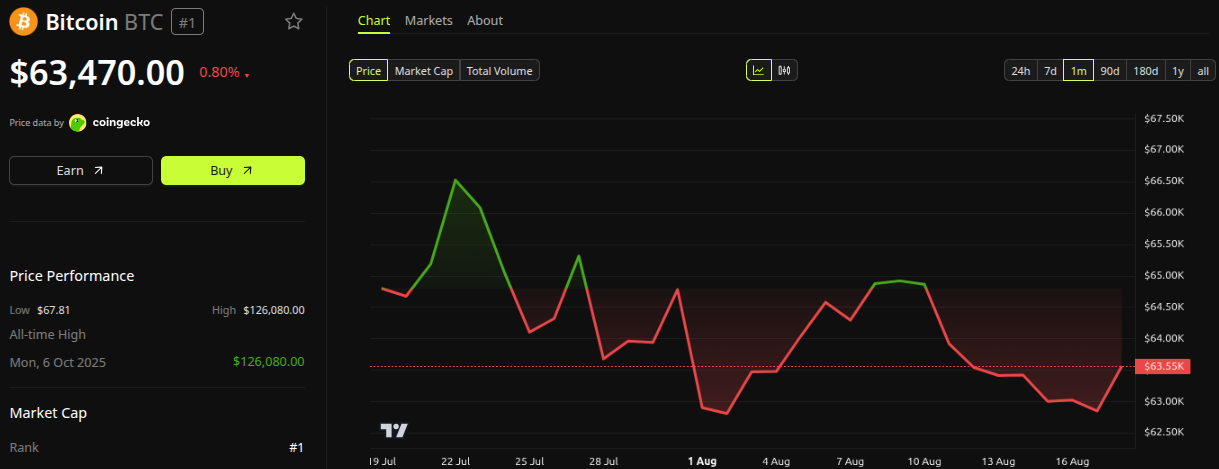
The US private credit market, valued at over $2 trillion, is flashing stress signals not seen since 2017, raising the question of what deteriorating loans could mean for Bitcoin.
The connection runs through liquidity and risk sentiment rather than any direct exposure between the two markets.
The Stress Signals Building in US Private Credit
Non-accrual loans are credits in which the borrower has stopped making payments or in which default is likely. That metric just hit a multi-year high.
The Financial Times reported the figures, based on Solve data. Non-accrual loans reached a median of 2.8% of cost across the twenty largest listed US Business Development Companies during the second quarter.
That level compares with late March, when the same measure sat near 2%. It marks the highest reading in nearly a decade, comparable to stress triggered by the 2017 oil price collapse.
Redemption pressure compounds the picture. Some funds received withdrawal requests reaching 40% of net asset value, though most gates limit quarterly redemptions to 5%.
“…In the old days a bad loan slid in plain sight. 100 cents, then 95, then 90, then 70. Everyone saw it coming. Now there is no warning. A loan is marked at 100 one month and zero the next. Lights out. That is why the redemptions are starting. Investors are finally asking what they actually own. And because this is where all the marginal credit in the economy now flows, if it seizes, the crunch does not stay contained…,” Jeffrey P. Snider noted on X.
Follow us on X to get the latest news as it happens.

Payment-in-kind arrangements are also expanding. That structure lets borrowers pay interest with more debt rather than cash, often signaling underlying repayment strain.
Fitch data adds another layer. Default rates touched recent highs, with stress concentrating in software, which is vulnerable to AI disruption, and healthcare.
Elevated US interest rates and a still-resilient domestic economy form the backdrop. Regulators have not flagged any imminent systemic risk, and several managers continue to publicly downplay the episode.
Why This Could Cut Both Ways for Bitcoin
Private credit stress does not directly affect Bitcoin. The impact comes through market risk and liquidity.
If defaults rise and investors become nervous, they may sell liquid assets to raise cash. Bitcoin can be hit quickly because it trades 24/7 and is easy to sell through both crypto markets and ETFs. That makes worsening credit stress a short-term risk for BTC.
The picture can change if the problem becomes serious enough to slow the US economy. A broader credit crunch could push the Federal Reserve toward rate cuts or other measures that increase liquidity.
That would generally be more supportive for Bitcoin.

So the key takeaway is simple. Worsening private credit stress could pressure BTC first. If it later forces the Fed to ease monetary policy, the same stress could become a positive catalyst for Bitcoin.
The post US Private Credit Stress Hits 2017 High: Why It Matters for Bitcoin? appeared first on BeInCrypto.
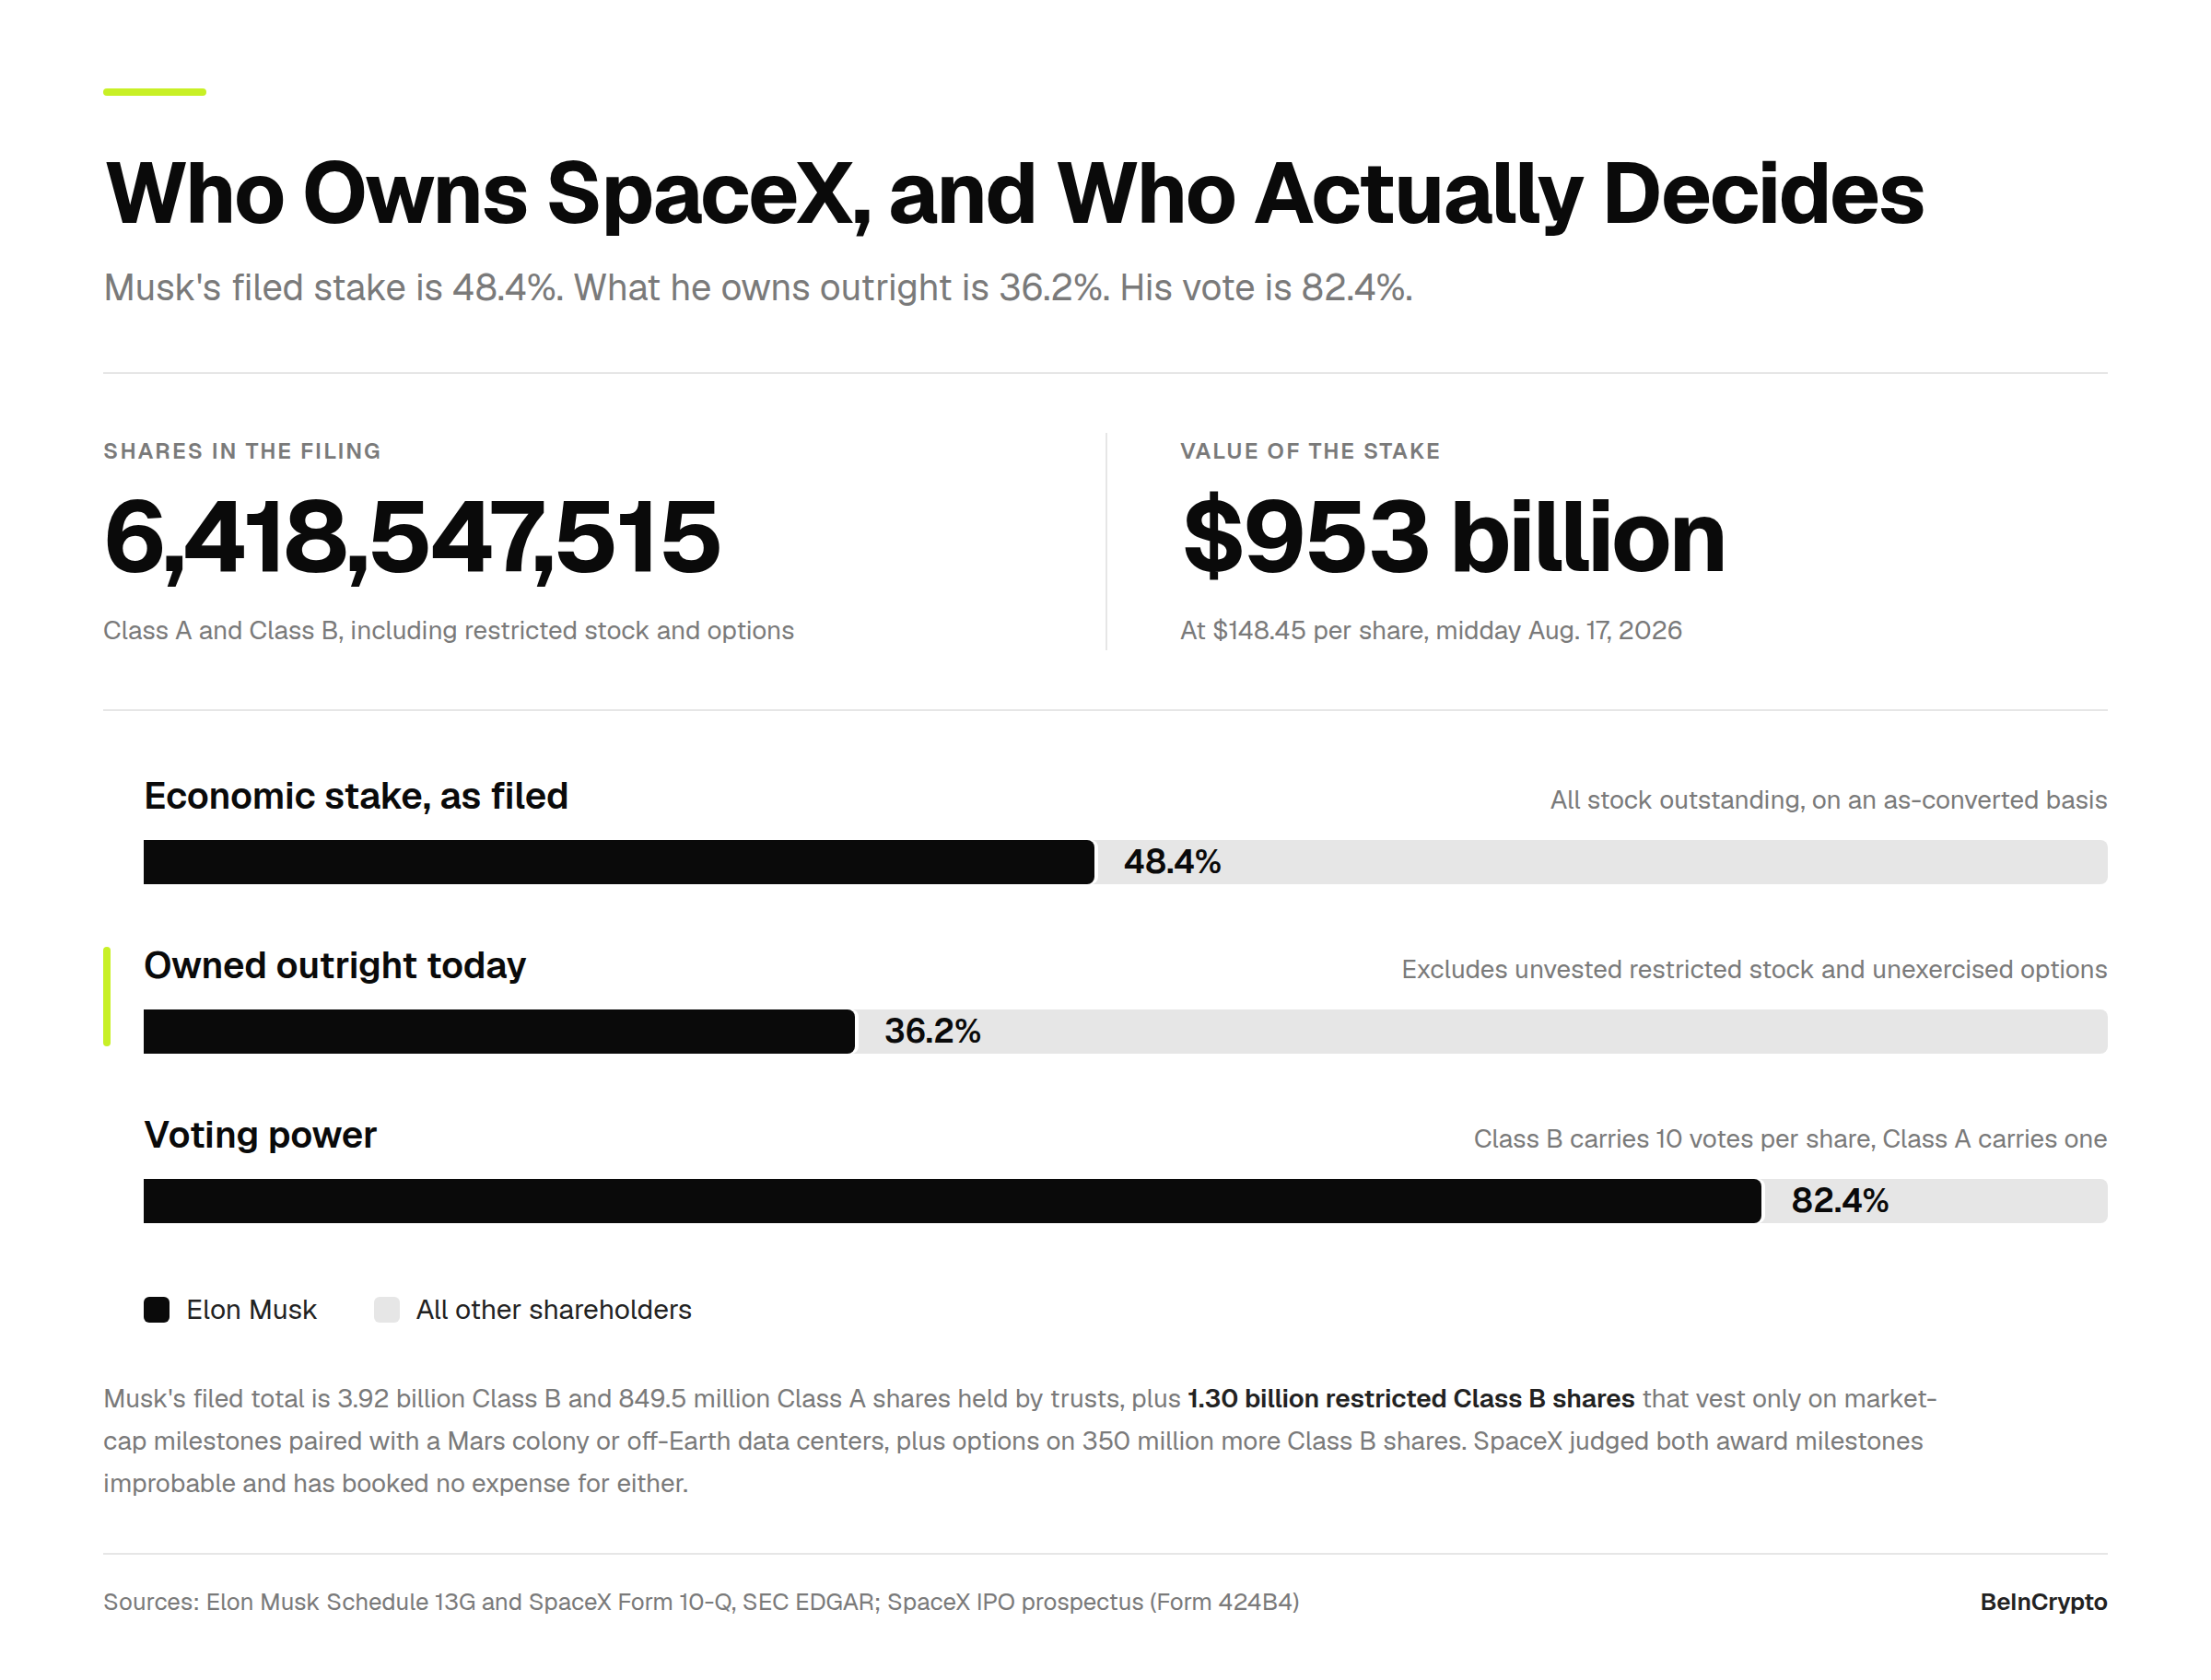
Elon Musk owns 48.4% of SpaceX (SPCX) on paper. What he owns outright today is closer to 36%, or roughly $708 billion.
Friday’s headlines put the stakes at over $900 billion. Musk replied that the number was wrong. He was right. Read the filing line by line, and the shares he holds outright come to 4.77 billion. The two figures are $245 billion apart.
The Filing Has Four Line Items. Only Two Are His
Musk filed a Schedule 13G on Thursday. That is the form the Securities and Exchange Commission (SEC) requires from anyone holding more than 5% of a public company. It reports 6,418,547,515 shares, and it splits them four ways.
- Two of the four are stock he holds now.
- Trusts he controls hold 849,494,440 Class A shares and 3,916,980,790 Class B shares.
Together, that is 4,766,475,230 shares.
The other two are promises. There are 1,302,072,285 restricted shares that have not vested. There are another 350,000,000 shares he can buy through options but has not bought.
SEC rules make him count all of it. Anything a filer can vote, or can acquire within 60 days, goes into the total. So 48.4% of SpaceX is a correct legal answer. It is not an answer to what he owns.

The math shifts once you separate them. SpaceX had 13,181,779,945 shares outstanding on July 28. Musk’s 4.77 billion is 36.2% of that.
At Monday’s price of $147.81, up 6%, it is worth about $708 billion rather than $953 billion.

1.3 Billion Shares Need Mars. SpaceX Values Them at Zero
Musk said as much himself, hours after the filing landed.
Follow us on X to get the latest news as it happens
The IPO prospectus spells out what he means. The board granted him 1 billion restricted shares in January. They vest in 15 tranches.
Each tranche needs a market capitalization target that rises from $500 billion to $7.5 trillion. Each tranche also requires SpaceX to build a permanent human colony on Mars that can hold at least one million people. Both conditions, every time.
A second award covers 302,072,285 shares, carried over from the xAI merger and reissued in March. It runs across 12 tranches, from $1.065 trillion to $6.565 trillion. It also requires data centers off Earth delivering 100 terawatts of computing power a year.
Here is the part nobody reported. SpaceX judged both sets of milestones improbable as of March 31 and has recorded no compensation expense for either.
The company assigns these shares a cost of zero because it does not expect to pay them. Traders agree.
On Kalshi, a crewed Starship flight to Mars before 2030 shows a modest 13% chance, though that market is thinly traded at just $52,405.

The 350 million options are a different story. They vested in January, carry a strike of $8.3998, and run to 2031. Musk would need about $2.94 billion in cash to convert them into stock worth roughly $52 billion.
What Changes Before June 2027
None of it is sellable yet. Musk agreed to a 366-day lock-up when SpaceX priced its IPO in June, and his shares carry no early-release triggers. His date is June 12, 2027.
Other holders exit first. Roughly 319 million shares are issued for free on Thursday, one of several tranches running through 2027. Anyone modeling the eventual Musk supply should use 4.77 billion shares, not 6.42 billion.
Traders who wanted SpaceX without the queue found other routes. Three SpaceX tokens launched on Solana the day the stock listed, and they settle around the clock. The founder holds the least liquid position in his own company.
One number did not move. Musk voted on the restricted shares, whether they ever vest or not, which left him with 82.4% of the vote at listing. His stake shrank on paper. His control never did.
The post How Much SpaceX Stock Elon Musk Really Owns, and When Can He Sell? appeared first on BeInCrypto.


Binance reportedly provided Russian authorities with transaction records and personal information belonging to a customer accused of financing terrorism via cryptocurrency donations to Ukrainian fundraising campaigns.
Russian investigators used information supplied by Binance as evidence against IT specialist Yuri Belenkiy, who was detained in September 2025 and is awaiting trial in Russia, according to law enforcement documents reviewed by Reuters.
Russia’s Investigative Committee alleged Belenkiy sent more than $700 in crypto between January 2023 and March 2024 to the Ukrainian military and a banned organization that Reuters identified as the group known at different times as the Azov Brigade and the Azov Regiment.
Reuters’ review found that Russian authorities asked Binance for Belenkiy’s transaction history and received information linking him to the transfers, along with his date of birth, address, phone number and passport number. The response also included copies of his Russian passport and Bulgarian residency permit.
Binance announced a full exit from Russia in September 2023, selling its local business to CommEX.
A Binance spokesperson declined to comment on specific confidential law enforcement requests or individual cases.
“Binance does not make or enforce the laws of any jurisdiction, determine charges, or decide how any government uses information in legal proceedings. Like other global financial institutions, we cooperate with lawful information requests from law enforcement globally, subject to applicable legal, privacy and regulatory requirements,” the spokesperson told Cointelegraph.
Related: Binance to restrict transactions involving HTX, 10 other crypto platforms
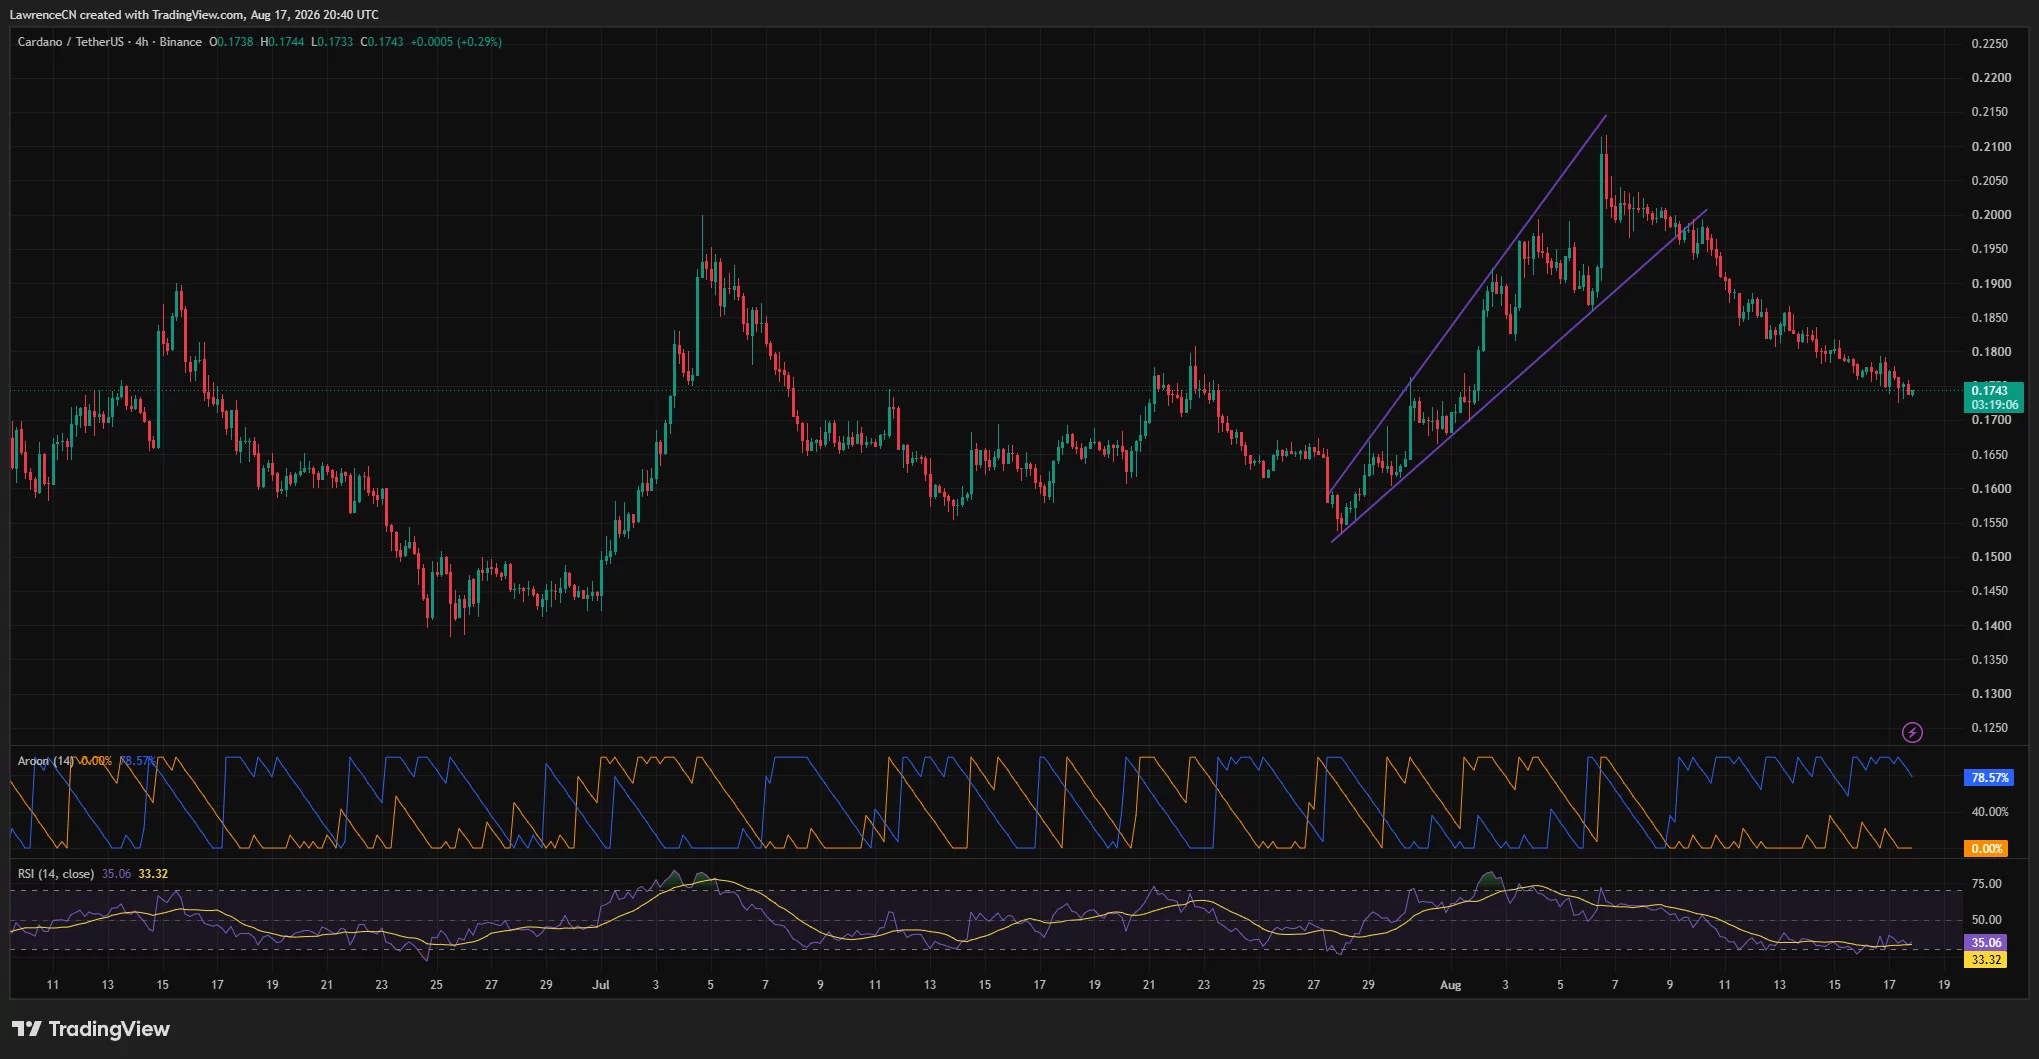
Cardano price fell about 1% to $0.174 as traders weighed a two-stage Dijkstra upgrade roadmap against a bearish chart structure and nearby liquidation risks.
Summary
- Cardano price traded near $0.174 after breaking below a rising channel on the 4-hour chart.
- Cardano’s Dijkstra upgrade will roll out in two phases, beginning with protocol version 12.
- The daily chart places immediate support at $0.1706, followed by the $0.1385 swing low.
- CoinGlass data shows major upside liquidation clusters between roughly $0.183 and $0.187.
Cardano price action today
According to data from crypto.news, Cardano (ADA) price was trading near $0.174 at the time of writing, down about 1% over the past 24 hours. ADA remained below the $0.18 level after retreating from an Aug. 7 peak above $0.21.
The 4-hour chart shows that ADA has broken below an ascending channel that guided its recovery from approximately $0.153 in late July. Cardano price initially climbed along the channel to $0.20 before the breakout failed and sellers regained control.
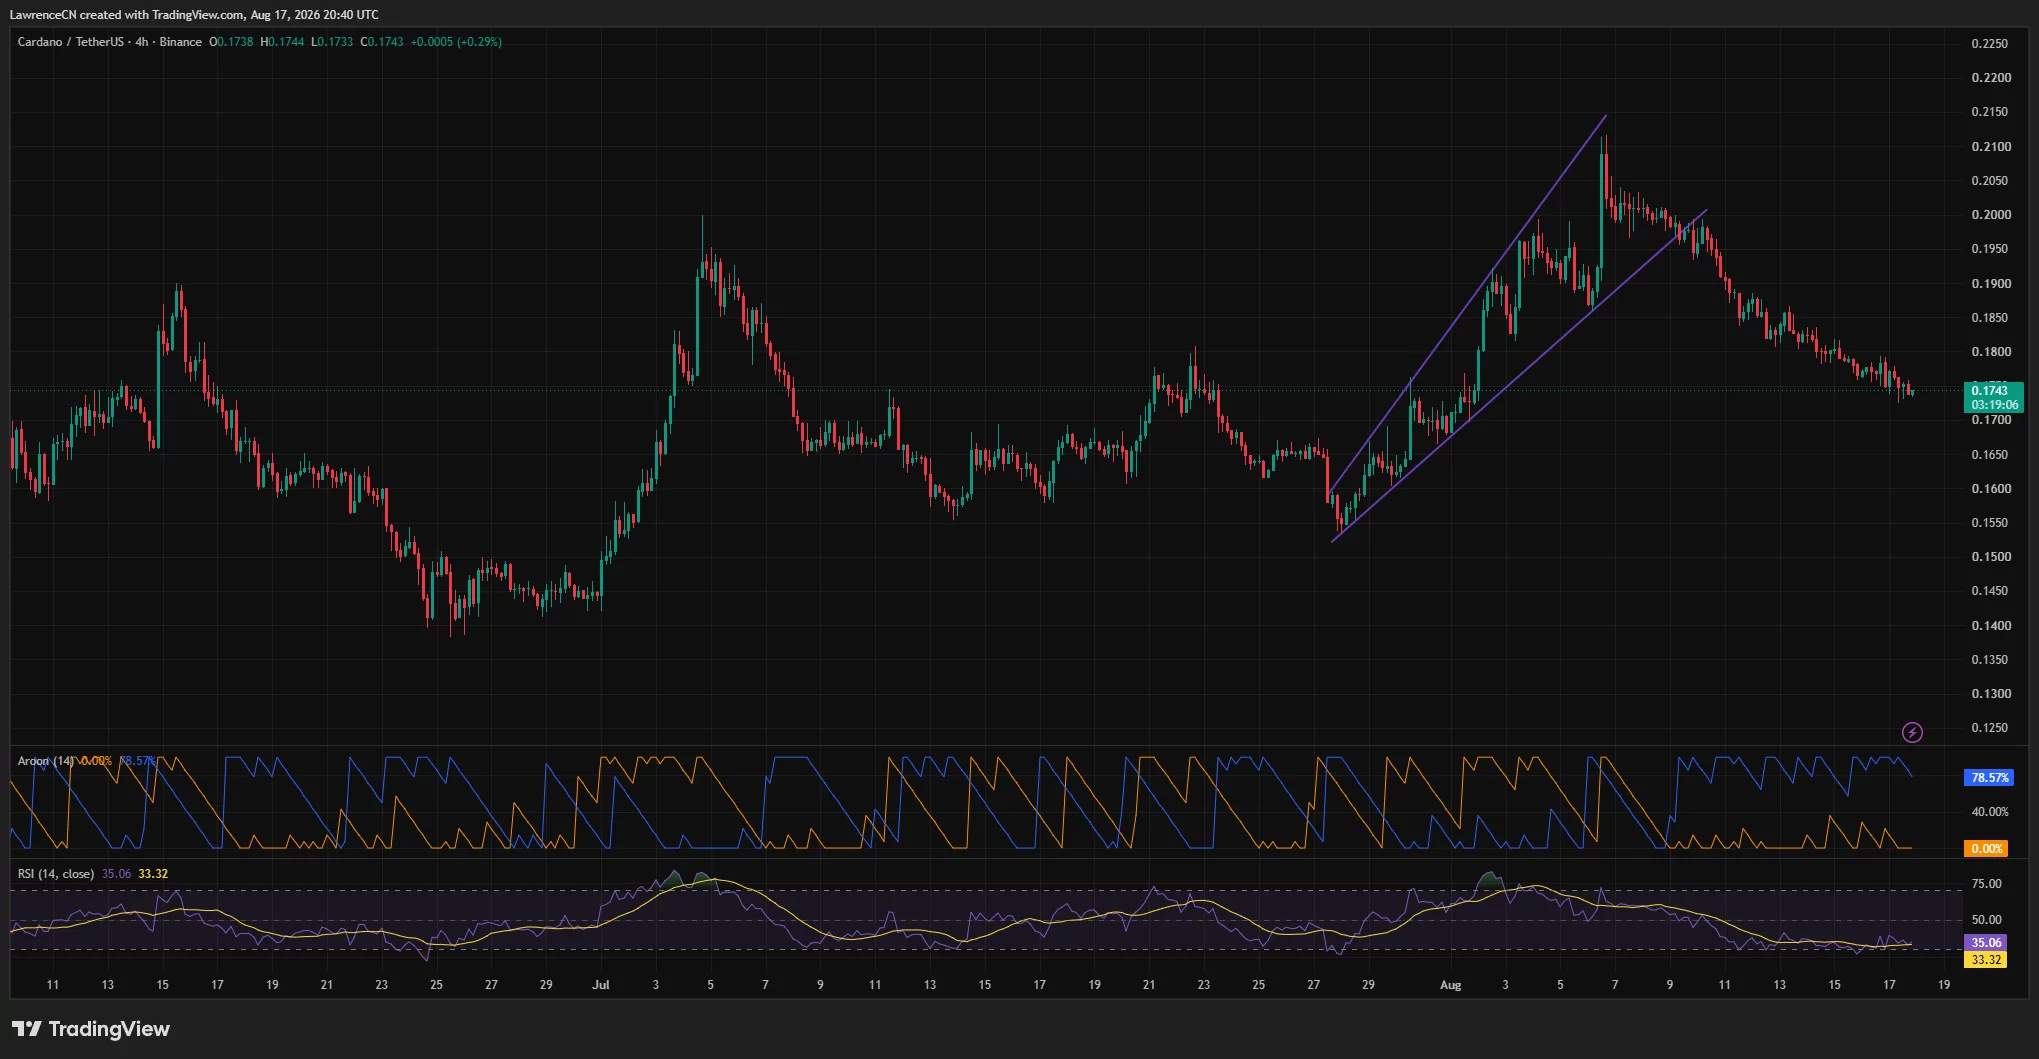
ADA has since formed a series of lower highs and lower lows, bringing it back toward the area where the late-July rally began. The latest decline also left the token about 17% below its August high.
4-hour momentum remains weak. The relative strength index stood at 35.06, close to the oversold threshold of 30, while its signal line was lower at 33.32. The reading shows sellers still control the short-term trend, although ADA is approaching a zone where selling pressure may begin to slow.
Analysts at AltCryptoGems said in an Aug. 17 X post that ADA’s decline followed a bearish break in market structure. The analyst also pointed to heavy capital rotation across the altcoin market, where rallies have been short-lived as traders move funds between individual tokens.
Dijkstra Era upgrade will arrive in two phases
Intersect’s official Dijkstra rollout plan divides Cardano’s next major protocol upgrade into two stages. The first phase targets code completion in the fourth quarter of 2026 and will introduce the Dijkstra ledger era through a hard fork to protocol version 12.
Phase one is set to activate Ouroboros Linear Leios, a scaling design intended to increase the number of transactions Cardano can handle while retaining the security guarantees of its existing base protocol.
Linear Leios will use the current ranking blocks alongside supplementary endorser blocks. Those additional blocks will reference transactions and receive certification from a stake-based committee before the transactions enter the ledger.
Intersect said the approach allows Cardano to process more transactions without requiring larger base blocks or shorter slot times. Throughput would be raised gradually through protocol parameter changes after activation.
The first phase also includes nested transactions, a PlutusV4 script context, account-address improvements, and changes to Cardano’s block structure. Nested transactions will allow a transaction to contain child transactions with their own witnesses and execution conditions, giving developers more options when building on-chain applications.
Structural support for Ouroboros Peras will also ship during the first phase, but the settlement feature will not become active immediately. Intersect plans to activate Peras through a second hard fork within the Dijkstra Era, with code completion targeted for the second quarter of 2027.
Peras will add a voting layer that allows committees of stake pool operators to vote on recent chain tips. Once a tip receives enough votes, the network can treat it as settled sooner than under Cardano’s standard Ouroboros Praos process.
The Q4 2026 and Q2 2027 targets refer to estimated code-completion dates rather than confirmed mainnet launches. Each phase must pass through the Preview and Pre-production test networks before reaching Cardano’s mainnet.
Mainnet activation will also require an on-chain governance action. Delegated representatives, stake pool operators, and the Constitutional Committee must vote on the proposal before either hard fork can proceed.
Cardano price tests the $0.1706 support level
ADA’s daily chart places the price close to the 78.6% Fibonacci retracement level at $0.1706. The level is measured from the June low of $0.1385 to the May high of $0.2886 and now represents the nearest major support on the chart.
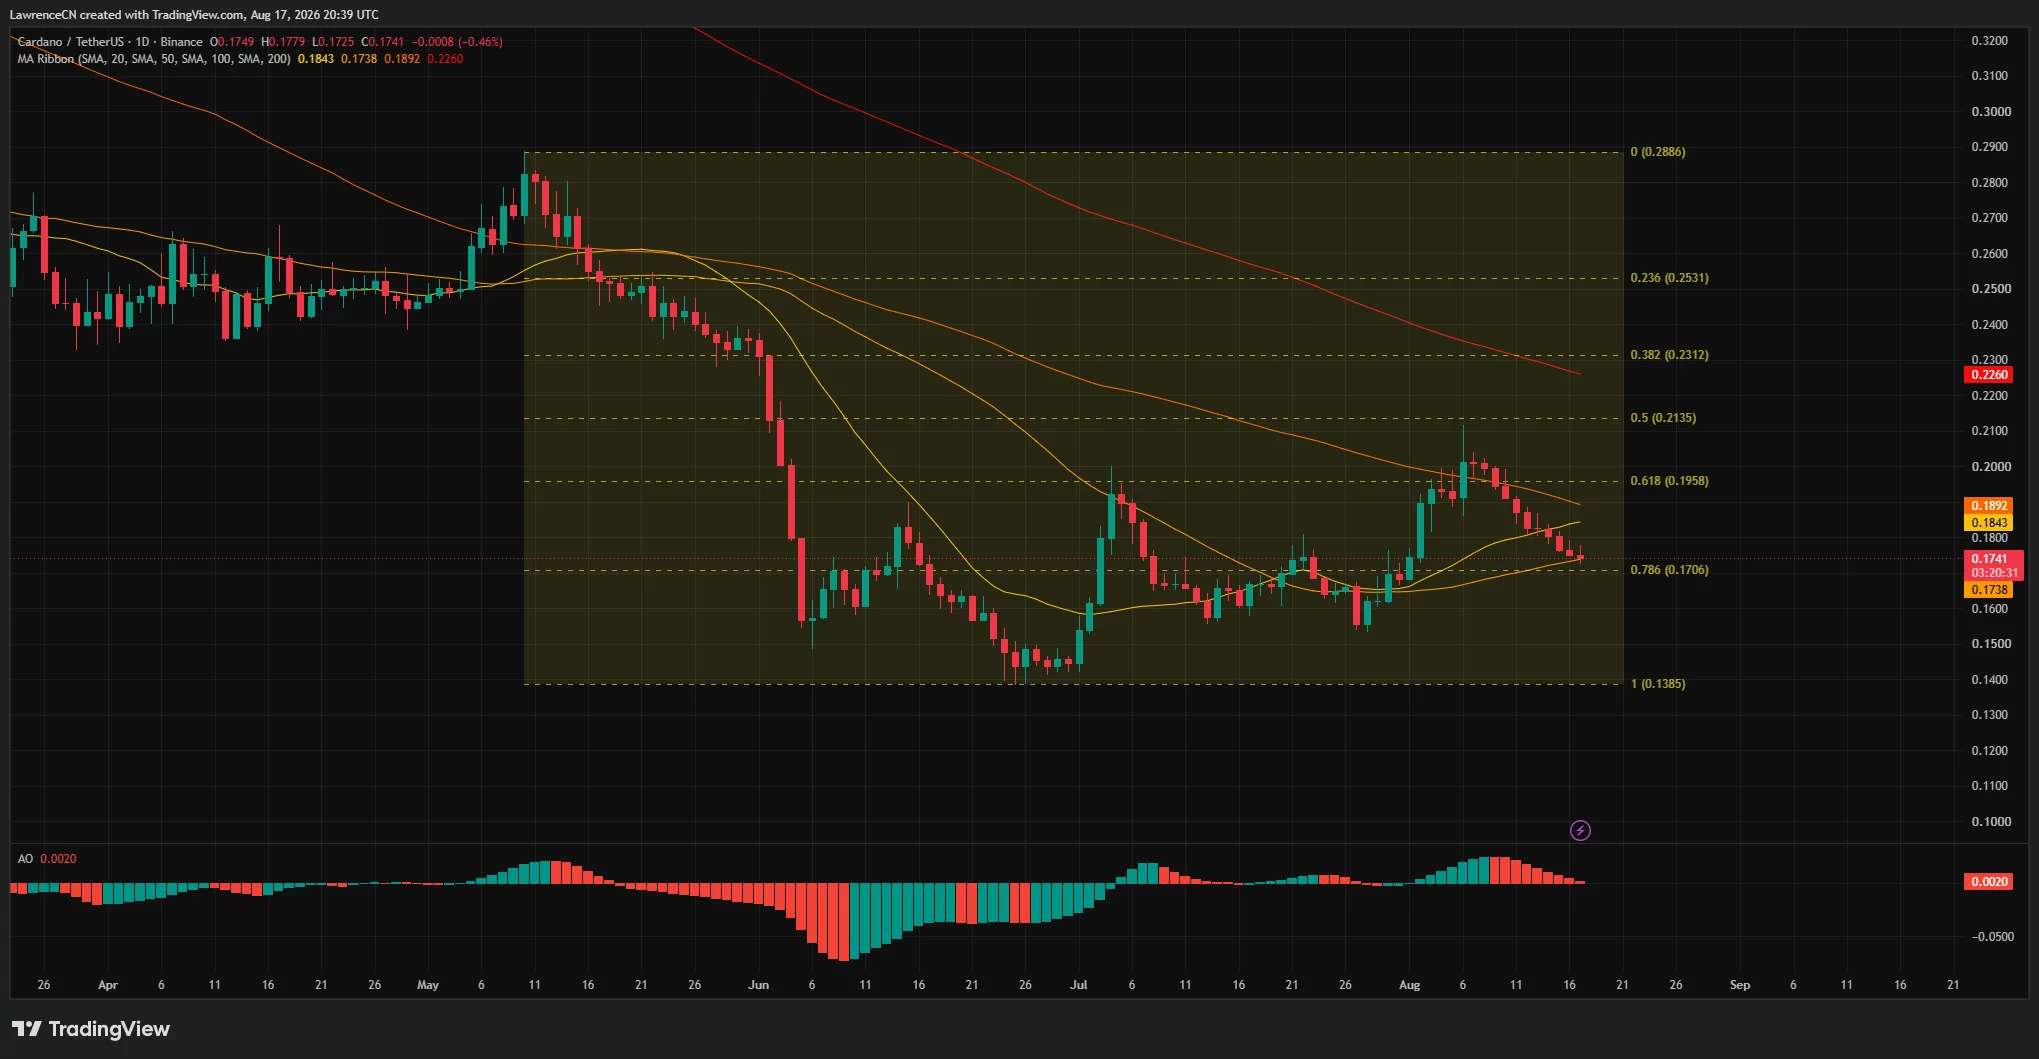
Cardano price was slightly above its 20-day simple moving average at $0.1738 at the time captured by the chart. However, ADA remained below its 50-day average at $0.1843, its 100-day average at $0.1892 and its 200-day average at $0.2260.
The position below the three longer-term averages keeps the wider trend under pressure. The Awesome Oscillator remained marginally positive at 0.0020, but its shrinking red bars showed that the momentum generated by ADA’s early-August recovery was fading.
A daily close below $0.1706 would weaken the current support structure and expose the recent liquidity area near $0.166. Continued selling could then place the June swing low at $0.1385 back in focus.
ADA would first need to recover the 50-day average near $0.1843 to ease the immediate bearish pressure. A move above that level would bring the 100-day average around $0.1892 and the 61.8% Fibonacci level at $0.1958 into view.
The $0.1958 area also sits close to the former rising channel and the price zone where ADA’s August advance began to lose momentum. A sustained recovery above it would allow traders to consider the 50% retracement at $0.2135, although the current charts do not yet show confirmation of such a reversal.
ADA liquidation map points to volatility near $0.185
CoinGlass’ one-week ADA liquidation heatmap shows several leveraged position clusters above the current price. The brightest concentration appears around $0.186 to $0.187, with another large cluster close to $0.183.
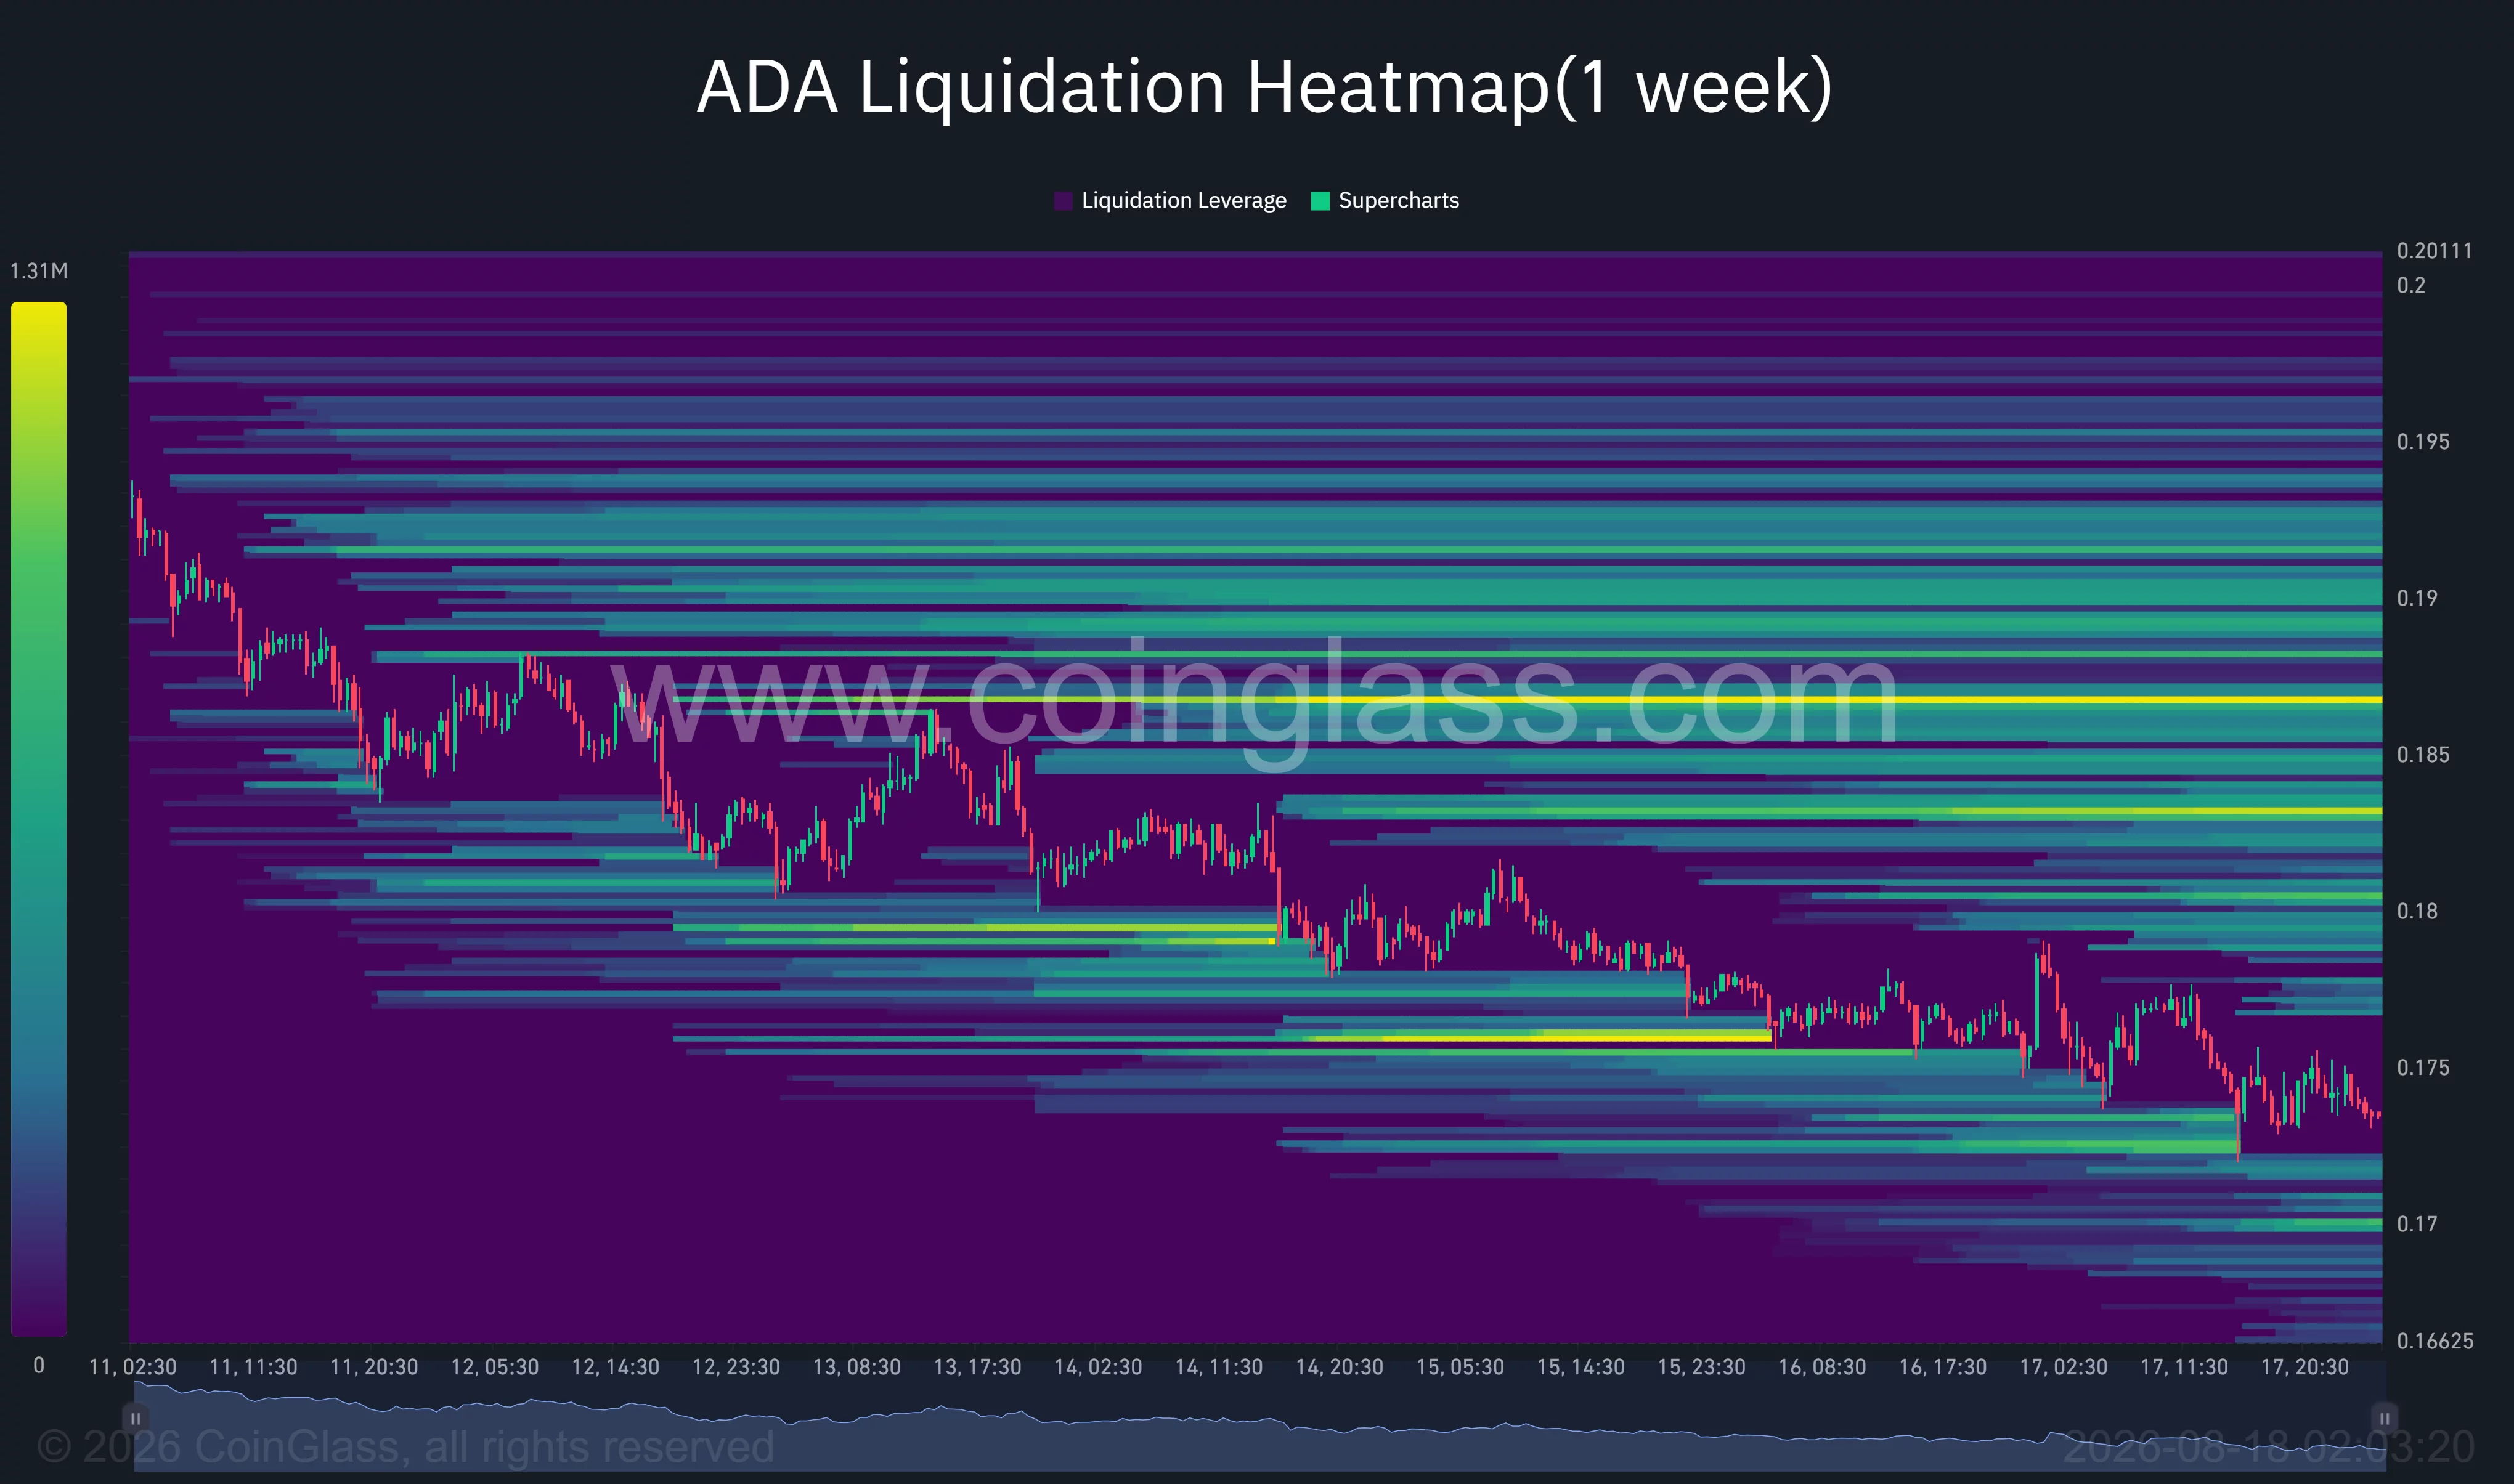
Prices can move toward areas containing large volumes of leveraged positions because forced liquidations add market orders once those levels are reached. The data does not guarantee that ADA will rebound, but it identifies $0.183–$0.187 as a potentially volatile area if buyers push the token above $0.18.
Additional liquidation bands are visible around $0.188–$0.193, increasing the potential resistance above the first cluster. Those levels broadly overlap with ADA’s 50-day and 100-day moving averages, strengthening the importance of the wider $0.184–$0.196 zone.
Liquidity below the market appears more scattered. CoinGlass shows smaller concentrations near $0.170 and toward the bottom of the displayed range at approximately $0.166. A break below $0.1706 could therefore accelerate the decline as leveraged long positions face liquidation.
For US investors trading ADA around the clock, the Dijkstra roadmap provides a longer-term network catalyst but no fixed mainnet date. Near-term direction remains tied to whether ADA holds $0.1706 and recovers the moving averages and liquidation clusters between $0.183 and $0.196.
Disclosure: This article does not represent investment advice. The content and materials featured on this page are for educational purposes only.
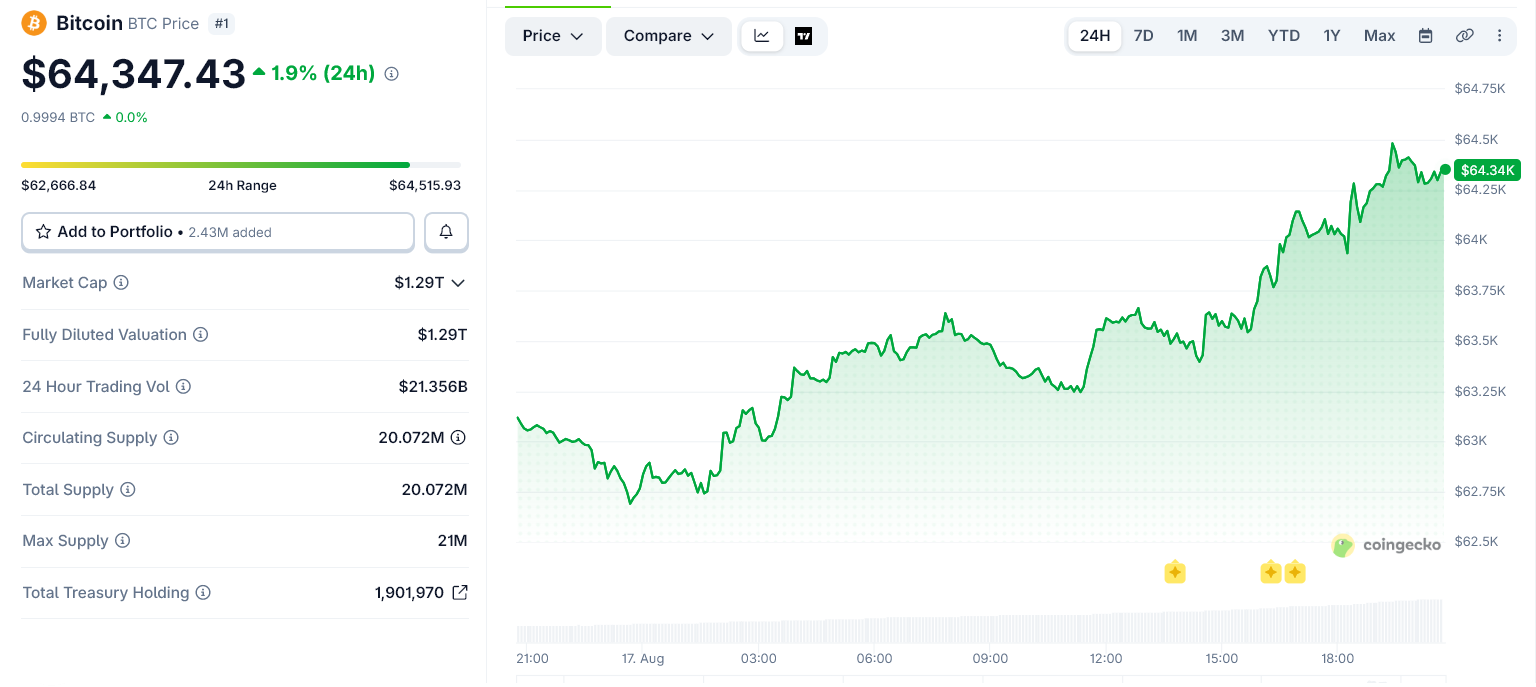
Bitcoin broke above $63,000 on Monday and quickly pushed past $64,000, escaping the narrow range that had trapped the price for days.
The biggest catalyst came from the US macro picture. Traders have sharply reduced their expectations for a Federal Reserve rate hike in September, while the dollar has weakened. Both developments make risk assets such as Bitcoin more attractive.
Can Bitcoin Price Breakout of $65,000 Resistance?
The move also gained momentum as selling pressure eased. Bitcoin inflows to exchanges have dropped sharply, while funding rates and open interest have cooled. That means fewer coins are sitting on exchanges ready to sell, while leveraged traders are less aggressively positioned.
However, the broader picture remains less convincing.

CryptoQuant’s volatility-adjusted momentum has fallen below zero, suggesting Bitcoin is generating weak returns relative to its recent volatility. Its risk oscillator has also returned to a level that previously appeared near major market turning points.
US spot demand also remains soft. The Coinbase Premium Index is still negative, although the indicator may exaggerate weakness because of differences between USD and USDT pricing. Bitcoin ETFs also recorded net outflows last week.
For the next few days, $65,000 is the key level. A clean break and hold above it could extend the move toward the upper part of the recent range.
But the next few weeks will depend on whether real spot demand returns. If ETF flows improve and Coinbase demand strengthens, the breakout could develop into a broader recovery.
If those signals stay weak, the move above $63,000 may remain a relief rally driven mainly by lighter selling and short covering.
The post Bitcoin Breaks Out of the $63,000 Zombie Zone, But Will It Hold? appeared first on BeInCrypto.

The U.S. Department of the Treasury has begun the formal process of building regulations for the Guiding and Establishing National Innovation for US Stablecoins (GENIUS) Act, launching a notice of proposed rulemaking for public comment. The move is aimed at clarifying how the new stablecoin framework will be implemented ahead of the law’s scheduled start date in January 2027.
In a notice released on Monday, Treasury said it is accepting feedback as it works toward regulatory certainty for businesses operating in the stablecoin payments market. Treasury Secretary Scott Bessent said the department “welcomes input from stakeholders as [it works] to provide the regulatory certainty businesses need to innovate and grow in America.”
Key takeaways
- Treasury has opened a proposed-rulemaking process for GENIUS stablecoin implementation, inviting public comment before the January 2027 effective date.
- Under the GENIUS framework, payment stablecoins generally cannot be issued in the U.S. without an associated federal or state license once the law takes effect.
- The public comment window runs for 60 days after publication in the Federal Register.
- Earlier GENIUS-related proposals from other regulators may still leave uncertainty for market participants, especially given reported missed internal deadlines.
Treasury starts the GENIUS rulemaking process
The GENIUS Act, signed into law last year, is designed to establish a dedicated regulatory structure for “payment stablecoins.” Treasury’s Monday notice signals the next phase: translating statutory requirements into operational rules that regulated entities can plan around.
Treasury’s timeline indicates the law’s effect is tied to the agencies finalizing their rules. Under the bill’s schedule, the stablecoin law was set to begin 120 days after agencies complete final rules, or 18 months after the act’s passage in July 2025—placing the effective date on Jan. 18, 2027. Treasury’s proposed rules are intended to feed into that schedule rather than wait for the very end of the timeline.
Once GENIUS goes into effect, Treasury said an entity generally may not “issue a payment stablecoin” in the U.S. without a related federal or state license. That restriction is central to how market participants will need to structure issuance, compliance, and oversight, and it also underscores why regulators are pushing for rules well ahead of the deadline.
Interested parties will have 60 days to submit comments after the notice is published in the Federal Register, according to Treasury’s disclosure in the proposed-rulemaking notice.
Other agencies issued related proposals in 2026
Treasury is not acting in isolation. Alongside Treasury, other U.S. financial regulators—including the Office of the Comptroller of the Currency (OCC), the Federal Deposit Insurance Corporation (FDIC), and the Federal Reserve Board—have reportedly issued notices of proposed rules in 2026 related to GENIUS implementation. Earlier coverage from Cointelegraph noted that OCC proposals were also aimed at shaping the operating environment for stablecoins and addressing areas of policy debate.
However, the lead time between proposal announcements and final rules matters for businesses planning issuance pathways. The article notes that all departments reportedly missed a July 120-day deadline that would have allowed regulations to be finalized before January. That raises the possibility that GENIUS could take effect even without fully finalized guidance, which would leave some details uncertain for regulated entities and could complicate timelines for compliance readiness.
For market participants, this creates an important distinction: while the effective date is known, the practical contours of licensing and regulatory expectations may not be fully settled by then. That gap is precisely what public comment periods and subsequent rule finalization are meant to close.
GENIUS work is also being discussed with the UK
Beyond Washington, regulators are also coordinating on how stablecoin policy developments may intersect across borders. In July, the UK-US Financial Regulatory Working Group met in London to discuss cooperation between financial agencies, including implementation of the GENIUS Act.
The UK has taken its own steps toward regulating stablecoins, according to the referenced reporting. Still, crypto industry observers have argued that the UK risks falling behind the U.S. in terms of implementation momentum, especially as the U.S. continues to move toward a defined effective date and agency-by-agency rulemaking.
That difference matters for companies planning cross-border stablecoin services, since regulatory timing can affect product deployment, licensing strategy, and operational design—particularly for payment-oriented issuers that need clarity on authorization and compliance obligations.
Why the proposed rules matter before January 2027
The immediate consequence of Treasury’s proposed rulemaking is that stakeholders now have a formal channel to influence how GENIUS translates into enforceable requirements. While the precise contents of the proposed rules aren’t detailed in the excerpt, the framework’s licensing premise is already clear: payment stablecoins are generally not meant to be issued without an appropriate federal or state license once the law is active.
In practical terms, this means issuers and partners—such as payment processors and custody providers that support stablecoin networks—will likely need to map their roles to the future licensing and compliance system. If finalized rules arrive late relative to the effective date, businesses may face a planning problem: they can prepare for the direction of travel, but they may not know every operational requirement until rulemaking concludes.
With public comment open for 60 days after Federal Register publication, the next phase will test how quickly regulators can process feedback and move toward final rules. Market participants should watch for whether agencies can align their proposals into coherent, implementable guidance before the January 2027 milestone.
As Treasury and other regulators work through comments and finalization, the key uncertainty for stablecoin issuers is timing: whether the remaining rule details will be finalized with enough lead time for licensing and operational compliance. The public comment window will offer early signals about the issues regulators prioritize and the expectations that will shape GENIUS implementation.
Bitcoin (BTC) is starting the new week at around $63,000, but bear-market history continues to repeat with weekly close below a key long-term trend line.
Key points:
- Bitcoin has been trading in a range between $57,700 and $67,300, but last week’s close came with a drop below the key 200-week moving average at $64,216.
- Markets are pricing in near-70% odds of a hold by the Federal Reserve in September, as July meeting minutes are due this week.
- Japan Q2 GDP figures fall short of expectations at 1.1% as analysis warns of “global tightening” that could impact Bitcoin and risk assets.
Bitcoin sees weekly close below 200-week moving average
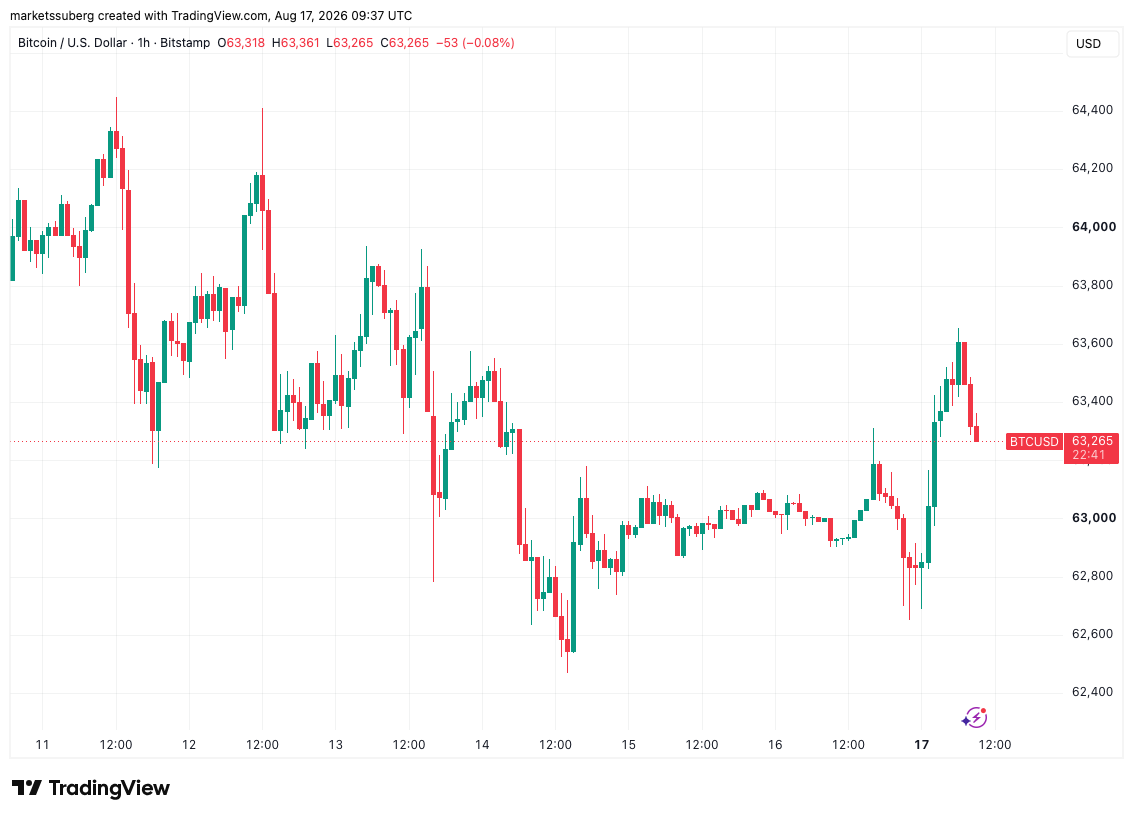
Bitcoin price action enjoyed a modest rebound after Sunday’s weekly close, seeing local highs of $63,655 on Bitstamp.
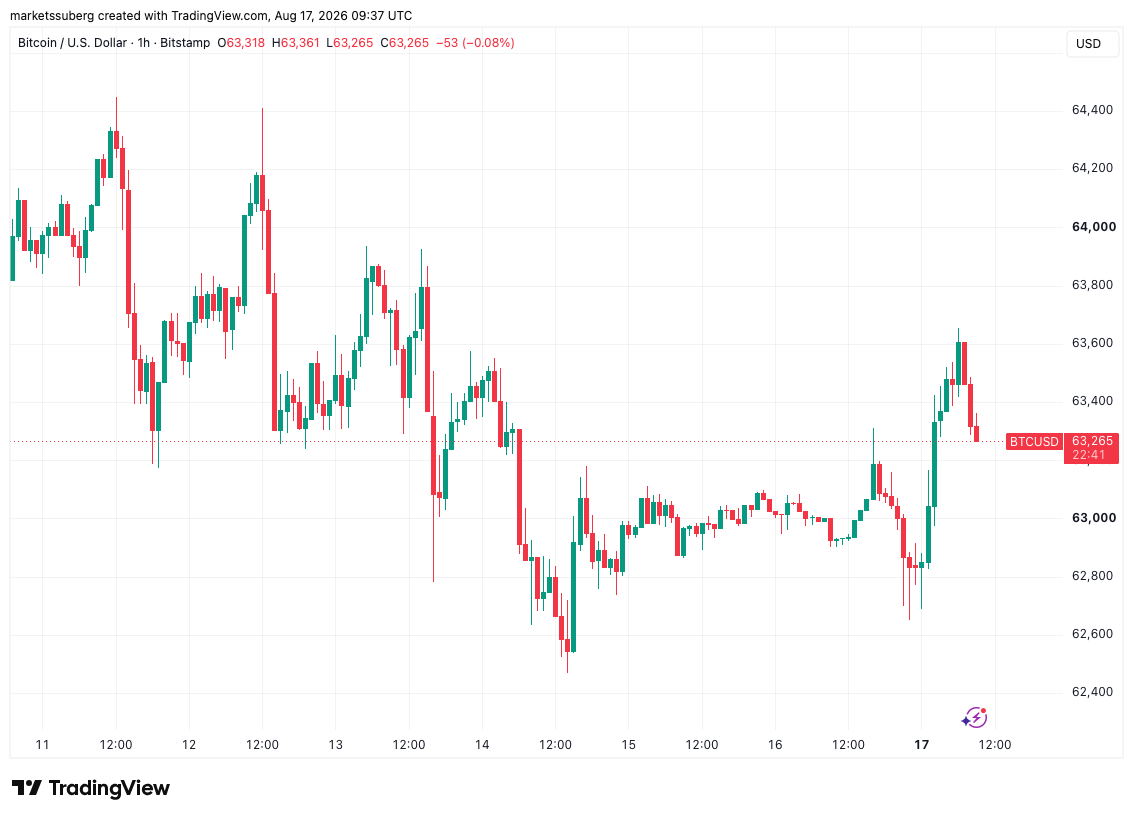
BTC/USD one-hour chart. Source: Cointelegraph/TradingView
Data from TradingView shows BTC/USD continuing to tread water as the week begins, failing to challenge either side of a narrow trading range.
Analyst Benjamin Cowen, however, drew attention to the fact that BTC/USD is now back below its 200-week simple moving average (SMA). As Cointelegraph reported, this moving average was a defining feature in the 2022 bear market, when it turned resistance in August before BTC entered its long-term bottoming phase.
“What is interesting is how in both summer 2022/2026, Bitcoin capitulated below the 200W SMA, then bounced, then gave it up in mid-August,” he wrote in a post on X.
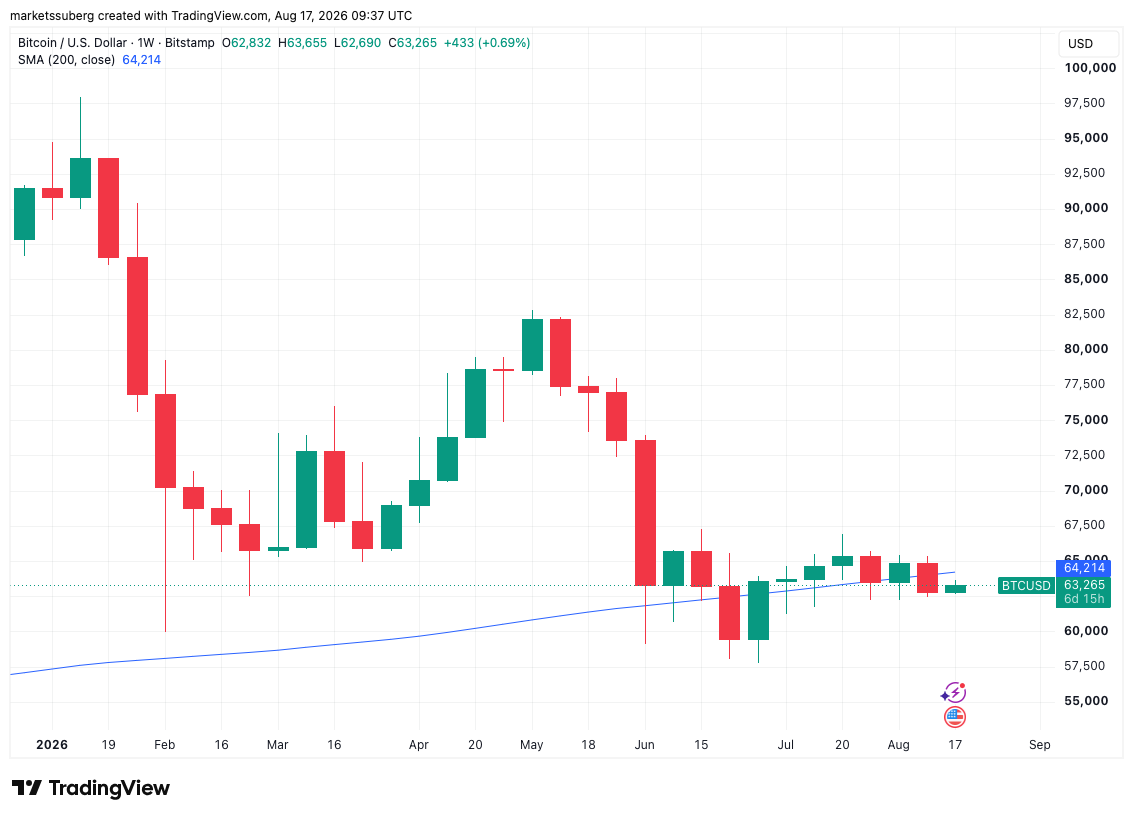
BTC/USD one-week chart with 200 SMA. Source: Cointelegraph/TradingView
Commenting, trader and analyst Rekt Capital added that price had failed to reach his own weekly-close target of $63,220, thus positioning for further downside in future.
“A rejection from $63,220 would fully confirm the breakdown and send price lower within the current ~$58,000-$66,000 Range (blue-blue)” he told X followers alongside an explanatory chart.
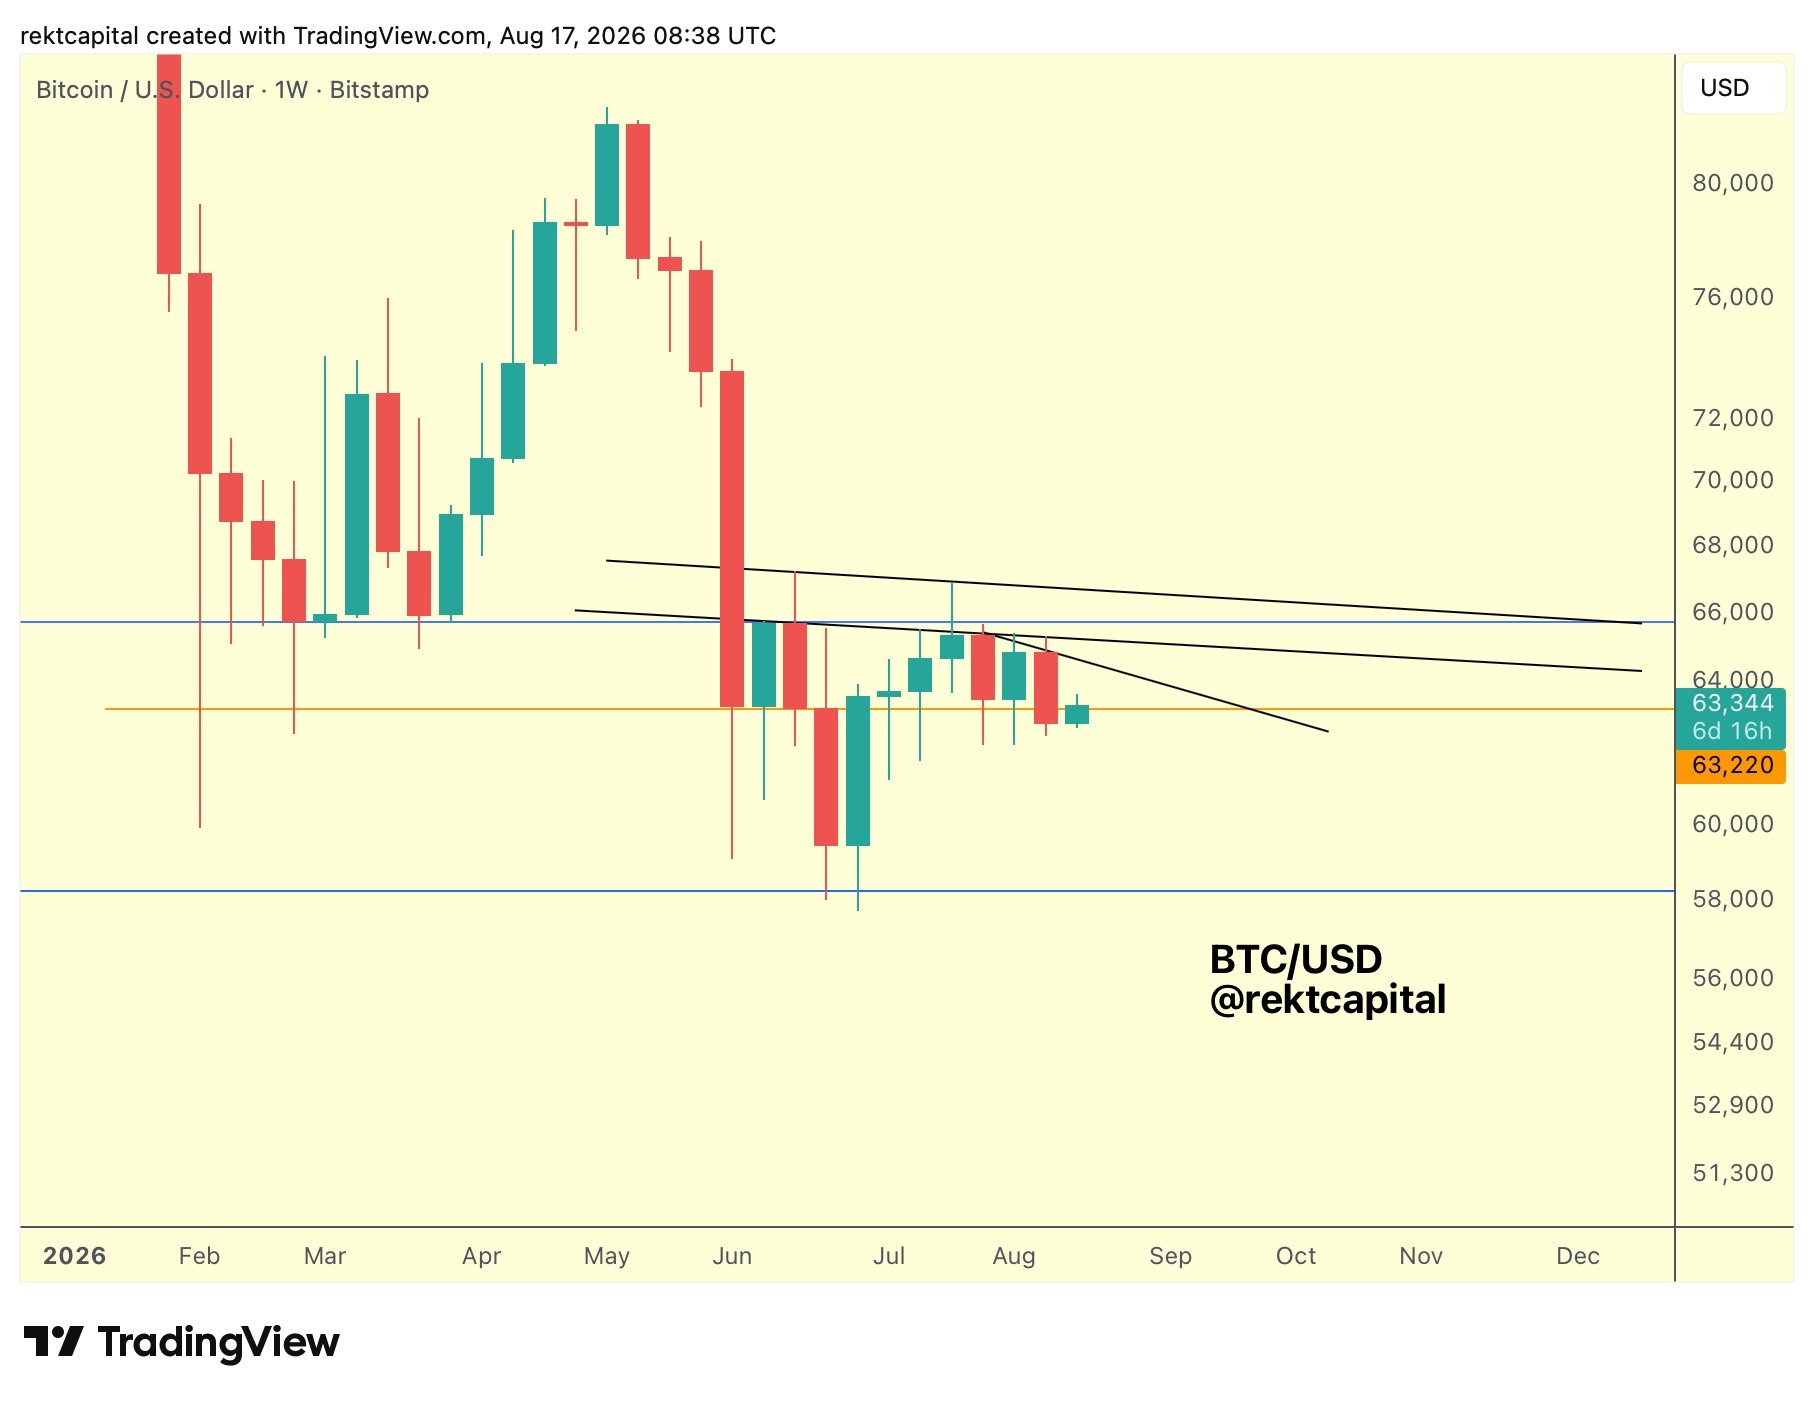
BTC/USD one-week chart. Source: Rekt Capital on X.com
Fed minutes due amid policy dissent
Friday sees the release of preliminary Purchasing Managers’ Index (PMI) data for the manufacturing and services sectors. The data has recently been in an uptrend diverging from relatively weak employment figures, which have seen several months of downward revisions.
Last week’s Consumer Price Index (CPI) and Producer Price Index (PPI) releases, meanwhile, painted a softer-than-expected picture of US inflation trends. This sparked a rethink on future interest-rate hikes by the Federal Reserve.
The latest data from CME Group’s FedWatch Tool shows near-70% odds that the Fed will hold rates at their current 3.50-3.75% range, compared with 42% odds a month ago.
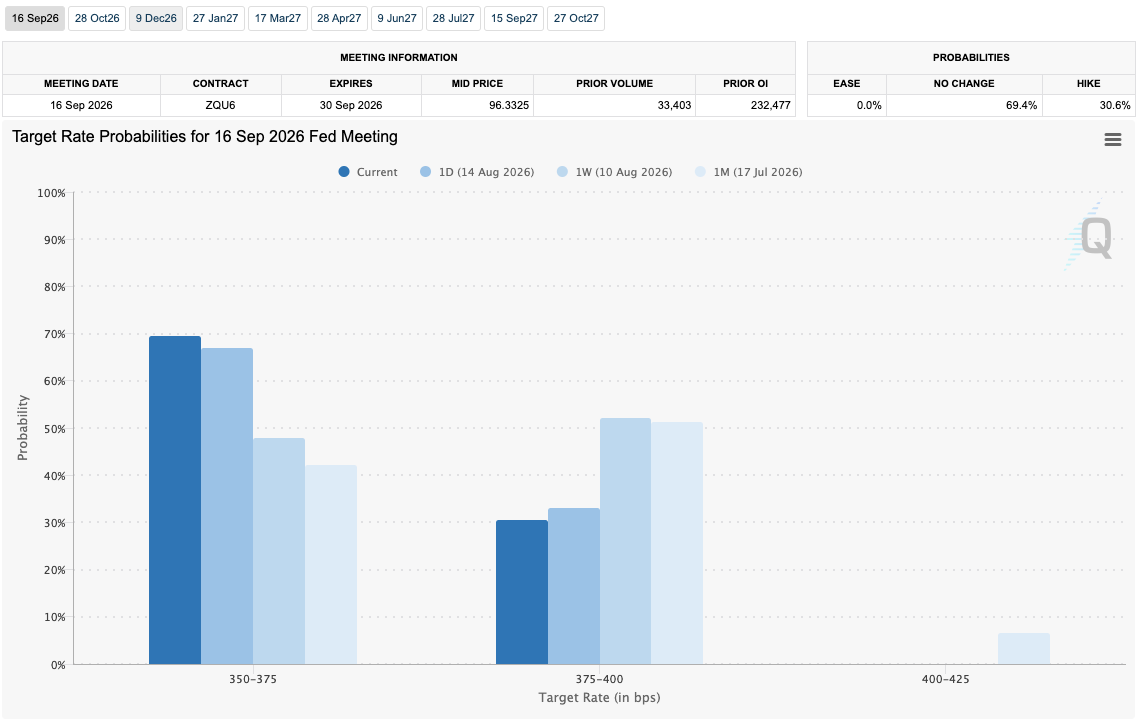
Fed target-rate probability comparison for September FOMC meeting (screenshot). Source: CME Group
“A pair of reports showing moderating inflation is helping keep the outlook for monetary policy from turning too hawkish,” trading resource Mosaic Asset Company summarized in analysis released on Sunday.
Mosaic noted that while CPI came in at 3.4% year-on-year, this was still far above the Fed’s 2% target — a goal that chair Kevin Warsh continues to state will be achieved. On Wednesday, the Fed will publish the minutes of its July meeting. Rate hikes were paused in the prior meeting with the largest split among officials over the move since 1970.
Last week, Cleveland Federal Reserve Bank president Beth Hammack, who was one of three dissenting voices calling for a 0.25% rate hike in July, questioned whether public patience would tolerate it if the return to 2% rates took several years.
“Maybe we’d get there, but if it takes another three to four years to get there, is that OK? Is that enough?” she said at an event with the Dayton Area Chamber of Commerce in Kettering, Ohio, quoted by Bloomberg.
Japan on the radar as GDP disappoints
Japan’s central bank is on the radar for risk-asset traders this week after Q2 GDP figures significantly missed expectations. Quarter-on-quarter and year-on-year GDP increased 0.3% and 1.1%, respectively — below the anticipated 0.5% and 2.0%.
The timing of the print comes as markets see the Bank of Japan (BoJ) hiking rates from current 1.0% levels in September amid surging bond yields and continued weakening in the yen. Previously, Cointelegraph reported on a rare joint intervention in yen currency markets by Japan and the US after JPY/USD weakened to new 40-year lows.
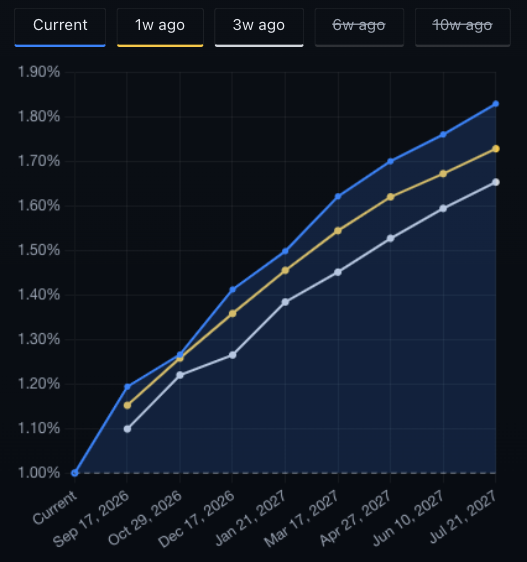
BoJ interest-rate probabilities (screenshot). Source: RateProbability
The GDP print, meanwhile, included the first drop in private consumption in eight quarters, signaling that existing stimulus measures were failing to prop up consumer confidence.
“The boost to consumption from policy measures is already fading, and inflation will increase in H2 as firms will pass on increased costs, deteriorating consumers’ purchasing power,” Norihiro Yamaguchi, lead Japan economist at Oxford Economics, told CNBC.
The yen avoided major volatility on the back of the GDP data, lingering near 159 per dollar on Monday.
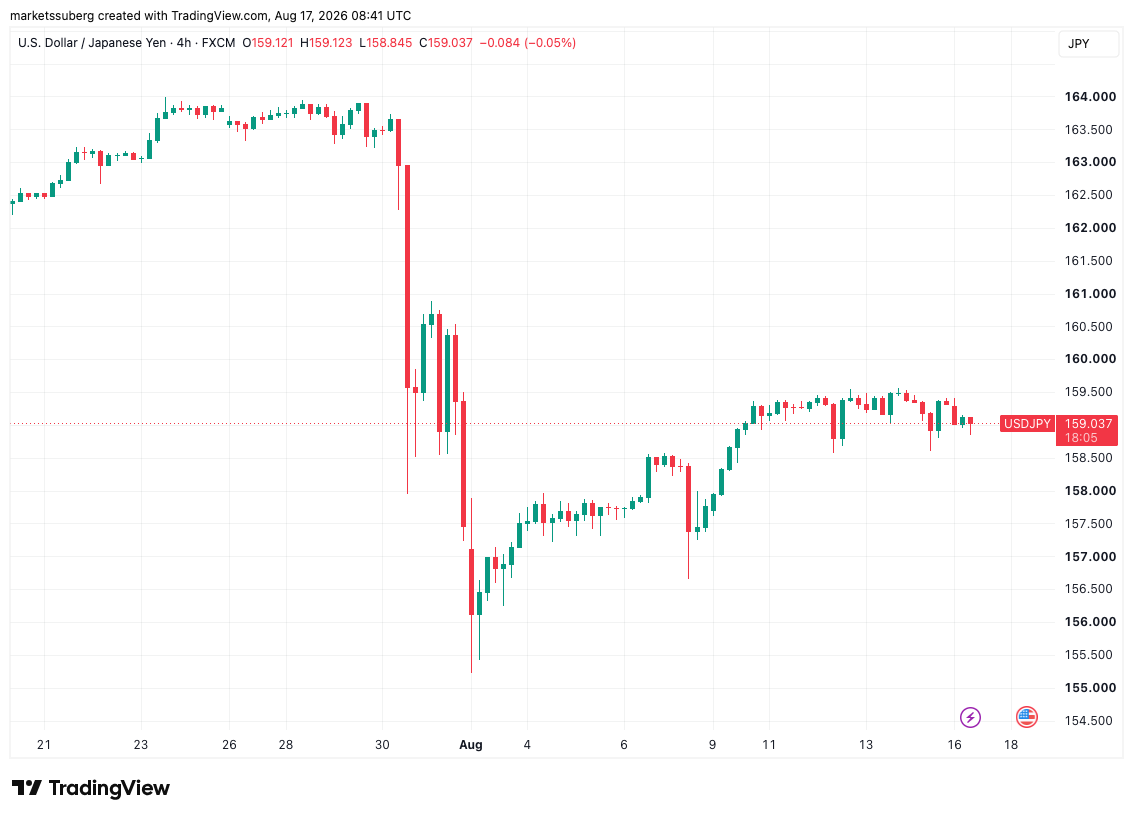
USD/JPY four-hour chart. Source: Cointelegraph/TradingView
Responding to the aftermath, Axel Adler Jr., a contributor to onchain analytics platform CryptoQuant, noted potential implications for risk assets to come. Japan’s 10-year bond yield hit 2.93% on Monday, its highest levels since 1996.
“For now, this is not a signal to sell risk assets. But the market is approaching an important point: JGB > 3% + further BOJ rate hikes + a stronger yen + rising US Treasury yields,” he wrote in an X post.
“If these factors align, Japan’s rate normalization could turn into a global tightening of financial conditions and hit stocks and Bitcoin.”
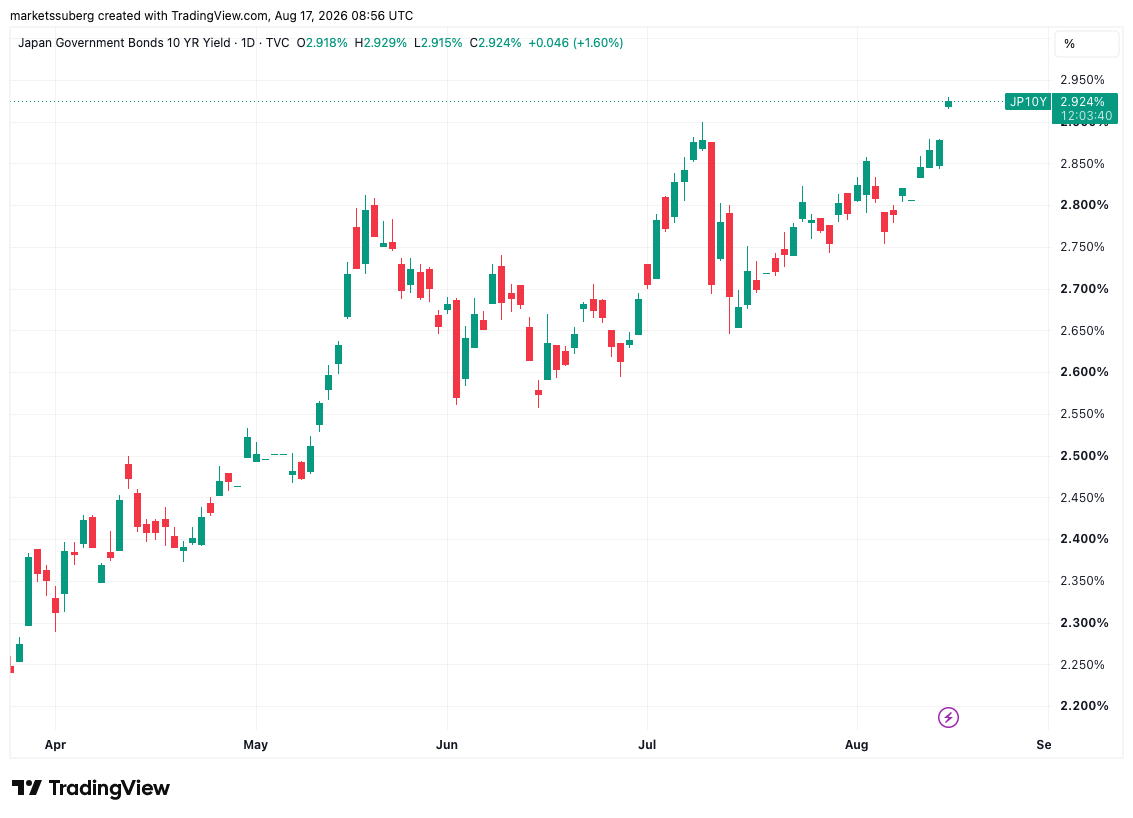
Japan 10-year bond yields one-day chart. Source: Cointelegraph/TradingView
Bitcoin forgotten as consumer sentiment lows contrast with stocks gains
Rising stocks paired with record-low consumer sentiment are flashing a new warning sign for Bitcoin, which is increasingly being overlooked.
In the latest edition of its regular newsletter, The Week Onchain, crypto analytics platform Glassnode revealed a striking divergence between Bitcoin and equities in terms of sentiment.
“Consumer Confidence remains among the weakest readings of the past decade even after two consecutive improvements, while the US Stock Market Index set a fresh all-time high on August 7 and holds just beneath it,” it summarized.
The softer US inflation prints helped send the S&P 500 to all-time highs of 7,816 on Thursday. At the same time, the consumer sentiment survey by the University of Michigan is expected to drop 7.6% in August.
“Weak sentiment next to record prices looks like a contradiction until the driver is named: households that expect living costs to rise and the economy to soften are moving out of cash and into assets. The equity market, carried above all by the AI trade, is where that capital lands,” Glassnode commented.
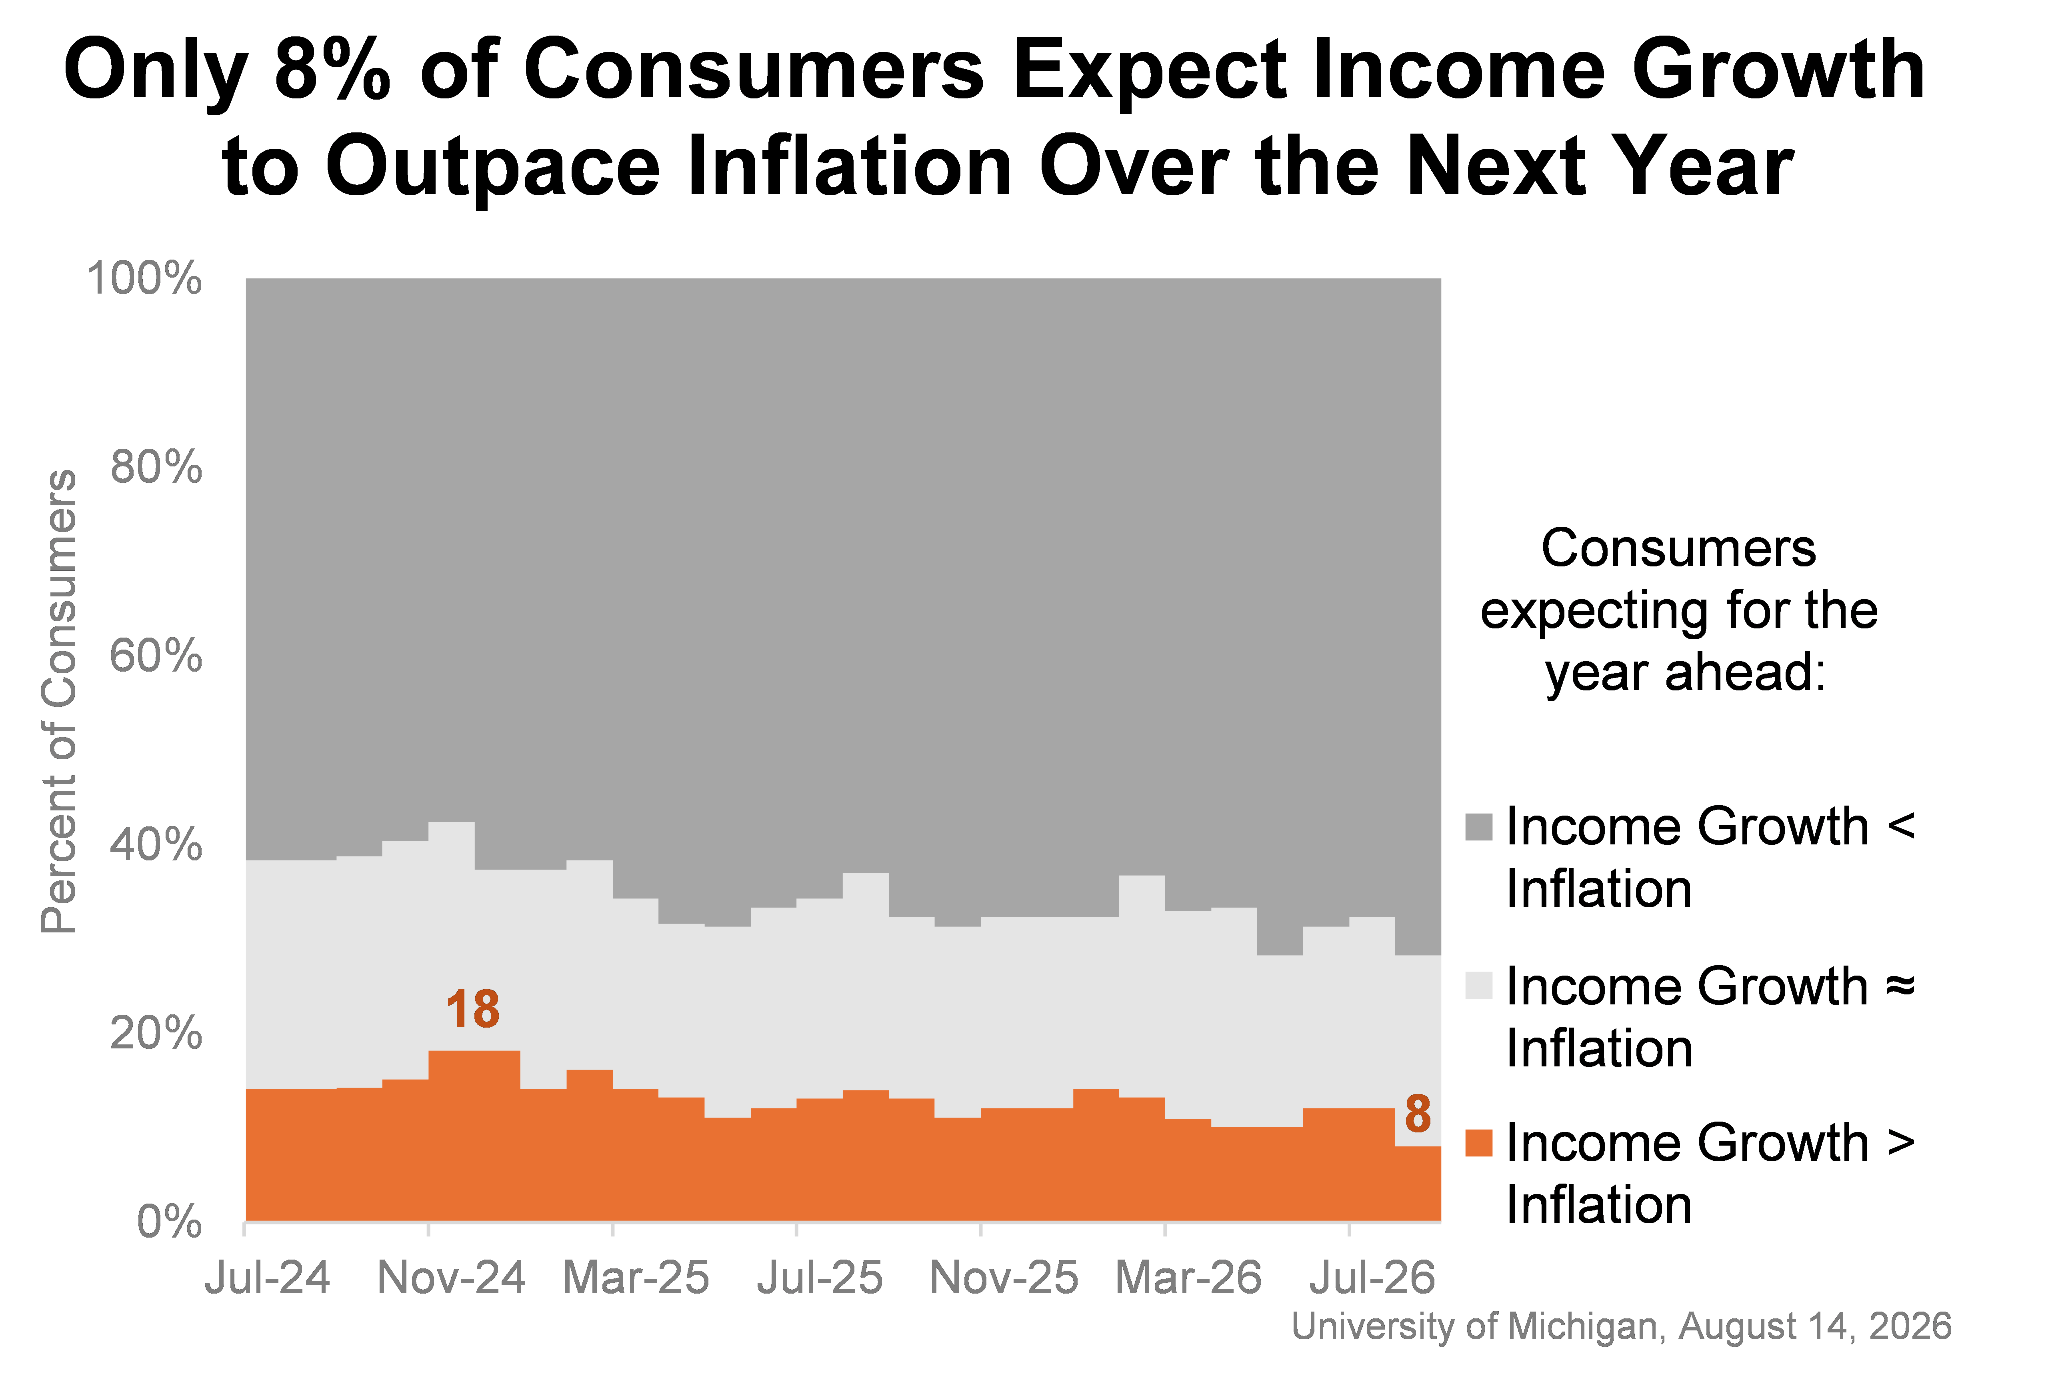
US consumer sentiment data. Source: University of Michigan
Bitcoin continues to be left out of this capital rotation. A sign of change, Glassnode argued, would be a sustained rebound in institutional inflows to the US spot Bitcoin exchange-traded funds (ETFs).
Last week, these saw net outflows of $267.2 million, per data from UK-based investment company Farside Investors. Just one out of five trading days finished with net inflows, totaling a mere $7.8 million.
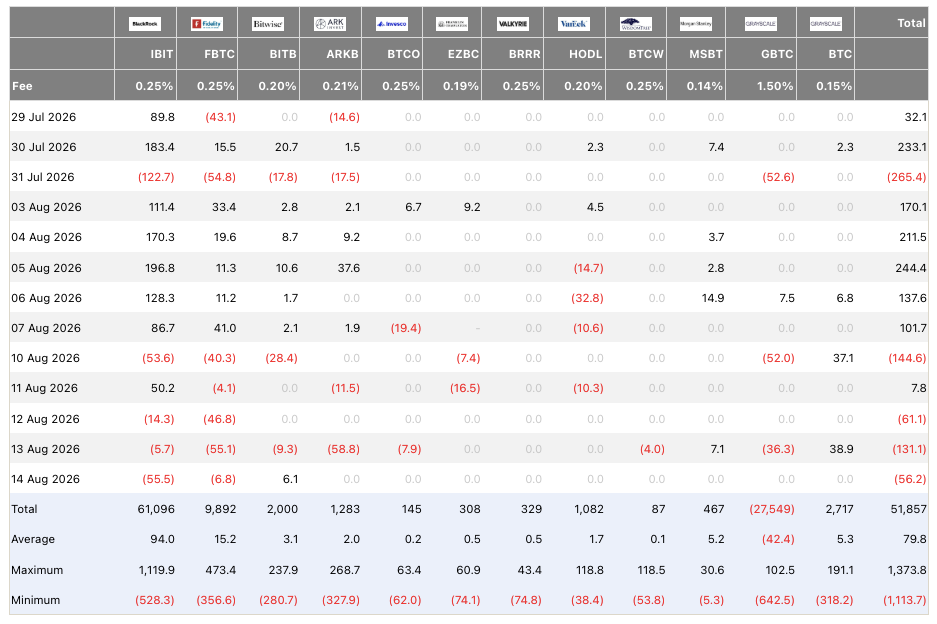
US spot Bitcoin ETF netflows (screenshot). Source: Farside Investors
Exchange BTC reserves grow with whale inflows in focus
Bitcoin supply dynamics are the latest troubling feature for its price trajectory, CryptoQuant analysis reports.
Related: Here’s what happened in crypto today
Whales have started to dominate exchange inflows, exacerbating an existing absence of retail interest and causing exchange BTC reserves to reverse higher. Binance’s whale ratio reached 0.71 on Aug. 10, its highest since early March.
“Exchange deposits do not necessarily mean immediate selling, but they increase the amount of BTC available for trading or hedging,” CryptoQuant commented.
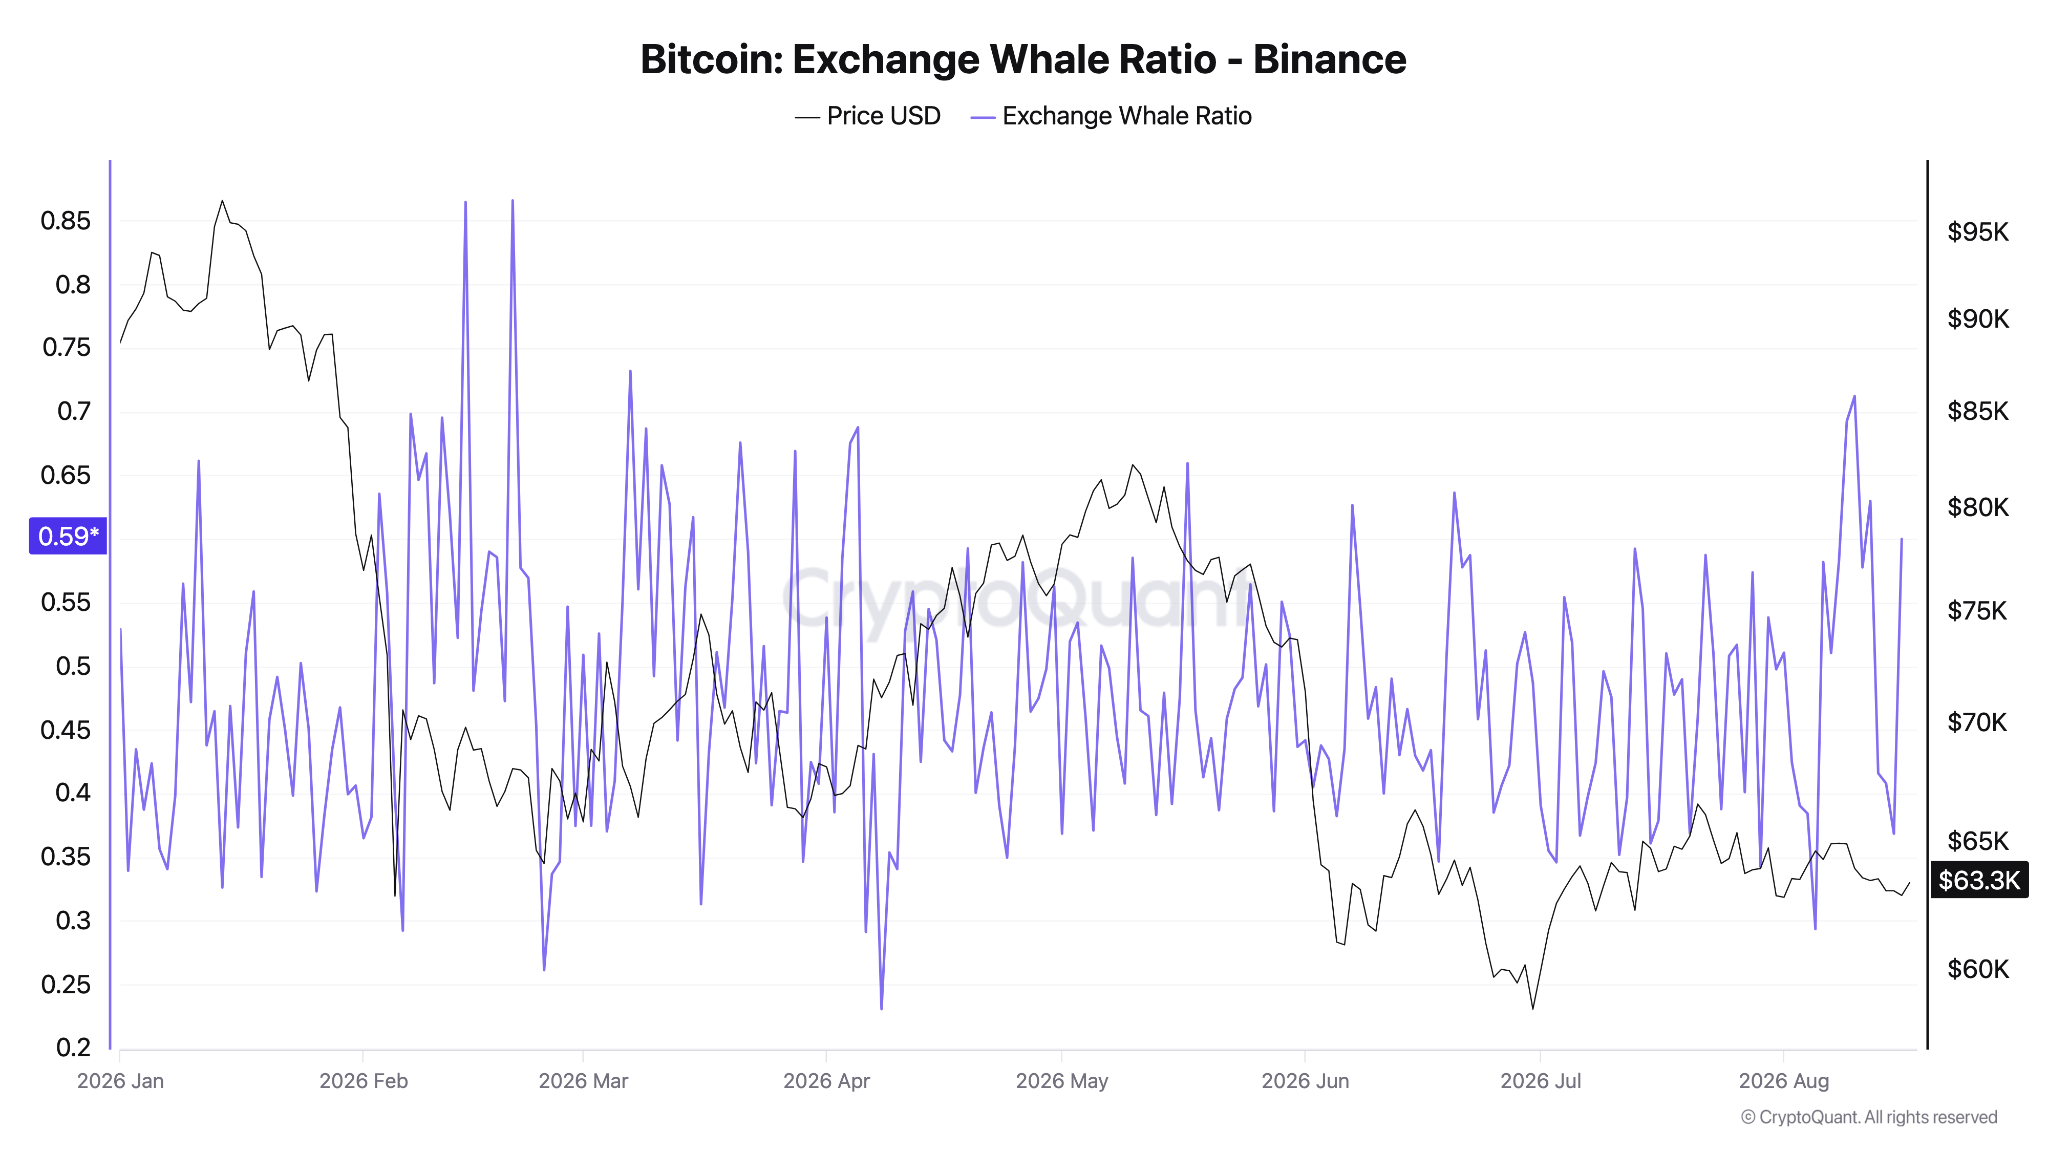
Binance exchange whale ratio. Source: CryptoQuant
Binance’s BTC reserves totaled 674,332 BTC on Sunday, up 2.57% month-to-date and at their highest since November 2025.
“The long-running trend of BTC leaving exchanges may therefore be weakening,” CryptoQuant continued.
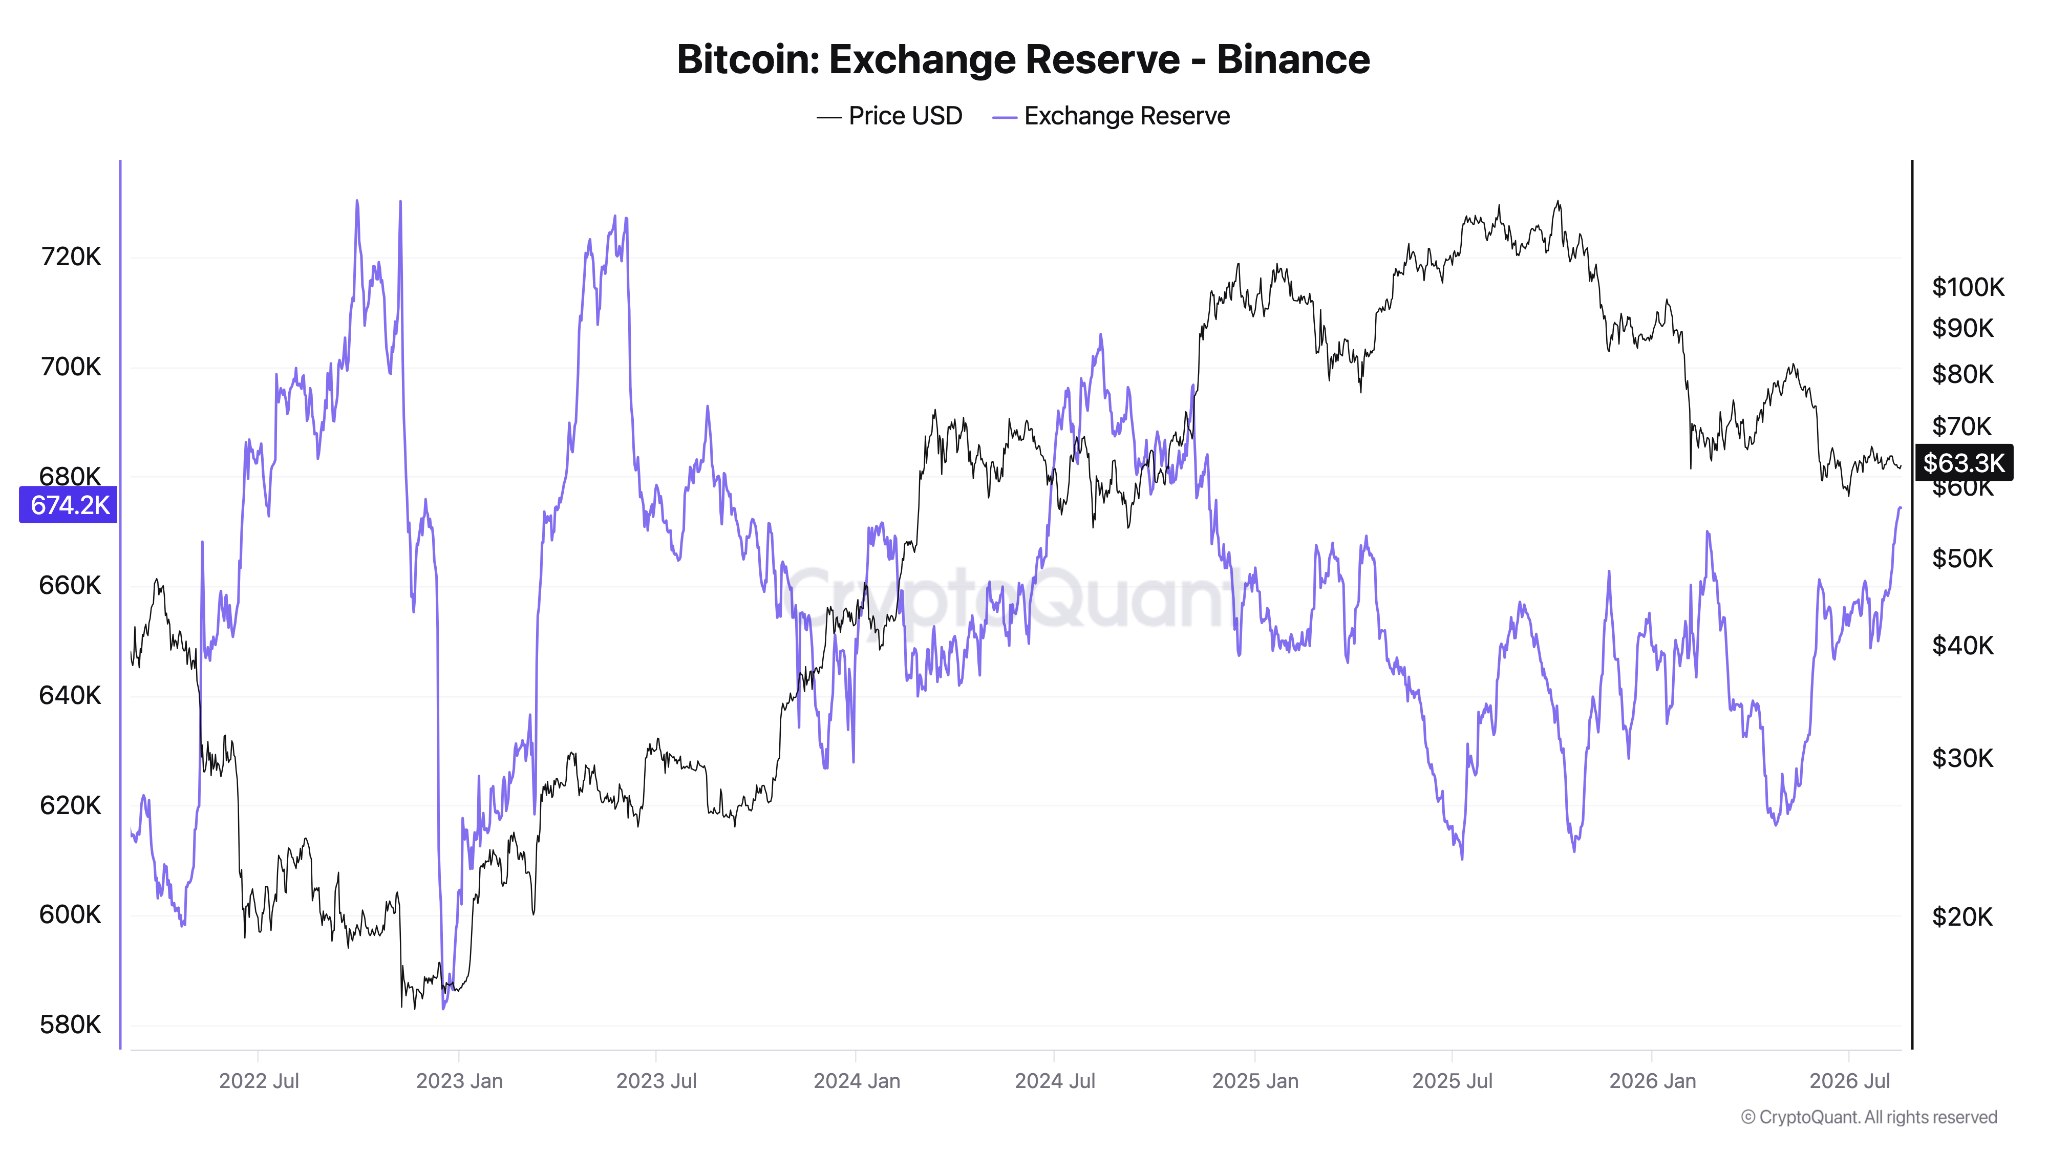
Binance BTC reserves. Source: CryptoQuant
As Cointelegraph reported, exchange activity has been driven by derivatives markets as BTC/USD trades in a tight range since early June. On Binance, futures trading volume was eight times that of spot markets in early August.

Pyongyang has also aggressively expanded its global military footprint following its June 2024 comprehensive strategic partnership with Moscow, dispatching more than 14,000 North Korean troops, artillery ammunition, and ballistic missiles to support Vladimir Putin’s war in Ukraine. (Ukrainian President Volodymyr Zelenskyy has warned that Kim is preparing to deploy 30,000 more.)
Trump’s criticism of South Korea for declining to help “denuclearize” Iran also sits uneasily alongside North Korea’s longstanding role in the development of Tehran’s strategic weapons programs. From a counter-proliferation perspective, North Korea presents a distinct challenge: unlike Iran, it already possesses an operational nuclear arsenal and has an extensive history of transferring missile and military technology abroad.
“The North Koreans provided Iran with technical assistance, building turnkey factories, technology design, production capabilities, tactics—those kinds of things,” says Daniel Pinkston, an international relations expert at Troy University in Seoul. “Technological agreements and high-level scientific visits go back years.”
Crypto World
Search Interest in Prediction Markets Falls 83% From Its World Cup Peak as Kalshi Pulls Away


Worldwide search interest in prediction markets has returned to roughly where it sat before the 2026 World Cup, and the two venues that take almost all the category's trading volume are moving apart as it does. Both peaks in Google's data land on tournament dates. The decline since is a return to… Read the full story at The Defiant

Deel Takes Its DLUSD Stablecoin Wallet to More Than 80 Countries
What happened to the cast of “CHiPs”? See the stars nearly 50 years later

Andy Burnham faces revolt over North Sea oil and gas as Kemi tells PM ‘time to get Britain drilling’

Weekend Open Thread: Staud – Corporette.com

Weekend Open Thread – Corporette.com

Weekend Open Thread: Brooks Brothers

The Moment Your Money Starts Working Harder Than You

#motivation #MoneySecrets #money #shorts #viral #trending #viralvideo #reels #viralshorts #youtube

Is the dinar part of a global financial reset ? #dinar #globalfinancialcrisis
-

 Fashion3 days ago
Weekend Open Thread: Ann Taylor
-
 NewsBeat6 days ago
Communication cards help banking customers access services or report scams
-
 Business7 days ago
Oil Price Today (August 11): Crude oil rises to $88 after Trump’s compensation demand dents Hormuz opening. Here’s why
-

 Crypto World7 days ago
Revolut wins French banking licence, creates second EU banking hub
-
 Sports4 days ago
This U.S. Amateur is a glimpse into golf’s future in more ways than you think
-
 Crypto World7 days ago
Why Did Nvidia Stock Fall on Monday Despite a $500 Billion Wall Street AI Deal?
-

 Sports3 days ago
Birmingham 2026: Day 6 Timetable for Irish Athletes
-
 NewsBeat3 days ago
Myanmar says over 300,000 Rohingya refugees verified for repatriation as exodus enters ninth year
-

 Politics2 days ago
SEQ Code: The Three Letter Boarding Pass Code That Could Give You The Worst Seat
-
 Entertainment5 days ago
Keke Palmer Subtly Hints At Sean Evans Drama With Cryptic Post
-
 Entertainment7 days ago
57 Years Later, the Best Sitcom Ever Made Still Deserves a Reboot
-

 Fashion6 days ago
Coffee Break: The Fonteyn Jane Flat
-

 Tech6 days ago
Zoom Screen-Sharing Bug Let People Fully Take Over Other Devices On A Call
-

 Crypto World7 days ago
Bitcoin's BIP Editors Remove Luke Dashjr Two Days After BIP-110 Fork Stalled
-

 Fashion6 days ago
Should you refinance your debt? Pros, cons, and real numbers
-

 Fashion6 days ago
Claire Life: Kicking Off MVAAFF With the C Suite Luncheon Featuring Phylicia Rashad, Letoya Luckett, and More!
-
 Crypto World6 days ago
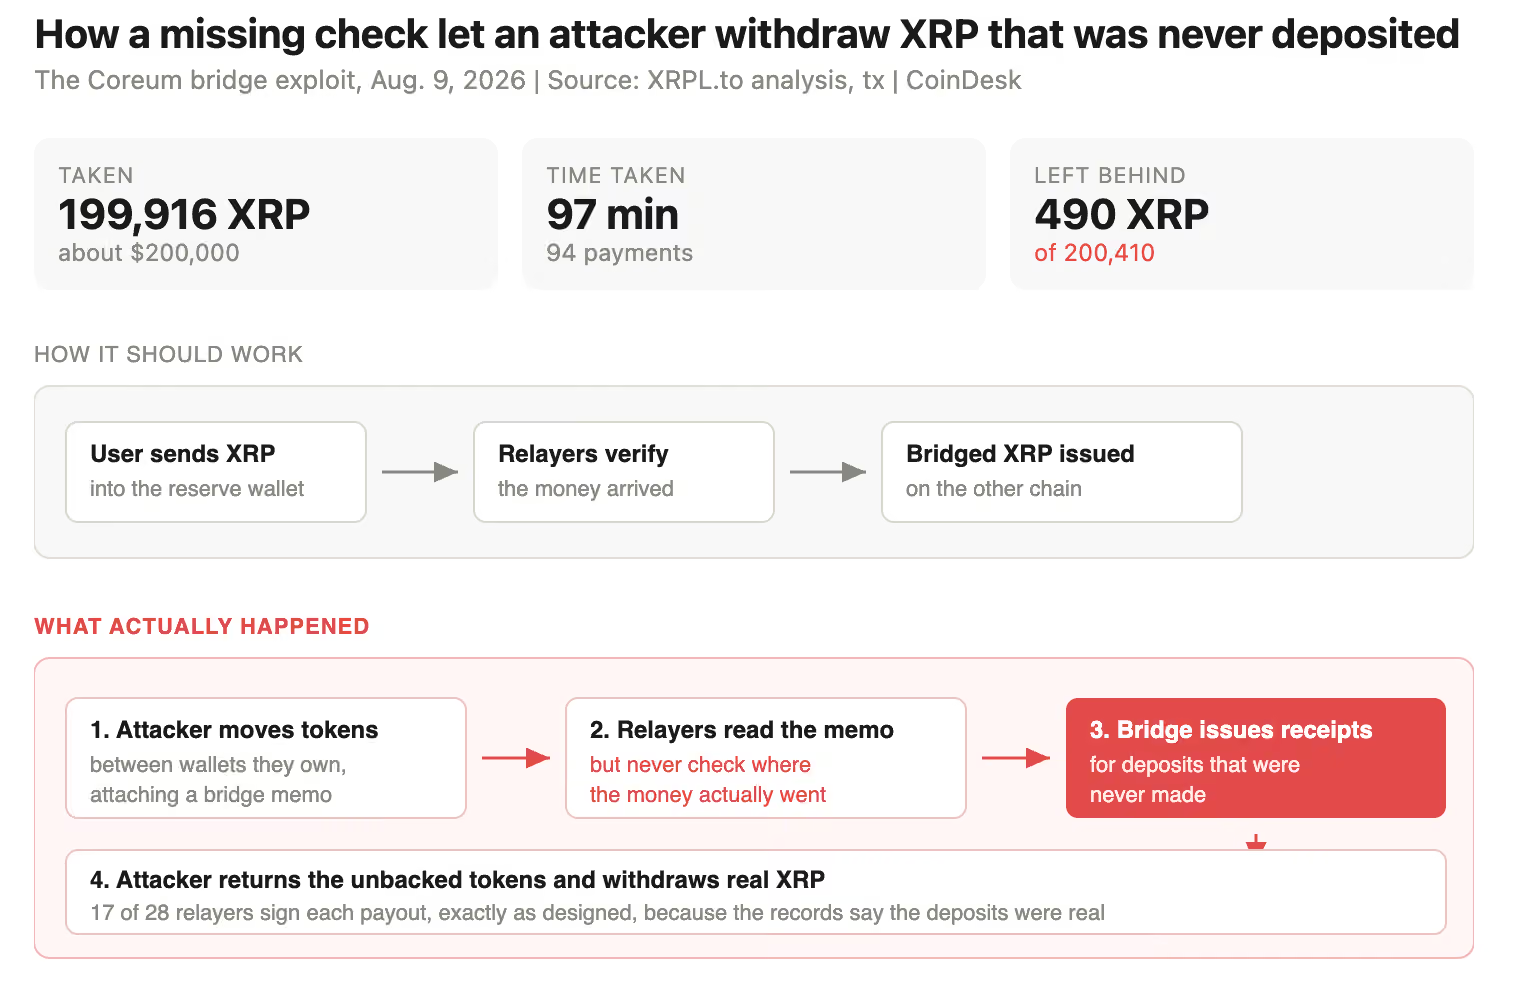
XRP bridge drained after software mistook fake deposits for real ones
-

 Sports5 days ago
DeQuan Jones in ‘high spirits’ after successful leg surgery
-
 Tech7 days ago
Zuck rekindles open weights Llama drama with Muse Glimmer
-

 Fashion7 days ago
How to Mix Diamond Rings With Gold & Silver Jewelry
You must be logged in to post a comment Login