

Crypto World
Zcash Founding Scientist Challenges Bitcoin’s 21 Million Cap

StarkWare CEO Eli Ben-Sasson, a founding scientist of the privacy coin Zcash, challenged Bitcoin’s 21 million cap this week. He argued that lost private keys will steadily shrink the usable supply and proposed a 4% annual issuance limit instead.
The pushback was immediate, since Bitcoin supporters treat the fixed supply as the network’s founding promise. Zcash creator Zooko Wilcox answered with a rival design that keeps hard caps intact.

Why Ben-Sasson Says Bitcoin’s 21 Million Cap Fails
Ben-Sasson helped invent the STARK proof system now used across crypto and co-authored Zerocash, the 2014 design behind Zcash. His critique starts from the numbers on lost coins.
Chainalysis estimated that 2.78 million to 3.79 million BTC were already unrecoverable by 2017. The figure assumes Satoshi Nakamoto’s untouched coins are gone for good. Courts are still weighing dormant Bitcoin wallet claims worth $235 billion.
“Capping the supply of Bitcoin at 21M doesn’t make sense… In fact, as time goes to infinity, all keys will be lost. I strongly support a clear monetary policy with an absolute upper bound on the # of Bitcoins in the future,” he suggested.
He set the ceiling at 4% a year, roughly matching population growth. A steady flow of new coins would also keep paying miners after 2140, when Bitcoin stops minting rewards. Roughly 95.5% of all Bitcoin already exists.
Meanwhile, transaction fees near 2019 lows sharpen that concern, echoing earlier Bitcoin security budget warnings.
Zcash Answers With Burns and Formal Proofs
Wilcox pointed Ben-Sasson to Shielded Labs’ Network Sustainability Mechanism. Holders can voluntarily destroy their own coins, which the network later re-creates as miner rewards. Zcash’s own 21 million cap stays intact.
The numbers explain Ben-Sasson’s doubts. The mechanism proposes burning 60% of transaction fees, about 210 ZEC per year. He argued that sums that small cannot fund miners meaningfully, repeating that capping inflation beats capping supply.
Precedent cuts both ways here. Monero took the other path in 2022, adding a small permanent reward of 0.6 XMR per block. However, Bitcoin developers have repeatedly rejected similar ideas.
The Zcash camp is also attacking the opposite risk, secret inflation. Sean Bowe, the cryptographer behind Zcash’s major privacy upgrades, is building that proof under Tachyon. He said the work is close to showing that no hidden bug can secretly create coins in the new Ironwood pool.
Bitcoin advocates remain unmoved, echoing Michael Saylor’s argument that the network wins by refusing to change.
The proposal has almost no path to activation, yet it revives a question Bitcoin must eventually answer. Can transaction fees alone secure the network once the last rewards disappear?
The post Zcash Founding Scientist Challenges Bitcoin’s 21 Million Cap appeared first on BeInCrypto.



Meta launched Muse Spark 1.1 on July 9. The company priced its first paid AI model far below Anthropic’s Claude and OpenAI’s ChatGPT. The move puts Meta squarely in the coding and agentic AI market, which both rivals currently dominate.
The launch marks a sharp shift from Meta’s open-source Llama strategy. AI chief Alexandr Wang said Meta built the pricing to compete directly with the two market leaders.
Muse Spark’s Aggressive Pricing Play
Meta priced the new model at $1.25 per million input tokens and $4.25 per million output tokens. New accounts get $20 in free credits before billing starts.
Muse Spark 1.1 undercuts all major AI rivals on price. Its $1.25 input rate runs 37% below Sonnet 5’s introductory $2 and 75% below Opus 4.8 and GPT-5.5, which both charge $5.
The output side shows an even wider gap. Meta’s $4.25 rate sits 58% below Sonnet 5’s introductory $10, 83% below Opus 4.8’s $25, and 86% below GPT-5.5’s $30.
That pricing gap could matter most for heavy, high-volume workloads. A developer running the same task across all four models would pay Meta’s rate for less than a third of what GPT-5.5 charges on output alone. The gap also lands amid the broader OpenAI price war with Anthropic.
The gap narrows once Sonnet 5’s introductory pricing expires on August 31, though Meta still comes out cheaper on both ends even against the standard $3/$15 rate.
“Very aggressive and attractive.”
Alexandr Wang, Meta AI chief, to CNBC
Meta detailed the specifics in Meta’s paid API pivot. It marks the company’s first ever charge for AI model access after years of free Llama releases.
Can Muse Spark Overthrow Claude and ChatGPT?
Muse Spark 1.1 reportedly rivals GPT-5.5 and Claude Opus 4.8 on agentic benchmarks, per posts from developers tracking the launch. Meta has not published independent scores against either rival.
Access remains limited. The public preview covers only US developers, requires a waitlist, and stays off third party marketplaces like OpenRouter.
Cheaper access could pull developers toward Meta’s model over time. Whether Muse Spark can match Claude and ChatGPT on real world coding tasks remains unproven.
The post What Is Meta’s AI Muse Spark and Can It Overthrow Claude and ChatGPT? appeared first on BeInCrypto.


Every token launched on Pump.fun, every fair-launch memecoin, and a surprising share of DeFi’s core machinery runs on the same idea: a mathematical formula that sets a token’s price from its supply, with a smart contract as the only market maker. This guide explains how bonding curves actually work, the worked math of buying up a curve, the graduation model that industrialized token launches, the sniper and bundler attacks that exploit it, and where the elegant idea breaks.
Summary
- Bonding curves use a mathematical formula to set token prices based on supply, allowing tokens to launch without order books or external market makers.
- Platforms such as Pump.fun use bonding curves to bootstrap liquidity before moving successful tokens into automated market maker pools through a graduation process.
- While bonding curves make token launches transparent and permissionless, they remain vulnerable to sniper bots, bundled buys and liquidity limitations during exits.
Somewhere in the time it takes to read this paragraph, a new token will be created on a bonding curve. It will have no order book, no market maker, no seeded liquidity, and no listing process, and it will nevertheless be instantly tradable, with a live price, from its first second of existence. The mechanism making that possible is a bonding curve: a mathematical function, enforced by a smart contract, that maps the token’s supply to its price, so that every purchase mints tokens and pushes the price up the curve, and every sale burns tokens and slides it back down.
Bonding curves are among the oldest ideas in decentralized finance, sketched by Simon de la Rouviere in 2017 and formalized in Bancor’s early work, and for years they lived in the ecosystem’s academic corners, pricing continuous tokens and DAO shares. Then the memecoin era found them. Pump.fun built its entire launch machine on a bonding curve, over a million tokens have entered the world through it, and the curve became the defining market structure of an entire trading culture, the trenches, where fortunes are made and lost inside a formula most participants have never read.
This guide reads the formula. It covers what a bonding curve is and how the mint-and-burn mechanism works, the worked arithmetic of buying up a curve, the main curve shapes and what each one incentivizes, the launchpad graduation model that turned curves into an industrial process, the attack playbook, snipers, bundlers, and the exit-liquidity geometry, that exploits them, how bonding curves relate to the automated market makers that power DeFi’s exchanges, and the honest assessment of what the mechanism fixes and what it merely relocates.
The core mechanism: price as a function of supply
A bonding curve is, at bottom, one equation: price equals some function of supply, P = f(S). The smart contract implementing it holds a reserve of a base asset, SOL on Pump.fun, ETH or a stablecoin elsewhere, and stands ready, permanently and automatically, to be the counterparty to anyone.
Buying works like this: a user sends the reserve asset to the contract; the contract consults the curve, calculates how many new tokens that payment purchases given the current supply, mints them, and delivers them; the supply is now higher, so the curve dictates a higher price for the next buyer. Selling reverses it: the user returns tokens, the contract burns them and pays out reserve assets at the curve’s current rate, and the price steps down. Nobody quotes prices, nobody provides liquidity, and nobody can refuse the trade; the contract is issuer, exchange, and market maker fused into one piece of code, a vending machine whose price tag adjusts after every sale.
Two properties follow immediately, and they explain the mechanism’s appeal. The first is guaranteed liquidity: because the contract always stands on the other side, a curve-launched token can never be unsellable in the way an order-book token with no bids can; there is always an exit price, however low. The second is deterministic pricing: the formula is public and fixed, so the price impact of any trade can be computed exactly in advance, slippage as a published schedule rather than a surprise. Together they solve the cold-start problem that killed a decade of token launches: how to make a brand-new asset tradable before any market exists for it. The curve is the market, from block one.
The worked math: buying up the curve
Numbers make the mechanism honest, so walk one simple example. Suppose a token launches on a linear curve where the price starts at $0.001 and rises by $0.001 for every 100,000 tokens minted. The first buyer spends $100: at prices between $0.001 and roughly $0.0011, they receive a bit over 95,000 tokens, an average price near $0.00105, already above the starting tick because their own purchase moved the curve. A second buyer now spends $1,000 into the higher range and receives proportionally fewer tokens per dollar, perhaps 600,000 tokens at an average near $0.0016. A third spends $10,000 and pushes the price past $0.006.
Notice what the arithmetic did. The first buyer’s 95,000 tokens, bought for $100, are now worth nearly $600 at the marginal price, an unrealized 6x for simply being early, and that is the entire psychological engine of curve trading: the formula converts earliness itself into profit, mechanically, visibly, in real time. Notice also what it did not do: create any external demand. The third buyer’s $10,000 is what values the first buyer’s position, and if the third buyer sells back into the curve, the price retraces down the same path it climbed. A bonding curve is a perfectly transparent game of musical chairs in which the music, the chair count, and everyone’s seat are published on-chain, and it is precisely this transparency that its defenders cite as the fairness: unlike a rigged order book or an insider allocation, the curve cheats no one, because everyone can read exactly what they are stepping into.
The curve’s shape sets the game’s temperature. Linear curves rise gently and reward early buyers modestly; exponential curves, where each purchase raises the price by a percentage rather than an increment, produce the vertical charts and 100x-in-an-hour outcomes that memecoin culture selects for; logarithmic and flattening curves front-load the appreciation then stabilize, a design used when a project wants early supporters rewarded but later prices calm. Bancor-style designs parameterize this with a reserve ratio, the fraction of the token’s market value held as reserve collateral, where lower ratios mean steeper, more explosive, more fragile curves. Every launchpad’s choice of shape is a statement about what behavior it wants, and the memecoin era’s revealed preference has been unambiguous: steep.
Graduation: the model that industrialized launches
The design that conquered the market, Pump.fun’s, added one crucial idea to the classic curve: an ending. Tokens on the platform begin life on a bonding curve, and when buying pushes the market value to a threshold, historically in the $60,000-70,000 range, the token graduates: the curve phase closes, and the accumulated reserve is deposited, together with tokens, into a conventional automated-market-maker pool on the platform’s own venue, where the token trades like any other from then on.
Graduation solved the curve’s deepest historical problem, which is that a pure bonding curve is a closed economy: its price can only reflect flows into and out of itself, it cannot arbitrage against external markets, and its reserve is a honeypot whose smart-contract risk grows with size. By using the curve only as a launch chamber, a price-discovery and liquidity-bootstrapping phase, and then handing the survivors to a normal market, the graduation model captured the curve’s cold-start magic while shedding its long-term liabilities. It also created, deliberately, a tournament structure: the overwhelming majority of launched tokens never graduate, dying quietly on their curves, while the few that cross the threshold receive instant liquidity, visibility, and the implicit endorsement of survival. The platform collects fees at every stage, an economics this publication examined through its own token’s stress test, and the tournament runs continuously, thousands of times a day, the purest expression of permissionless market Darwinism crypto has produced.
It is worth being precise about what fair launch means in this structure, because the term does heavy marketing work. The curve guarantees procedural fairness: no presale, no allocation, identical rules for every participant, and a price schedule known in advance. It does not and cannot guarantee distributive fairness, because identical rules reward unequal speed, information, and capital, which is where the attack playbook begins.
Where curves came from, and where they went
The bonding curve’s biography explains its present better than any specification. The idea emerged from 2017-era token engineering, de la Rouviere’s continuous organizations, Bancor’s reserve-ratio formalism, as an answer to a governance-age question: how should communities issue and price membership continuously, without discrete sales? The early implementations were earnest and mostly ignored, curation markets, DAO shares, continuous funding for public goods, sophisticated designs waiting for a use case that never arrived at scale. The idea survived the 2018 winter in academic corners and resurfaced wherever cold-start liquidity was the binding problem: SocialFi’s creator keys priced follower access on steep exponential curves during the Friend.tech moment, NFT projects experimented with curve-priced mints, and stablecoin architectures quietly used flattened curves to hold pegs between correlated assets.
Then Solana’s memecoin culture supplied the use case the theorists never imagined: not funding organizations, but manufacturing lottery tickets at industrial scale. Pump.fun’s January 2024 launch stripped the concept to its essentials, one standard steep curve, one graduation rule, one-click creation, and the result processed more token launches in its first two years than the rest of crypto’s history combined. The pattern spread instantly: every major chain grew launchpad clones, incumbent platforms bolted on curve launches, and the bonding curve, born as a tool for patient community capital, became the engine of the fastest, most disposable market ever built. There is a genuine irony in the arc, and also a lesson about mechanisms: the curve did not choose its culture. It priced earliness deterministically, and the market that valued earliness most, the memecoin trenches, adopted it hardest. Mechanisms are amplifiers of the demand they meet, and the curve’s history is the cleanest proof in crypto’s archive.
The creator’s side of the modern launchpad economy deserves its own accounting, because the curve reshaped it too. Launching a token once required capital: liquidity to seed, market makers to hire, listings to buy. The curve reduced the cost to a transaction fee, which transformed token creation from an investment into a lottery ticket, and creators responded rationally by buying thousands of tickets: serial launches, A-B testing of tickers and memes, portfolios of hundreds of attempts awaiting one graduation. Platform fee-sharing programs, paying creators a slice of their token’s trading fees, industrialized the incentive further, producing a professional class of launchers whose economics resemble content creation more than entrepreneurship: volume, iteration, and the occasional viral hit subsidizing the long tail of duds. Whether that economy is a democratization of finance or a spam machine with a fee switch is the debate that follows the launchpads everywhere, and the honest answer is that the curve, as always, executes whichever game arrives.
The attack playbook: snipers, bundlers, and exit geometry
Every property that makes curves fair in principle is exploitable in practice, and the exploits are now industries.
The first is sniping. Because the earliest positions on a steep curve capture the largest mechanical gains, bots monitor token-creation transactions and buy within the same block a token launches, frequently faster than the creator’s own community can. The playing field is level in exactly the way a footrace against professional sprinters is level, and the same latency-and-priority infrastructure that powers all on-chain extraction dominates curve entry.
The second is bundling: a launcher, or an attacker, splits a large early buy across dozens of wallets in the launch block, manufacturing the appearance of broad organic demand while concentrating the curve’s cheapest supply in one pair of hands. Bundled launches are the modern rug’s preferred anatomy: the bundler rides the crowd up the curve and exits into it, and because the curve guarantees liquidity, the exit always executes; the guarantee that no holder can be trapped is equally the guarantee that no dumper can be refused. Detection tools now score launches for bundling patterns, and the arms race between bundlers and detectors is a permanent feature of the trenches.
The third is the exit geometry itself, subtler and universal. On any curve, the reserve held by the contract equals the area under the curve up to the current supply, which is always less than the current supply times the current price, the market cap. On steep curves the gap is enormous: a token can show a $60,000 market value while its curve holds a fraction of that in actual reserve, meaning that if every holder tried to exit, the average exit price would sit far below the last trade. The curve never lies about this, the math is public, but the market-cap number is what trades on screens and in heads, and the difference between marked value and extractable value is where most curve-trading losses actually live. It is the same lesson every thin market teaches,the gap between the last price and the liquidation reality, rendered in its mathematically purest form.
One number from the tournament’s own accounting calibrates the odds honestly. Across the launchpad era, graduation rates, the fraction of launched tokens that ever cross the threshold into a real market, have run in the low single digits, and the fraction that sustains any liquidity a month later is a fraction of that fraction. The curve’s defenders and critics both own this statistic: defenders because it proves the tournament filters ruthlessly at near-zero cost per attempt, an efficiency no venture process approaches, and critics because it quantifies the base rate every buyer of a fresh launch is fighting. Neither reading changes the practical arithmetic for a participant: the expected value of a random curve entry is set by that base rate times the payoff distribution, both of which are public, and the traders who survive the trenches are, almost by definition, the ones who stopped treating the odds as someone else’s problem. The curve publishes everything. The tournament’s mortality table is part of everything.
Curves and AMMs: the same family, different jobs
A final clarification earns its place because the terms blur constantly: bonding curves and automated market makers are siblings, not synonyms. An AMM like Uniswap uses a curve, the constant-product formula x*y = k, to price swaps between two tokens that already exist, with liquidity supplied by outside providers who bear the divergence costs of that role. A bonding curve in the issuance sense uses its formula to govern the minting and burning of a token against a reserve, with the contract itself as issuer and sole liquidity source. The mathematics rhyme; the jobs differ: AMM curves make secondary markets, issuance curves make primary ones, and the graduation model is precisely a pipeline from the second to the first. Knowing which kind of curve a token sits on is the first diligence question in this corner of the market, because it determines who holds the reserve, who can change the rules, and what the sell-side guarantee actually is.
One boundary condition also deserves a sentence: curves are single-market objects, and their guarantees end at the contract’s edge. The moment a token graduates, or trades simultaneously on external venues, its price becomes an arbitrage between markets, the curve’s determinism dissolves into ordinary microstructure, and the trader’s toolkit reverts to the standard one of depth, spreads, and flows. The curve is training wheels with perfect physics; the road afterward is the road.
The honest assessment
Bonding curves deserve both their reputation and their notoriety, and an honest summary holds both. What they genuinely fixed is real: the cold-start problem is solved, launch gatekeeping is gone, insider allocations are structurally impossible on a pure curve, and pricing is the most transparent in all of finance, a formula anyone can read. What they merely relocated is equally real: the advantage moved from insiders with allocations to insiders with infrastructure, the risk moved from being unable to sell to being mathematically last, and the fairness became procedural while the outcomes stayed as skewed as ever, because the curve prices earliness and earliness is not evenly distributed. The mechanism is a mirror: it executes exactly the game its participants bring to it, faster and more honestly than any structure before it. For a user, the practical wisdom compresses to three habits: read the curve’s shape before buying, because it is the payout table; check the launch block for bundling, because the table may be seated; and never confuse the marked price with the exit price, because the area under the curve, not the last tick, is what everyone is actually fighting over.
A closing thought on where the mechanism goes next, because the design space is not finished. Dynamic curves that adjust steepness to demand, anti-sniping randomization of launch blocks, creator-fee structures that reward holding over flipping, and curve designs that route a share of the ride into locked liquidity or holder distributions are all live experiments across the launchpad ecosystem, each an attempt to keep the cold-start magic while sanding down the extraction. The direction of travel is legible: first-generation curves optimized for launch velocity, and the survivors of the current era are optimizing, under competitive and community pressure, for what happens after the launch, retention, distribution, durability, the boring variables that decide whether a mechanism that can create a million tokens can ever create a lasting one. The formula will keep evolving. The lesson it has already taught is permanent: in permissionless markets, the launch mechanism is the market structure, and reading it is not optional homework but the trade itself.
And for readers who arrived here from a chart rather than a curiosity, the fifteen-second version: find the token’s curve page, note its shape and its distance from graduation, check the launch block for clustered wallets, compare the contract’s reserve to the displayed market value, and size the position as a ticket in a tournament whose mortality table you have now read. The formula will do exactly what it says. Everything else is the crowd.
The bonding curve, in the end, belongs to a small class of crypto inventions, alongside the flash loan and the automated market maker, that could not have existed in prior financial systems: it requires a machine that can hold reserves, enforce a formula, and stand as a tireless counterparty, all without an operator, and it converts the oldest problem in market design, who makes the first market, into a line of arithmetic. That the memecoin era found it first says something about crypto’s culture; that it works, flawlessly and continuously, across millions of launches says something about the technology, and both statements will outlive whatever the trenches are trading this month.
Disclaimer: This article is for educational purposes only and does not constitute investment advice. Memecoin and DeFi markets are extremely volatile and you can lose your entire investment. Details are current as of July 9, 2026. Always do your own research.
Frequently asked questions
What is a bonding curve in simple terms?
A bonding curve is a formula, enforced by a smart contract, that sets a token’s price based on how many tokens exist. Buying mints new tokens and pushes the price up the curve; selling burns tokens and moves it down. The contract holds a reserve of a base asset and acts as the permanent counterparty, so the token is tradable from the instant it is created, with no order book or market maker.
How does a bonding curve launch work on platforms like Pump.fun?
A creator launches a token onto the platform’s standard curve for a tiny fee. Buyers purchase directly from the curve, moving the price up as supply grows. If demand pushes the token’s value to the graduation threshold, the accumulated reserve and tokens are moved into a normal trading pool and the token trades conventionally from then on. Most tokens never graduate and simply fade on their curves.
Why does the price rise when people buy?
Because the formula ties price directly to supply. Each purchase mints tokens, raising supply, and the curve assigns a higher price to every subsequent token. The steeper the curve’s shape, the faster the price accelerates, which is why memecoin launches can multiply in minutes on relatively small inflows.
Can a bonding curve token become unsellable?
Not in the order-book sense: the contract always buys tokens back at the curve’s current rate, funded by its reserve, so an exit price always exists. The real risk is that the exit price after others sell is far below what you paid, and that the total reserve is always less than the token’s headline market value, so not everyone can exit near the last traded price.
What is a fair launch, and are bonding curves actually fair?
A fair launch means no presale, no team allocation, and identical rules for all buyers from block one, which pure bonding curves deliver procedurally. In practice, speed and infrastructure decide who gets the cheapest supply: sniper bots buy in the launch block and bundlers split large buys across many wallets to disguise concentration. The rules are equal; the race is not.
What is the difference between a bonding curve and an AMM like Uniswap?
Both use formulas to set prices, but an AMM curve governs swaps between two tokens that already exist, using liquidity deposited by outside providers, while an issuance bonding curve governs the minting and burning of a token against a reserve held by the contract itself. Launch curves create primary markets; AMMs run secondary ones.
What are the main risks of buying on a bonding curve?
Being late on a steep curve, where the mechanical advantage belongs entirely to earlier buyers; bundled launches, where one actor secretly holds the cheap supply and exits into the crowd; smart-contract flaws in the curve itself; and the reserve gap, since the contract’s reserve is always smaller than the token’s marked value. The formula is transparent, so most losses come from not reading it.
Are bonding curves used for anything besides memecoins?
Yes. They price continuous tokens and DAO shares, bootstrap liquidity for new projects, structure token sales that replace ICOs, and underpin stablecoin and pegged-asset designs using flattened curves. The memecoin launchpad is the most visible application, but the mechanism is general-purpose market infrastructure.
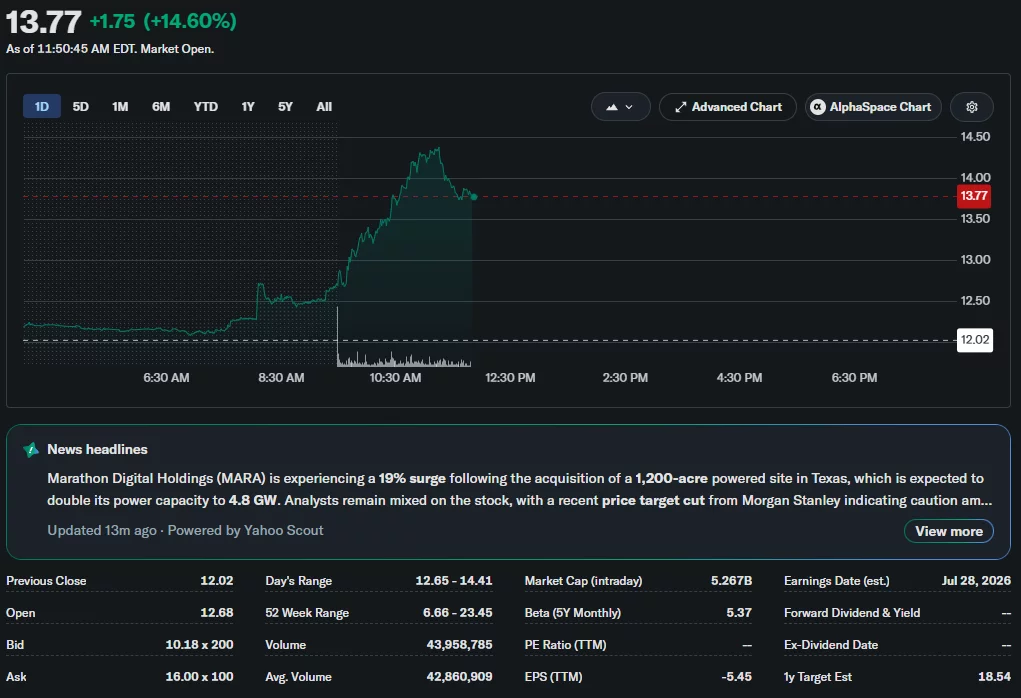
MARA Holdings has expanded its AI and digital infrastructure footprint by acquiring a 1,200-acre powered land site in Texas, helping lift its shares more than 12% as the Bitcoin miner continues to outperform many publicly traded crypto companies.
Summary
- MARA has acquired a 1,200-acre powered site in Texas with up to 2 GW of planned grid capacity.
- The company plans to build an AI and high-performance computing campus alongside Bitcoin mining operations.
- MARA shares jumped more than 12% after the announcement, extending gains to over 45% this year.
According to a company press release, MARA has signed a definitive agreement to acquire the Texas property from HIF. The site is expected to provide access to an initial 1 gigawatt of grid capacity by October 2027, with total available capacity projected to reach 2 gigawatts by April 2028.
The company said the location is designed to support large-scale digital infrastructure alongside its existing Bitcoin mining operations.
The announcement extends MARA’s investment in artificial intelligence infrastructure, an area that has attracted increasing attention from Bitcoin miners looking to diversify revenue sources.
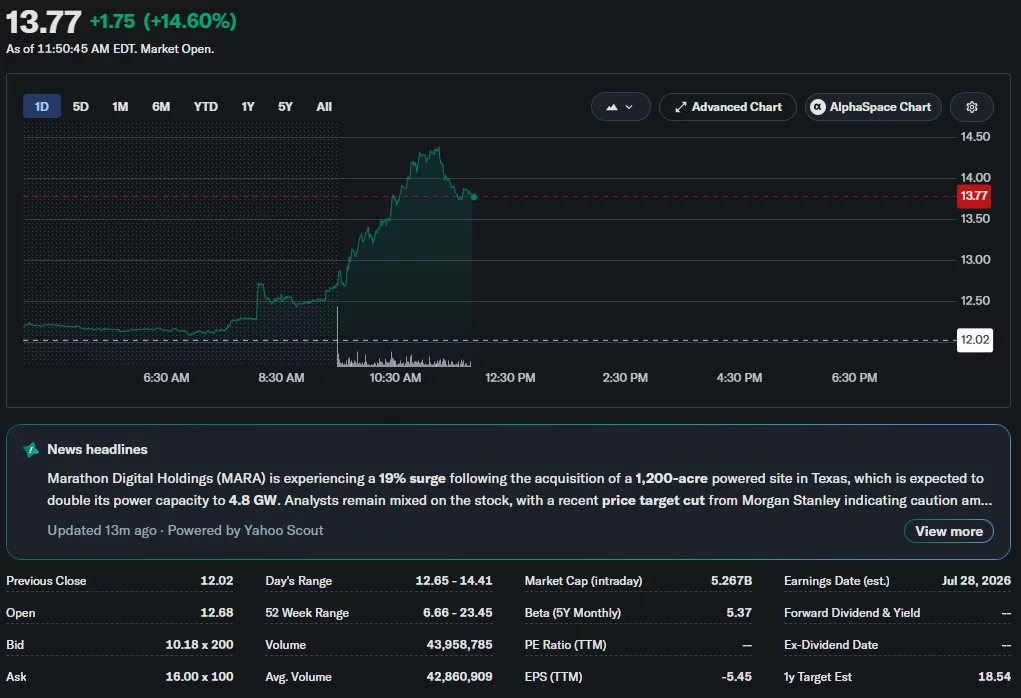
Yahoo Finance data showed MARA shares climbing to $13.77 following the announcement, leaving the stock up more than 14.6% on the day and over 53% year to date despite continued weakness across much of the crypto mining sector.
Texas site adds capacity for AI and Bitcoin mining
Beyond expanding its mining operations, MARA said it plans to develop the property with Starwood Digital Ventures into a large-scale digital infrastructure campus capable of supporting high-performance computing workloads, flexible compute services and Bitcoin mining. The company added that the site has already generated interest from potential high-performance computing tenants.
Once an HPC lease is executed, MARA said HIF will retain a minority ownership stake in the project. Construction is expected to begin in phases later this year, subject to regulatory approvals.
Earlier this year, MARA strengthened its digital infrastructure portfolio by acquiring Long Ridge Energy & Power in a $1.5 billion transaction, adding another large energy asset to support its computing strategy. The Texas purchase builds on that expansion as the company continues investing in facilities that can serve both blockchain and AI workloads.
Bitcoin miners continue expanding AI infrastructure
MARA joins a growing list of publicly traded Bitcoin miners investing in AI-focused infrastructure instead of relying solely on cryptocurrency mining. As crypto.news reported earlier, IREN Limited recently completed its acquisition of Spain-based Ingenostrum, also known as Nostrum Group, adding roughly 490 megawatts of secured grid-connected power and establishing its first operating base in Europe for AI cloud services.
Meanwhile, crypto.news previously reported that TeraWulf signed a 20-year data center lease with AI company Anthropic. According to TeraWulf, the agreement could generate nearly $19 billion in revenue over its lifetime, highlighting the growing commercial demand for high-performance computing capacity.
The trend extends beyond infrastructure operators into corporate Bitcoin treasury strategies. Earlier this week, crypto.news reported that American Bitcoin Corp. increased its Bitcoin holdings to more than 8,000 BTC.
BitcoinTreasuries data ranked the company among the largest publicly traded corporate Bitcoin holders in the United States, ahead of GD Culture Group and Galaxy Digital, illustrating how companies across the sector are pursuing different approaches to strengthen their positions as institutional interest in digital assets and AI computing continues to grow.

Goldman Sachs has told employees to confine their prediction market activity to sports and entertainment. The bank hopes to limit compliance risks tied to betting on elections, interest rates, and other market-moving events.
The bank issued the policy through an internal memo. It warned that repeated violations could lead to termination, a person familiar with the matter told the Financial Times.
Kalshi and Polymarket Face Insider Trading Scrutiny
Both platforms have drawn scrutiny over users profiting from advance knowledge of major events. Lookonchain flagged three wallets that netted more than $630,000 betting on Nicolás Maduro’s removal hours before his capture. Nobel Peace Prize organizers separately investigated a possible leak after a run of successful wagers on the eventual winner.
Kalshi and Polymarket have since rolled out new rules targeting insider trading and market manipulation. The scrutiny comes as Kalshi pursues a $40 billion valuation in a new funding round, underscoring how fast institutional capital is flowing into the sector.
Why Wall Street Banks Are Wary of Prediction Bets
Banks like Goldman sit close to material non-public information that can move markets. That proximity forces strict limits on what trades employees can make, and prediction platforms complicate those controls.
Kalshi and Polymarket let users wager on outcomes ranging from elections to where the S&P 500 will land at a given moment, blurring the line between entertainment and market-sensitive speculation.
Both platforms still earn most of their revenue from sports betting. Kalshi, meanwhile, is pushing into financial services with a new block-trading operation, a sign prediction markets want a permanent seat at Wall Street’s table.
The post Goldman Sachs Limits, but Doesn’t Stop, Employees Using Kalshi and Polymarket appeared first on BeInCrypto.


The Bank of Korea has reaffirmed that won-denominated stablecoins should initially be issued through bank-led consortiums, reinforcing its position as South Korea’s digital asset legislation remains stalled.
Summary
- Bank of Korea has reaffirmed support for bank-led issuance of won-backed stablecoins.
- The central bank plans to expand deposit-token pilots for public payments and services.
- Disagreements over stablecoin rules continue to delay South Korea’s Digital Asset Basic Act.
According to local reports from Digital Asset and EDaily, the Bank of Korea (BOK) restated its position in documents submitted on Thursday to the National Assembly’s finance committee.
The central bank argued that bank-led consortiums should receive priority when issuing won-backed stablecoins and also proposed creating a statutory policy body that would bring together financial regulators and other relevant government agencies to oversee the sector.
The latest submission continues a policy position the BOK has maintained for months as lawmakers work on South Korea’s Digital Asset Basic Act. The central bank has consistently argued that banks should retain a leading role in stablecoin issuance, saying existing banking oversight provides a stronger foundation for financial stability and consumer protection.
Deposit-token development remains on the agenda
Alongside its stablecoin recommendations, the BOK said it will continue expanding practical uses for deposit tokens during the second half of the year. According to the materials submitted to lawmakers, planned applications include government subsidy payments, public vouchers, electric vehicle charging infrastructure, and additional real-world payment services available to the general public. Deposit tokens are blockchain-based digital representations of commercial bank deposits.
The latest update follows earlier policy steps taken this year. In April, BOK Governor Hyun-Song Shin used his first public address to express support for both deposit tokens and central bank digital currencies (CBDCs).
During the same month, South Korea’s Ministry of Economy and Finance announced a pilot program that would use tokenized bank deposits for government operational spending, signaling continued institutional support for tokenized payment infrastructure.
Legislative disagreements continue to delay reforms
Even as development of deposit-token projects moves ahead, disagreement over stablecoin issuance remains one of the biggest obstacles facing South Korea’s digital asset legislation.
The BOK’s preference for bank-controlled issuers has divided policymakers, financial institutions, and parts of the digital asset industry. According to local reports, lawmakers have yet to reach agreement on whether stablecoins should be issued only through bank-led entities or whether non-bank companies should also be allowed to participate under the new framework.
The dispute extends beyond stablecoins. Members of the National Assembly are also considering how tokenized real-world assets (RWAs) and other digital assets should fit within South Korea’s existing financial regulations.
In April, the ruling Democratic Party proposed regulating both stablecoins and RWAs under current financial laws, but key questions surrounding issuer eligibility remained unresolved.
As legislative discussions continue, the government’s original timetable has slipped considerably. Earlier this year, the government told President Lee Jae-myung that it was targeting the first quarter of 2026 for the Digital Asset Basic Act.
According to local reports, that schedule has since been delayed by disruptions linked to the U.S.-Israeli war with Iran that began in late February, local elections, and the time required to reorganize committee structures within the National Assembly.
With the latest submission to lawmakers, the Bank of Korea has again made clear that it sees bank-led issuance and coordinated regulatory oversight as essential safeguards before won-backed stablecoins can enter wider circulation, while the broader legislative debate remains unresolved.


The Ethereum Foundation has revealed that the biggest challenge in AI-assisted security research has become proving which reported vulnerabilities are genuine rather than finding potential bugs.
Summary
- Ethereum Foundation says verifying AI bug reports is harder than generating them.
- AI agents found a real libp2p vulnerability, later disclosed as CVE-2026-34219.
- The Foundation says human validation and reproducible proof remain essential for protocol security.
According to the Ethereum Foundation’s Protocol Security team, recent experiments with coordinated AI agents uncovered real software flaws across systems that Ethereum depends on, but the organization said the majority of the effort now goes into separating valid findings from convincing false positives.
The team described the results in a technical post explaining how it has been testing AI agents against systems software, cryptographic libraries, and high-assurance smart contracts.
One confirmed discovery involved a remotely triggerable panic in the gossipsub component of libp2p, which forms part of the peer-to-peer networking layer used by Ethereum consensus clients. The Ethereum Foundation said the vulnerability was fixed and later disclosed as CVE-2026-34219.
Instead of treating AI agents as decision-makers, the Foundation said they should be viewed as tools that generate hypotheses requiring independent verification. While agents can inspect source code, trace execution paths, and prepare proof-of-concept material, the Foundation said they also produce reports based on unreachable code, duplicate known issues, debug-only crashes, or weak formal proofs that fail to demonstrate a real security problem.
The team said the unexpected finding was not that AI could identify bugs, but that validating those reports consumed far more time than generating them.
Multi-agent workflow filters unreliable reports
To reduce unreliable findings, the Ethereum Foundation said it deploys multiple AI agents against the same software repository, with each agent handling a different stage of the review process. Instead of relying on a central coordinator, the agents exchange information through the repository itself by sharing state in version control.
According to the Foundation, the workflow begins with reconnaissance, where broad attack surfaces are narrowed into specific testable ideas. Hunting agents then follow each hypothesis through the code and attempt to build a working reproducer. Gap-filling agents track accepted and rejected reports to avoid repeating earlier work, while validation agents independently examine every candidate, remove duplicates, and determine whether a report qualifies as a legitimate vulnerability.
The Foundation said every accepted report must identify a reachable target, define a clear security invariant, explain the failure mechanism, provide observable evidence, include a self-contained reproducer, and carry a deduplication key. These requirements are intended to ensure that every claim can be tested directly against production code.
Human validation remains the deciding factor
At the center of the process, the Ethereum Foundation said one principle overrides everything else: a vulnerability does not count unless someone other than the reporting agent can reproduce it against the real codebase. According to the Foundation, this requirement removes reports built around impossible attack paths, debug-only failures, or formal verification results that appear mathematically correct without proving a meaningful security property.
Beyond technical validation, the Foundation said surviving candidates are also evaluated for practical exploitability. A flaw that any network participant can trigger carries different security implications than one requiring privileged access or unrealistic computing resources.
The Foundation added that AI agents remain inconsistent when judging exploit reachability, attack severity, or vulnerabilities that emerge only through long sequences of valid interactions. In those situations, it said the agents perform better as assistants for stateful testing frameworks than as replacements for experienced security researchers.
The latest security update comes only weeks after the Ethereum Foundation completed a major internal restructuring. In a June 23 announcement, the organization said it had reduced its workforce by about 20%, with 54 employees leaving following a months-long review under its Mandate and Treasury Management Policy.
According to the Foundation, the restructuring was intended to focus staff and resources on responsibilities that only the organization can perform while continuing long-term Ethereum development.

Solana’s recovery appears to have lost momentum after it shed over 6% in the past week. As it currently trades near $77, it is facing its most negative market sentiment of 2026.
In fact, SOL’s trading volume has dropped to its lowest point in 2026, while negative commentary surrounding the asset has surged to its highest daily level this year, according to Santiment.
Rebound Setup Emerges
Much of the disappointment stems from expectations that strong narratives around tokenized stocks and real-world asset (RWA) activity would translate into stronger price performance, something traders have yet to see.
Santiment noted that this combination of elevated fear, uncertainty, and doubt (FUD) alongside weak trading volume has historically created conditions that can favor a rebound. With retail participation low and sentiment deeply negative, there may be less resistance if large stakeholders decide to drive Solana’s prices higher, which could potentially set the stage for a sharp move that catches traders off guard.
The Solana network added 1.60 million new addresses over the past two weeks. Additionally, the SuperTrend indicator on SOL’s three-day chart also flashed a new buy signal for the first time since October 10, 2025, when the Average True Range (ATR) trailing stop moved below the price. According to analyst Ali Martinez, the previous SuperTrend sell signal was followed by a 74% price correction. He said the latest signal points to a bullish trend and could send SOL toward $100.
Michaël van de Poppe also observed that the crypto asset has re-entered its trading range and may briefly pull back before continuing its upward move. He added that holding the $75-$77 range as support could open the door to gains toward $100 and potentially $120 in the coming weeks or months.
$78 Holds the Key
Another crypto analyst, Dami-Defi, also pointed to a potential breakout as SOL currently tests the upper boundary of a descending channel that has been in place since September 2025. According to the analyst, a three-day close above $78 would confirm the breakout and open the door to an initial move toward $105, followed by $125 and $155 if momentum continues.
However, the setup would be invalidated by a three-day close below $72, and stronger trading volume would be needed to confirm the breakout.
The post Solana (SOL) FUD Hits 2026 High: Why It Could Be a Bullish Twist appeared first on CryptoPotato.
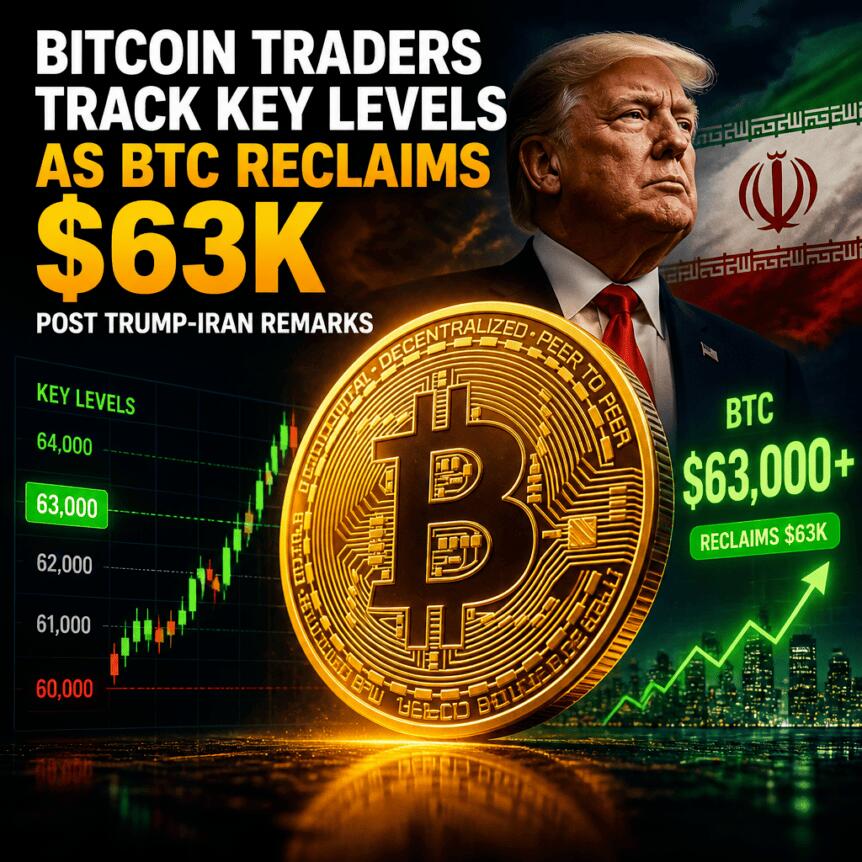
Bitcoin rebounded after the Wall Street open as US stocks turned higher on fresh optimism around Iran. The shift in risk sentiment helped BTC/USD reclaim the $63,000 area, while traders reported short liquidations nearing $100 million over the past 24 hours, according to CoinGlass data.
The market’s relief rally followed remarks from US President Donald Trump suggesting there may still be room for a new Iran “deal” after the ceasefire situation deteriorated. With crypto effectively tracking broader risk assets, traders are now focusing on whether BTC can hold key intraday levels into the daily close.
Key takeaways
- BTC/USD rose back above $63,000, gaining nearly 1.5% on the day, per TradingView.
- CoinGlass shows short liquidations approaching $100 million over 24 hours, reflecting heavy leverage unwinds.
- Several traders are watching whether BTC can secure a daily close above $64,700 to sustain the rebound.
- Market participants continue to disagree on whether a bear-market bottom is forming, with competing cycle interpretations.
Risk appetite returns as Iran “deal” hopes resurface
According to TradingView, BTC/USD moved higher after Thursday’s Wall Street open, climbing back above $63,000. The move came as US equities rebounded across the board, helping to partially offset the downside seen earlier in the week.
That timing aligned with comments from Trump, who indicated that Iran “wants to make a deal” after the ceasefire breakdown. As reported via posts quoting trading resource The Kobeissi Letter and others, Trump said that calls had been made and that the sides “want to make a deal so badly.” Earlier coverage from Cointelegraph also linked the broader market mood to developments around the Iran ceasefire and regional tensions.
In crypto, the improved sentiment appears to have been immediate: CoinGlass data cited by the market coverage showed short liquidations running close to $100 million in the last 24 hours. For traders, that kind of flush can reduce immediate downside pressure while also encouraging fresh momentum trades—though it doesn’t automatically confirm a sustained trend reversal.
Liquidations highlight leverage stress—and quick sentiment reversals
Short liquidations are often a sign that price moves are accelerating due to leveraged positioning. CoinGlass data referenced in the reporting showed liquidity targets being hit fast enough to push near-$100 million in liquidations over a day, consistent with the broader “risk-on” bounce in stocks.
While such spikes can fuel further upside in the short term, they also tend to make markets more reactive to headlines. That matters now because the drivers cited here—geopolitical developments and policy signals—can change quickly, and crypto has been trading as a high-beta asset relative to traditional markets.
Traders taking part in the price discussion suggested the rebound does not necessarily indicate an immediate trend shift. One market participant, writing on X under the handle Killa, said the setup was “not bearish at all,” adding that he expects “a few more months of choppy PA.” In that view, BTC could still fluctuate within a broader band rather than transition cleanly into a new directional phase.
Traders narrow focus to BTC’s key daily close
As price action stabilized after the bounce, attention turned toward specific technical levels. Trader Killa highlighted $68,000 as a potential area for a short entry, consistent with the idea that rallies may encounter selling pressure before any larger breakout.
Another participant, Jelle (CryptoJelleNL), also emphasized that bulls may still be trying to reclaim key ground. In an X update, Jelle suggested that if BTC can move back above a level of importance, the market could push again toward the $65,000–$70,000 area. But if BTC rejects and loses support, Jelle indicated that the market could revisit levels below $60,000.
The most concrete “decision point” referenced in the reporting came from Daan Crypto Trades, who argued that a daily close above $64,700 would “flip the story” toward a larger relief rally. Daan’s X analysis placed BTC in a $61.3K–$64.7K range and described the latest move as a climb back after a prior risk-off flush. In that same framework, a daily close under $61.3K would open the door to retesting lows and potentially invalidate the rebound momentum.
Bear-market bottom debate continues despite the rebound
Even with the bounce above $63,000, participants are not aligned on what the move means for the larger cycle. The coverage pointed to ongoing divergence in views about whether the bear-market bottom is already in.
Earlier reporting referenced in the article highlighted two contrasting interpretations: one analysis described a “textbook” bottom formation as underway, while another cycle comparison argued for a deeper macro floor. In practice, this split matters because it changes how traders interpret near-term rallies—whether they’re seen as early confirmation of a bottom, or as relief moves inside a still-volatile consolidation.
That is why the market’s next few sessions may be less about whether BTC can rise, and more about whether it can hold above critical thresholds on a closing basis. Given the leverage effects seen in liquidations and the headline sensitivity tied to geopolitics, follow-through will likely be closely watched.
Heading into the next daily close, traders will likely treat levels such as $64,700 as a litmus test for whether this rebound is merely another range extension or the start of a broader relief phase—especially as opinions on a longer-term bottom continue to differ.

Bitcoin miner MARA Holdings shares rose about 15% in early trading Thursday after the company announced plans to acquire a Texas powered-land site with access to up to 2 gigawatts of electricity for AI computing and Bitcoin mining.
The 1,200-acre site in Matagorda county, about 90 miles southwest of Houston, is expected to provide access to an initial 1 GW of grid capacity by October 2027 and up to 2 GW by April 2028. MARA said it plans to develop the site as a digital infrastructure campus supporting both high-performance computing and Bitcoin mining.
Upon full energization, the site is expected to more than double the Bitcoin (BTC) miner’s potential power capacity to about 4.8 GW. HIF USA will retain a minority ownership stake in the project if MARA signs a lease with a high-performance computing tenant, according to the companies. The companies did not disclose financial terms of the transaction.
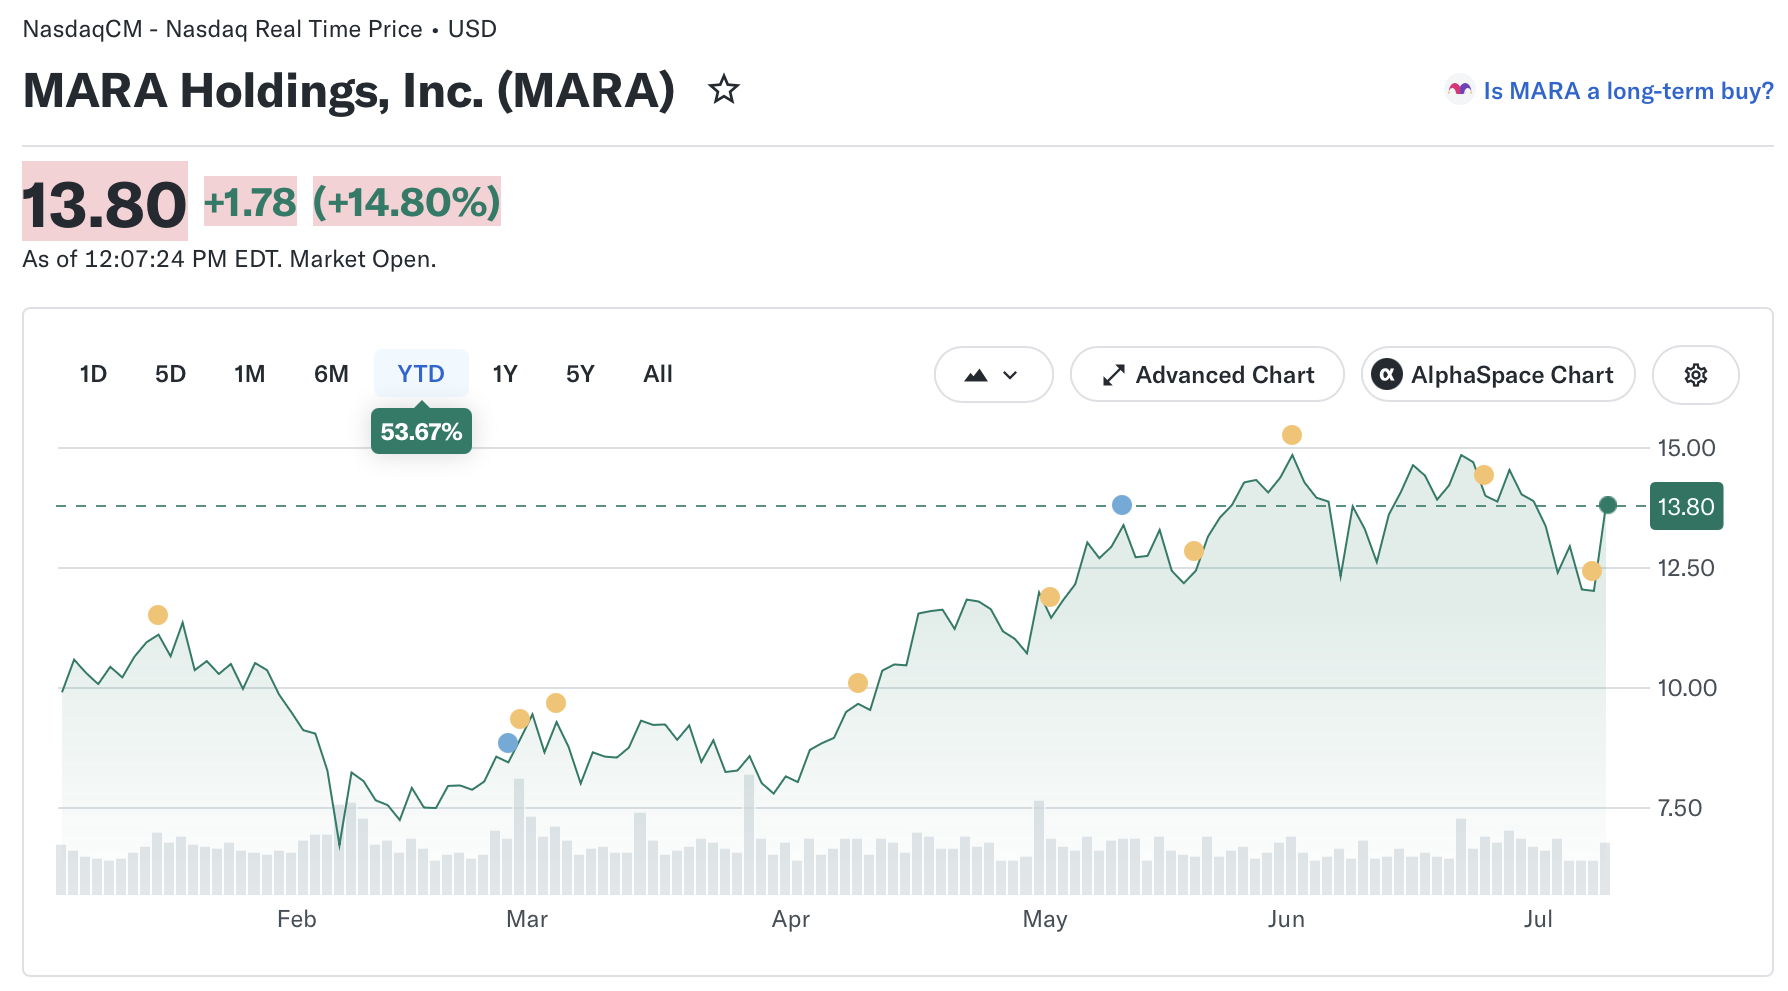
Source: Yahoo Finance
In a post on X, MARA said the project remains in the early stages of development and is subject to regulatory approvals, adding that construction will be phased over several years.
In April, MARA announced it would acquire Long Ridge Energy & Power, adding a 505-megawatt gas-fired power plant and a co-located data center in Ohio, in a roughly $1.5 billion transaction. Earlier this year, the company acquired a 64% stake in French computing infrastructure operator Exaion.
MARA is the fourth-largest publicly traded corporate holder of Bitcoin (BTC), with 36,303 BTC, according to data from BitcoinTreasuries.NET.
Related: Crypto Biz: Is AI the exit strategy for miners?
BTC miners bet big on AI data centers
Bitcoin miners have increasingly expanded into AI and high-performance computing as demand for data center capacity has grown. Rather than repurposing mining hardware, companies are leveraging existing power infrastructure built to support BTC mining, including grid connections, substations and energized sites.
However, converting mining sites into AI-ready data centers requires significant investment. CoinShares estimates mining infrastructure typically costs $700,000 to $1 million/MW, compared with $8 million to $15 million/MW for liquid-cooled AI infrastructure, while hyperscale customers require higher power density and uptime than many mining facilities were designed to provide.
Even so, several publicly traded miners have announced multibillion-dollar AI infrastructure agreements in recent months. Core Scientific expanded its hosting agreement with CoreWeave to more than $10 billion, while Hut 8 signed a 15-year, $7 billion data center lease with Fluidstack. TeraWulf has reported billions of dollars in contracted HPC revenue.
Investors have broadly rewarded the strategy. Hut 8 shares jumped about 20% after announcing its Fluidstack agreement, while companies with AI and HPC contracts have traded at higher valuation multiples than miners focused solely on Bitcoin production, according to a report from CoinShares.
Last week, TeraWulf shares rose about 12% after the Bitcoin miner announced a 20-year AI data center lease with Anthropic, expected to generate roughly $19 billion in contract revenue.
MARA is the sixth-largest holding in the sector exchange-traded fund CoinShares Bitcoin Mining ETF, as 4.76% of assets, according to Yahoo Finance data. WGMI shares were up more than 5% in early afternoon trading on Thursday.
Magazine: Bitcoin’s quantum dilemma: Bigger blocks or STARK proofs?
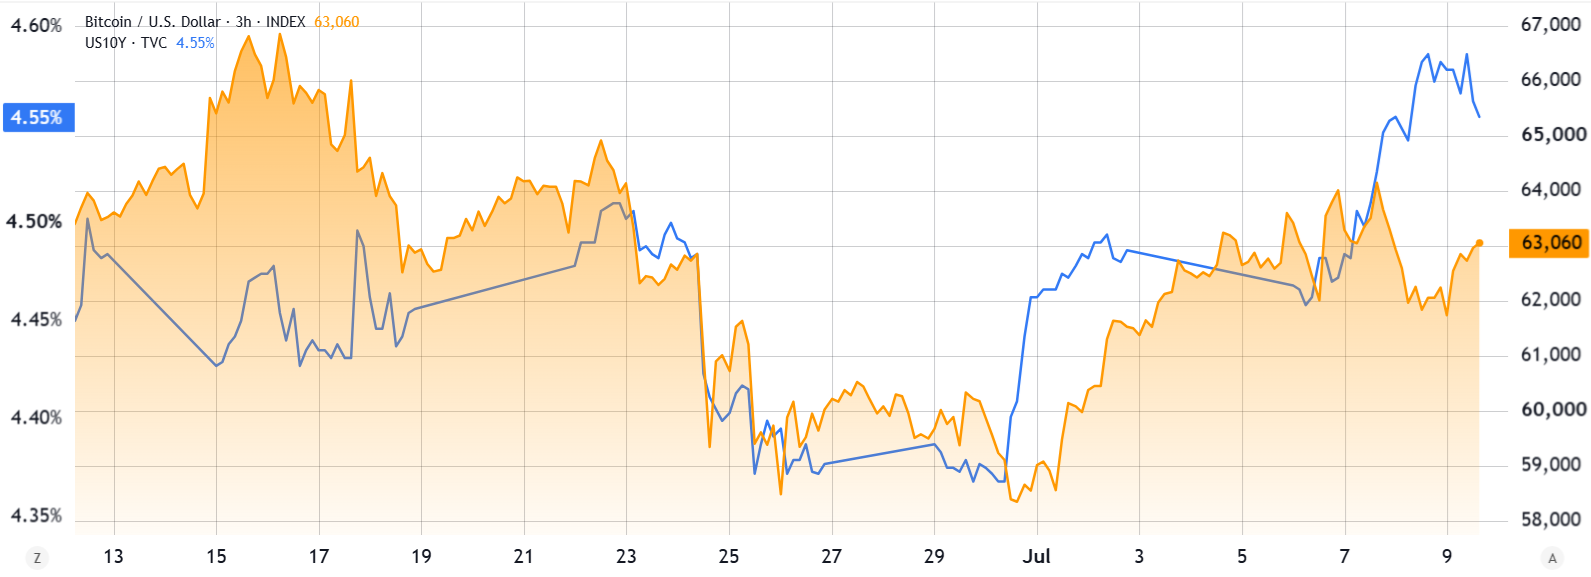
Bitcoin (BTC) reclaimed the $63,000 mark on Thursday, but traders fear a correction ahead of Friday’s $1.4 billion options expiry on Deribit. The concerns stem from the US government bond yield climbing toward a level that many view as a warning sign. Is the $62,000 support level at risk?
Key takeaways:
- Rising US Treasury yields signal debt concerns, negatively pressuring risk assets.
- Balanced Bitcoin options put-to-call volumes suggest limited downside from the $62,000 level.
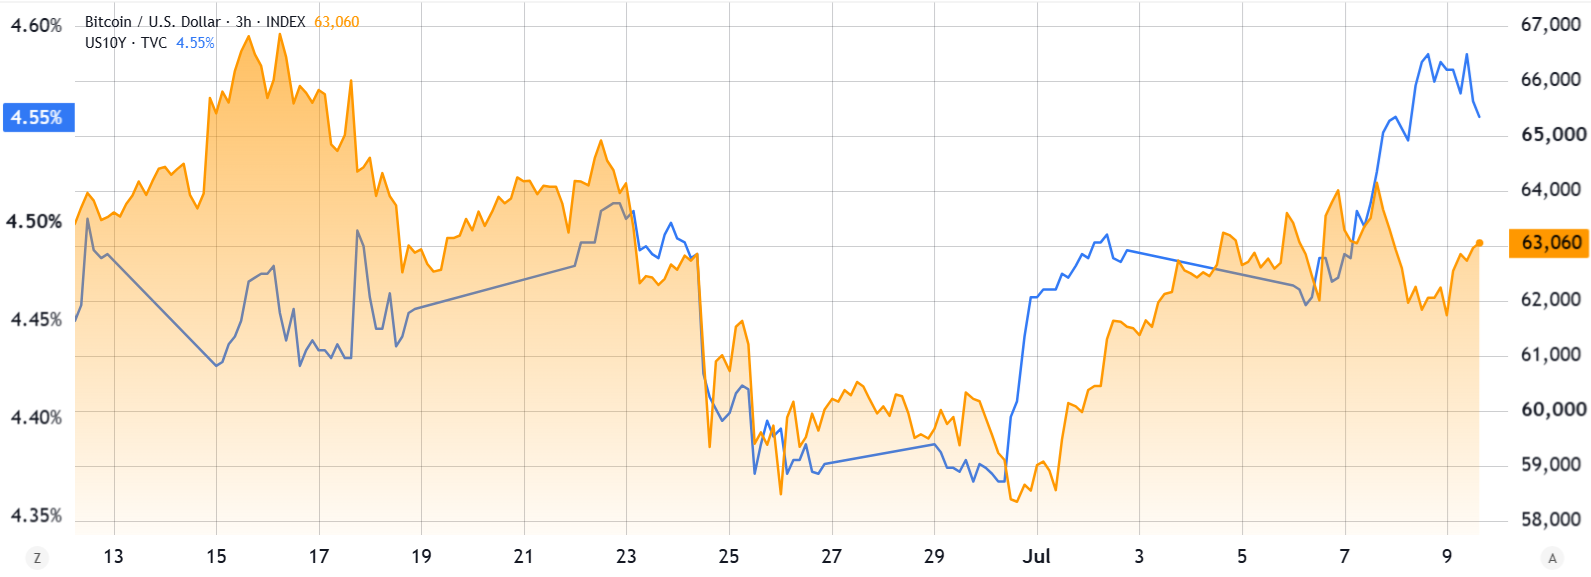
US 10-year Treasury yield (left) vs. Bitcoin/USD (right). Source: TradingView
Bitcoin ETF outflows are not a concern ahead of the Bitcoin options expiry
The 10-year Treasury yield’s approach to 4.6% signals investor anxiety over the expansion of US government debt and prospects for further monetary policy expansion to avert an economic recession. Bitcoin has felt the impact, trading sideways while the Nasdaq-100 Index sits merely 4% below its all-time high.
The AI sector’s bullish momentum keeps pulling capital toward equities. Asian chipmaker SK Hynix oversubscribed IPO in the US helped push the sector higher on Thursday, led by Arm Holdings (ARM) 10% gains, Advanced Micro Devices (AMD) 7% rally and Micron’s 7% intraday gains.
Wednesday brought $85 million in net outflows from spot Bitcoin ETFs, ending a short three-day inflow run. Still, the figure does not confirm a reversal in institutional flows. More importantly, demand for Bitcoin options has stayed balanced between calls (buy) and puts (sell).
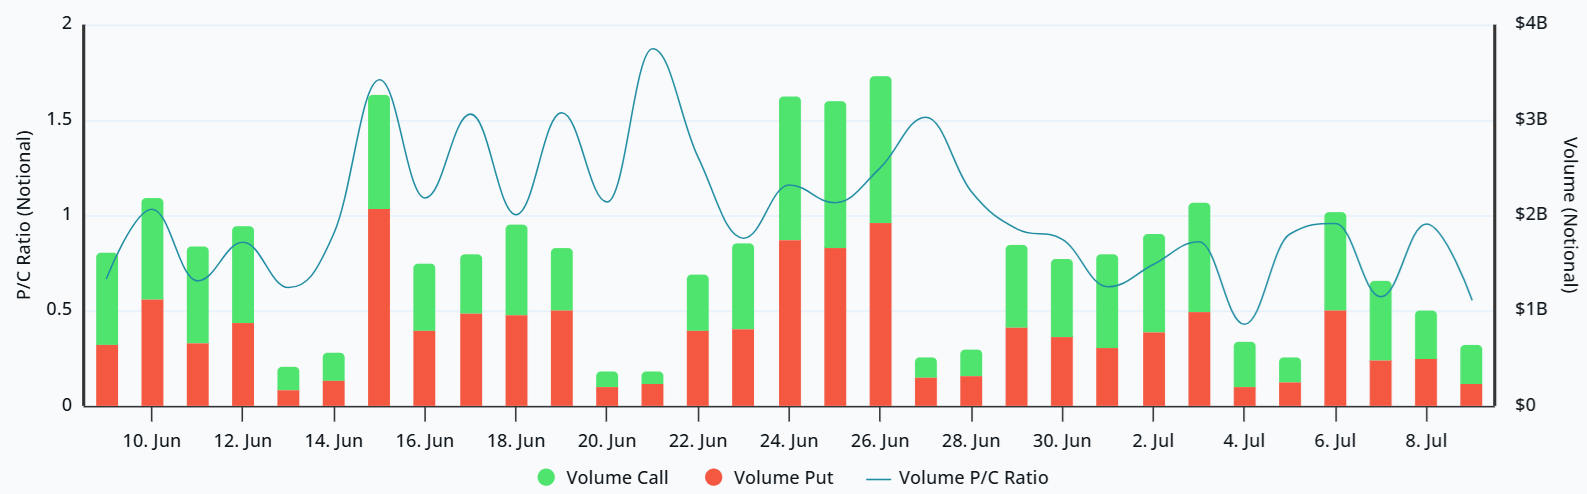
Bitcoin options put-to-call volumes ratio at Deribit. Source: Laevitas
Call options volume has outpaced put instruments over the past four days, reflecting reduced demand for downside movements. However, the upcoming weekly options expiry features an interesting setup as calls up to $62,500 total $137 million, while puts above $61,000 are at $121 million.
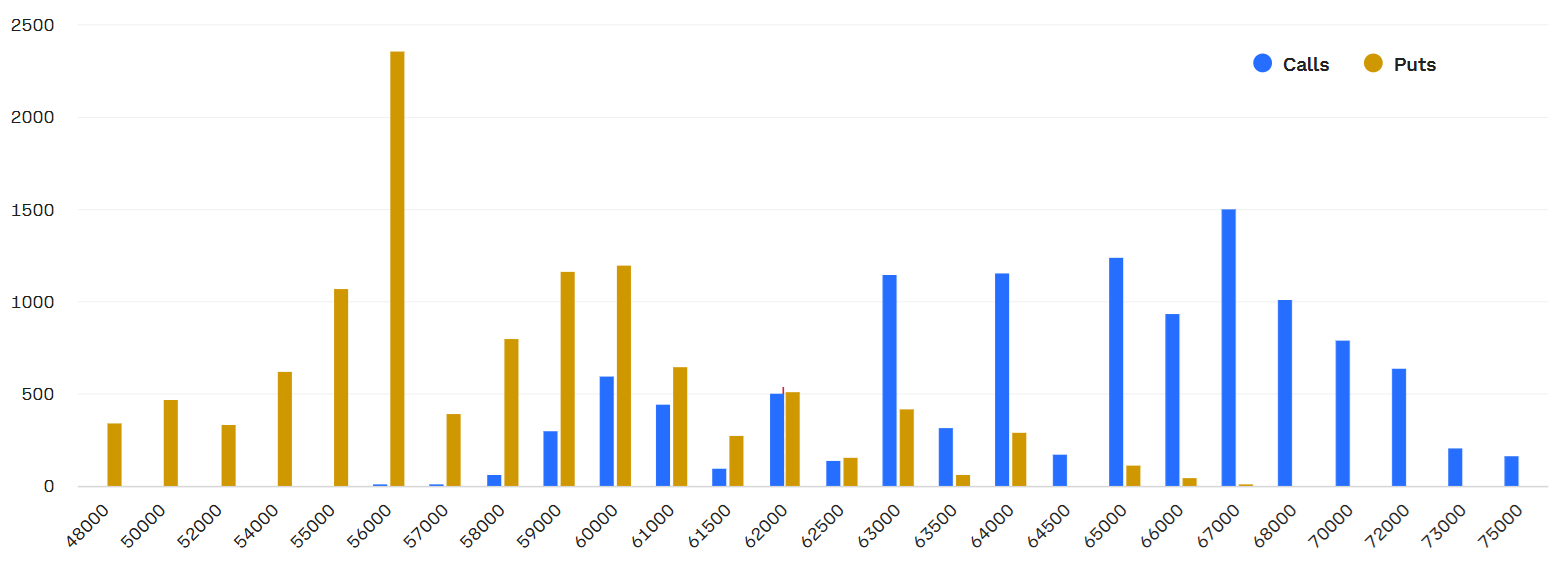
Deribit BTC options open interest for July 10, BTC. Source: Deribit
Bitcoin bulls would gain significant ground with a move above $63,500 by the 8:00 AM UTC expiry on Friday, boosting their advantage to $190 million. Bears hold a smaller $100 million edge below $61,000, limiting their incentive without additional catalysts.
Oil price decline could strengthen the demand for risk-on assets
A temporary truce in the Middle East could ease recession fears and shift money from fixed income into risk markets, likely pushing Bitcoin price higher. In contrast, continued strength in the AI sector drains capital from other investments while traders fear large Treasury issuance to cover growing debt.
Related: Bitcoin peels back to $62K as Fed-wary futures traders cut risk: Is the BTC rally over?
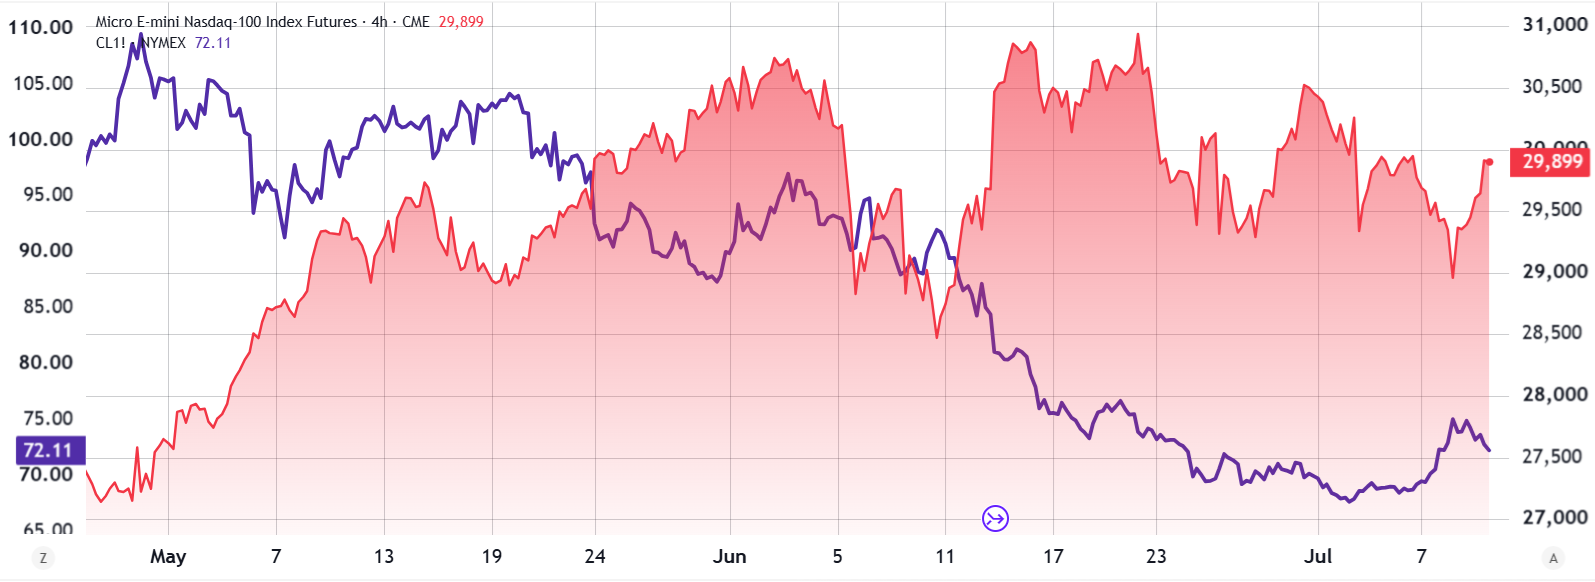
Crude WTI oil futures (left) vs. Nasdaq 100 Index futures (right). Source: TradingView
Traders should closely monitor whether Treasury yields will subside over the next week and if an aggravated war in Iran pushes oil prices higher. But with Bitcoin put options buying remaining restrained in recent sessions, the market appears positioned to strengthen the $62,000 support level.
Bitcoin sits in a delicate spot where a successful expiry resolution above $63,500 could provide short-term relief, but sustained upward momentum would require a boost from the macro side. As long as these dynamics persist, the odds favor limited bullish momentum for Bitcoin in the near term.

Saltburn named ‘coastal gem’ by Sunday Times and Airbnb

Why Local HR Consultancy Makes a Difference for London Businesses

What Is Meta’s AI Muse Spark and Can It Overthrow Claude and ChatGPT?


-

 Fashion6 days ago
Weekend Open Thread: High Hopes
-
 NewsBeat5 days ago
Taylor Swift and Travis Kelce wedding staffer hilariously struggles to keep her cool while checking in megastars
-

 Crypto World6 days ago
Standard Chartered Secures MiCA License as ESMA Adds 37 New Crypto Firms
-

 Fashion3 days ago
Open Thread: What Great Books Have You Read Recently?
-

 Politics7 days ago
The House | “Reframing the debate from a binary discussion of winners and losers”: Yuan Yang reviews ‘We Are Not Machines’
-

 Fashion15 hours ago
Loro Piana Fall 2026 Enters Houston’s Art Scene
-

 News Videos3 days ago
Whats Hidden Inside This Cash Register? #treasure #reselling #money
-
 Tech3 days ago
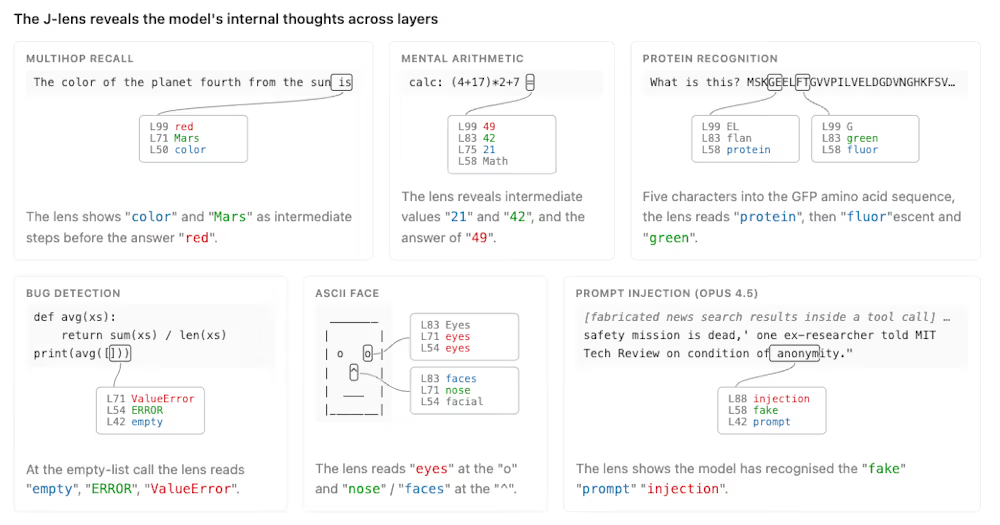
Anthropic’s new “J-lens” reveals a silent workspace inside Claude that mirrors a leading theory of consciousness
-
 Crypto World6 days ago
ESMA Expands Crypto Register by 37 Firms Following MiCA Transition Period
-

 Business3 days ago
AXT Shares Jump Nearly 14% as Semiconductor Materials Maker Rebounds on AI-Linked Indium Phosphide Demand
-

 Sports2 days ago
Joshua Pacio ‘more complete’ ahead of ONE rematch vs Malachiev
-
Crypto World3 days ago
SK hynix (000660.KS) Stock Dips as $28B Nasdaq ADR Offering Drives AI Memory Expansion
-

 Crypto World5 days ago
South Africa proposes crypto tax guidance under existing rules
-
 News Videos3 days ago
Best Time to Enter Small Caps Right Now? Another Bull Run? | Financially Free
-
 Tech5 days ago
Lenovo laptops are now shipping with YMTC SSDs, a sign of Chinese NAND entering the mainstream
-

 Business7 days ago
What a 10 Percent Drop Means for Buyers, Sellers and Renters
-
Sports2 days ago
We have punished the disrespect
-

 News Videos4 days ago
Avoid entering in FOMO #bitcoin #cryptocurrency #trading #scalping
-

 Crypto World7 days ago
Alibaba bans Claude Code over alleged backdoor security concerns
-

 Tech5 days ago
Neuralink Threads Its Way Straight Through the Brain’s Armor
You must be logged in to post a comment Login