

Crypto World
Traders Are Loading Up on XRP Longs, but One Metric Signals Caution


As traders are loading up on XRP long positions, one metric signals that it may be time to pay attention.
There’s encouraging data emerging for XRP traders from the order books of perpetual futures exchanges like Binance Futures, Bybit, and OKX, as well as their decentralized counterparts like Hyperliquid, Aster, and Lighter.
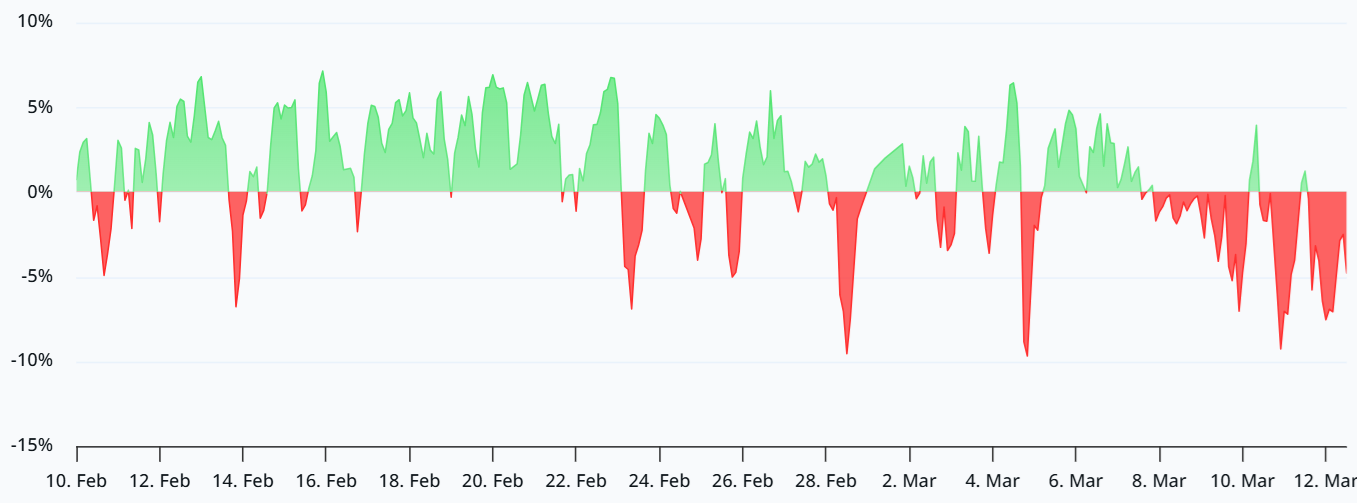
Referencing a graph from CoinAnk, popular data analyst CW8900 noted that the number of long positions in XRP has been increasing and has now exceeded the number of short positions.
$XRP‘s long positions have increased, exceeding the size of short positions.
Expectations for $XRP‘s rise are growing. pic.twitter.com/xMnIAEcQqs
— CW (@CW8900) March 12, 2026
But what does this mean for the XRP price? Well, usually, in a vacuum scenario, when there are more buyers than sellers, the price goes up. Of course, that’s incredibly simplified, and it would only hold if these orders are coming from market makers. Market takers could place buying orders at higher prices, but they wouldn’t be executed unless the price actually rises. In all fairness, though, an increasing number of long positions is almost always a good sign, especially if it persists.
This comes at a time when Ripple’s fundamentals are also looking good. For instance, in the last week alone, the company said it would pursue a strategic acquisition to obtain a financial license in Australia, was listed on Mastercard’s new crypto-focused platform, and announced a massive share buyback.
That said, there are some worrying signs as well. As CryptoPotato reported earlier this week, open interest has been dropping across several exchanges. This metric represents the total number of futures contracts that remain active in the market. When it declines, this usually means that traders are reducing exposure. So while the number of long positions went up, the broader open interest went down, meaning that an increase in price is far from certain.
Binance Free $600 (CryptoPotato Exclusive): Use this link to register a new account and receive $600 exclusive welcome offer on Binance (full details).
LIMITED OFFER for CryptoPotato readers at Bybit: Use this link to register and open a $500 FREE position on any coin!

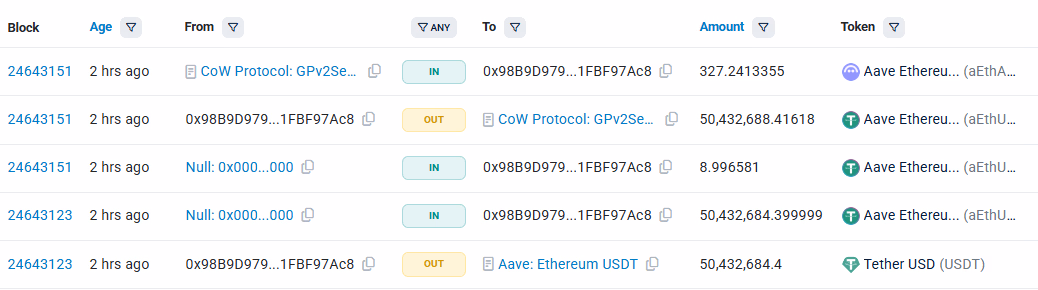
The massive transaction routed through CowSwap on Ethereum resulted in a 99.9% loss.
The decentralized finance (DeFi) community is buzzing after an unidentified wallet swapped $50.4 million in USDT for just $36,000 worth of AAVE tokens.
Etherscan data shows that the wallet received 50.4 million USDT from Binance 20 days ago. Roughly two hours ago, the user deposited the stablecoins on Aave, DeFi’s largest lending protocol and attempted to swap their position for AAVE tokens.

Transaction logs show that the user placed an order via CoW Protocol, which is integrated in the Aave interface, to swap roughly 50.43M aEthUSDT for aEthAAVE. A CoW solver picked up the order and executed it through this routing:
- aEthUSDT to USDT: The solver burned 50.43M aEthUSDT via Aave V3, withdrawing 50.43M USDT.
- USDT to WETH via Uniswap V3: 50.43M USDT went into the Uniswap V3 USDT/WETH pool and came out as 17,958 WETH. At $2,050/ETH, $50.4M should yield roughly 24,600 WETH. That’s roughly $13.6 million lost to slippage at the Uniswap step alone.
- WETH to AAVE via SushiSwap: Here’s where it gets catastrophic. The SushiSwap AAVE/WETH pool currently has only about $73,000 in total liquidity. The solver pushed 17,958 WETH through this tiny pool and got back only 331 AAVE, worth $36,400. That’s effectively 99.9% slippage.
- AAVE to aEthAAVE via Aave deposit: 331 AAVE was deposited back into Aave V3, minting 327 aEthAAVE, which was delivered to the trader.
Aave founder Stani Kulechov said the user confirmed the trade despite being warned of “extraordinary slippage” by the Aave interface.
“We sympathize with the user and will try to make contact with the user, and we will return $600K in fees collected from the transaction,” he added.

Holders of the $TRUMP token will have another opportunity to dine with the U.S. President after the company behind the token announced a “gala luncheon” with Donald Trump set for late next month.
The luncheon, scheduled for April 25, comes just under a year after token holders were invited to a previous dinner with Trump. That one was open to the top 220 holders of the token, while this new one will bring in 297, with 29 invited to a VIP tour of Mar-a-Lago, the event venue, the issuer of the token said Thursday.
“Join 18 global giants at one of the world’s most historic residences… the exclusive members-only club, Mar-a-Lago,” the announcement said. “You’ll enjoy a once-in-a-lifetime experience. This event will be a memory you will talk about forever!”
Mar-a-Lago hosted a crypto conference put on by World Liberty Financial, another company co-owned by Trump and his family, last month.
The TRUMP token spiked briefly when the announcement came out, though the price fell back almost immediately. The token is trading at around $2.98, up about 2% on the day’s trading. The token’s volume is up to its highest level since Feb. 20, 2026.
The token’s price is still down significantly from its all-time high of over $46, and even down from the roughly $13 average it traded at during the last dinner announcement in April 2025.
That earlier dinner prompted Democratic lawmakers to lodge protests and raise concerns about Trump profiting off of his own crypto token while simultaneously championing legislation to support the industry and appointing regulators to oversee crypto. These concerns have, in part, delayed legislation sought by the crypto industry.
“GetTrumpMemes.com is not political and has nothing to do with any political campaign or any political office or governmental agency,” the website’s footer said.
“There will be no private meetings with the President and no solicitations.”
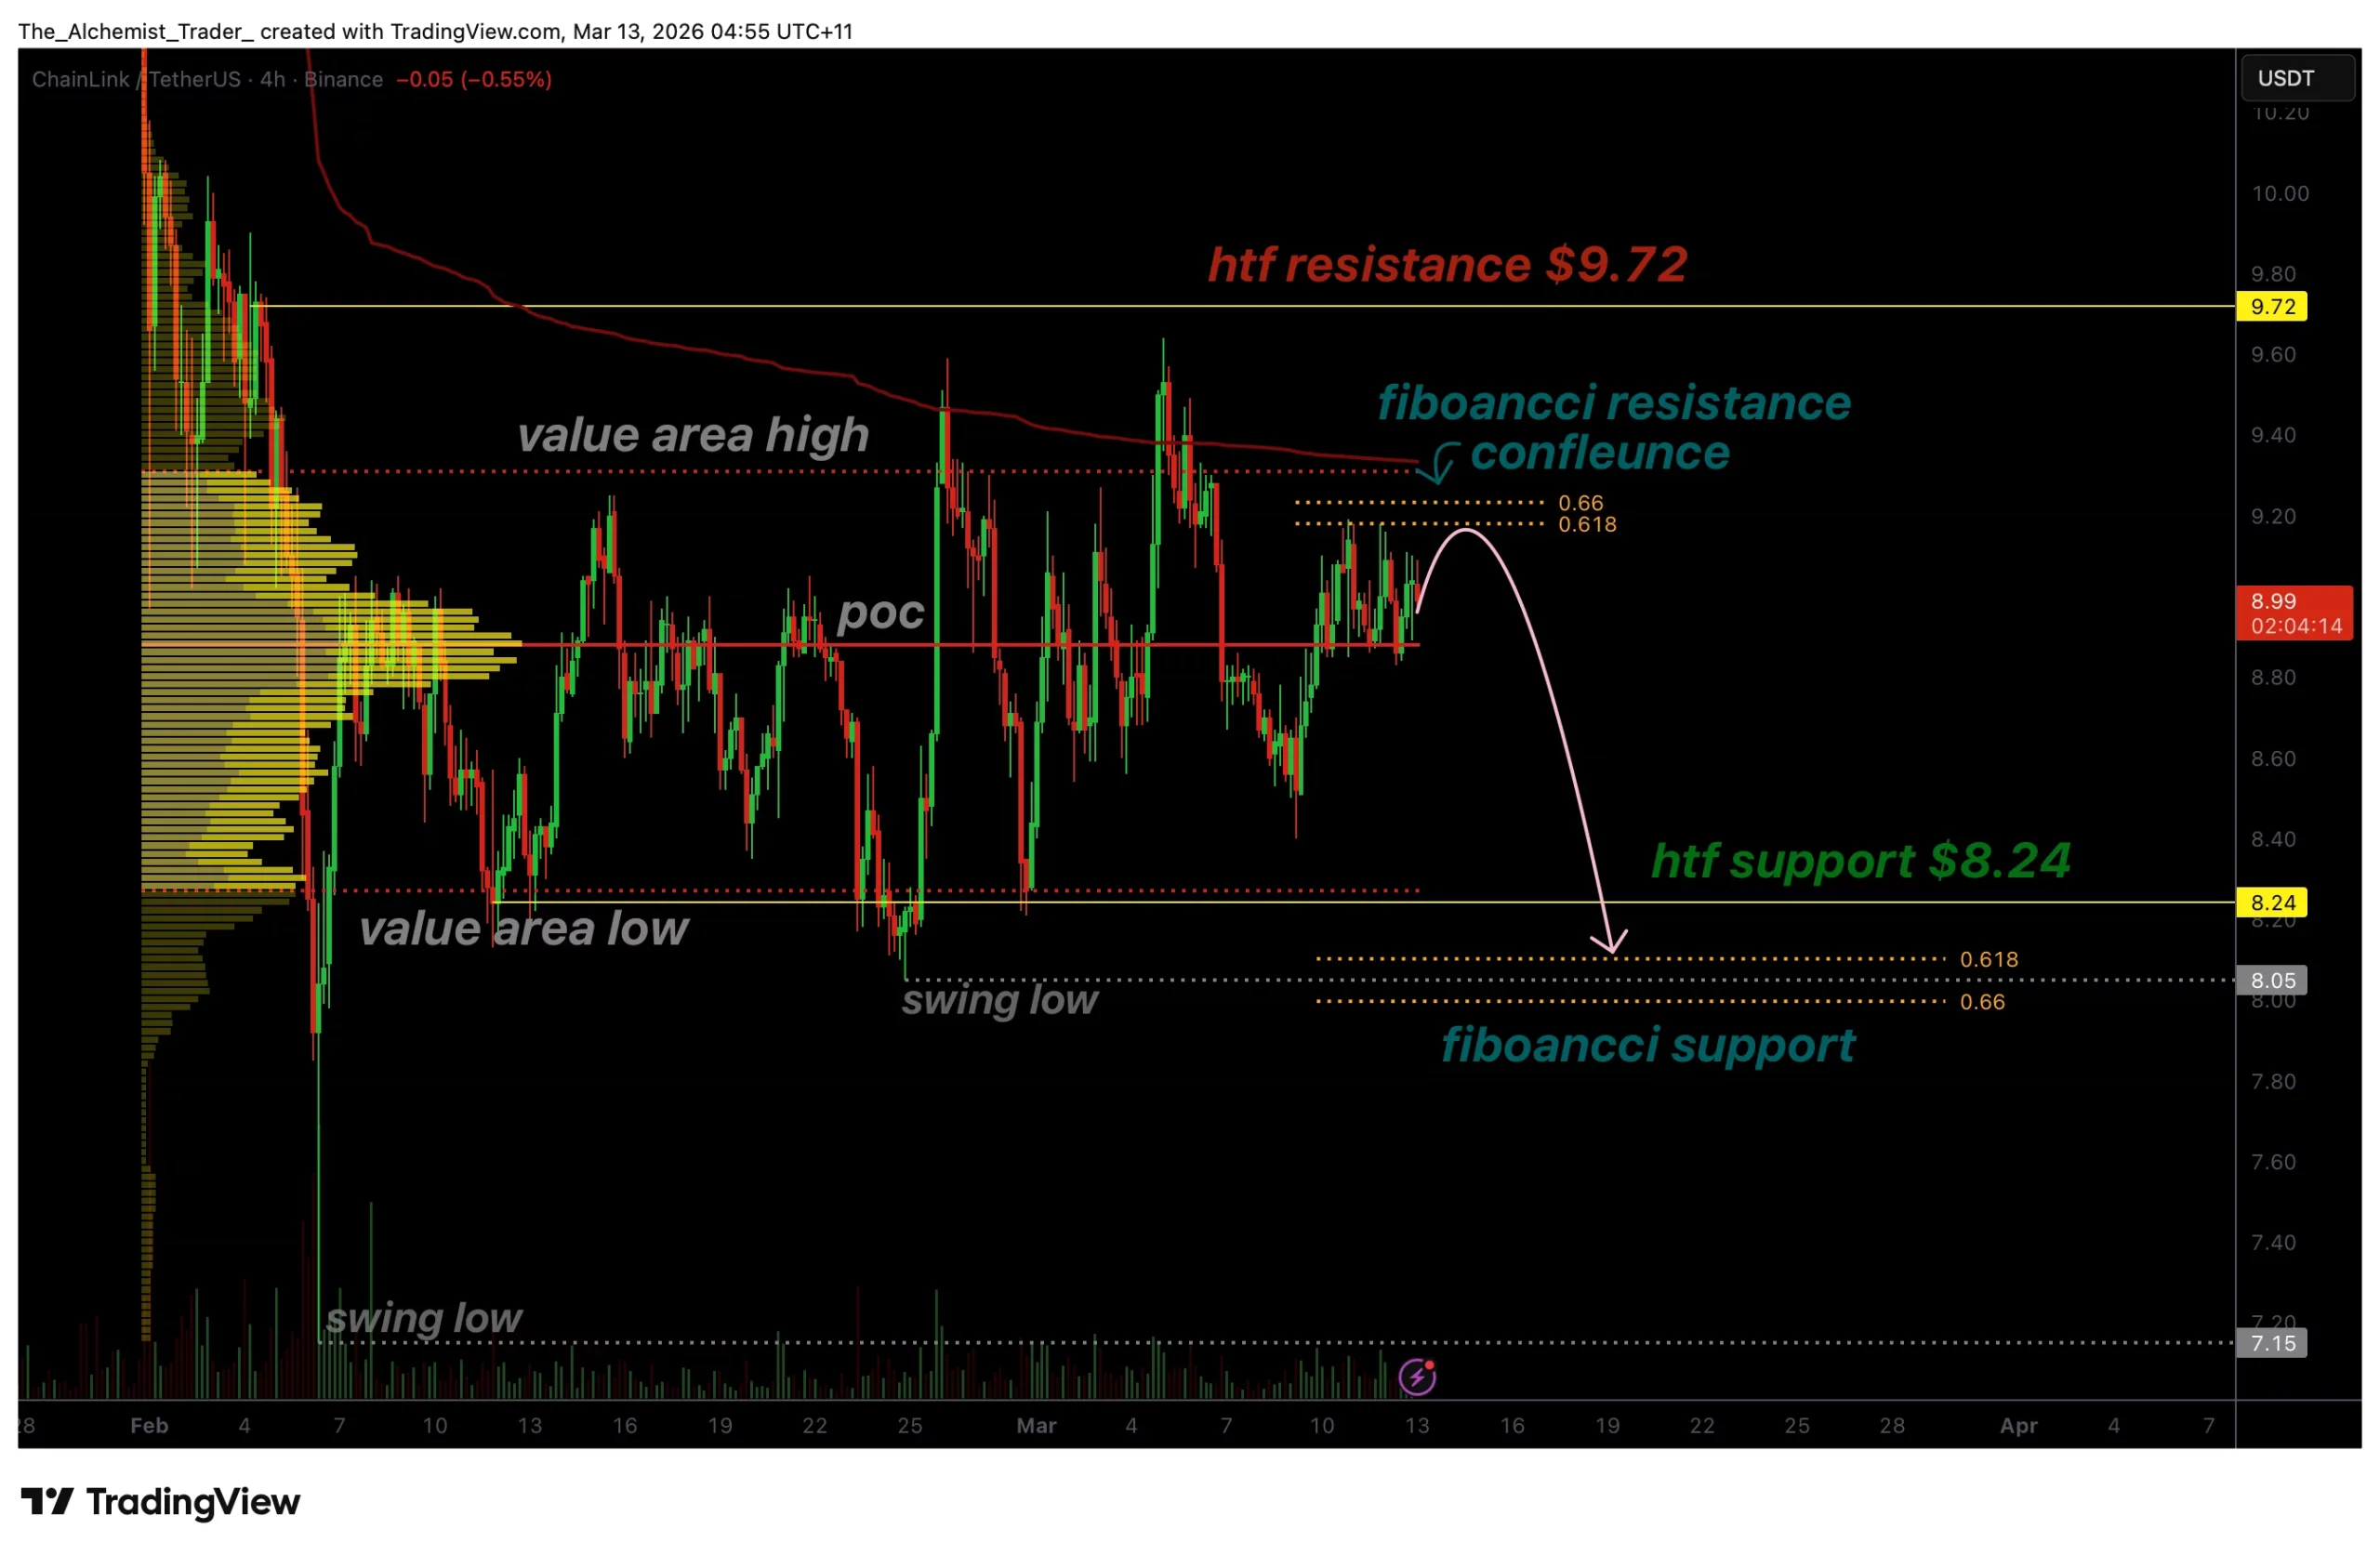
Chainlink price is stalling below a major Fibonacci resistance zone near $9.17 as momentum weakens.The probability of a corrective rotation toward lower support increases.
Summary
- Key Resistance: $9.17 aligns with the 0.618 Fibonacci, VWAP, and value area high.
- Weak Momentum: The recent rally occurred on low volume, increasing rejection risk.
- Support Target: Potential rotation toward the $8.24 confluence support zone.
Chainlink (LINK) has entered a technically significant zone as price action compresses beneath a cluster of resistance levels around $9.17. The asset recently attempted to extend its upward momentum but has begun to stall as it approaches a confluence of technical barriers.
With several resistance indicators aligning in the same region and trading volume declining during the recent move higher, the market may be preparing for a temporary pullback before any sustained continuation toward higher resistance.
Chainlink price key technical points
- Major Resistance Zone: $9.17 aligns with the 0.618 Fibonacci retracement, VWAP, and value area high.
- Low-Volume Rally: Weak participation increases the probability of a rejection.
- Downside Target: Potential rotation toward the $8.24 support level.

Chainlink’s current price action is approaching a technically important resistance cluster situated around $9.17. This level represents the 0.618 Fibonacci retracement of the recent swing structure, a zone that frequently acts as a decisive turning point in market trends. The presence of the value area high in this region adds additional significance, as it represents an area where a large portion of previous trading activity has occurred. When price revisits these zones, the market often reacts strongly as liquidity is redistributed.
Adding further weight to this resistance zone is the presence of the volume-weighted average price (VWAP), which overlays the same region. VWAP is widely monitored by both institutional and retail traders as a benchmark for fair value. When price trades beneath the VWAP while simultaneously encountering Fibonacci resistance and a value area boundary, the probability of rejection increases significantly.
Despite the recent push higher, the rally toward this resistance has occurred on relatively low trading volume. This is an important factor in technical analysis because sustainable breakouts typically require expanding volume to confirm strong market participation. When price approaches major resistance levels without strong volume support, it often signals that buyers may be losing momentum.
As a result, the current price compression beneath resistance could lead to a rotational move toward lower support before the market attempts another breakout. In range-bound market structures, price frequently oscillates between key liquidity zones as traders reposition their orders. The lack of strong bullish volume suggests that sellers may soon regain control near the $9.17 region.
Meanwhile, developments within the ecosystem continue to expand Chainlink’s broader utility, with the network recently enabling Coinbase’s cbBTC bridging to Monad, unlocking more than $5 billion in Bitcoin-backed liquidity for decentralized finance applications.
If a rejection occurs, the next major technical support level sits near $8.24. This area forms a strong confluence zone where several technical indicators align. Notably, the value area low is positioned close to this region, marking a historical liquidity zone where buyers have previously stepped in to defend price.
Additionally, the lower Fibonacci support derived from the recent swing structure aligns closely with this level. When multiple technical indicators converge at a single price zone, it often creates a strong support region where price may stabilize or bounce.
Because of this confluence, the $8.24 level could act as the next liquidity magnet for price action if Chainlink begins to rotate lower from the current resistance. A move toward this level would also represent a natural retracement within the broader trading structure rather than a complete breakdown in market sentiment.
Such rotational movements are common in consolidation phases where assets oscillate between support and resistance before establishing a clearer directional trend. The current compression beneath resistance suggests that the market is still searching for liquidity before determining the next decisive move.
What to expect in the coming price action
As long as Chainlink remains below the $9.17 resistance zone, the probability favors a rejection and rotational move toward the $8.24 support region. A break above resistance with strong volume would invalidate the bearish scenario and open the path toward the higher timeframe resistance near $9.72.
Until that occurs, the market structure suggests that downside risk remains elevated within the current trading range.


A whale has used 5.6M USDC on Hyperliquid to take a 20x leveraged oil short near $96, effectively betting that Iran‑driven crude prices will mean‑revert and ease macro pressure on BTC.
Summary
- On‑chain data shows a single whale address depositing 5.6M USDC to Hyperliquid, then using the entire balance to short crude oil with 20x leverage, setting liquidation near $147.94 per barrel.
- The entry coincides with WTI April futures spiking over 10% above $96 and Shanghai SC crude jumping 7% on Iran conflict risk, turning the trade into a macro call that current prices overshoot fundamentals.
- For Bitcoin and broader crypto, the position is a sentiment gauge: if oil rolls over and the short pays, it implies softer inflation and rates, easing pressure on high‑beta assets and reinforcing BTC’s “macro hedge” narrative.
A large whale has bet aggressively against surging oil prices on Hyperliquid (HYPE), opening a 20x leveraged short worth 5.6 million USDC with a liquidation level near 148 dollars per barrel, according to on-chain monitoring data.
Whale piles into 20x oil short on Hyperliquid
Lookonchain data shows that over the past two hours, a single whale address deposited 5.6 million USDC onto derivatives venue Hyperliquid and used the entire balance to short oil with 20x leverage. At that leverage, the position’s liquidation price sits at 147.94 dollars per barrel, implying the trader is willing to tolerate a further violent squeeze in crude but is ultimately positioning for mean reversion after this week’s Iran‑driven spike.
The timing aligns with WTI April futures ripping more than 10% intraday and breaking above 96 dollars, while Shanghai’s SC crude contract climbed over 7%, as war risk and supply fears pushed energy markets toward triple‑digit crude. Against that backdrop, the whale’s short is effectively a macro punt that current oil prices overshoot fundamentals and that either de‑escalation, policy intervention, or demand destruction will pull the curve back down.
Signal for crypto macro traders
Because the trade is funded entirely in USDC and executed on a crypto-native derivatives platform, it offers a rare, transparent look at how large on-chain participants are expressing views on traditional commodity risk. Rather than simply rotating between BTC and stablecoins, this address is using crypto infrastructure to take a leveraged stance in one of the key variables driving the entire macro and risk‑asset complex.
For Bitcoin and the broader digital asset market, the position matters as a sentiment gauge. If oil does roll over and the short pays, it would support a softer inflation and rate path than the current tape implies, easing pressure on high‑beta assets and potentially reinforcing the emerging narrative of BTC as a relative winner versus gold and U.S. equities in a volatility‑heavy regime.
Bitcoin (BTC) failed to break beyond $71,000 on Thursday, partially driven by the decline in the US stock market, with BTC funding rates dropping deeper into negative territory.
Key takeaways:
-
Bitcoin bears show high conviction as funding rates drop, but steady institutional buying keeps sellers in check.
-
Gold and government bond yields are rising, making it harder for Bitcoin to compete as a top-tier store of value.
Bitcoin futures imply moderate market stress
Traders fear that a prolonged war in Iran could cause havoc in the energy markets, negatively impacting the already weakened global economic prospects.
Bitcoin’s perpetual futures displayed signs of moderate stress, signaling a potential $66,000 retest. However, institutional inflows show increased demand, reducing the odds of a major Bitcoin price correction.

The Bitcoin perpetual futures annualized funding rate dropped to -7% on Thursday, meaning shorts (sellers) were the ones paying to keep their positions open.
The growing conviction from bears is concerning, but the lack of demand from longs (buyers) should come as no surprise, given that Bitcoin is 45% below its all-time high.
Bitcoin’s derivatives remain muted
The tech-heavy Nasdaq 100 index traded merely 6% below its all-time high on Thursday. Even the US-listed small capitalization Russell 2000 Index stood 9% from its highest mark ever.
Hence, the worsening economic conditions or fear of contagion due to logistics issues in the Middle East can hardly be used to justify Bitcoin’s sluggishness.
The latest US jobless data released on Thursday revealed 1.85 million continuing claims in the week ended on Feb. 28, slightly above consensus, according to Yahoo Finance.
US President Donald Trump vowed to “finish the job” in Iran, a war that further weakens the government’s fiscal debt conditions and does not help labor market prospects.

The Bitcoin monthly futures premium relative to regular spot markets has stood below the neutral 5% threshold for the past couple of weeks. But despite being far from bullish, there is no evidence that Bitcoin derivatives presently signal continued stress.
This lack of interest is a reflection of Bitcoin’s failure to rally despite the anticipation of monetary expansion.
Rising institutional demand may push BTC above $75,000
Gold strength above $5,100 undermines Bitcoin’s store of value premise, especially as yields on US bonds rose sharply in March, meaning traders are demanding higher returns to hold those instruments.

Yields on the 5-year US Treasuries jumped to 3.80% on Thursday after dipping below 3.50% in late February. Hence, investors exited fixed-income investments.
Related: Bitcoin catching up to gold hints at an ‘opportunity within risk’
The US Federal Reserve is in a tough spot since lowering interest rates is needed to boost the job market and reduce risks in credit markets. But rising oil prices create sustained upward pressure on inflation.
Presently, Bitcoin’s hard-coded and transparent monetary policy is not being valued as a safe haven, but this could change as institutional demand picks up.
Additionally, a single Bitcoin derivatives metric (funding rates) should not be interpreted as a driver for a sharp price correction.
Particularly, amid a sequence of Bitcoin spot exchange-traded fund (ETF) net inflows and Strategy (MSTR US) yield products, resulting in accelerated Bitcoin accumulation. Sellers below $75,000 will eventually run out of coins, paving the way for a sustained bull run.
As Cointelegraph reported, Bitcoin bulls will likely need to wait until after March for a chance to break the $78,000 resistance
This article does not contain investment advice or recommendations. Every investment and trading move involves risk, and readers should conduct their own research when making a decision. While we strive to provide accurate and timely information, Cointelegraph does not guarantee the accuracy, completeness, or reliability of any information in this article. This article may contain forward-looking statements that are subject to risks and uncertainties. Cointelegraph will not be liable for any loss or damage arising from your reliance on this information.
The United States Senate voted on Thursday to include an amendment in the 21st Century Road to Housing Act that would prohibit the Federal Reserve from issuing a central bank digital currency (CBDC).
The CBDC prohibition will remain in effect until Dec. 31, 2030, according to the amendment in the bill. The legislation, which passed 89-10, stated:
“The Board of Governors of the Federal Reserve System or a Federal Reserve Bank may not issue or create a central bank digital currency or any digital asset that is substantially similar to a central bank digital currency, directly or indirectly through a financial institution or other intermediary.”

However, the bill does not prohibit any dollar-denominated digital currency that is “open, permissionless, and private,” such as stablecoins.
US Treasury Secretary Scott Bessent and President Donald Trump have presented dollar-pegged stablecoins as a way to extend US dollar hegemony, while Trump and other Republican lawmakers have taken a hardline stance against CBDCs.
Related: Republican opposition to CBDC could hold up housing affordability bill
Lawmakers slam CBDCs as authoritarian surveillance technology
More than 30 US lawmakers signed a letter on March 6, urging the Senate to pass a permanent CBDC ban, rather than a temporary moratorium.
“A CBDC would give unelected bureaucrats unprecedented power over Americans’ finances and threaten basic economic freedom,” Representative Ralph Norman, one of the signatories of the letter, said.

Representative Warren Davidson, a long-time critic of CBDCs, has also criticized regulated dollar-pegged stablecoins as having the same surveillance capabilities as CBDCs.
Warren also warned that regulations under the Guiding and Empowering Nation’s Innovation for US Stablecoins (GENIUS) Act create an avenue to “control” and “coerce” the US population through financial surveillance techniques and programmable money.
Hedge fund manager Ray Dalio also recently warned that CBDCs would expand the government’s control over people’s finances.
“There will be no privacy, and it’s a very effective controlling mechanism by the government,” Dalio said in an interview with independent journalist Tucker Carlson.
CBDCs likely won’t be yield-bearing, meaning they do not offer inflation protection and can be automatically taxed or frozen by the government, he added.
Magazine: GENIUS Act reopens the door for a Meta stablecoin, but will it work?


- Playnance to launch G Coin on March 18.
- Token enters market with 200,000 holders and $38M estimated valuation.
- Ecosystem processes millions of daily interactions across gaming, sports, and prediction markets.
Playnance, a Web3 infrastructure company focused on blockchain-based digital entertainment platforms, is preparing to launch G Coin, the utility token powering activity across its ecosystem of on-chain gaming, prediction markets, and interactive financial platforms, on March 18.
Unlike many token launches that occur before meaningful product adoption, G Coin enters the market as part of an already active ecosystem.
According to Playnance’s public tracker, the token currently has more than 200,000 holders, with about 13 billion G Coin distributed during the presale phase and an estimated market capitalisation of around $38 million ahead of its Token Generation Event.
G Coin serves as the unified economic layer of the Playnance ecosystem, enabling gameplay activity, predictions, settlements, rewards, and other forms of participation across the network’s platforms. “On March 18, G Coin will enter the market with real adoption already in place,” said Pini Peter, CEO of Playnance.
“With more than 200,000 holders and millions of daily on-chain interactions, G Coin introduces a usage-driven token economy designed to grow alongside its expanding global community. There are many other surprises on the way to take the entertainment world to the next level. Stay tuned.”
The token runs on PlayBlock, Playnance’s blockchain infrastructure designed to support fast, gasless interactions while maintaining non-custodial ownership and on-chain transparency.
The wider Playnance ecosystem operates at scale across multiple digital entertainment platforms.
Its infrastructure supports more than 300,000 registered accounts, integrates with over 30 game studios, and hosts more than 10,000 on-chain games.
Across the network, platforms process roughly 2 million on-chain transactions daily and enable interaction with over 2.5 million sports events annually.
Together, these systems create a high-volume on-chain environment where millions of daily interactions across gaming, sports, and financial prediction markets are powered by G Coin.
Recent developments across the ecosystem point to continued activity growth ahead of the token launch.
Earlier this year, Playnance reported that its “Be The Boss” partner program had surpassed $2 million in real cash payouts, while the broader ecosystem generated more than $5.3 million in total revenue.
G Coin operates under a fixed supply model capped at 77 billion tokens, with no future minting.
Circulating supply is managed through a structured lock-and-release system.
Tokens lost through gameplay are locked for 12 months before returning to circulation according to their original loss date.
Unsold tokens from the Token Generation Event are subject to a 12-month cliff followed by a 24-month linear vesting schedule.
With the launch of G Coin, Playnance aims to formalize the economic layer supporting its digital entertainment infrastructure, linking gameplay, sports events, prediction markets, and partner platforms within a unified on-chain ecosystem.

Coinbase has denied lobbying against a de minimis tax exemption for bitcoin (BTC), despite a vehement claim by podcaster and Ten31 managing partner Marty Bent that it has.
Bent reported on March 11 that the exchange was quietly telling lawmakers that a de minimis tax exemption for BTC payments was unnecessary.
According to Bent and his “multiple” Capitol Hill sources, Coinbase lobbyists allegedly told legislators “no one is using BTC as money” and that such a tax change would be “dead on arrival.”
He also claimed that the company only wanted the exemption to apply to specifically regulated, dollar-pegged tokens like the Coinbase-supported USDC.
Coinbase Chief Policy Officer Faryar Shirzad denied the allegation flatly. “This is a total lie, Marty Bent. We have never and will never lobby against Bitcoin. Ever.”
Kara Calvert, Coinbase’s VP of US policy, called the claim “categorically false.” She said Coinbase has advocated for a de minimis exemption covering “all digital assets,” including BTC, since 2017.
Coinbase Chief Legal Officer Paul Grewal also called the allegation a lie while Nic Carter dismissed Bent’s allegation out of hand.
Jack Dorsey quote-tweeted Shirzad’s claim that Coinbase had “never and will never lobby against Bitcoin” and asked for a confirmation from Coinbase’s CEO Brian Armstrong. “Hope this is true for de minimis as well. @brian_armstrong?”
Armstrong confirmed.
Disagreeing, Conner Brown, head of strategy at the Bitcoin Policy Institute, partially reiterated Bent’s concern.
Without naming Coinbase directly, “I can confirm that over the past three months, there’s been a strong shift on the Hill to limiting the de minimis exemption to stablecoins only,” Brown wrote.
Pierre Rochard also thinks Coinbase isn’t telling the whole truth. “Bitcoin should be tax exempt. It’s really sad to see Brian Armstrong lobbying against that,” he wrote.
Even when Grewal called him out for defamation, Rochard stuck to his story, “Wait until you see the bill.”
Read more: Crypto leaked by South Korean tax officials stolen a second time
A wrinkle in Coinbase’s tax denial
Coinbase has certainly been clear that its stance is that it’s never advocated against a bitcoin de minimis tax exemption. However, Coinbase’s stablecoin business, and a confusing post by Calvert, slightly complicates its denial.
Recall that Coinbase earned $1.3 billion in stablecoin revenue in 2025, mostly from interest on the US Treasuries backing USDC. A de minimis exemption covering BTC only would allow people spend one non-USDC digital asset tax-free for everyday purchases, thereby making BTC a somewhat direct competitor to USDC.
Nonetheless, Coinbase’s Calvert says that Coinbase has been advocating for a crypto-wide, all-asset exemption for years.
She also claimed that “Stablecoins don’t realize gains or losses” because “they are stable,” which is certainly not always true, but is her bizarre claim nonetheless.
If stablecoins were indeed “stable” and guaranteed to hold their $1 peg, (ignoring the fact that USDC has traded in the $0.80s many times), it would be absurd for Coinbase to advocate for a stablecoin-only tax exemption for USDC stablecoins which, in Calvert’s view, “don’t realize gains or losses” anyway.
In truth, USDC has traded in a wide range from at least $0.87 to $1.09 on Kraken, including hundreds of millions of dollars in settled transactions below $0.98.
Even lower and higher USDC prices have settled on other trading venues.
Coinbase wants to win on Capitol Hill
Bent’s original post accuses one of the world’s largest and longest-running BTC exchanges of trying to “nuke” any hopes for a BTC minimis tax exemption.
He described, citing three unnamed “sources,” Coinbase pushing for an exemption on stablecoins only.
Even though Coinbase has clearly denied the allegation, the exemption under discussion, backed by Senator Cynthia Lummis, would set a $300 tax threshold per transaction with a $5,000 annual cap. It would thereby eliminate capital gains taxes on small crypto payments.
Whether the exemption will ever be enacted into IRS code, and to which digital assets it would ever apply, is the active subject of Capitol Hill debate.
Under current law, the IRS treats all digital assets as property, so every sale, including the de facto sale of crypto while purchasing a good or service, triggers a tax reporting obligation.
Read more: Coinbase boosts lobbying efforts with massive political donations
Coinbase contributed roughly $69 million to the Fairshake super PAC during the 2024 cycle, more than any other donor. Another tracker shows Coinbase political contributions exceeding $59 million.
When Coinbase lobbies, Washington DC listens.
Got a tip? Send us an email securely via Protos Leaks. For more informed news, follow us on X, Bluesky, and Google News, or subscribe to our YouTube channel.
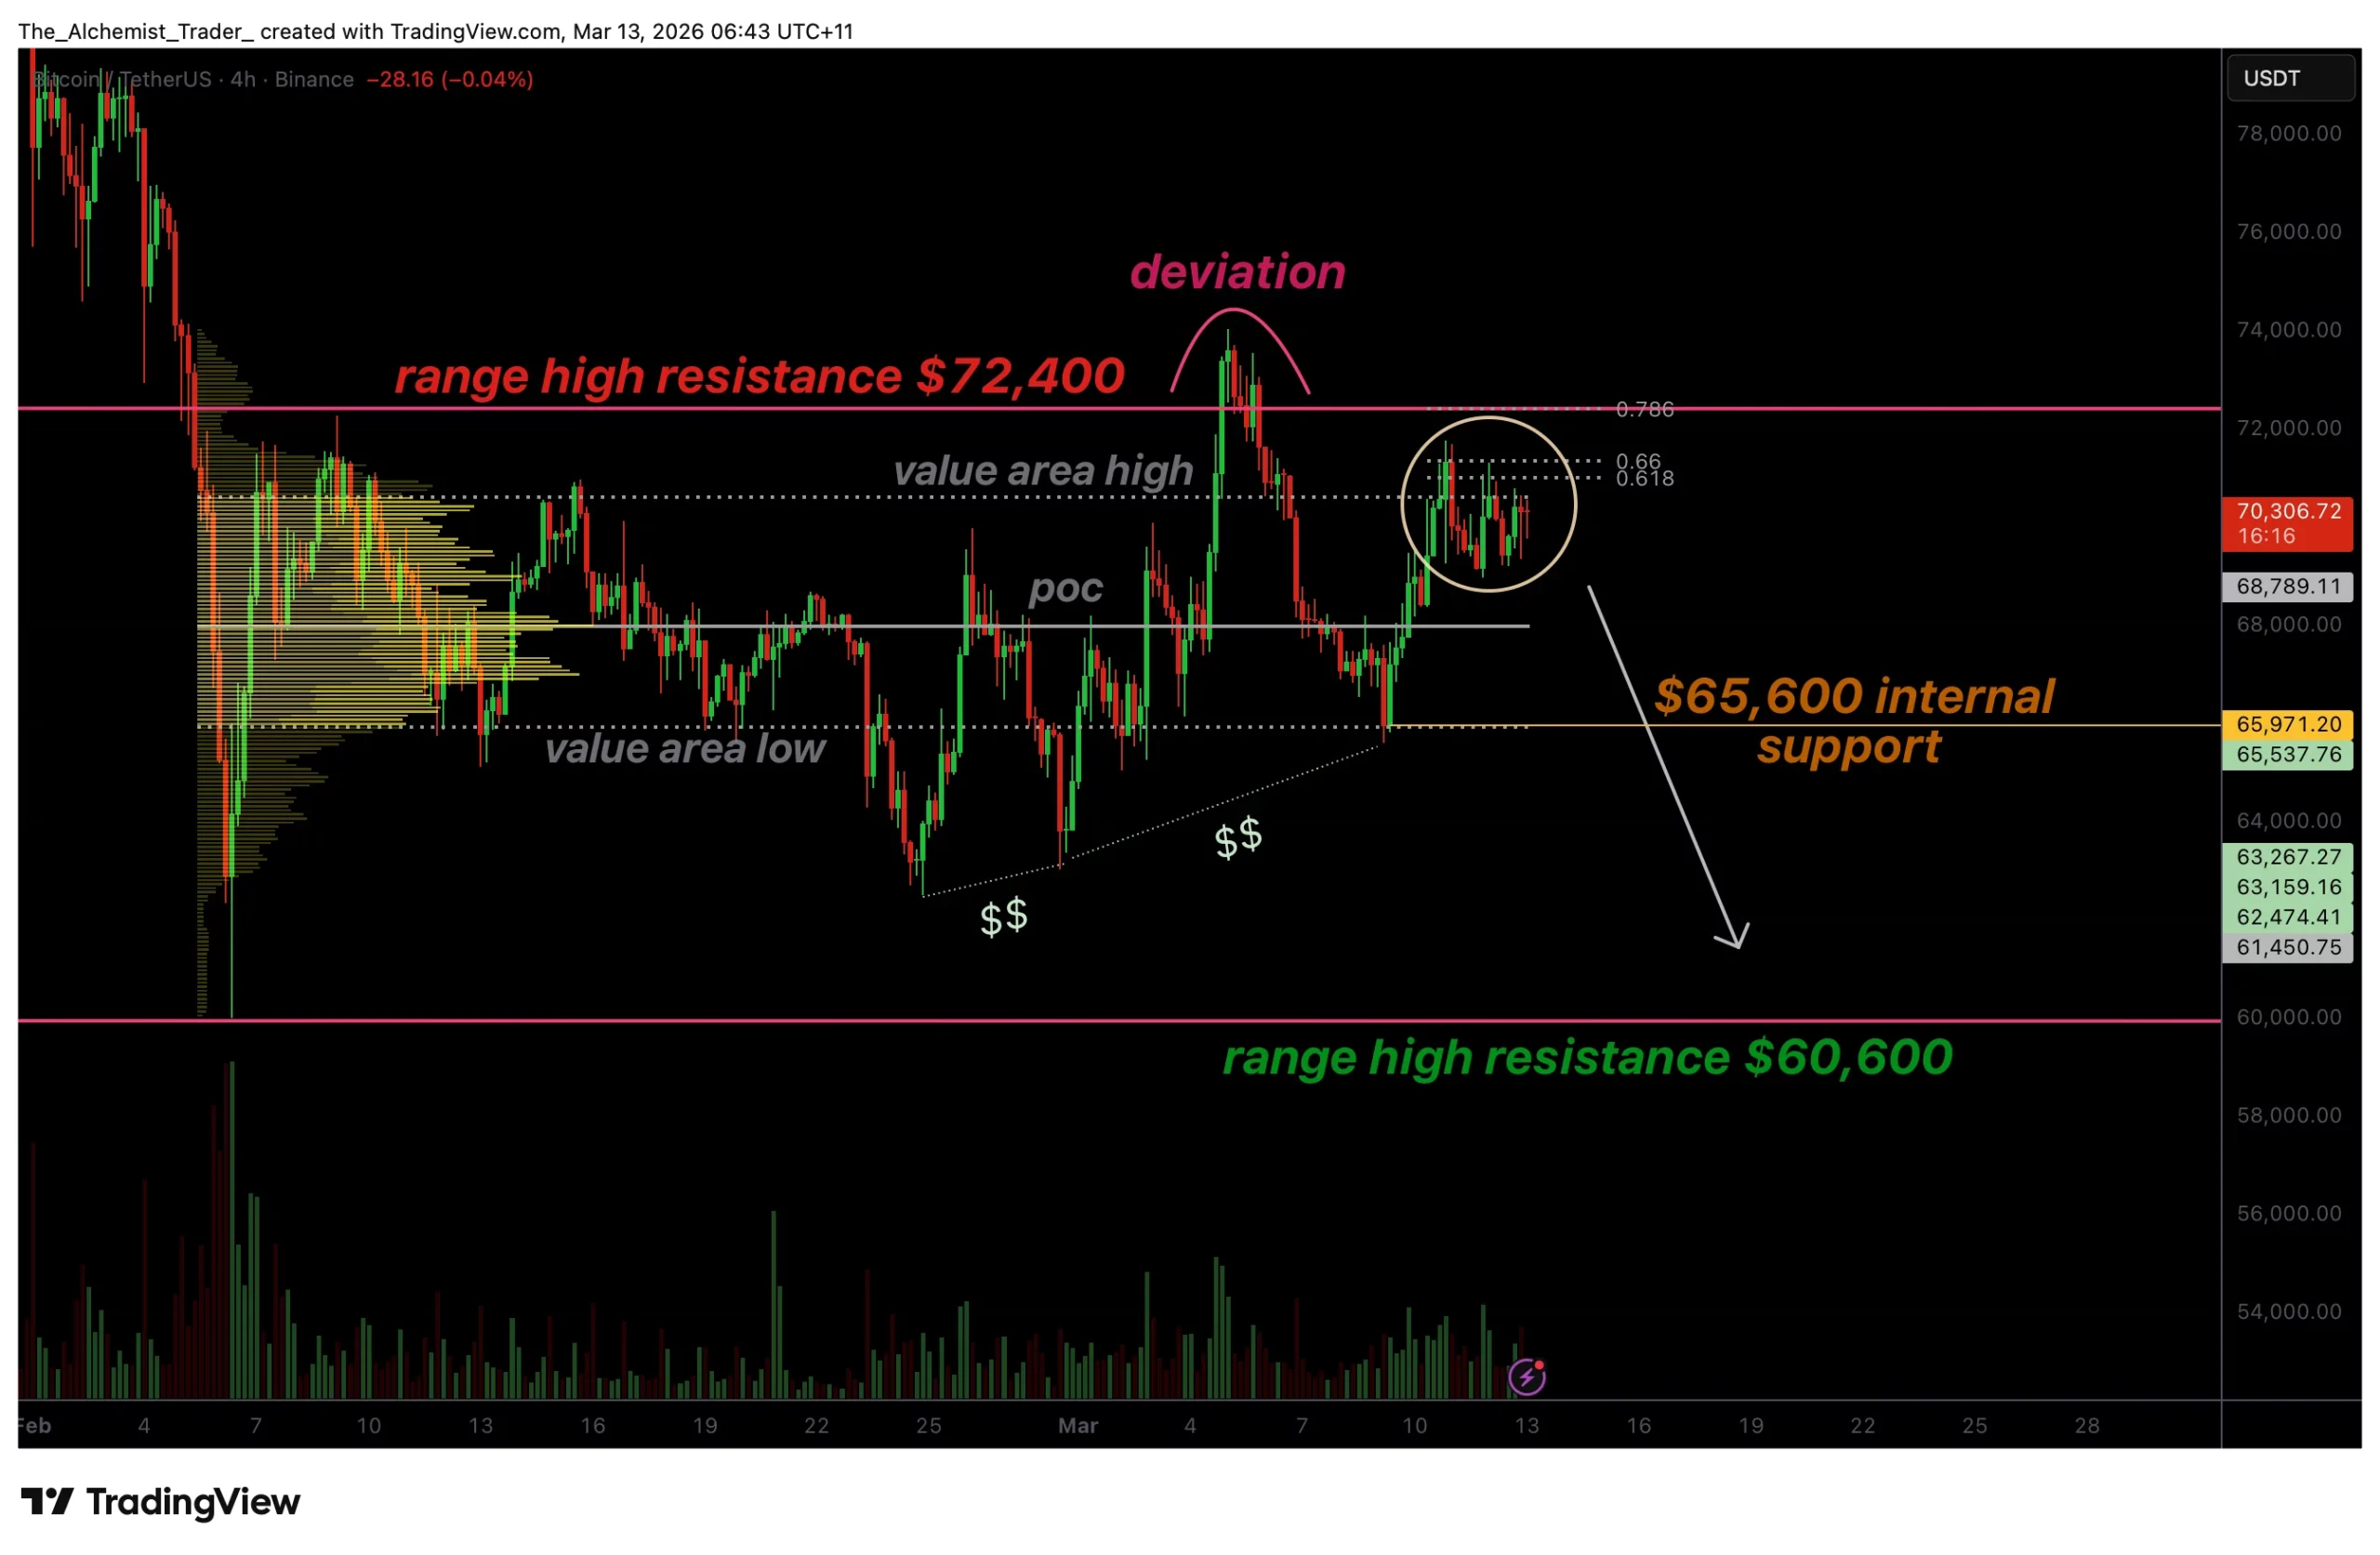
Bitcoin price is consolidating beneath major resistance near $72,400 as volatility compresses and momentum weakens.
Summary
- Key Resistance: $72,400 aligns with the value area high and 0.618 Fibonacci level.
- Low Volatility: The current rally shows weak volume and limited momentum.
- Support Target: $65,000 acts as the next major support within the range.
Bitcoin’s (BTC) price action has entered a period of low volatility as the market consolidates beneath a major resistance cluster near the upper boundary of its current trading range. After previously rejecting the $72,400 range high, the asset has rallied back toward the value area high but is now struggling to build sufficient momentum to push higher.
With trading volume declining during the current move, the probability of a rejection and a move toward lower support levels is beginning to increase.
Bitcoin price key technical points
- Major Resistance: $72,400 range high aligns with the 0.618 Fibonacci and value area high.
- Low-Volume Rally: Weak momentum suggests the current move lacks strong buyer participation.
- Downside Target: Potential rotation toward $65,000 support.

Bitcoin’s current price structure is centered around the value area high, a key technical level derived from the volume profile that often acts as a pivot for price direction. This region also aligns closely with the 0.618 Fibonacci retracement and the broader range resistance located near $72,400. When multiple technical indicators converge at the same level, the zone often becomes a strong barrier for price continuation.
Previously, Bitcoin attempted to break above this range high but formed a deviation above the level before quickly moving back into the range. Such deviations typically signal weakening momentum, as they indicate that buyers were unable to sustain price above resistance. The rejection from that level established $72,400 as a clear ceiling within the current trading structure.
Since that rejection, Bitcoin has gradually moved back toward the upper boundary of the range, but the recovery has occurred under noticeably lower trading volume. In technical analysis, volume often acts as a confirmation signal for price movement. Strong breakouts usually require expanding volume to demonstrate strong participation from market participants.
When price approaches major resistance levels on declining volume, it frequently suggests that the move lacks conviction. This type of environment often precedes a rejection or a continuation of the broader range structure rather than a sustained breakout.
As a result, the current low-volatility consolidation may simply represent a pause before the market expands toward the next liquidity zone. In range-bound markets, price tends to oscillate between the value area high and value area low as traders search for liquidity and rebalance positions.
Recent analysis from CryptoQuant also suggests Bitcoin may be approaching a supply shock, as retail investors continue selling while long-term holders keep their coins dormant, a dynamic that could tighten available supply once volatility returns.
If Bitcoin rejects from the current resistance cluster, the next major support sits near $65,000. This level represents an internal support zone within the broader trading range and aligns closely with the value area low. Because of this confluence, it becomes a natural liquidity target for price if selling pressure begins to increase.
A rotation toward $65,000 would maintain the broader range structure that has defined Bitcoin’s price action between approximately $60,600 and $72,400. Such movements are common during consolidation phases, where price repeatedly tests both sides of the range before a decisive breakout eventually occurs.
However, the loss of the $65,000 support level could significantly increase downside risk. If price breaks below this internal support, the probability of a sharper decline toward the lower boundary of the range around $60,600 would increase. This region represents the next major liquidity pool that has not yet been fully tapped during the current trading cycle.
From a market structure perspective, this means that Bitcoin is currently positioned at a technically sensitive point. Consolidation beneath resistance often leads to volatility expansion, and the direction of that expansion is typically determined by which key level fails first.
What to expect in the coming price action
As long as Bitcoin remains below the $72,400 resistance zone, the probability favors a rotational move toward the $65,000 support region. A break below this level could open the door to deeper downside toward the $60,600 range low, while a strong breakout above resistance with increasing volume would invalidate the bearish outlook.

Cryptio, a Paris-based platform focused on regulated digital-asset accounting and data reconciliation, has closed a $45 million Series B round, underscoring a widening appetite among institutions for tools that translate blockchain activity into familiar accounting records. The financing was led by BlackFin Capital Partners and Sentinel Global, with participation from 1kx, BlueYard Capital, Alven and Ledger Cathay Capital among others. Cryptio positions itself as the connective tissue between on-chain activity and traditional financial reporting, audits and compliance workflows, offering software that reconciles activity across wallets, custodians and exchanges into conventional ledgers. In a period of accelerating tokenization and new asset classes, such infrastructure can be decisive for banks, asset managers and fintechs seeking to scale securely.
Key takeaways
- Cryptio raised $45 million in a Series B led by BlackFin Capital Partners and Sentinel Global, with participation from 1kx, BlueYard Capital, Alven and Ledger Cathay Capital.
- The platform reconcilies blockchain activity from wallets, custodians and exchanges and translates it into accounting records used for financial reporting, audits and compliance.
- Cryptio counts more than 400 enterprise clients and has processed over $3 trillion in transaction volume, including names such as Circle, Gemini, Securitize, and SG-Forge.
- Institutional interest in tokenization is driving demand for institutional-grade infrastructure that supports regulated markets and auditable reporting.
- The broader market for tokenized real-world assets is expanding, with estimates surpassing $26 billion in value and ongoing growth in tokenized money market funds.
Sentiment: Bullish
Price impact: Positive. The funding round signals continued willingness among traditional investors to back specialized infrastructure for on-chain assets, potentially unlocking further capital flows into tokenized finance.
Trading idea (Not Financial Advice): Buy. The round underscores a structural shift toward institutional-grade tooling for crypto-enabled assets, a trend likely to widen as tokenization activities mature.
Market context: The funding aligns with a broader push by traditional finance into tokenization and regulated crypto markets, where firms seek auditable systems that bridge on-chain data with conventional financial controls. As major banks and asset managers back tokenization networks and tools, the ecosystem is increasingly anchored by infrastructure providers that can scale governance, compliance and reporting alongside new asset classes.
Why it matters
The rise of tokenized assets has moved beyond a niche experiment to a form of finance that interacts with mainstream accounting and regulatory regimes. Cryptio’s value proposition centers on turning the frictions of reconciling on-chain activity into familiar, auditable records. By translating blockchain events into balanced ledgers, the platform enables clients to produce reliable financial statements, support audits and meet regulatory requirements without manual, error-prone reconciliation processes. The company’s current client roster reads like a who’s who of crypto-native and traditional finance players—Circle, Gemini, Securitize and SG-Forge—demonstrating demand across a spectrum of use cases from custody to token issuance and asset servicing.
The momentum around tokenized finance is only growing. Tokenization networks and governance bodies have gained traction as banks and asset managers explore how to extend traditional market activities to blockchain rails. The Canton Foundation, a consortium-backed initiative focused on regulated markets, has drawn backing from HSBC, BNP Paribas and Goldman Sachs, highlighting how large incumbents view tokenized infrastructure as essential to risk controls and governance. In parallel, State Street’s January rollout of a crypto tokenization tool illustrates a tangible move by a major custodian to enable clients to create tokenized money-market funds, exchange-traded funds and tokenized deposits—an evolution that expands the practical use cases for tokenized assets while increasing the demand for reliable accounting tooling.
Industry data suggest a meaningful market for tokenized real-world assets, excluding stablecoins, with estimates topping $26 billion in value. Much of this demand is driven by private-credit and U.S. Treasurys-backed funds, with tokenized money-market funds emerging as a fast-growing subsegment. In this context, the need for robust reconciliation, data integrity and reporting frameworks becomes more acute. As tokenized securities and asset-backed arrangements proliferate, institutions require platforms that can maintain transparency, support regulatory reporting and provide an auditable trail for external audits and internal risk management.
Executives from investment and technology houses stress that digital assets are being embedded into regulated markets, calling for infrastructure that meets institutional standards. Sidra Pervez, senior vice president at tokenization specialist Securitize, has emphasized that maintaining accurate financial records across capital markets will become increasingly important as traditional finance expands into tokenized securities. Equally, Loic Fonteneau, managing director at BlackFin Capital Partners, notes that the integration of digital assets into regulated markets will demand what he calls “institutional-grade infrastructure” to support accounting, reporting and lending tied to tokenized assets. The confluence of these viewpoints reflects a sector-wide shift toward interoperability between on-chain activity and conventional governance, risk and compliance practices.
What to watch next
- Cryptio’s client expansion and adoption across regulated markets, including new deployments with existing enterprise customers.
- Updates from the Canton Foundation and Canton Network governance as more financial institutions participate in regulated tokenization ecosystems.
- State Street’s tokenization platform rollout and its uptake by clients seeking tokenized money-market funds and deposits.
- Data on tokenized asset volumes from market trackers such as RWA.xyz to gauge growth trajectories in real-world asset tokenization.
- Regulatory developments affecting tokenized securities and reporting standards that could affect the demand for reconciliation and accounting infrastructure.
Sources & verification
- Cryptio’s Series B announcement and investor roster (BlackFin Capital Partners, Sentinel Global, 1kx, BlueYard, Alven, Ledger Cathay Capital).
- Commentary from Sidra Pervez of Securitize on the importance of accurate cross-market financial records.
- Remarks by Loic Fonteneau of BlackFin Capital Partners on the institutional embedding of digital assets in regulated markets.
- Backers of the Canton Foundation (HSBC, BNP Paribas, Goldman Sachs) and coverage of the Canton Network for regulated financial markets.
- State Street’s January tokenization platform rollout for tokenized money-market funds, ETFs and deposits.
- Market data from RWA.xyz indicating the value and growth of tokenized real-world assets outside of stablecoins.
Institutional momentum reshapes crypto accounting infrastructure
Cryptio’s Series B signals more than capital inflows; it reflects a broader validation of the infrastructure needed to manage regulated digital assets at scale. By translating on-chain events into conventional accounting entries, the company aims to reduce the friction that has long separated crypto activity from traditional financial reporting. The platform’s ability to reconcile across multiple on-chain and off-chain venues addresses a core pain point for enterprises navigating complex custody arrangements, multiple exchanges and disparate governance frameworks. With more than 400 enterprise clients and trillions of dollars in on-chain transaction volume processed, Cryptio is positioning itself at the center of a growing ecosystem where tokenization, compliance and reporting converge.
The alignment between traditional finance and crypto-native activity is not incidental. It is being reinforced by major financial institutions’ participation in tokenization initiatives and the rollouts of institutional-grade tools to handle tokenized assets. The convergence is creating a demand curve for robust accounting and reporting layers that can withstand regulatory scrutiny while enabling the efficiency gains promised by blockchain-based finance. In this context, Cryptio’s growth—alongside other players like Lukka, TaxBit, Bitwave and CoinLedger—points to a developing market for specialized software that makes crypto activity auditable, transparent and comparable to conventional financial data.
As tokenization becomes a more common mechanism for issuing and servicing assets, the need for accuracy, traceability and interoperability grows. For investors and builders, the trajectory suggests new opportunities in data platforms, interoperability standards and governance-enabled finance that can unlock institutional participation in digital assets while preserving the safeguards and controls valued in regulated markets.
Raymond James raises Akamai stock price target on compute growth
Whale Swaps $50 Million in Stablecoins for Just $36,000 of AAVE

Islamophobia downplayed by Labour health minister


-
Business6 days ago
Form 8K Entergy Mississippi LLC For: 6 March
-

 News Videos3 days ago
10th Algebra | Financial Planning | Question Bank Solution | Board Exam 2026
-

 Fashion6 days ago
Weekend Open Thread: Ann Taylor
-

 Crypto World3 days ago
Paradigm, a16z, Winklevoss Capital, Balaji Srinivasan among investors in ZODL
-
 Tech2 days ago
A 1,300-Pound NASA Spacecraft To Re-Enter Earth’s Atmosphere
-

 Tech2 days ago
ChatGPT will now generate interactive visuals to help you with math and science concepts
-

 Politics6 days ago
Top Mamdani aide takes progressive project to the UK
-

 Business2 days ago
ExxonMobil seeks to move corporate registration from New Jersey to Texas
-

 Sports5 days ago
Three share 2-shot lead entering final round in Hong Kong
-

 Sports5 days ago
Braveheart Lakshya downs Lai in epic battle to enter All England Open final | Other Sports News
-

 NewsBeat1 day ago
Residents reaction as Shildon murder probe enters second day
-

 Entertainment6 days ago
Hailey Bieber Poses For Sexy Selfies In New Luscious Lip Thirst Traps
-

 Business4 days ago
Search for Nancy Guthrie Enters 37th Day as FBI Probes Wi-Fi Jammer Theory
-

 Business2 days ago
Search Enters Sixth Week With New Leads in Tucson Abduction Case
-
 NewsBeat3 days ago
Pagazzi Lighting enters administration as 70 jobs lost and 11 stores close across Scotland
-

 Tech3 days ago
Despite challenges, Ireland sixth in EU for board gender diversity
-

 Business3 days ago
Search Enters 39th Day with FBI Tip Line Developments and No Major Breakthroughs
-

 NewsBeat1 day ago
I Entered The Manosphere. Nothing Could Prepare Me For What I Found.
-

 Business6 days ago
Iran war enters second week as Trump demands ’unconditional surrender’
-

 Sports3 days ago
Skateboarding World Championships: Britain’s Sky Brown wins park gold