
Crypto World
Scaramucci Predicts Bitcoin Bull Run Returns by Late 2026 Amid Market Downturn

Key Takeaways
- SkyBridge Capital’s Anthony Scaramucci maintains that Bitcoin’s traditional four-year market cycle continues operating despite growing institutional participation
- Significant profit-taking occurred around the $100,000 price milestone, creating substantial sell-side pressure that pushed BTC from $126,000 down to $60,000
- While institutional capital and exchange-traded funds have dampened price swings, they haven’t fundamentally altered the cyclical nature of Bitcoin markets
- Scaramucci anticipates volatile, sideways price action throughout most of 2026 before a fresh uptrend emerges in the fourth quarter
- The S&P 500 declined 1.3% and breached its 200-day moving average, prompting warnings that Bitcoin might decline 50% if correlation with equities persists
Anthony Scaramucci, the managing partner at SkyBridge Capital, maintains that Bitcoin is experiencing a typical four-year cycle pullback and anticipates price recovery beginning in Q4 2026.
Scaramucci offered these insights during an appearance on Scott Melker’s “The Wolf of All Streets” podcast. He identified selling activity around the $100,000 price level as a primary catalyst behind the ongoing downturn.
Early adopters and long-term Bitcoin holders viewed the $100,000 mark as a significant profit-taking opportunity. This selling wave created downward momentum despite simultaneous institutional capital entering the market.
Bitcoin reached a peak near $126,000 before experiencing a steep decline to $60,000. This correction shattered widespread market predictions that BTC would reach $150,000 during 2025.
According to Scaramucci, those bullish projections were driven by Donald Trump’s cryptocurrency-friendly policies and improved regulatory conditions in the United States. However, he emphasized that markets typically defy consensus expectations.
He referenced early 2023 as a perfect illustration. Bitcoin began its recovery in January 2023 during a period of extreme bearish sentiment following FTX’s November 2022 collapse.
“It was at a period of great disinterest and great apathy that the bull market started again,” Scaramucci noted.
Institutional Participation Has Modified But Not Eliminated the Cycle
Scaramucci explained that Bitcoin exchange-traded funds and institutional capital have moderated volatility without destroying the cyclical framework. While price fluctuations have become less dramatic, the fundamental pattern persists.
He characterized the cycle as somewhat self-reinforcing. Market participants who recognize and trade based on the four-year rhythm effectively perpetuate the pattern through their collective behavior.
U.S. spot Bitcoin ETFs have attracted approximately $2 billion in net inflows during the last four weeks, representing the most extended period of positive flows seen in 2026.
Bitcoin’s Correlation With Traditional Equity Markets Strengthens
Bitcoin dropped beneath $69,000 on Saturday as escalating Middle East geopolitical tensions continued pressuring risk-sensitive assets. The Iran situation has now stretched into its third week, creating headwinds for global financial markets.
The S&P 500 fell 1.3% on Friday, closing below its 200-day moving average for the first occurrence in ten months. This technical level serves as a critical indicator for assessing long-term equity market trends.
Several market analysts now suggest Bitcoin could experience an additional 50% decline in 2026 if its correlation with the S&P 500 remains elevated.
Scaramucci characterized the present correction as an ordinary downturn consistent with historical cycles. He projects continued volatility and range-bound trading for the majority of the year before a new bullish phase initiates in Q4 2026.
U.S. spot Bitcoin ETFs have accumulated approximately $2 billion in total inflows during the previous four-week period.


- SIREN surges as momentum and strong trading activity increase.
- Profit-taking is, however, emerging after the recent sharp price rally.
- Key levels to watch are the support at $2.50 and the resistance at $3.20.
SIREN has surged sharply, drawing attention across the crypto market.
The token has recorded a 89% increase within a single day, which is an unusually large move even by memecoin standards.

This kind of rapid price action is rarely random, and it usually reflects a mix of strong momentum, speculation, and short-term market dynamics.
Here’s why the price of SIREN jumped that high
One of the main drivers behind this move is simple market momentum.
When a token begins to rise quickly, it tends to attract more buyers who fear missing out.
This creates a feedback loop in which rising prices lead to higher demand, which in turn pushes prices even higher.
SIREN appears to have benefited from exactly this kind of reaction.
At the same time, trading activity has increased significantly.
High volume during a price surge often signals strong participation from both retail traders and larger market participants.
However, heavy volume alone does not guarantee continued upside.
It often appears during both breakouts and tops, which makes it important to interpret carefully.
Profit-taking could halt the rally
Despite the strong rally, there are early signs that some participants are locking in profits.
After a near 100% surge, it is common for early buyers to start selling into strength.
This behaviour creates selling pressure that can slow down or reverse upward momentum.
The meme coin is already down 16% from its recently hit all-time high
When prices fail to hold near their peak, it can indicate that sellers are beginning to take control.
There are also concerns among some traders about the structure of the market behind SIREN.
Speculative assets with rapid growth can sometimes be influenced by concentrated holders.
This raises the possibility of larger players influencing price direction through coordinated buying and selling.
SIREN price forecast
Overall, SIREN remains in a strong but fragile position. Looking ahead, the key level to watch is around $2.50.
This level is acting as immediate support in the short term.
If SIREN manages to hold above this zone, the market may enter a consolidation phase.
In that case, the price could move between $2.50 and $3.20 while the market stabilises after the recent surge.
A stronger bullish continuation would require a clean break above $3.20.
If buyers can push the price back toward the recent all-time high and beyond, it would signal renewed strength.
However, this would also require sustained buying volume and strong market sentiment.
On the downside, a break below $2.50 would be a key warning sign.
If that level is lost with significant volume, it could indicate that profit-taking is accelerating.
In that scenario, the next area to watch would be around $2.00.
A move toward this level would represent a deeper correction after the recent rally.

Bitcoin began the week facing renewed macro headwinds as risk sentiment wavered and traders weighed the possibility of further downside in a pattern that resembles January’s bear flag. BTC traded around the mid-$60,000s after a weekend of outsized liquidations and a weekly close that fell short of reclaiming a crucial trend line, with the price hovering near $67,400 into the close and slipping below the 200-week exponential moving average (EMA) around $68,300. The setup comes as gold slips into bear-market territory and oil maintains a firm footing above $100 per barrel, underscoring a macro environment that remains conducive to volatility in risk assets.
Markets are integrating a mix of geopolitical risks, shifting Fed expectations, and on-chain signals. Several traders and analysts highlighted that Bitcoin’s current action echoes a bear-flag scenario seen earlier this year, with potential consequences if selling pressure resumes. In practical terms, a breakdown from the flag could open the door to new multiyear lows, while a short-lived upside would need to clear a sequence of resistance levels to change the narrative. Estimated targets remain contentious, but some observers point to a test of sub-$50,000 if the pattern plays out in earnest, while participants will look for a sustained push above the high-$70,000s to reframe the setup.
Key takeaways
- Bitcoin closed the week below the 200-week EMA (about $68,300), with price near $67,400, renewing bear-market risks for bulls.
- The current price action resembles January’s bear-flag breakdown, suggesting the next move could push BTC toward sub-$50k if momentum accelerates on a breakdown.
- Market dynamics were amplified by elevated liquidations—over $400 million in the last 24 hours—indicating persistent selling pressure and liquidity-linked risk appetite.
- Gold dropped into bear-market territory, trading around $4,100 per ounce, while oil sustained gains above $100, underscoring inflation and energy-security concerns in the macro backdrop.
- On-chain data show long-term holders capitulating, with the Bitcoin Long-Term Holder SOPR dipping to 0.64 in early March, suggesting widespread losses among patient investors even as some supply moved off exchanges.
Bitcoin’s technical crossroads: bear flags, ranges, and a potential squeeze
Trading activity over the weekend underscored a fragile setup as traders awaited fresh cues from traditional markets. Data from TradingView show BTC’s price dipping to near $67,400 into the weekly close, failing to sustain a move back above the 200-week EMA, which currently sits around $68,300. Previously, a weekly close above that line had been viewed as a bulls’ lifeline; the latest close shifts the balance toward the bears’ camp for now.
Analysts have repeatedly warned that the market could circle within a defined range for a period as macro tensions persist. In particular, a number of voices on social media pointed to the January bear-flag precedent, where a breakdown from a consolidation pattern led to a renewed downtrend. The prevailing read is that a break below the lower boundary of the range could accelerate declines, while a lackluster upside would keep the door open to further weakness until macro catalysts shift decisively.
Strategists highlighted a nuanced near-term path. One analyst noted the potential rotation to around $65,000 should the week begin with renewed selling pressure, but a brief push toward $70,000 could lure bulls if price action gains a foothold. A breakthrough above $71,000 would likely require a clean close into the $73,000–$74,000 zone to reassert a bullish tilt; otherwise, risk-reward remains skewed to the downside in the near term.
Liquidity dynamics also shaped expectations. As weekend liquidity thinned, traders observed that small orders could have outsized price effects in the thin books, amplifying moves and triggering stop-loss clusters or liquidations. A few market voices warned against interpreting weekend volatility as a trend signal, reminding participants that thinner markets tend to exaggerate short-term moves.
Across the community, a mix of sentiment and risk due to macro headlines kept traders vigilant. Some suggested the risk of a short-term squeeze exists if liquidity-driven pressure eases and offers a window for longs to step in, but a sustained shift above key levels would be necessary to flip the narrative.
Macro backdrop tightens: gold, oil, and the Iran risk premium
The broader macro environment added a heavyweight note to the Bitcoin picture. Gold, which had been trading at elevated levels, slid into bear-market territory, with XAU/USD dipping more than 20% from its all-time high and testing around $4,100 per ounce. The slide fed into the broader risk-off impulse in early sessions as market participants weighed the implications of higher real yields and inflation dynamics. In commentary cited by traders, some observers argued that a significant liquidity event among large participants could be at play, as price action in the gold market suggested stress beyond routine fluctuations.
The energy complex also played a central role. Oil prices remained resilient above the $100 barrier, reflecting ongoing concerns about supply security, particularly in light of tensions in the Middle East. European and Asian energy markets showed heightened sensitivity to headlines about flows through strategic corridors, with observers noting that energy-inflation linkages tend to feed into broader macro expectations. A veteran market briefing noted that even moderate changes in oil prices can meaningfully influence headline inflation readings, potentially affecting the tempo of monetary policy decisions in the quarters ahead.
Against this backdrop, market research outfits highlighted potential inflationary implications. The Market Mosaic, a regular briefing from Mosaic Asset Company, stressed that oil price moves can directly affect inflation metrics, with a $10 per barrel swing historically contributing meaningfully to shifts in inflation readings. While the notes did not predict a specific outcome, they underscored the sensitivity of risk assets to energy-price shocks amid a policy backdrop that remains cautious about rate-cut horizons.
Fed stance, volatility, and the options backdrop
On the policy front, the commitment to inflation progress remained central. In the aftermath of the most recent Federal Reserve gathering, Wall Street’s takeaway was that any policy loosening would hinge on demonstrable progress toward inflation targets. The accompanying narrative from market observers suggested that rate-cut expectations were being pushed further out, with some analysts pointing to the potential for rate hikes to reemerge in 2026 should inflation prove stickier than anticipated. The evolving odds were being tracked by the CME FedWatch tool, which reflected shifting probability curves as new data filtered in.
Beyond the Fed, traders also eyed the options market in a bid to gauge near-term liquidity flows. The Kobeissi Letter noted that last week’s expiration event—described as a substantial triple-witching session for U.S. stocks and ETFs—unleashed a significant amount of capital as large options positions expired. The implication, as described by The Kobeissi Letter, is that this could unleash fresh volatility into equities and by extension into correlated risk assets, including bitcoin, in the days that followed.
In this environment, the weekend volatility gave on-chain observers a useful reminder of how market structure interacts with price moves. CryptoQuant contributors observed that weekend sessions tend to see diminished institutional participation and ETF-driven demand, elevating the role of derivatives positioning and short-term liquidity. The takeaway from CryptoQuant’s QuickTake was clear: thinner order books amplify price sensitivity, and weekend action should not be misconstrued as a trend signal.
On-chain signals: capitulation among long-term holders
On-chain analytics painted a nuanced portrait of investor behavior. CryptoQuant’s analysis focused on the SOPR metric, which compares the price at which coins are moved on-chain to their previous cost basis. Investigators highlighted that Long-Term Holder (LTH) SOPR dropped to 0.64 in early March, a read indicating that LTHs were selling at a substantial loss relative to their cost basis. As one contributor described it, readings this far below 1.0 signal meaningful capitulation among patient holders, underscoring a period of fear in the market.
Despite the near-term pain for many LTHs, the broader signal remains ambiguous. The 30-day moving average of LTH-SOPR remained below 1, suggesting that while a portion of supply was exiting exchanges, other cohorts could be quietly absorbing supply and moving coins off-chain. Analysts characterized this as a possible distribution-accumulation dynamic at play, a classic hallmark of a market transitioning through a phase of capitulation while still containing pockets of absorption that could set the stage for a future regime shift.
Closing perspective: what to watch next
As Bitcoin navigates a week shadowed by macro risks, traders will be watching the confluence of technical levels, liquidity conditions, and on-chain signals. The immediate focal point remains a sustained move beyond the 200-week EMA and a clear exit from the prevailing range, which could determine whether the path of least resistance remains lower or if a credible bounce materializes. In parallel, the trajectories of gold and oil, influenced by geopolitical developments and inflation dynamics, will help frame risk sentiment across crypto markets. Finally, the evolving policy stance from the Federal Reserve and the behavior of large derivatives positions—along with on-chain capitulation versus accumulation signals—could shape volatility in the days ahead as markets price a longer horizon for rate moves and macro resilience.

Key Highlights
- AleAnna (ANNA) shares climbed 86.8% Friday, settling at $7.07 and reaching an intraday peak of $7.70
- European natural gas prices jumped as much as 35% following attacks on critical Middle East gas infrastructure
- QatarEnergy issued warnings that strikes could eliminate nearly 20% of Qatar’s LNG export capacity for 3–5 years
- AleAnna disclosed a 47% increase in proved reserves to 25.8 billion cubic feet at the end of 2025
- The broader Nasdaq index dropped 2.01% during the session, though S&P 500 energy stocks extended gains for a 13th consecutive week
AleAnna Inc (ANNA) delivered one of Friday’s most dramatic market performances, surging 86.8% to close at $7.07. The stock touched an intraday high of $7.70, while trading volume exploded to approximately 115.4 million shares — an extraordinary figure for the Italian natural gas producer.
The dramatic move coincided with intensifying geopolitical turmoil across the Middle East. Iranian officials warned of “zero restraint” should their energy assets face additional attacks, while Israeli forces announced their military operations would concentrate on eliminating missile production and nuclear weapons-related sites.
Tensions expanded throughout the week. A drone attack ignited a blaze at Kuwait’s Mina Al Ahmadi oil refinery, intensifying worries about regional supply stability. Reports also emerged of a U.S. F-35 fighter jet being struck during operations over Iranian territory, underscoring the conflict’s expanding military scope.
European natural gas benchmark prices skyrocketed by up to 35% Thursday after attacks damaged crucial Middle Eastern gas production facilities. The European Union responded by urging member nations to reduce gas-storage requirements to 80% in an effort to maintain market equilibrium.
QatarEnergy issued stark warnings that damage to their facilities could eliminate approximately 20% of Qatari LNG shipments for a period spanning three to five years. Wood Mackenzie’s Tom Marzec-Manser projected that both European and Asian natural gas prices would “remain elevated for longer” due to these developments.
A coalition of major global powers — including the United Kingdom, France, Germany, Canada, and Japan — released a coordinated statement expressing commitment to ensuring secure navigation through the Strait of Hormuz following recent incidents that pushed energy costs higher.
What Sets AleAnna Apart
AleAnna concentrates on developing onshore natural gas assets and renewable natural gas initiatives throughout Italy. The firm generated approximately $13.9 million in revenue from Longanesi gas sales across the initial nine months of 2025, with commercial production commencing in March. Shell Energy Europe serves as the exclusive purchaser for its production allocation.
The company also delivered significant corporate updates recently. An independent evaluation conducted by DeGolyer and MacNaughton revealed a 47% boost in AleAnna’s proved reserves for year-end 2025, totaling 25.8 billion cubic feet. CEO Marco Brun characterized the figure as a “substantial increase” that enhances production forecasting confidence.
In February, Chairman Graham Van’t Hoff referenced the European Union’s strategic objective to eliminate dependence on Russian gas supplies as a “decisive policy inflection,” suggesting Italy’s domestic fields and pipeline infrastructure could provide reliable alternative supply.
Other natural gas companies experienced gains earlier in the week as well. Both Cheniere Energy and Venture Global saw upward price movement following QatarEnergy’s supply disruption alerts.
Potential Challenges Remain
AleAnna’s latest quarterly filing highlighted that future success hinges on obtaining adequate financing, complying with Italian regulatory frameworks, and advancing development activities at local field sites. The company also acknowledged deficiencies in its internal financial reporting systems.
ANNA’s Relative Strength Index approached overbought territory during Friday’s trading, indicating rapid accumulation of bullish sentiment over a compressed timeframe.
Friday’s explosive rally occurred against a backdrop of broader market weakness. The Nasdaq Composite declined 2.01% while the S&P 500 retreated 1.51%, as market participants grew anxious about inflationary pressures stemming from the Iran crisis. Nevertheless, energy sector constituents within the S&P 500 secured their 13th consecutive weekly advance.
Crypto World
Polymarket traders bet on Iran ceasefire even as oil shock concerns persist: Crypto Daybook Americas
By Omkar Godbole (All times ET unless indicated otherwise)
The Iran war has single-handedly soured the macro environment for risk-takers in financial markets, and some participants are betting it could end soon.
Onchain data tracked by Polymarket tracker PolymarketHistory shows that 10 wallets sprang to life on Sunday, wagering a cumulative $160,000 on a ceasefire by the end of March and eyeing a potential payout of over $1,000,000. The wallets have no prior transaction history and were created at the same time, raising suspicions of potential insider positioning on the outcome.
In any case, if the war ends, markets, including cryptocurrencies, could see a relief bounce.
For now, however, the conflict is in its fourth week and keeping valuations under pressure. Bitcoin held below $69,000 at the time of writing, maintaining losses from the weekend. Ether fell to $2,030, its sixth decline in seven days. XRP (XRP), solana (SOL), and others were also under pressure, while a few privacy tokens such as NIGHT and XMR stood out with gains of over 3% in the past 24 hours.
“The market is trading one theme above all others: geopolitical inflation. The weekend brought a new escalation phase, including U.S. pressure on Iran over the Strait of Hormuz and further threats to regional energy infrastructure. That has kept oil risk elevated and left investors pricing a longer period of tight financial conditions,” Timothy Misir, head of research at BRN, said in an email.
“Bitcoin still has the cleanest value-capture profile in crypto for this tape: scarce asset, improving institutional plumbing, and relative flow leadership versus the rest of the complex.,” he said.
Market flows, however, have yet to validate that view. U.S.-listed spot bitcoin ETFs registered outflows for the third straight day on Friday, alongside significant selling by large holders, or whales.
Ether, too, has seen large liquidations. A whale holding over 130,000 ETH sold 5,000 ETH ($10.31 million) at $2,063, according to Lookonchain.
In traditional markets, U.S. Treasury yields have surged to multimonth highs, signaling tighter financial conditions ahead, while futures tied to the Nasdaq 100 and S&P 500 hit their lowest levels since early November. Stay alert!
Read more: For analysis of today’s activity in altcoins and derivatives, see Crypto Markets Today
What to Watch
For a more comprehensive list of events this week, see CoinDesk’s “Crypto Week Ahead“.
- Crypto
- Macro
- March 23, 10:00 a.m.: U.S. Construction Spending MoM for January est. 0.1% (Prev. 0.3%).
- Earnings (Estimates based on FactSet data)
- March 23: BTCS Inc. (BTCS), post-market, $0.01
Token Events
For a more comprehensive list of events this week, see CoinDesk’s “Crypto Week Ahead“.
- Governance votes & calls
- Aave DAO is voting on deploying Aave V4 with a security-first initial setup, conservative risk parameters and a modular hub and spoke architecture. Voting ends March 23.
- Floki DAO is voting to rank entries from Floki’s third guerrilla marketing competition. Voting ends March 23.
- Unlocks
- Token Launches
- March 23: HTX DAO (HTX) staking launches officially
Conferences
For a more comprehensive list of events this week, see CoinDesk’s “Crypto Week Ahead“.
Market Movements
- BTC is up 3.01% from 4 p.m. ET Sunday at $71,044.86 (24hrs: +3.56%)
- ETH is up 5.07% at $2,168.32 (24hrs: +4.20%)
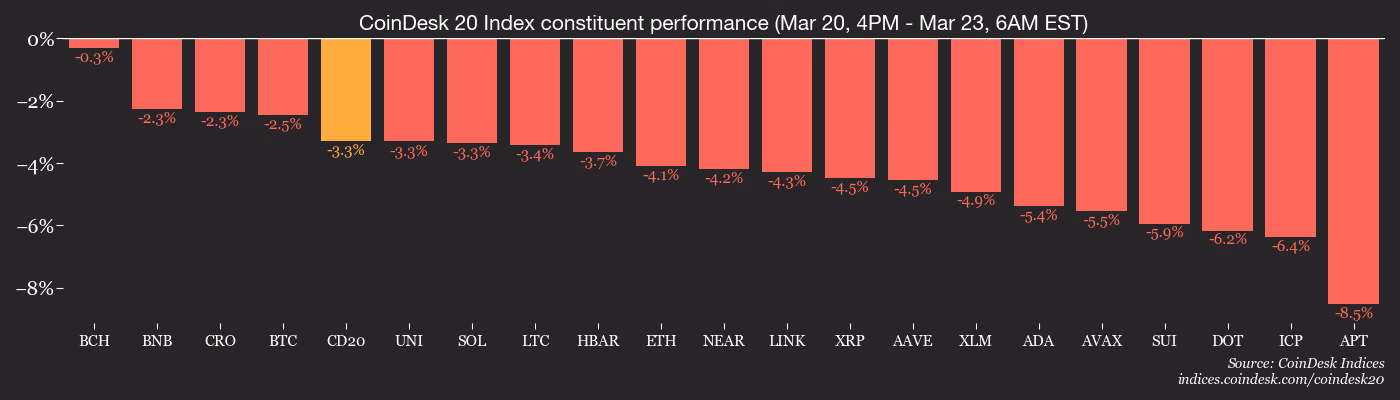
- CoinDesk 20 is up 3.05% at 2,030.41 (24hrs: 2.56%)
- Ether CESR Composite Staking Rate is up 13 bps at 2.83%
- BTC funding rate is at -0.0017% (-1.8177% annualized) on Binance

- DXY is up 0.45% at 104.30
- Gold futures are down 7.27% at $4,238.30
- Silver futures are down 8.18% at $63.69
- Nikkei 225 closed down 3.48% at 51,515.49
- Hang Seng closed down 3.54% at 24,382.47
- FTSE 100 is down 2.03% at 9,716.51
- Euro Stoxx 50 is down 2.01% at 5,390.70
- DJIA closed on Friday down 0.96% at 45,577.47
- S&P 500 closed down 1.51% at 6,506.48
- Nasdaq Composite closed down 2.01% at 21,647.61
- S&P/TSX Composite closed down 1.69% at 31,317.41
- S&P 40 Latin America closed down 1.15% at 3,150.00
- U.S. 10-Year Treasury rate is up 11 bps at 4.39%
- E-mini S&P 500 futures are up 1.03% at 6,626.75
- E-mini Nasdaq-100 futures are up 0.54% at 24,231
- E-mini Dow Jones Industrial Average futures are up 1.15% at 46,147
Bitcoin Stats
- BTC Dominance: 58.89% (0.52%)
- Ether-bitcoin ratio: 0.02989 (-1.24%)
- Hashrate (seven-day moving average): 963 EH/s
- Hashprice (spot): $32.30
- Total fees: 2.07 BTC / $142,462
- CME Futures Open Interest: 116,195 BTC
- BTC priced in gold: 16 oz.
- BTC vs gold market cap: 4.58%
Technical Analysis

- The chart shows daily swings in bitcoin’s 30-day implied (expected) volatility index, BVIV, since October.
- BVIV has bounced to 59% from 53% on Wednesday, and further gains may be in the offing.
- That’s because the 50-day simple moving average (SMA) sits well above the 200-day SMA and is trending north. It shows that the near-term trend is up.
- Heightened volatility is usually a feature of a bear market.
Crypto Equities
- Coinbase Global (COIN): closed on Friday at $197.50 (-2.67%), -2.78% at $192 in pre-market
- Galaxy Digital (GLXY): closed at $20.72 (-1.57%), -3.19% at $20.06
- MARA Holdings (MARA): closed at $8.46 (-8.24%), -3.07% at $8.20
- Riot Platforms (RIOT): closed at $13.38 (-5.37%), -4.33% at $12.80
- Core Scientific (CORZ): closed at $15.81 (-4.07%), -2.09% at $15.48
- CleanSpark (CLSK): closed at $9.40 (-4.37%), -3.19% at $9.10
- Exodus Movement (EXOD): closed at $7.38 (-4.53%)
- CoinShares Bitcoin Mining ETF (WGMI): closed at $37.68 (-3.63%)
- Circle Internet Group (CRCL): closed at $126.03 (-1.79%), -4.36% at $120.54
- Bullish (BLSH): closed at $37.97 (-4.12%), -4.40% at $36.30
Crypto Treasury Companies
- Strategy (MSTR): closed at $135.66 (-1.87%), -2.70% at $132.00
- Sharplink (SBET): closed at $7.40 (-3.65%), -4.46% at $7.07
- Strive Asset Management (ASST): closed at $10.02 (-2.34%), -3.79% at $9.64
- Upexi (UPXI): closed at $1.06 (-0.93%), -6.59% at $0.99
- Lite Strategy (LITS): closed at $1.17
ETF Flows
Spot BTC ETFs
- Daily net flows: -$52 million
- Cumulative net flows: $56.21 billion
- Total BTC holdings ~1.29 million
Spot ETH ETFs
- Daily net flows: -$42 million
- Cumulative net flows: $11.76 billion
- Total ETH holdings ~5.69 million
Source: Farside Investors
While You Were Sleeping


Crypto prices have surged on Monday on news that U.S. President Trump said to escalate attacks against Iran.
Trump said in a Truth Social post that the two countries held “very good and productive conversations regarding a complete and total resolution of our hostilities in the Middle East.”
Attacks against Iran’s infrastructure will be postponed for a five day period, Trump said in the post.
Bitcoin rebounded almost 5% above $71,000 in the early morning U.S. hours on the news after sinking below $68,000 overnight. Ether (ETH), , solana (SOL and Chainlink were up 5% over the past 24 hours as cryptocurrencies jumped across the board
Gold has nearly erased almost all its earlier losses, now down just 1% on the day and rebounding to $4,440 per ounce. The U.S. dollar index, DXY, has slipped to 99.3.
Bond yields have declined globally, with the U.S. 10 year yield falling by 100 basis points to 4.3%.
Meanwhile, WTI crude is down 11% on the day, trading below $88 per barrel, while Brent crude has dropped 8% to around $100 per barrel. Tokenized Brent crude futures saw $62.4 million in liquidations on Hyperliquid. CoinGlass data shows $62.41 million in liquidations on the XYZ:BRENTOIL contract over the past 24 hours, with $61.69 million of that hitting longs and just $717,000 from shorts.
Galaxy Digital (GLXY) is up 2%, while Coinbase (COIN) and IREN (IREN) have also gained around 2% each.
Trump’s five-day postponement doesn’t end the war, however, as Iran continues to strike targets across the Gulf.
Meanwhile, Strategy (MSTR), the largest corporate holder of bitcoin, is up more than 3% in pre-market trading.


Bitcoin (BTC) moved lower on Monday as traders reacted to new pressure from the Middle East crisis and a weaker tone across risk assets. The asset fell below $67,500 earlier in the day before recovering part of the loss, while most major altcoins also traded in the red.
Summary
- Bitcoin dropped below $67,500, hitting a two-week low as geopolitical tension triggered broader market selling.
- Ethereum, XRP, Solana, and Dogecoin fell alongside Bitcoin as risk appetite weakened across crypto markets.
- SIREN surged against the trend, posting sharp gains while the broader crypto market remained under pressure.
Bitcoin started last week on a stronger note and climbed above $76,000 on Tuesday, marking its highest level in about six weeks. That rally faded later in the week as traders reacted to the Federal Reserve’s latest policy decision and Chair Jerome Powell’s comments on inflation and uncertainty. The Fed left rates unchanged on March 18 and said inflation is likely to rise in the near term.
Selling pressure grew again over the weekend as the market focused on the Middle East conflict. Rising war risks and higher oil prices pushed investors away from risk assets, while U.S. stock futures also fell as markets assessed new threats tied to Iran and the Strait of Hormuz.
Live market data showed Bitcoin trading at $68,435 after dropping as low as $67,436 during the session. That intraday low placed the asset at its weakest level in roughly two weeks before buyers pushed it back above $68,000.
The market remains sensitive to macro news. Bitcoin fell to about $67,806 as crypto prices tracked the wider risk-off move linked to the Middle East conflict. The report said the drop came as oil prices stayed high and investors reduced exposure to volatile assets.
Major altcoins follow bitcoin lower
Ethereum (ETH) also moved down during the same period. Live market data showed ETH at $2,044 after falling to an intraday low of $2,026. XRP traded at $1.37, Solana at $85.80, and Dogecoin at $0.0898, with all of them posting daily losses.
The broad decline matched the tone across the rest of the crypto market. Reports on Monday said traders had reduced long exposure as geopolitical risk increased. That shift left several large-cap tokens under pressure and limited the rebound seen late on Sunday.
While most large tokens moved lower, SIREN continued to trade against the wider trend. CoinMarketCap data showed the BNB Chain-based token reached a record high of $3.83 on March 22 before pulling back. The same page showed the token remained far above its earlier levels despite the latest retracement.
Disclosure: This article does not represent investment advice. The content and materials featured on this page are for educational purposes only.

Gold is crashing. Equities are bleeding. Bitcoin price does not care.
BTC is trading at $68,500, up 1.5% in 24 hours while gold logs its ninth straight daily loss, dropping to around $4,360. Asian equities fell for a third consecutive session, pushing major indices toward correction territory.
Everything is selling off at once. Traditional safe havens and risk assets are getting hit simultaneously. Bitcoin is holding its ground anyway.
- BTC Stability: Bitcoin is up 1.5% daily, firmly holding the $66,000 floor that has withstood every war-driven sell-off since February 28.
- Gold Slide: Prices have collapsed to $4,360 in a nine-day losing streak, the asset’s longest consecutive decline in years.
- Asian Equities: Stocks dropped for a third session as climbing bond yields signal central banks may favor rate hikes over cuts.
Bitcoin Price Analysis: Can BTC Hold Support at $68,500?
Buyers are defending $68,500 hard.
Price has been range-bound but constructive, bouncing off the $66,000 floor that has held through the entire Iran conflict.
Losing that level and $62,000 opens up, which kills the decoupling thesis entirely. To flip the bias bullish, price needs to reclaim $70,000 and close above the range high.

Derivatives are telling an interesting story. Alexander Blume, CEO of Two Prime, says BTC derivatives have held up well given the backdrop.
His firm is positioning for higher funding rates, which means smart money is betting on an upside surprise, not a breakdown. Whales are absorbing sell pressure from short-term speculators around these exact levels.
Until $66,000 breaks, the trend is sideways to bullish.
Gold Price Nine-Day Losing Streak: What Is Driving the Slide?
Gold is in freefall.
Down to roughly $4,360, shedding around 18% from recent highs and logging its longest losing streak in years. This is not how gold is supposed to behave during a geopolitical crisis. The safe haven playbook is broken.
Rising bond yields and a strengthening dollar are driving the sell-off. War in the Middle East is escalating and gold is still dropping.
The institutional buying that fueled the earlier rally is gone. Alexander Blume points out that the move up was structural, driven by China decoupling from the dollar. That bid has evaporated as liquidity becomes the priority over safety. With the Fed now pressured to hike rather than cut to fight war-stoked inflation, the cost of holding a non-yielding asset like gold has spiked.
Bears are eyeing $4,300 next. The breakdown is confirmed until price proves otherwise.
Asian Equities and the Risk-Off Context
Asian stocks are down for a third straight session. S&P and European futures point to more losses. Risk-off sentiment is global.
Bitcoin is not following.
Crypto usually trades like a high-beta tech stock in environments like this, selling off hard and fast. Not today. BTC is holding green while everything else bleeds, and the divergence is showing up across the crypto board too.
Ether is up 2.7% to $2,059. But Solana is down 2.5% to $86.54 and Dogecoin is the worst performer among majors, down 7.4% on the week. Capital is rotating into Bitcoin and Ether. A flight to quality within crypto itself.
Every major stock market is crashing today.
Over $1.5 TRILLION wiped out till now.KOSPI -6.1%
Nikkei -4.8%
TAIEX -2.83%
Hang Seng -3.41%
SSE -2.50%
Nifty -1.26%
ASX -2.4%
STI -2.20%
NZX -1.3%
Expect more volatility as we get closer to Trump’s… pic.twitter.com/izKLGxlEai— Crypto Rover (@cryptorover) March 23, 2026
The next 24 hours have a specific catalyst. Monday evening marks the deadline on Trump’s ultimatum to hit and obliterate Iran’s power plants if the Strait of Hormuz stays closed. Brent crude is already at $113 a barrel. Goldman Sachs is calling the potential disruption the largest-ever supply shock.
Traders are watching $68,000 heading into that deadline.
Hold support through the ultimatum, and the structural breakout thesis gets validated. Drop below $66,000, and the liquidity drain has finally caught up to crypto. Neither side has clean control right now.
But compared to gold and equities, Bitcoin’s path of least resistance looks stubbornly higher.
Discover: The best new crypto in the world
The post Bitcoin Price Holds $68,500 as Gold Extends Nine-Day Slide and Asian Stocks Drop appeared first on Cryptonews.
With just over a week left in the month of March, bitcoin is narrowly on track to avoid a historic losing streak. The asset is up around 2% on the month, holding above $68,000. However, a late pullback would see bitcoin close six consecutive months in the red, matching the longest negative streak on record, last seen between August 2018 and January 2019.
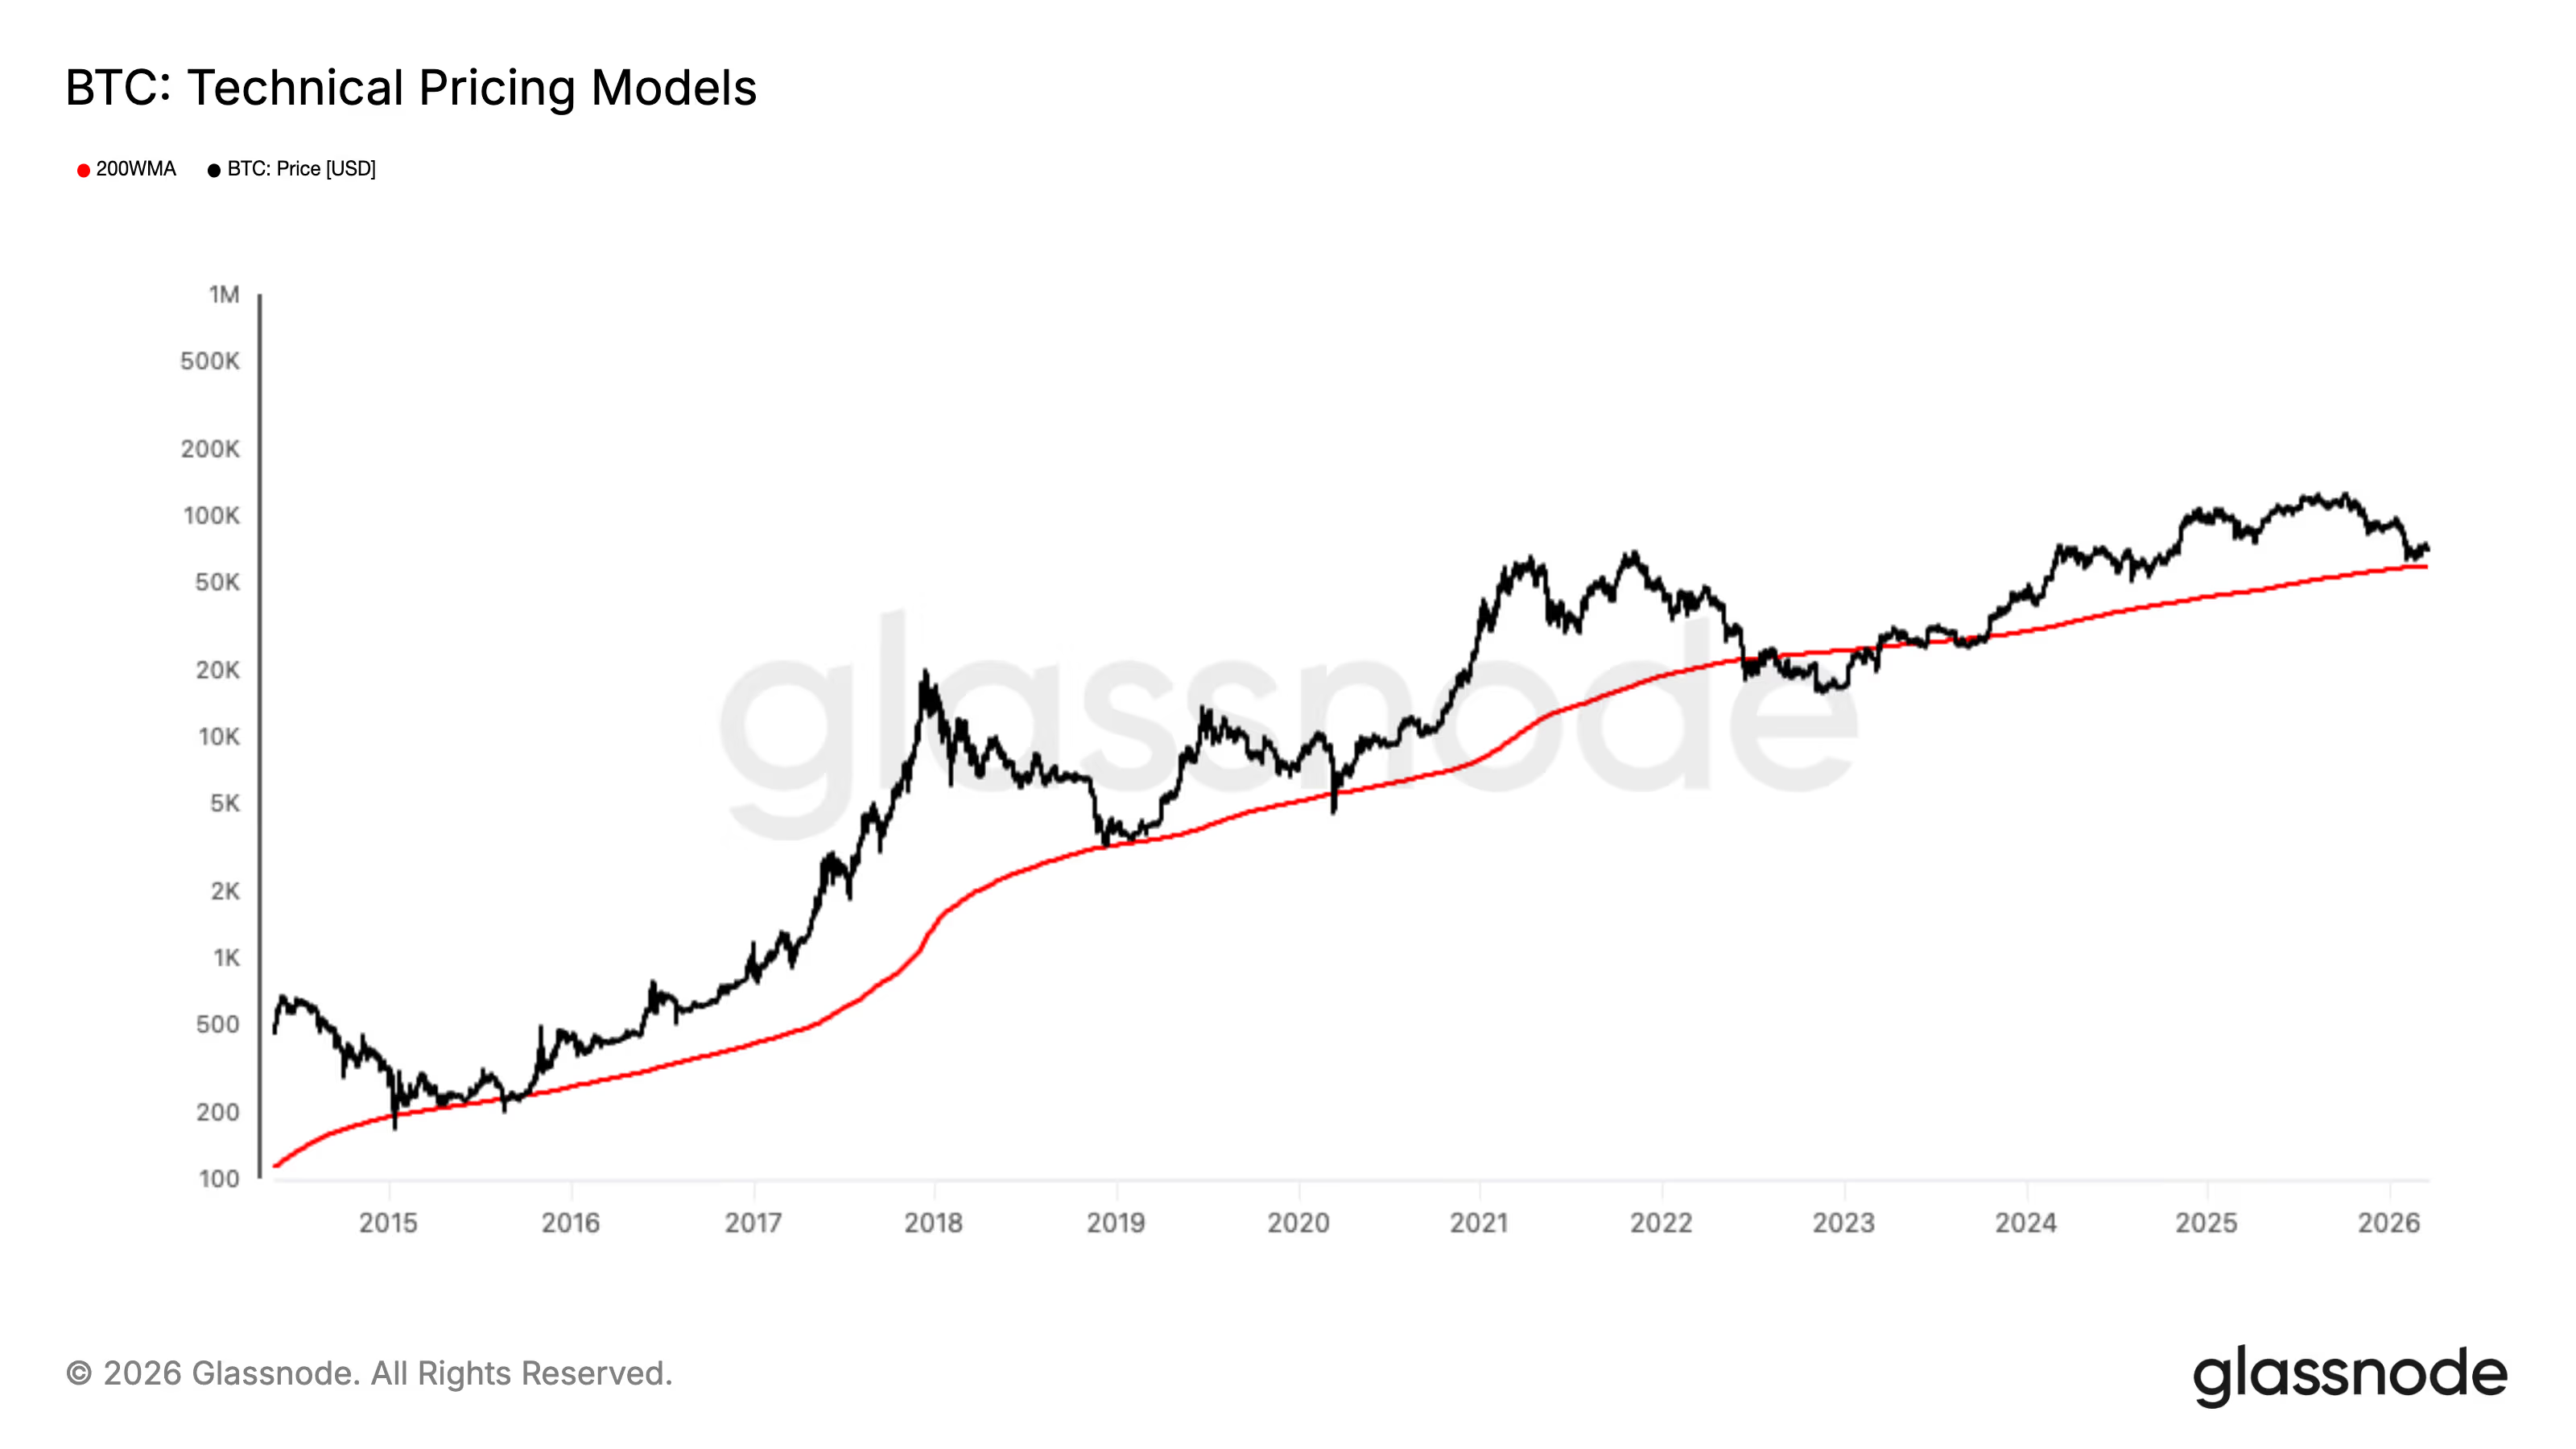
From a technical standpoint, the 200-week moving average, (200WMA), remains a key level to watch. This metric, which tracks bitcoin’s long-term trend by averaging its closing price over the past 200 weeks, has historically acted as strong support during bear markets.
In the current cycle, the 200WMA sits near $59,000. bitcoin dropped to as low as $60,000 in early February and has since consolidated above this level for nearly two months, suggesting continued strength at this key support. Notably, the 2022 bear market remains the only cycle where bitcoin spent a prolonged stretch below the 200WMA, from June through December.

Beyond USD price action, bitcoin is also beginning to show relative strength against gold. It is on track to post its first positive monthly candle versus gold in eight months, with the bitcoin to gold ratio currently around 16 ounces. Gold, meanwhile, is trading near $4,200 after recently dropping towards $4,000, 5% down on the day. Gold is now down over 25% from its January all time high, wiping out $7.5 trillion in market cap value.
Historically, each cycle has seen smaller drawdowns in the bitcoin to gold ratio from its peak. In this cycle, bitcoin declined roughly 71% against gold from its all-time high in December 2024. These peak to trough cycles have typically lasted around 400 days, suggesting the current downturn may be over denominated in this ratio.
If bitcoin can maintain support above the 200WMA while regaining strength against gold, it would reinforce the view that the broader uptrend remains intact.

Crypto World
Crypto market rattled by $400 million liquidations as bitcoin dips to $68,000: Crypto Markets Today

Bitcoin is trading near $68,250, returning to a price range that dates back to early February after multiple failed attempts to convincingly surpass $75,000.
The most recent selloff occurred on Saturday, after U.S. President Donald Trump threatened to “obliterate” Iran’s power plants unless the country opened the Strait of Hormuz within 48 hours.
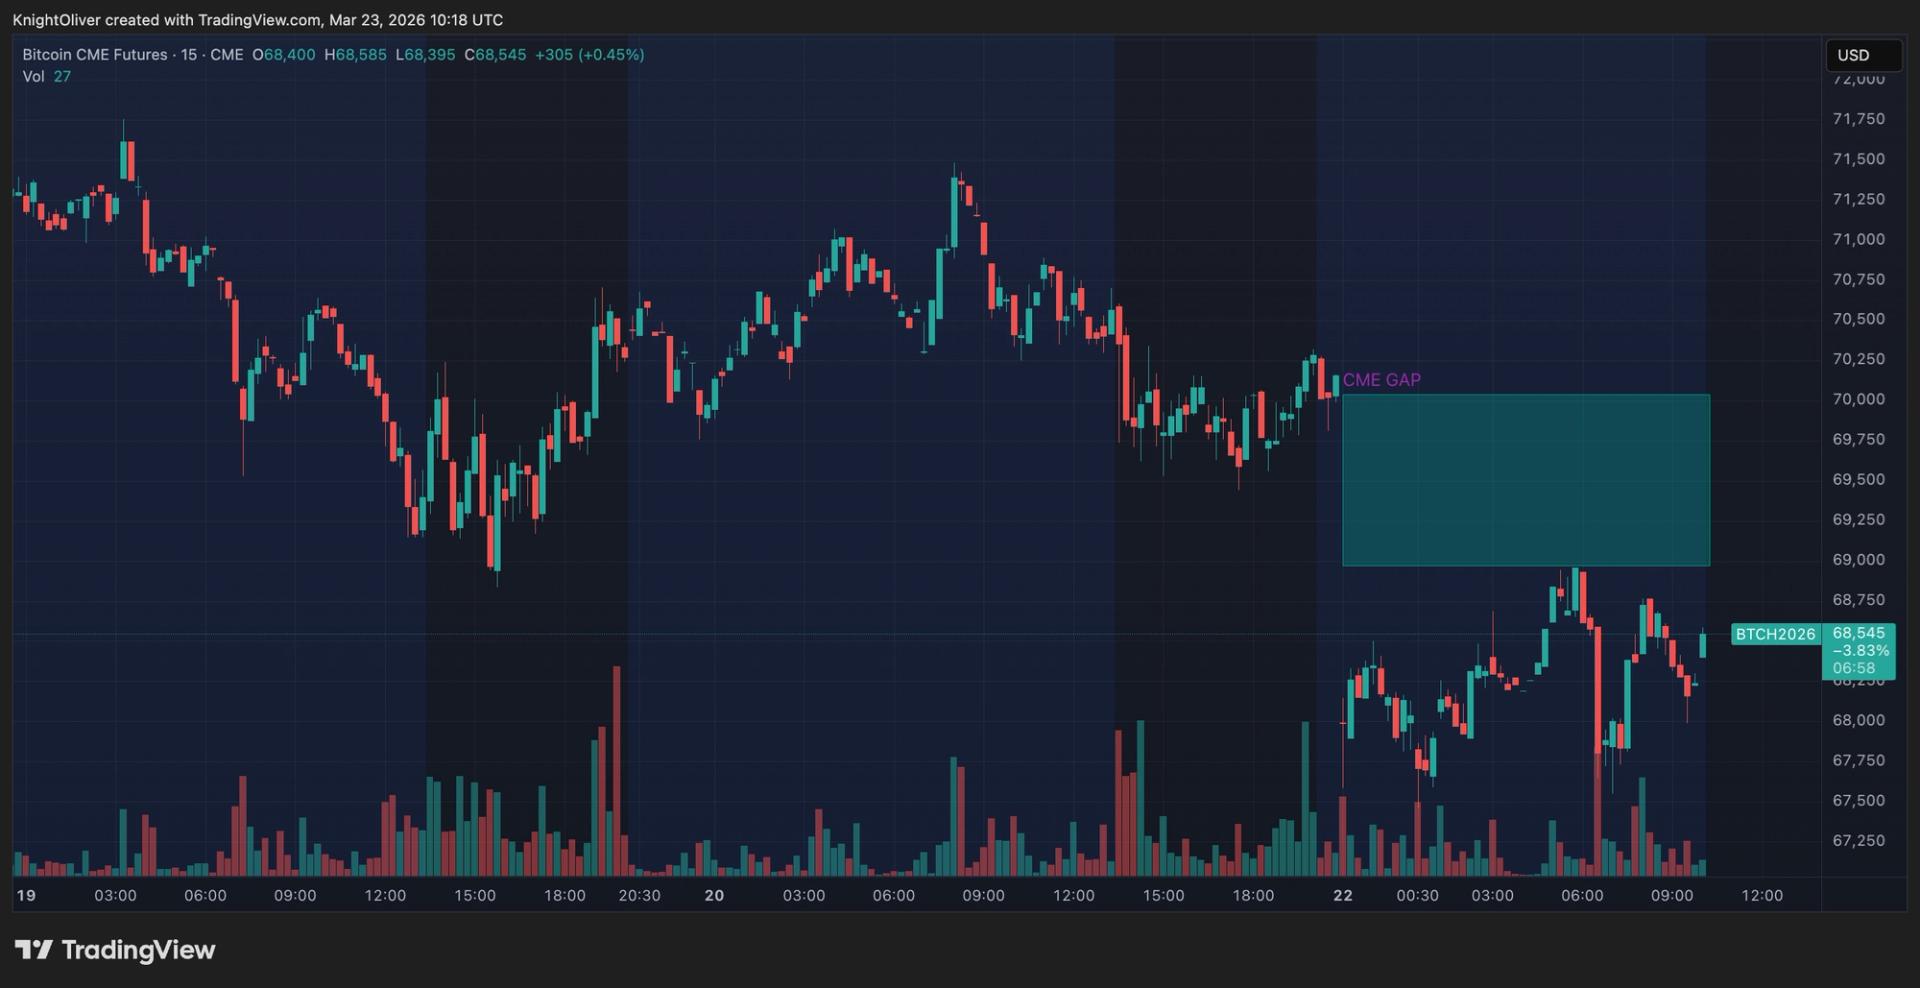
The weekend price action led to a CME gap — the difference between the price of bitcoin when futures on the exchange end the week on Friday and when they resume trading on Sunday evening. That gap would be filled if bitcoin recovers to $70,000 on Monday.
Gold and silver took another leg down on Monday with January’s record highs now seemingly confirmed as a result of speculative mania rather than a genuine safe-haven move.
In contrast, the Dollar Index (DXY) is back trading above 100, buoyed by inflation fears and a halt to the Fed’s interest-rate-cutting cycle.
The altcoin market has underperformed bitcoin since midnight UTC, with decentralized finance (DeFi) tokens ETHFI, HYPE and SKY losing around 3% while BTC is in the black after falling on Saturday and Sunday.
Derivatives positioning
- Over $400 million worth of leveraged crypto futures bets have been liquidated in the past 24 hours. More than $280 million were longs, the most since Feb. 25, a sign bullish bets have taken a sizeable hit due to bitcoin’s Sunday drop.
- Open interest (OI) in futures tied to gold token PAXG has increased 4% in 24 hours as investors pulled capital from futures on major cryptocurrencies, including BTC. Ether’s OI increased by just under 1%.
- On decentralized exchange Hyperliquid, Brent crude, WTI crude, gold and silver perpetuals rank among the top 10 perpetual contracts by open interest, surpassing major tokens such as XRP. Volume profiles show a similar bias for traditional commodities.
- Funding rates paint a mixed picture of the market sentiment. Traders seem to be chasing bearish exposure in tokens such as XRP, BNB, SOL, TRX, DOGE and ADA, as evidenced by their negative funding rates. Meanwhile, rates for BTC, BCH, HYPe, XMR, and LINK remain positive, indicating strong sentiment.
- BCH and LINK also boast a positive 24-hour cumulative volume delta. This, coupled with positive funding rates, points to sustained net buying pressure, with leveraged traders positioning for further upside in both tokens.
- BTC’s 30-day implied volatility index, BVIV, has bounced to 60% from 53% on Wednesday, indicating renewed uncertainty and fear as the Iran war drags on and major banks point to a sustained oil price rally ahead.
- Ether’s volatility index, EVIV, jumped to 84% on Sunday, the highest since early February.
- On Deribit, BTC put options are priced at a premium of eight volatility points to call options out to the June-end expiry. This indicates a strong demand for hedging against potential price declines.
- Block flows featured an outsized demand for BTC put spreads, a bearish strategy and ETH straddles, a bet on volatility.
Token talk
- CoinDesk’s DeFi Select Index (DFX) is the worst-performing benchmark on Monday, losing 0.75% since midnight UTC, while the CDMEME and SCPXC are down by around 0.4%
- Privacy tokens bucked the bearish trend, with DASH, NIGHT, and XMR all rising by 3% to 5% over the past 24 hours. The sector performed well at the tail end of 2025, buoyed by improving sentiment around anonymous transactions and improved regulatory clarity.
- CoinMarketCap’s “Altcoin Season” index is at 49/100, receding slightly from last week’s high of 53, but substantially higher than last month, when it dipped to 22.
- One reason to be optimistic is the average relative strength index (RSI), which is currently in “oversold” territory, suggesting a bounce for several altcoins could be on the cards this week.

Key Points
- Mark Zuckerberg is creating a personal AI executive assistant to streamline information access and minimize reliance on middle management
- The AI system is currently operational in its early stages and aims to flatten organizational hierarchies
- Meta is deploying enterprise AI solutions across its approximately 78,000 employees, featuring MyClaw and Second Brain (powered by Anthropic’s Claude)
- META shares started trading at $593.66, declining roughly 2.1%, notwithstanding impressive Q4 results (EPS $8.88 versus $8.16 forecast, revenue increased 23.8% YoY)
- Executive stock sales persist, with COO Javier Oliván and Director Robert Kimmitt both offloading shares on March 16th at approximately $632
Mark Zuckerberg is constructing an artificial intelligence assistant designed to support his leadership at Meta — and this isn’t speculative fiction. The Wall Street Journal disclosed this past Sunday that Meta’s chief executive is actively utilizing a preliminary version of this system to access company information more efficiently, eliminating the requirement for multiple staff layers to fulfill such requests.
This AI assistant represents a component of Meta’s comprehensive initiative to integrate agentic artificial intelligence throughout its entire organizational structure. Far from being an isolated trial, this development embodies a company-wide transformation that Zuckerberg has been signaling for more than twelve months.
During Meta’s January quarterly earnings conference call, Zuckerberg identified 2026 as the pivotal year when artificial intelligence would begin substantially transforming the company’s internal operations. This executive AI assistant directly implements that strategic vision.
The system enables Zuckerberg to obtain internal company data more rapidly without channeling requests through numerous departments. Initial implementation indicates it’s already accelerating executive-level decision-making processes.
Meta’s workforce of approximately 78,000 employees is simultaneously gaining access to novel AI-powered tools. MyClaw provides staff members with entry to internal documentation, communication histories, and collaboration platforms, while also facilitating connections with AI agents or human colleagues.
Another application, designated Second Brain, was developed utilizing Anthropic’s Claude. This tool operates as an artificial intelligence executive assistant for staff members — assisting with task organization and rapidly surfacing pertinent information.
AI Systems Designed to Reduce Organizational Hierarchy
The underlying strategy focuses on achieving greater productivity with reduced administrative overhead. Meta aims to function more similarly to AI-first startup companies, which typically maintain leaner operational structures than established technology corporations.
By equipping individual contributors with AI-powered tools, Meta seeks to minimize the coordination stages between conceptualization and implementation. Reducing handoff points inherently decreases the personnel required to oversee those transitions.
This approach aligns with Zuckerberg’s earlier articulated objective of reducing team hierarchies. The executive AI assistant arguably represents the most prominent manifestation of this philosophy being implemented at the organization’s highest levels.
Despite considerable internal progress on artificial intelligence initiatives, META stock began Monday’s session at $593.66, declining approximately 2.1%. The shares are trading substantially beneath their 50-day moving average of $649.23 and their 200-day average of $672.42.
This decline occurred despite exceptional Q4 financial performance. Meta delivered EPS of $8.88, surpassing the $8.16 analyst consensus by $0.72. Revenue reached $59.89 billion, representing a 23.8% year-over-year increase.
Executive Stock Sales Create Additional Headwinds
Portion of the stock pressure may be attributable to insider transaction activity. On March 16th, COO Javier Oliván divested 926 shares at $632.02, decreasing his position by 6.1%. Director Robert Kimmitt sold 580 shares on the identical date at the same price point, reducing his holdings by 11.58%.
Throughout the preceding three months, company insiders have collectively sold $103.4 million in stock. This represents a significant overhang for shares already trading beneath their moving averages.
Wall Street analyst perspective remains predominantly optimistic. The consensus price target stands at $846.63, supported by 39 buy recommendations and merely 7 hold ratings. Evercore recently elevated its target to $900, while both Guggenheim and Mizuho adjusted their targets to $850.
QP Wealth Management LLC additionally revealed a fresh position comprising 6,103 shares valued at approximately $4 million, establishing META as its seventh-largest holding representing 3.6% of the portfolio.
The stock maintains a 52-week trading range between $479.80 and $796.25, and currently trades at a P/E ratio of 25.26 with a market capitalization of roughly $1.50 trillion.

Best water flossers 2026, tried and tested
Nifty Bank cracks 3% to 11-month low as SBI, HDFC & Union Bank tumble. More pain ahead?

Here’s why SIREN memecoin is up 89% today


-

 Fashion3 days ago
Weekend Open Thread: Adidas – Corporette.com
-
 Crypto World3 days ago
NIO (NIO) Stock Plunges 6.5% as Shelf Registration Sparks Dilution Worries
-

 Politics3 days ago
Jenni Murray, Long-Serving Woman’s Hour Presenter, Dies Aged 75
-
 Tech6 days ago
Are Split Spacebars the Next Big Gaming Keyboard Trend?
-

 Crypto World2 days ago
Best Crypto to Buy Now: Strategy Just Spent $1.57 Billion on Bitcoin During Fear While Early Investors Quietly Enter Pepeto for 150x Potential
-

 News Videos5 days ago
RBA board divided on rate cut, unusually buoyant share market | Finance Report | ABC NEWS
-

 Crypto World2 days ago
Bitcoin Price News: Bhutan Sells $72 Million in BTC Under Fiscal Pressure, but the Smart Money Entering Pepeto Sees What the Market Does Not
-

 Business7 days ago
How the UK and China Trade Agreement Could Shape UK Businesses in 2026
-

 Politics5 days ago
The House | The new register to protect children from their abusers shows Parliament at its best
-

 Tech3 days ago
inKONBINI Lets You Spend Summer Days Behind the Register
-
 Politics6 days ago
Real-time pollution monitoring calls after boy nearly dies
-

 Crypto World5 days ago
Canada’s FINTRAC revokes registrations of 23 crypto MSBs in AML crackdown
-
 NewsBeat5 days ago
Residents in North Lanarkshire reminded to register to vote in Scottish Parliament Election
-

 Business7 days ago
Meta planning major layoffs as AI spending and automation reshape workforce
-

 News Videos5 days ago
PARLIAMENT OF MALAWI – PAC MEETING WITH REGISTRAR OF FINANCIAL ON AMARYLLIS HOTEL – INQUIRY LIVE
-

 Business20 hours ago
No Winner in March 21 Drawing as Prize Rolls to $133 Million for Next
-

 Politics4 days ago
Gender equality discussions at UN face pushbacks and US resistance
-

 Business5 days ago
Who Was Alex Pretti? 5 Key Facts About the ICU Nurse Killed by Federal Agents in Minneapolis
-

 Tech15 hours ago
Give Your Phone a Huge (and Free) Upgrade by Switching to Another Keyboard
-
Sports4 days ago
Vikings Free Agency Enters Phase 2 with Key Questions
You must be logged in to post a comment Login