

Crypto World
MNT price prediction as Mantle DeFi TVL surpasses that of Sui


- Mantle’s DeFi TVL surges, surpassing major rival networks.
- Mantle (MNT) price lags despite strong ecosystem growth.
- The key MNT price levels to watch are the $0.75 resistance and the $0.65 support.
Mantle (MNT) network’s DeFi ecosystem has expanded rapidly and overtaken Sui in total value locked (TVL).
The milestone reflects a sharp increase in capital flowing into Mantle, even as broader market conditions remain uncertain.
In just one month, Mantle’s ecosystem has recorded a significant surge in locked assets, signalling rising confidence from both users and developers.
According to data obtained from DeFiLlama, Mantle’s total value locked in DeFi is currently valued at around $632.17 million, while that of Sui stands at $589.5 million.

This kind of growth is rarely accidental and often points to deeper structural strength within a network.
Mantle’s DeFi expansion
The surge in Mantle’s DeFi activity has been driven by a combination of strategic positioning and ecosystem development.
One major factor behind the growth is its focus on real-world assets, which continues to attract institutional interest.
By integrating traditional financial instruments into blockchain systems, Mantle is positioning itself for long-term adoption rather than short-term speculation.
Another key driver is its connection to centralised exchange infrastructure, which helps onboard liquidity more efficiently.
This hybrid model allows users to move seamlessly between centralised and decentralised finance, reducing friction that often limits adoption.
At the same time, integrations with major DeFi protocols have boosted activity across lending and borrowing markets.
These developments have helped create a steady inflow of capital rather than relying on temporary incentives.
Such consistency is often a sign of a maturing ecosystem rather than a hype-driven spike.
Despite this strong growth, the price of MNT has not followed the same upward trajectory.
This divergence between fundamentals and price action is becoming increasingly noticeable.
MNT price struggles to reflect strong fundamentals
While the network’s DeFi metrics continue to improve, MNT remains significantly below its previous highs.
The token is still trading far from its peak, reflecting broader weakness across the altcoin market.
Short-term price action has also been mixed, with recent declines interrupting what appeared to be a recovery phase.
This suggests that traders are still cautious, even in the face of improving fundamentals.
Market sentiment continues to play a dominant role, especially with altcoins reacting closely to movements in Bitcoin.
Without a strong catalyst, MNT has struggled to build sustained upward momentum.
This creates a situation where the asset shows promise on paper but remains technically fragile.
Such conditions often lead to periods of consolidation before a clearer trend emerges.
Mantle price forecast
The near-term outlook for MNT is defined by a tight range that is likely to determine the next major move.
The $0.75 level stands out as the most important resistance zone, acting as a barrier that bulls have yet to overcome.

A confirmed move above this level would signal a shift in short-term momentum and could open the door for further upside towards $0.8642 and even $0.9223 as projected by CoinLore.
On the downside, the $0.65 level is providing immediate support and remains critical for maintaining stability.
A break below this support would reinforce the current bearish structure and increase the risk of further declines.
For now, the price remains trapped between these two levels, creating a clear decision zone for traders.
Until a breakout or breakdown occurs, the current bounce should be treated with caution.
If buyers manage to push the price above resistance, it could mark the beginning of a recovery phase supported by strong fundamentals.
However, failure to hold support would likely confirm that bearish pressure is still dominant in the short term.

The Memo Everyone Missed the Point of
Brian Armstrong sent a 6:55 a.m. email on May 7, 2026. Coinbase would cut roughly 700 employees—14% of its 4,951-person workforce.
The headline: “Coinbase Cuts Jobs Because Of AI Efficiency.”
The actual story buried in the data: Coinbase doesn’t have enough work to justify its current staff size.
Let me explain why this matters, and why it signals something much bigger than a single company’s restructuring.
What the Memo Actually Says
Armstrong’s language is revealing. Read between the lines:
“Engineers using AI tools are now able to complete projects in days that previously took teams weeks to finish.”
Translation: We can do the same work with fewer people.
“We want to experiment with ‘one person teams’ where engineers, designers, and product managers could eventually be consolidated into a single role.”
Translation: We’re going to find out exactly how understaffed we can run without completely breaking.
“Coinbase must become lean, fast, and AI-native.”
Translation: We overhired during the bull market. Now we need to right-size.
Here’s the thing: none of this is wrong. AI does increase productivity. Smaller teams can move faster. That’s all real.
But here’s what Armstrong doesn’t say—and what the market is starting to understand: Coinbase doesn’t have enough business to justify even a “lean” version of what it was.
The Pattern Nobody’s Talking About
Coinbase isn’t alone. But look at who’s cutting and why:
- Meta: 8,000 jobs cut (10% of workforce). Said they’re redirecting from metaverse to AI.
- Amazon: Multiple rounds of cuts through 2025-2026. Said they’re reducing “bureaucracy.”
- Oracle: Thousands slashed. Said they’re focusing on AI cloud computing.
- Block: Significant layoffs. Said they’re prioritizing AI.
Everyone’s saying the same thing: AI productivity gains require fewer people.
And technically, that’s true.
But there’s a pattern underneath this that nobody wants to name: These companies massively overhired during boom cycles and are now right-sizing during slowdowns.
For Coinbase specifically, this is critical. Because Coinbase’s business model is built on a single thing: trading volume volatility.
Why Coinbase Exists
Let’s be clear about what Coinbase actually is.
Coinbase is not a bank. It’s not a technology company. It’s not a financial services firm.
Coinbase is a trading exchange that profits from volatility.
When Bitcoin crashes from $100,000 to $70,000 overnight, retail traders panic-sell. Coinbase captures trading fees on every transaction. The more volatile the market, the more fees Coinbase makes.
This is why Coinbase thrived during crypto’s boom cycles:
- 2017: Bitcoin volatility = insane trading volume = Coinbase makes fortune
- 2021: Crypto mania = constant panic trading = Coinbase makes another fortune
- 2024-2025: Bitcoin ATHs = traders FOMO buying = Coinbase profits
But here’s the problem.
What Actually Changed
In my last piece, I wrote about how crypto went mainstream in 2025. JPMorgan launched Bitcoin products. BlackRock manages $175 billion in crypto ETFs. Stablecoins settled $46 trillion annually.
The market integrated. The volatility dampened. The panic trading disappeared.
When JPMorgan offers Bitcoin to their wealth clients, those clients aren’t panic-selling when Bitcoin drops 10%. They’re holding. They’re diversifying. They’re boring.
When BlackRock offers Bitcoin ETFs, retail traders stop FOMO buying at ATHs. Institutional capital means stability. Stability means fewer trading spikes. Fewer spikes means fewer fees.
Coinbase’s business model depends on retail panic. Mainstream adoption eliminates retail panic.
So what happens? Coinbase doesn’t need 700 traders managing order flows. It doesn’t need massive operations teams processing volatility spikes. It doesn’t need the infrastructure it built for a market that no longer exists.
Hence the 14% cut.
It’s not because AI made people more productive. It’s because there’s 14% less work to do.
The Math Armstrong Won’t Say Out Loud
Coinbase employed 4,951 people at the end of 2025.
In a bull market with crazy volatility, you need:
- Massive trading infrastructure (engineers, ops)
- Customer support for panicked retail traders
- Risk management teams hedging volatility
- Product teams building features to capture trading activity
But when the market stabilizes—when institutional adoption means predictable, boring returns—you need:
- Basic trading infrastructure (fewer engineers)
- Light customer support (most queries auto-resolved)
- Simple risk management (less to hedge)
- Minimal product work (it already exists)
A leaner Coinbase isn’t an AI innovation. It’s a company restructuring to match the work that actually exists.
And if Coinbase needs to cut 14% of its workforce to match current market conditions, that’s a massive signal about what’s actually happening in crypto.
What This Signals About Crypto’s Future
Here’s what the Coinbase layoffs actually mean:
1. Retail trading volume has collapsed.
If Coinbase could still make money on retail panic trading, they wouldn’t cut operations staff. The fact that they’re cutting means the volatility-driven fee model is broken.
2. Institutional adoption killed volatility.
When JPMorgan and BlackRock control the market, stability is the feature, not a bug. Retail traders are a rounding error. And retail traders are what Coinbase built its business around.
3. Crypto as a speculative asset is over.
The era where you could make 10x by trading crypto volatility is finished. Institutional adoption priced out the explosive upside. Now crypto is just… an asset class. With stable returns. Boring returns.
4. The companies that profited from crypto chaos are now in trouble.
Coinbase made its fortune during volatility. Now that the market has stabilized, Coinbase is bleeding value. The same will be true for every company built on the premise of crypto chaos.
Who Actually Won
JPMorgan won. BlackRock won. The institutions that integrated crypto into their platforms won.
They get the upside of blockchain technology without the operational chaos. They get stable assets without the volatility. They get to offer crypto to their clients as a diversification tool, not a speculation vehicle.
Coinbase lost. Not because their technology is bad. But because they built their business for a market that no longer exists.
The crypto market didn’t die. It just stopped being volatile enough to support a company built on volatility.
The Uncomfortable Implication
If Coinbase, the largest crypto exchange in America, the most professional crypto company ever built, needs to cut 14% of its staff because the market has stabilized…
What does that say about crypto’s future?
It says that the explosive growth phase is over. The speculation phase is finished. The era of life-changing returns from pure volatility is done.
What’s left is an asset class that’s integrated into institutional portfolios. Stable. Predictable. Boring.
Coinbase built an empire on exciting crypto. Now that crypto is boring, Coinbase is worth less.
That’s not an AI story. That’s a market maturation story.
And it’s actually the most important story in crypto right now.
What Comes Next
Coinbase will survive. They’ll become a boring financial services company. They’ll process crypto trades the way Fidelity processes stock trades. They’ll make steady, predictable money. They’ll never be worth $100 billion again.
Other exchanges will do the same. Kraken. Gemini. Everybody built for volatility is now right-sizing for stability.
The real question is: what happens to all the capital that used to flow into crypto speculation?
It doesn’t disappear. It flows somewhere else. It flows to the next volatile frontier. The next place where you can make 100x because nobody knows what they’re doing yet.
For a while, that was crypto. Now it’s something else.
And every major tech company’s layoffs are signaling the same thing: we built infrastructure for a world that existed. Now we’re restructuring for the world that actually exists.
The companies that survive are the ones that adapted fastest. The ones that recognized the world changed.
Coinbase didn’t adapt fast enough. Hence the 700 job cuts.
But the real story isn’t about Coinbase. It’s about what the cuts signal about the market as a whole.
Crypto went mainstream. Mainstream means stability. Stability means the era of 700-person trading operations is over.
And that’s the actual story Armstrong’s memo is trying to hide.
Does this change how you think about where crypto goes next? Drop your thoughts—but make them grounded in what you actually see in the market, not hype.
Key points:
- Bitcoin is struggling to rise above $84,000, but the bulls remain in control as long as the price remains above the 20-day EMA.
- Several major altcoins have pulled back, indicating that the bears remain sellers on rallies.
Bitcoin (BTC) has pulled back at the start of the week, but the bulls are trying to maintain the price above $81,500. Crypto sentiment platform Santiment said in a recent report that the current ratio of bullish to bearish comments on social media is 1.5:1. That suggests the current up move may not have much legs, as rallies supported by a confident crowd tend to fizzle out faster than those amid growing skepticism.
A negative sign for BTC is that it is facing rejection at the 200-day exponential moving average ($82,039). Since November 2025, every rejection at the 200-day EMA has been followed by sharp drawdowns of between 25% and 36%. If history repeats itself, BTC may see a 30% drawdown toward $56,000.

Crypto market data daily view. Source: TradingView
However, it is not all gloom and doom for the bulls. US spot BTC exchange-traded funds have recorded six consecutive weeks of net inflows, the longest such streak since August 2025. That suggests investors anticipate the recovery to continue.
Could BTC and the major altcoins stage a turnaround? Let’s analyze the charts of the top 10 cryptocurrencies to find out.
S&P 500 Index price prediction
The S&P 500 Index (SPX) continued its uptrend, rising to a new all-time high of 7,423 at the time of writing the article on Monday. That shows the bulls are firmly in command.

SPX daily chart. Source: Cointelegraph/TradingView
A minor risk to the continuation of the uptrend is the overbought level on the relative strength index (RSI). That suggests the markets have run up sharply in the near term and may enter a consolidation or correction.
The support to watch out for on the downside is the 20-day EMA (7,169). If the price rebounds off the 20-day EMA with force, it signals that the uptrend remains intact.
The first sign of weakness will be a close below the 20-day EMA. That clears the path for a drop to the 7,002 level.
US Dollar Index price prediction
The US Dollar Index (DXY) failing to rise above the 20-day EMA (98.40) suggests that bears continue to exert pressure.

DXY daily chart. Source: Cointelegraph/TradingView
Sellers will attempt to strengthen their position by pulling the price below the 97.74 level. If they succeed, the index may slump toward the 96.21 support. That suggests the index may extend its stay inside the 95.55 to 100.54 range for some more time.
Buyers will have to drive the price above the 50-day simple moving average (99) to signal a comeback. The index may then attempt a rally to the stiff overhead resistance at 100.54. Buyers will have to overcome the barrier at 100.54 to signal the start of a new uptrend.
Bitcoin price prediction
Buyers once again failed to propel BTC above $84,000, indicating that bears have not given up and remain active at higher levels.

BTC/USDT daily chart. Source: Cointelegraph/TradingView
The pullback is expected to find support at the 20-day EMA ($78,852). If that happens, the bulls will again attempt to overcome the $84,000 barrier. If they can pull it off, the BTC/USDT pair may ascend to $92,000 and subsequently to $97,924. Such a move suggests that the BTC price may have bottomed out at $60,000.
On the contrary, if the price continues lower and breaks below the 20-day EMA, it signals profit-booking by short-term buyers. The pair may tumble toward the 50-day SMA ($74,191) and then toward the support line.
Ether price prediction
Ether (ETH) is struggling to rise to the $2,465 overhead resistance, indicating a lack of demand at higher levels.

ETH/USDT daily chart. Source: Cointelegraph/TradingView
Sellers will attempt to take advantage of the situation and pull the ETH price below the moving averages. If they do that, the ETH/USDT pair may slump to the support line of the ascending channel pattern.
Conversely, if the price moves sharply above the moving averages, it signals demand at lower levels. That increases the likelihood of a break above the $2,465 level. The pair may then reach the resistance line. Buyers will be back in the driver’s seat on a close above the resistance line.
XRP price prediction
XRP (XRP) turned down from the downtrend line on Monday, indicating that bears are attempting to keep the price within the descending channel.

XRP/USDT daily chart. Source: Cointelegraph/TradingView
However, the long tail on the candlestick shows buying on dips. If the XRP price turns up from the current level or the moving averages, the prospects of a break above the downtrend line increase. The XRP/USDT pair may then rally to the $1.61 resistance. Sellers are expected to defend the $1.61 level with all their might, as a close above it signals a potential trend change. The pair may then march to $2.
Conversely, a break below the moving averages may pull the pair to the $1.27 support. This is a vital level to watch, as a drop below $1.27 could sink the pair to $1.11.
BNB price prediction
BNB (BNB) has turned down from $666, indicating that the bears are vigorously defending the $687 resistance.

BNB/USDT daily chart. Source: Cointelegraph/TradingView
The 20-day EMA ($635) is the crucial support to watch out for on the downside. If the price turns up from the 20-day EMA, the bulls will again attempt to thrust the BNB/USDT pair above the $687 level. If they succeed, the BNB price may surge to $730 and then to $790.
Sellers are likely to have other plans. They will strive to pull the price below the moving averages, keeping the pair inside the $570 to $687 range for a few more days.
Solana price prediction
Solana (SOL) reached near the $98 overhead resistance on Sunday, where the bears are mounting a solid defense.

SOL/USDT daily chart. Source: Cointelegraph/TradingView
If the SOL price moves above the 20-day EMA ($88), it signals positive sentiment. The bulls will then attempt to clear the $98 hurdle again. If they can pull it off, the SOL/USDT pair may soar to $117. There is resistance at $106, but it is likely to be crossed.
This positive view will be invalidated in the near term if the price turns down and breaks below the moving averages. That suggests the pair may continue to oscillate between $76 and $98 for some more time.
Related: XRP metrics line up bull signals for ‘full-scale rally’ to $2
Dogecoin price prediction
Dogecoin (DOGE) bounced off the 20-day EMA ($0.10) on Sunday, but the bulls are struggling to sustain the higher levels.

DOGE/USDT daily chart. Source: Cointelegraph/TradingView
The bears will attempt to pull the price below the 20-day EMA. If they manage to do that, the DOGE/USDT pair may remain within the $0.09-$0.12 range for a while longer.
The next trending move is expected to begin on a close above $0.12 or below $0.09. If bulls drive DOGE above the $0.12 resistance, the pair may rally to $0.14, then to $0.16. Alternatively, a close below the $0.09 support opens the door to a drop to $0.08, then $0.06.
Hyperliquid price prediction
Hyperliquid (HYPE) once again turned down from the $43.76 to $45.77 zone, indicating that the bears are aggressively defending the zone.

HYPE/USDT daily chart. Source: Cointelegraph/TradingView
The 50-day SMA ($40.50) is the critical support to watch out for on the downside. If the HYPE price breaks below the 50-day SMA, the correction may deepen to $38.70 and then to $35.75. Such a move suggests that the HYPE/USDT pair may have topped out in the short term.
Buyers will have to push the price above the overhead zone to signal the resumption of the uptrend. The pair may then skyrocket to $50 and later to $51.43.
Cardano price prediction
Cardano (ADA) has been consolidating between $0.31 and $0.22, indicating a balance between supply and demand.

ADA/USDT daily chart. Source: Cointelegraph/TradingView
The 20-day EMA ($0.26) is likely to act as support on the way down. If the ADA price rebounds off the 20-day EMA, the possibility of a rally to $0.31 increases. A new uptrend may begin if bulls conquer the $0.31 level.
Instead, if the ADA/USDT pair turns down from the current level or the overhead resistance and breaks below the moving averages, it suggests that the range-bound action may extend for a few more days.
The American Bankers Association is intensifying its lobbying push as the Senate Banking Committee moves toward markup of crypto legislation this week. The association warns that the CLARITY Act’s proposed stablecoin framework could incentivize consumers to shift deposits away from traditional banks to non-bank crypto issuers.
In a Sunday message to member bank CEOs shared on social media, ABA President and CEO Rob Nichols said the current version of the CLARITY Act does not adequately prevent crypto companies from offering interest-like rewards tied to payment stablecoins. He urged bankers to contact senators and rally employees to press for changes before Thursday’s committee markup, characterizing the issue as an “urgent advocacy fight” for the banking industry.
“The legislation would permit stablecoin issuers and associated business partners to pay interest or interest-like incentives to stablecoin holders,” Nichols cautioned, adding that such a provision could create “a digital asset loophole” that would facilitate deposits moving outside the traditional banking system. The ABA said it has been “working hard behind the scenes for months” on this issue and warned that allowing non-bank stablecoin issuers to offer yield-like incentives could threaten economic growth and financial stability.
The lobbying emphasis follows a May 8 letter from the ABA and other major U.S. banking associations urging Senate lawmakers to tighten the bill’s stablecoin yield restrictions, arguing that the current language still permits structures capable of drawing deposits away from banks.
Related coverage from Cointelegraph notes that the CLARITY Act markup has become a focal point in debates over how to regulate stablecoins and their potential yield mechanisms, with lawmakers and industry participants weighing the trade-offs between financial innovation and institutional resilience.
Key takeaways
- The ABA is pressing for stronger stablecoin yield restrictions in the CLARITY Act ahead of the Senate Banking Committee markup, warning of potential deposit outflows from banks.
- The central dispute concerns whether the act’s language could allow interest-like rewards to be paid to stablecoin holders by issuers or affiliates, constituting a “digital asset loophole.”
- Lawmakers previously sought a compromise that would bar yield for simple holding while permitting rewards tied to bona fide activities; however, banking groups contend the revised provisions still fall short.
- Public sentiment and market expectations around broader crypto legislation show mixed signals, with polls indicating notable cross-partisan interest and evolving political risk assessments.
Regulatory chessboard: CLARITY Act and the debate over stablecoin yields
The CLARITY Act is framed as a comprehensive federal framework for digital assets and is slated for a Senate Banking Committee vote on May 14. Its treatment of stablecoins—specifically whether they can yield interest or yield-like incentives—has ignited a sustained dispute between the banking sector and crypto firms. The ABA’s push aligns with a long-running critique that current draft language could enable non-bank issuers to attract deposits through yield, undermining traditional banking models and potentially destabilizing funding channels for banks.
Earlier in the year, the industry-wide tension around yield provisions drew notable comments from both sides of the aisle. The ABA criticized a White House report that downplayed the impact of banning stablecoin yield on lending, while Bank of America chief executive Brian Moynihan warned that without careful guardrails, large-scale shifts of assets could occur—an estimate some analysts and industry participants monitor closely for systemic risk implications. Crypto executives have, in turn, argued that interest-bearing stablecoins and related products play a role in a more diversified, innovation-forward financial system and that blanket prohibitions could hamper legitimate use cases.
Stakeholder positions and policy developments
In the ongoing policy dialog, lawmakers attempted a compromise by publishing updated stablecoin yield provisions that would prohibit crypto firms from offering interest or yield solely for holding payment stablecoins, while still allowing rewards tied to bona fide activities. Banking groups have argued that the revised language does not go far enough to prevent yield-based incentives that could entice users to move out of the banking system, urging further tightening before passage.
The regulatory debate occurs against a broader backdrop of U.S. regulatory and policy considerations, including ongoing discussions about how federal oversight should intersect with state-level licensing regimes and international standards. The CLARITY Act’s fate is also studied through the lens of cross-border policy alignment, where Europe’s MiCA framework and U.S. regulatory posture could influence future compliance and interoperability decisions for crypto firms with banking partners and financial institutions.
Public sentiment and market expectations
Public opinion on crypto regulation has shown signs of strengthening bipartisan interest. A HarrisX survey of 2,008 registered U.S. voters found 52% expressing support for the CLARITY Act, with 47% indicating they would consider voting across party lines for candidates who backed the legislation. Separately, Polymarket—a prediction market—placed the probability of the CLARITY Act becoming law by year-end at about 65%, a notable uptick from earlier in the year. Market participants have placed more than six figures of bets on the outcome, underscoring the political and regulatory significance of the legislation for the industry.
Within industry circles, the dynamic remains highly policy-driven rather than market-driven. Coinbase chief executive Brian Armstrong has been a vocal critic of banking industry positions, arguing that banks have historically offered near-zero yields on customer deposits while opposing yield-bearing stablecoin products. The tension reflects deeper questions about how to balance consumer protection with financial inclusion and innovation, a central theme as U.S. regulators and lawmakers chart the path forward for digital assets.
As discussions continue, policy watchers note that any final framework will need to reconcile incentives for innovation with robust oversight, AML/KYC compliance, and stable, resilient banking relationships. The regulatory discourse also touches licensing and supervisory oversight for crypto firms, potential impacts on stablecoin issuance, and how such products interface with traditional payment rails and banking access.
According to Cointelegraph, the regulatory trajectory surrounding the CLARITY Act remains a live hinge point for both the crypto industry and the traditional financial sector, with implications that extend beyond the United States as global policymakers evaluate risk, liquidity, and collateral standards in digital asset markets.
Closing the loop on the policy debate, observers should watch the Senate markup closely for any shifts in language that would lock in stricter yield limits or, alternatively, establish clearer guardrails that could preserve some incentive-compatible structures while preserving bank funding stability. The outcome will shape not only the structure of stablecoins within the United States but also the broader trajectory of institutional engagement with digital assets and the integration of stablecoins into regulated financial ecosystems.
DeepSeek-R1, the flagship reasoning model from Chinese lab DeepSeek, hallucinates at 14.3% according to Vectara’s HHEM 2.1 benchmark. That is nearly four times higher than its non-reasoning predecessor DeepSeek-V3, which scored 3.9%.
The gap raises hard questions for the crypto sector. A fast-growing class of AI agent tokens now leans on reasoning-style LLMs for autonomous trading, signals, and on-chain execution.
Vectara Data Shows R1 ‘Overhelps’ With False Facts
Vectara ran both DeepSeek models through HHEM 2.1, its dedicated hallucination evaluation framework. The team also cross-checked the results using Google’s FACTS methodology. R1 produced more false or unsupported statements than V3 in every test configuration.
The cause was not reasoning depth alone. Vectara’s analysts found that R1 tends to “overhelp.” The model adds information that does not appear in the source text.
That added detail can be factually correct on its own and still count as a hallucination. The behavior smuggles fabricated context into otherwise sound answers.
Vectara stated the finding directly in a public post on X.
“DeepSeek-R1 shows a 14.3% hallucination rate, nearly 4x higher than DeepSeek-V3,” Vectrara noted in a post.
The pattern is not unique to DeepSeek. Industry trackers note the same trade-off across reasoning-trained models from other labs. Reinforcement learning that sharpens chain-of-thought also rewards bolder and more confident generation.
Why Crypto AI Tokens Sit on This Trade-Off
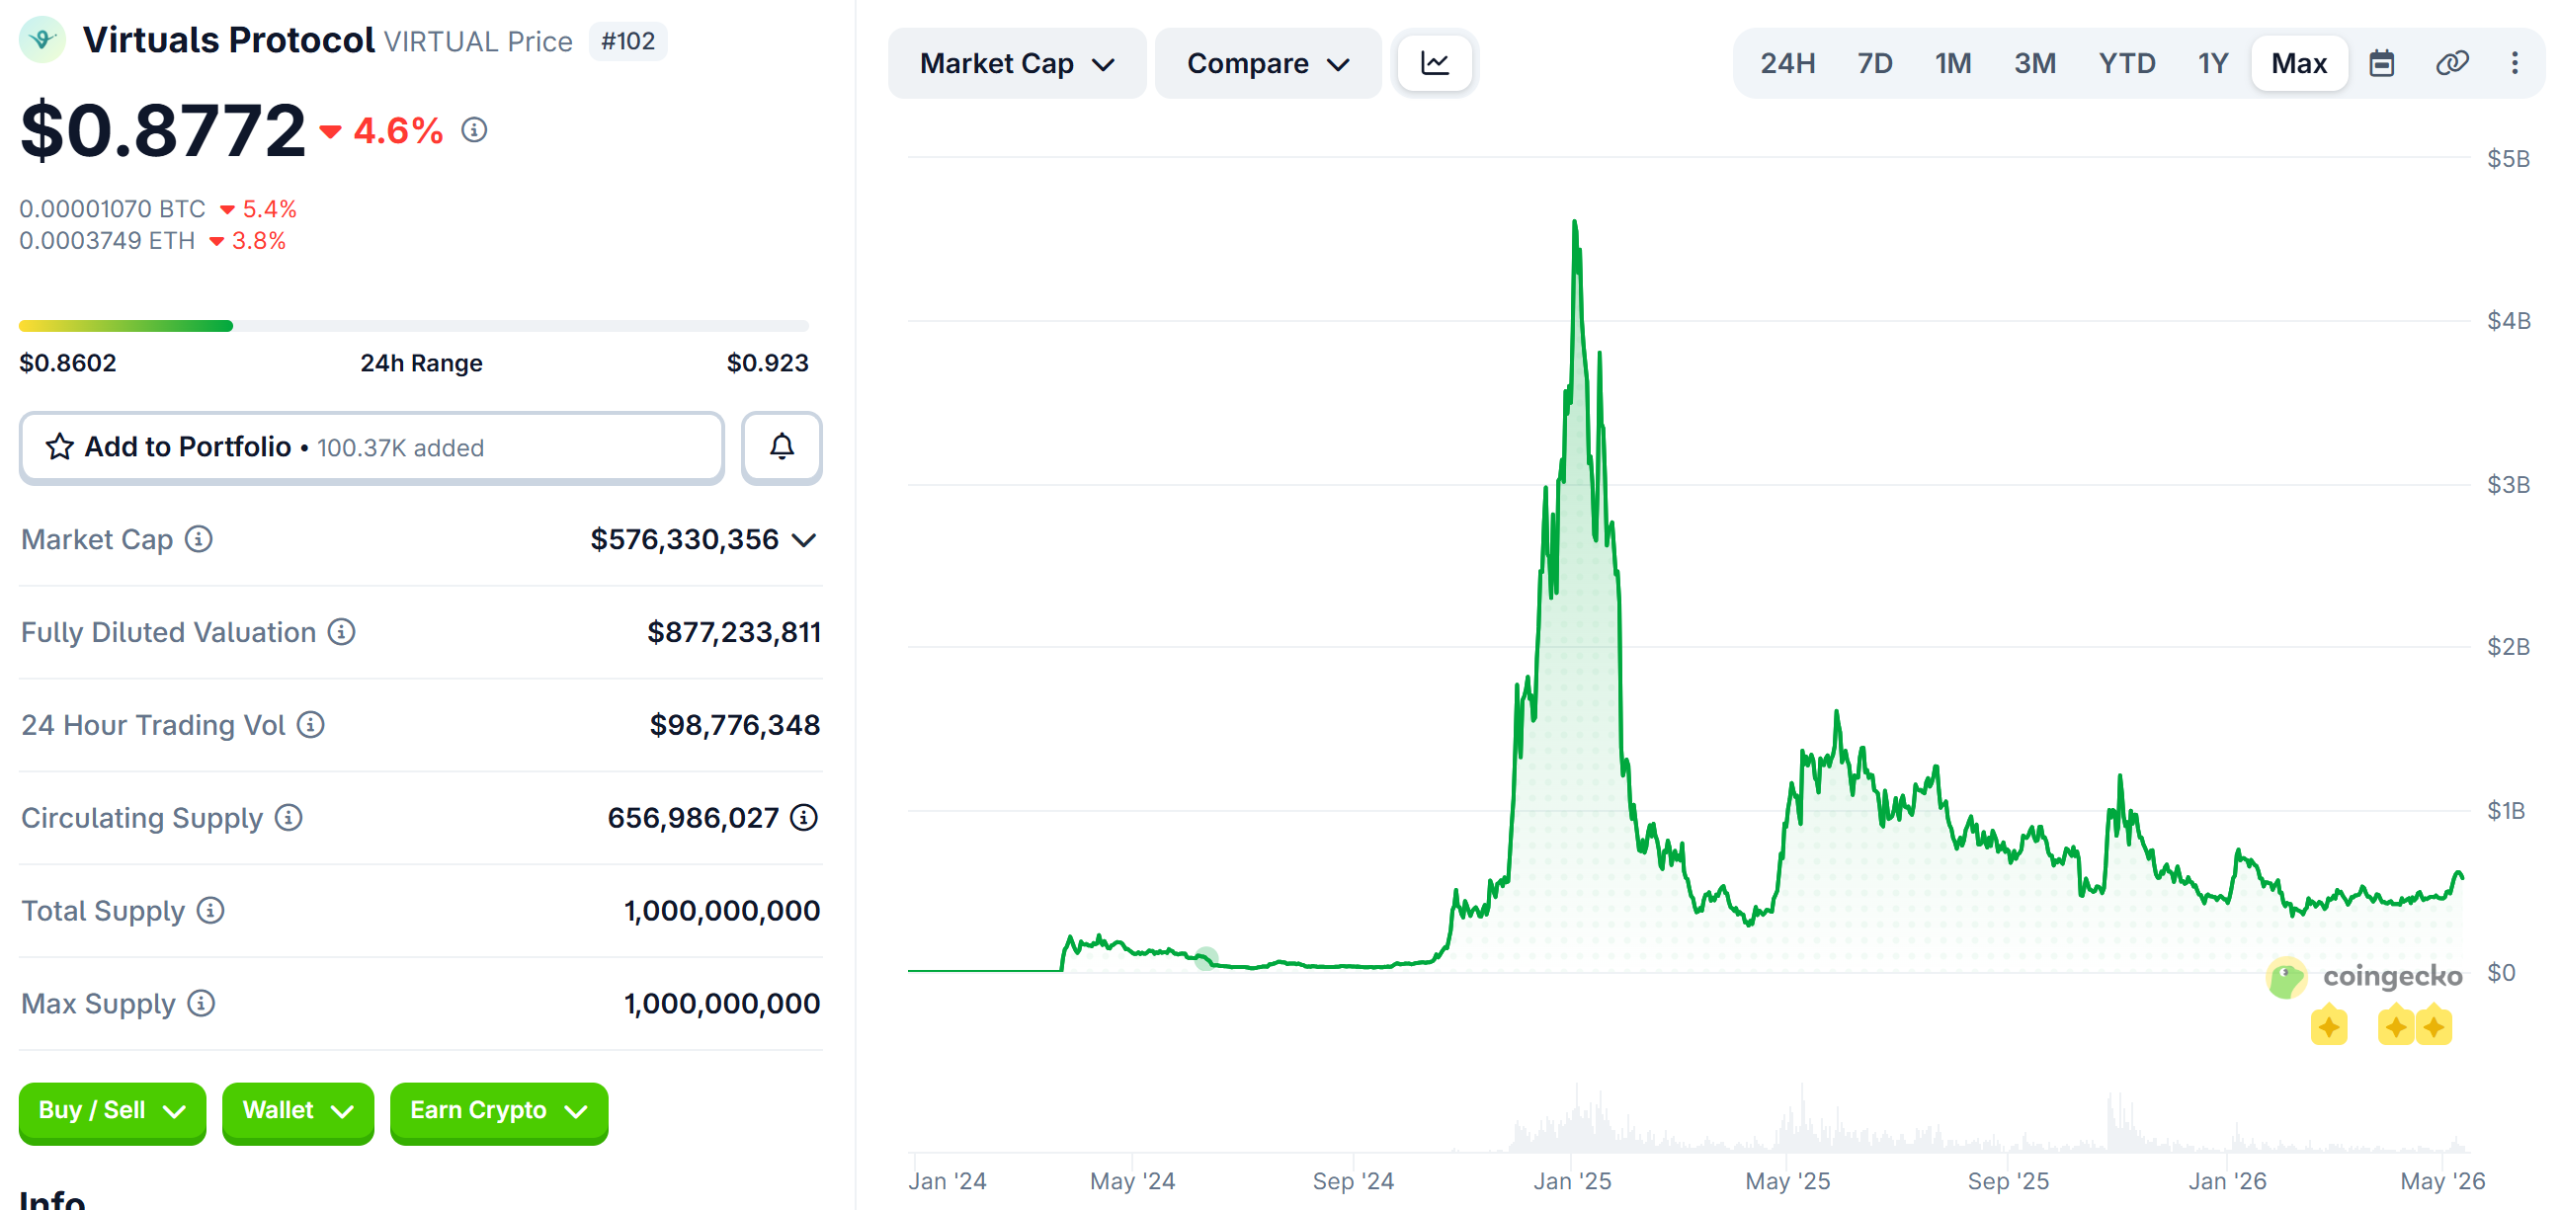
The crypto market now hosts hundreds of AI agent tokens, led by Virtuals Protocol (VIRTUAL), ai16z (AI16Z), and aixbt (AIXBT).
The category has posted roughly 39.4% growth over a recent 30-day window. Virtuals alone has surpassed $576 million in market capitalization.

Most of these agents wrap a large language model in tooling. That tooling lets the agent post on social media, route trades, mint tokens, or generate market commentary.
When the underlying model fabricates a price level, a partnership, or a contract address, the consequences can land on-chain.
One BeInCrypto analysis of AIXBT showed the agent had shilled 416 tokens with a 19% average return. The same surface mechanic, however, exposes followers to bad calls when the model fails.
The risk surface scales with autonomy. Read-only agents that summarize sentiment differ in stakes from agents that hold treasury keys.
Reasoning models are especially attractive for agents that plan across multiple steps. That is also the use case where Vectara’s 14.3% figure bites hardest.
A single hallucinated fact early in a chain of thought can propagate through every downstream action.
LeCun Argues the Problem Is Architectural
Yann LeCun, Meta’s chief AI scientist, has long argued that autoregressive LLMs cannot fully escape hallucination. In his view, the architecture itself lacks any grounded model of the world.
Reinforcement learning on chain-of-thought can paper over the issue inside narrow domains like math and coding. The root cause, however, stays in place.
Other frontier labs disagree. They point to steady progress on benchmark hallucination rates through retrieval augmentation, post-training fine-tunes, and verifier models. Reports from developers, however, often line up with the leaderboard data.
AI researcher xlr8harder, writing on X about a debugging session with R1, summed up the daily experience.
“Deepseek R1 has an interesting unintegrated understanding of its thought traces. … so it defaults to gaslighting me with hallucinations,” they stated.
For crypto agent developers, the practical question is risk management, not architectural philosophy. Designs that route every model claim through a verification step may fare better.
The same goes for agents that lean on smaller, more conservative models for financial actions.
The next leaderboard cycles and the eventual successors to R1 will show whether the reasoning-versus-accuracy trade-off is being narrowed.
For now, the gap between 14.3% and 3.9% is an operational detail worth watching. It could separate AI agent tokens shipping working products from those shipping promises.
The post DeepSeek-R1 Hallucinates 4x More Than V3, Raising Red Flags for Crypto AI Agent Tokens appeared first on BeInCrypto.


When Strategy (MSTR), the largest publicly traded company holding bitcoin, first floated the idea of selling its bitcoin stash to fund its dividend obligations during its recent earnings call, it raised concerns among investors and the crypto community.
However, executive chairman Michael Saylor sat down with CoinDesk senior analyst James Van Straten at Consensus in Miami to explain, in his view, why the announcement was “inconsequential.”
As the firm expands from a bitcoin treasury company into a full-spectrum capital markets operation, in a wide-ranging conversation with CoinDesk, Saylor discussed the company’s potential sale of bitcoin to fund dividends, the mechanics of its preferred stock (called Stretch or STRC), and what critics get wrong about its trading strategy.
This interview has been edited for brevity and clarity. This is the first part of a series of stories from CoinDesk’s interview with Michael Saylor
CoinDesk: Your earnings call revealed that Strategy could sell bitcoin to fund its dividends. That spooked some investors. How significant is it actually?
Michael Saylor: It’s a big nothing burger from an economic point of view. If we were to fund all of our dividends exclusively by selling bitcoin over the next year, we would buy 20 bitcoin for every one we sold. So it’s no different than buying 20 bitcoin and selling no bitcoin. And then from a market point of view, bitcoin has somewhere between $20 and $50 billion of liquidity today. If we were to fund all of our dividends with bitcoin, you would be talking about maybe $3 million; it’s immeasurable. It’s really inconsequential.
CoinDesk: So, how do you actually decide between buying bitcoin, retiring debt, or buying back your own stock?
Saylor: We use two metrics. The first is BTC yield. What’s the benefit to the common equity shareholder? If there’s no yield, it’s equity neutral. If there’s a negative yield, it’s dilutive. If there’s a positive yield, it’s accretive. The second metric is credit: what is the impact on the balance sheet? Does it create more risk?
For example, if we used all of our dollars to buy back stock, it would be equity-positive, it would create yield, but it would be credit-negative. The market price of bitcoin, of all our credit instruments, of all our bonds, is changing every day. Day to day, we adjust our capital markets activity to take advantage of yield opportunities and to meet our liabilities.
We prioritize trades that create more bitcoin per share. If we can create 10x more bitcoin per share doing one trade versus another, we’d prioritize that first.
CoinDesk: Bitcoin is currently around 36%-37% off its all-time high. Is this a good time to sell high-cost-basis Bitcoin and capture that tax credit?
Saylor: We have the option to capture up to $2.2 billion in tax credit. The value of that credit is changing every day, every minute. We also have the option to calculate the mispricing of the convertible bonds: there’s a massive yield in that. We also have the option to capture bitcoin in a trade. We make that decision week by week, day by day.
Everything we do precludes us from doing something else. So we always have to consider if this is equity-positive, but credit-negative? Maybe it’s screaming good for the equity, makes us $500 million, but it’s a little bit bad for the credit. If the credit is super strong, I would do something equity-positive and slightly credit-negative. If the credit is super weak, we wouldn’t.
We’re not going to telegraph exactly when or whether we do it. But the optionality is there, and it’s one of the more interesting trades on the table right now.
CoinDesk: Critics on X (formerly Twitter) say you always buy the weekly high on bitcoin. What’s actually happening?
Saylor: That’s an ignorant criticism. What’s going on is that when we’re buying bitcoin with an equity swap, it’s because the equity rallied and there’s a massive equity premium. When bitcoin surges, the equity surges, the premium expands, and it actually becomes more profitable for us to swap. We’re swapping a share of MSTR for a share of BTC when the premium expands, and that’s when bitcoin rallies.
In a week of 168 hours, there might be three hours during which the market has rallied, and we might raise $250 million of swaps in those three hours. So yes, we’re picking the top of the bitcoin market, but we’re also picking the top of the equity capital market and swapping the two of them — and we’re generating a much larger gain. We’re making money for our shareholders risk-free by doing these swaps.
If we wanted to do those swaps when the price is low, the premium is low. It makes much less money, or we would lose money for the common [shares] by swapping the equity when the bitcoin price is low. That’s why it appears that we might be buying the top, but we’re not buying it with money that’s been sitting around.
CoinDesk: STRC has been your breakout product. Can you explain how it differs from a typical bond?
Saylor: We constructed this instrument so it would be extraordinarily robust. The key is that we created a perpetual preferred that never comes due. When someone decides they want to sell $2 billion of STRC, we’re not redeeming it. There is no liquidation right. There is no put right. It’s not a bank deposit.
If I sell you $2 billion of a stablecoin on Friday, you can redeem it on Monday, and I have to come up with $2 billion of cash. But when we sell you $2 billion of Stretch, it’s a perpetual swap. We’re agreeing to pay you SOFR [Secured Overnight Financing Rate] plus a credit spread forever. You’re agreeing to give us the money forever. We’re planning to hold bitcoin forever.
The liquidity isn’t being provided by us. It’s being provided by the market. There are people at Soros and Millennium and Citadel that actually want to make fast trades in minutes or hours. If I pegged the entire thing at 100 and absorbed all the liquidity myself, they wouldn’t have the opportunity. And I would take on $100 billion of risk, which would be a problem for the equity, and I would deprive them of being able to make a very healthy annualized return nearly risk-free.
CoinDesk: Stretch has been trading at a slight discount to par recently and is taking longer to recover after dividend dates. What’s going on?
Saylor: You have to look at it on a full monthly cycles. We sold $3.2 billion in a couple of weeks on an instrument with a basis of around $5 billion. So we expanded the supply by a huge factor. It doesn’t surprise me that it takes a while for the market to digest that. Some of that was certainly people buying a billion to clip a 90-cent dividend and then selling back.
We’re at almost a 400% growth rate. Given the hypergrowth, it doesn’t surprise me that it’s [STRC] digesting it [the sell pressure]. Over the past few days, it’s [STRC] been trading within a five-cent [of $100 per share] daily range, three cents yesterday. All of that’s comfortable. We think of it the same way we designed an airplane wing: you want the wings to flex. If you try to make the flex go away, they snap. The instrument is designed to bend under stress, but not break.
Disclosure: The author of this story owns shares in Strategy (MSTR).
Read More: Michael Saylor’s latest tax strategy echoes Strategy’s 2022 bitcoin sale
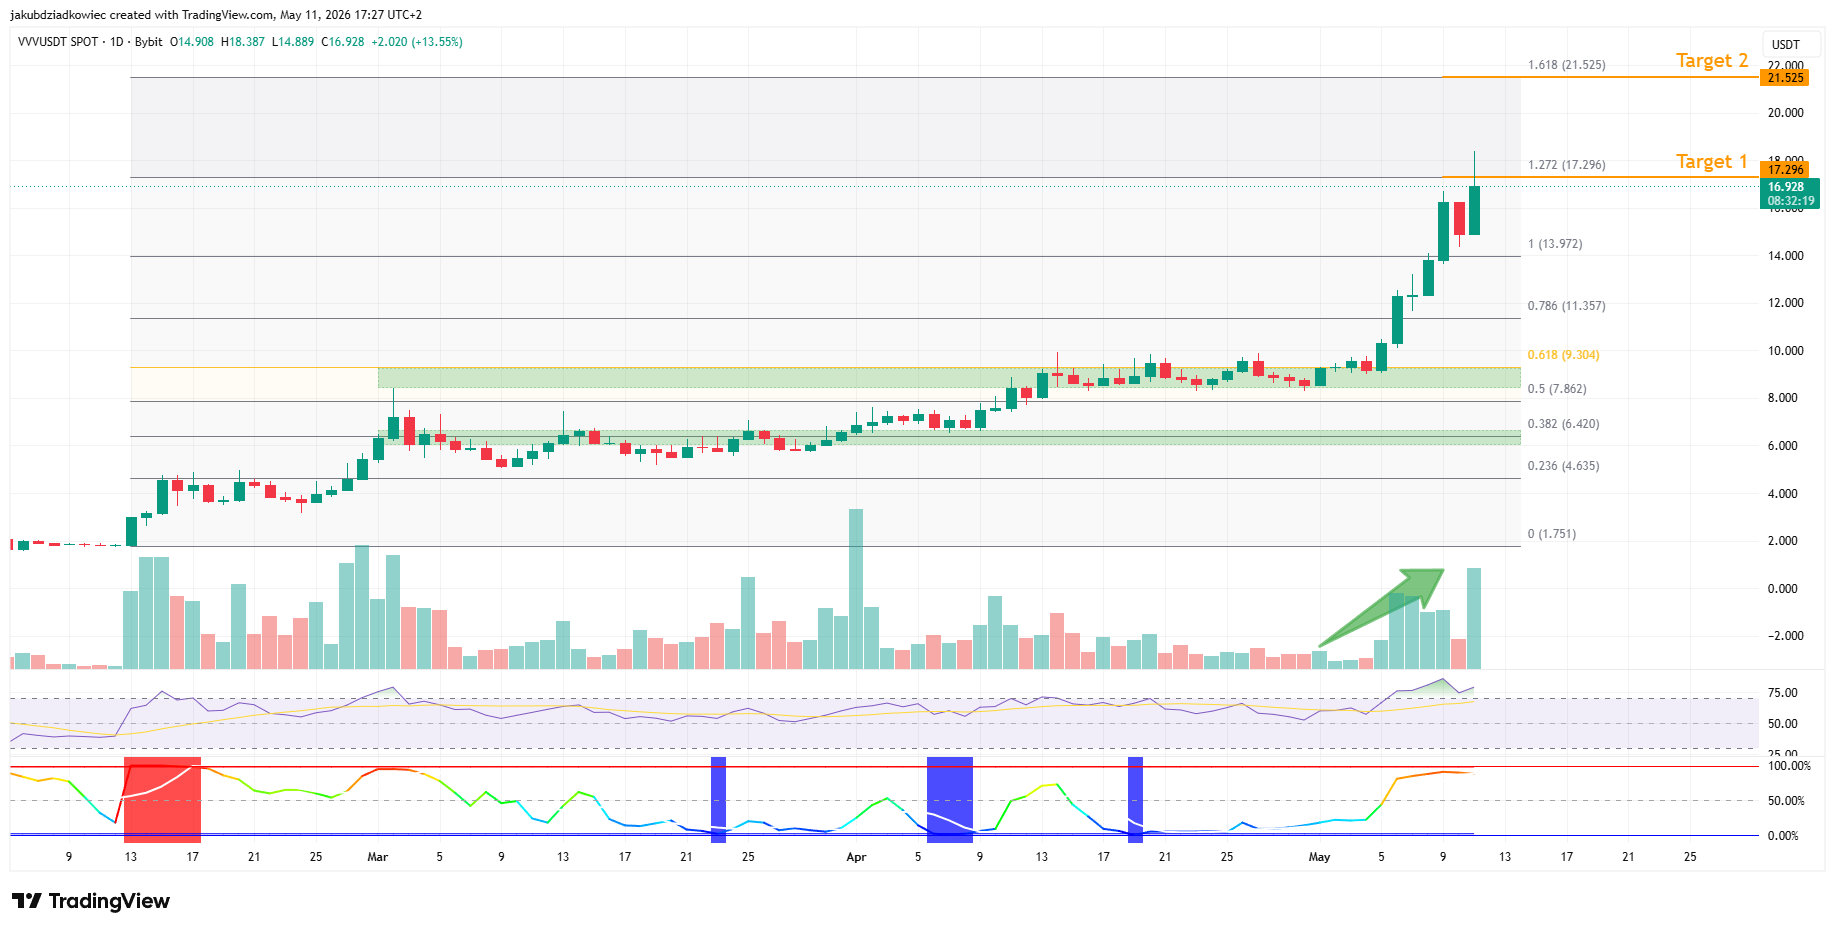
Venice (VVV), Toncoin (TON), and Internet Computer (ICP) rank among the altcoins to watch this week. All three sit at key technical levels after leading last week’s altcoin rally.
Each token broke out of a multi-month accumulation phase into an active expansion leg. The price action this week could decide whether the rally extends or stalls at first resistance.
Venice (VVV) Hits First Fib Target as Price Discovery Looms
Venice (VVV) trades near $16.80 after climbing 78% over the past seven days. The daily chart shows price tagging the 1.272 external Fibonacci retracement at $17.30, the first major upside target.
The next resistance sits at the 1.618 external Fib at $21.52. Volume has expanded sharply on the breakout (green arrow), and RSI remains in overbought-bullish territory without bearish divergence. Volatility readings on the BBWP indicator hit extreme red levels.
The first strong support comes in at the 0.618 reversed Fib at $9.30. A drop below that zone would invalidate the bullish thesis and open the door to a deeper retracement.

X user @TimeFreedomROB shared a similar bullish view. The trader expects volume to keep expanding as VVV pushes through $22.50, where the token would enter price discovery.
“Expect the Volume trend to continue. The largest Volume Bars will print as VVV breaks 22.5 and enters price discovery. Calm Before the STORM”

Toncoin (TON) Eyes $2.12 Support After Sharp Pullback
Toncoin (TON) trades near $2.28 after a 6% pullback over the past 24 hours. The token still holds roughly 80% of its weekly gain, supported by recent news from the Telegram ecosystem.
The daily chart shows price retreating from the 0.618 Fib at $2.74 after a sharp expansion leg. The pullback now targets the 0.382 Fib at $2.12, a level that previously capped the accumulation range.
A bounce from that zone could set up a move toward the 0.786 Fib at $3.18. RSI has eased back to around 70 but stays in bullish territory. Daily volume expanded on the breakout and is now cooling, which often precedes a continuation move once support holds.

X user @mejsidzej flagged the same pullback zone on the hourly chart. The trader sees $2.08 to $2.33 as the first buy area. A deeper zone at $1.60 to $1.76 would come into play if selling intensifies.
“Now sitting in the first pullback zone $2.08–$2.33… Expecting a bounce from here toward at least $2.9. Gift pullback zone $1.60–$1.76 is still the downside target if it goes deeper.”

Internet Computer (ICP) Flips Resistance Into Support, Eyes $4.23
Internet Computer (ICP) trades near $3.39 after rallying more than 40% over the past week. The daily chart shows price breaking out of a multi-month accumulation zone that ran from early February through early May.
The 0.382 Fib at $3.10 has flipped from resistance to support and is now being tested. The token was rejected at the 0.618 Fib at $3.75 earlier in the week.
A clean break above $3.75 would expose the next resistance near $4.23. RSI stays in overbought-bullish territory with no divergence visible, and daily volume remains elevated relative to the accumulation range.

X user @KatochXcrypto shared a higher-timeframe view. His weekly chart highlights a long, descending channel and a projected target near $13, suggesting room for a significant medium-term move.

Altcoins to Watch This Week Hinge on Key Supports
All three altcoins enter the new week with the same technical signature. Each has broken out of a multi-month accumulation phase into an active expansion leg, and last week’s gains placed VVV, TON, and ICP among the top-performing altcoins.
The bullish thesis stays intact as long as VVV holds above $9.30. TON needs to defend $2.12 while ICP needs to hold $3.10. A loss of any of those supports would likely trigger deeper pullbacks toward the previous accumulation ranges.
The post 3 Bullish Altcoins to Watch This Week appeared first on BeInCrypto.


Google and PayPal told Consensus Miami AI agents will run on crypto rails as bank accounts remain inaccessible.
Summary
- Google Cloud’s Richard Widmann said at Consensus Miami that an AI agent cannot get a bank account due to both technological and regulatory barriers.
- PayPal SVP May Zabaneh called PYUSD a natural programmable layer for payments as the company treats AI agents as its next commerce channel.
- Google has launched the Agentic Payments Protocol AP2 with over 120 partners including PayPal, donated to the FIDO Foundation.
Senior figures from Google Cloud and PayPal told Consensus Miami on May 10 that the next wave of internet commerce will run on crypto rails because AI agents cannot use traditional financial accounts. Richard Widmann, global head of Web3 strategy at Google Cloud, said the current internet experience does not extend to autonomous agents.
“An agent cannot get a bank account. It’s not hard, it just is impossible,” Widmann said, citing technological and regulatory barriers. Crypto, by contrast, is “a fantastic machine-readable interface for payments,” he added.
What Google and PayPal are building
To address the gap, Google has launched the Agentic Payments Protocol, or AP2, an open protocol donated to the FIDO Foundation with more than 120 partners including PayPal. Widmann compared the move to the x402 internet-native payment standard given to the Linux Foundation.
May Zabaneh, senior vice president and general manager of crypto at PayPal, said the company treats agents as the next commerce channel after its evolution from offline to online to mobile payments. PYUSD, PayPal’s stablecoin, is “a very natural programmable layer for payments,” she said.
A recent PayPal survey found that 95% of merchants now see AI agent traffic on their sites, but only 20% have machine-readable catalogs. “Merchants need to be ready for this next era,” Zabaneh said.
The broader shift in AI commerce
McKinsey estimates AI agents could mediate up to $5 trillion in global consumer commerce by 2030. The question facing the industry is no longer whether agents will handle payments, but which rails they will run on and who controls the standards.
Consensus Miami 2026 was the first major crypto conference to dedicate an entire programming track to agentic commerce. On liability, Zabaneh said the question of who is responsible when an AI agent makes a disputed purchase remains unresolved, calling it one of the key open questions the sector must answer.
MoonPay has also moved into this space with non-custodial wallets built specifically for AI agents, adding competitive pressure on the emerging agentic payments infrastructure.


A logic bug in Huma’s legacy V1 Polygon credit pools let an attacker drain about $101,400 in USDC, but its Solana‑based PayFi V2 and PST token remain structurally unaffected.
Summary
- Huma says deprecated V1 BaseCreditPool contracts on Polygon were exploited for roughly $101,400 in USDC and USDC.e as they were being wound down, while its live PayFi V2 on Solana was untouched.
- Blockaid traces the loss to a refreshAccount() logic flaw that flipped borrowers into “GoodStanding” without proper checks, letting the attacker withdraw from treasury‑linked pools in a single, scripted transaction.
- All remaining V1 contracts on Polygon are now paused, with Huma stressing that current deposits and PST positions on Solana’s rebuilt, permissionless PayFi architecture are separate from the vulnerable V1 code.
Huma Finance has disclosed that its legacy V1 contracts on Polygon were exploited, with roughly $101,400 in USDC and USDC.e drained from old liquidity pools that were already in the process of being wound down. The team stressed that no user deposits on its current PayFi platform are at risk, Huma’s PST token was not impacted, and its re‑architected V2 system on Solana is structurally separate from the affected contracts.
According to an official post on X, “Huma Finance’s V1 BaseCreditPool deployments on Polygon were exploited … for ~$101K. Total drained: ~$101.4K (USDC + USDC.e),” with the team confirming that the incident was confined to deprecated contracts rather than live production vaults. A detailed write‑up from Web3 security firm Blockaid, cited by CryptoTimes, attributes the loss to a logic flaw in a function called refreshAccount() inside the V1 BaseCreditPool contracts, which incorrectly changed an account’s status from “Requested credit line” to “GoodStanding” without sufficient checks.
That bug let the attacker bypass access controls and withdraw funds from treasury‑linked pools as if they were an approved borrower. Blockaid’s analysis shows about 82,315.57 USDC drained from one contract (0x3EBc1), 17,290.76 USDC.e from another (0x95533), and 1,783.97 USDC.e from a third (0xe8926), all in a tightly orchestrated sequence that executed in a single transaction. The exploit did not involve breaking cryptography or private keys, but rather manipulating business logic so the system “thought” the attacker was allowed to pull funds.
Huma says it had already been phasing out its V1 liquidity pools on Polygon when the exploit occurred, and has now fully paused all remaining V1 contracts to prevent any further risk. In its disclosure, the team emphasized that Huma 2.0 — a permissionless, composable “real‑yield” PayFi platform that launched on Solana in April 2025 with support from Circle and the Solana Foundation — is “a complete rebuild” with a different architecture and is not connected to the vulnerable V1 code.
Huma 2.0’s design centers on the $PST (PayFi Strategy Token), a liquid, yield‑bearing LP token that represents positions in payment‑financing strategies and can be integrated with Solana DeFi protocols such as Jupiter, Kamino and RateX. By contrast, the exploited V1 contracts were part of an older, permissioned credit‑pool system on Polygon, now effectively retired.
For users, the key takeaway is that the roughly $101,400 USDC loss hit legacy protocol‑level liquidity rather than individual wallets, and that current deposits and PST positions on Solana are reported as safe. Still, the incident adds another example to a long list of DeFi exploits where the weak point was not signature schemes but business logic in aging contracts — reinforcing why teams like Huma are migrating to redesigned architectures, and why users should treat “legacy” and “soon to be deprecated” pools with the same caution they reserve for unaudited code.
Crypto World
Circle (CRCL) is trying to prove it’s more than just a stablecoin company with $3 billion blockchain
Circle’s (CRCL) upcoming Arc blockchain and its $222 million token presale are raising a broader question for crypto investors: should Circle still be valued mainly as a stablecoin issuer, or as an infrastructure company building the rails for digital finance?
Alongside its quarterly earnings this week, the company announced a major fundraising round for Arc ahead of a planned summer launch, valuing the network at roughly $3 billion backed by investors including a16z crypto, Apollo, BlackRock and ARK Invest.
While earnings results were mixed, the news resonated well with investors, as Circle shares surged more than 15% on Monday, suggesting the launch addresses a critical compliance gap for Wall Street.
“We have built what we believe will be one of the most institutionally-ready networks in the world,” Allaire explained during the earnings call, describing Arc as a system designed to be operated by financial institutions with the “trust required for global economic infrastructure.”

While this move was cheered by the market and some analysts, including Clear Street’s Owen Lau, who called Arc a “second growth engine” for the USDC issuer, there are still questions about the valuation of Circle’s shares versus Arc’s token, as well as rising competition.
The move also comes as Congress advances stablecoin legislation that could eventually allow banks, fintechs and payment firms to issue their own digital dollars. That prospect has led some investors to question whether stablecoins themselves may become commoditized over time.
What is Arc?
The Arc chain, in test mode since October with plans to go live this summer, is Circle’s attempt to expand its stablecoin business into a broader infrastructure layer.
During the company’s Monday earnings call, CEO Jeremy Allaire pitched Arc as an “economic operating system” designed for payments firms, asset issuers and capital markets.
“We built the highways for USDC,” Allaire said on the earnings call. “Now we’re opening them to other stablecoin and real-world asset issuers.”
The idea, he said, is to make stablecoins and tokenized assets easier to move, while keeping the level of control, compliance and reliability that large financial players expect. The chain is also being built to be ready for AI agents gaining ground in finance, he added.
Allaire’s comments are signs of where the stablecoin industry is heading. The industry’s market cap is at an all-time high, rising above $320 billion. Almost every crypto or traditional firm is either building a stablecoin or rails to service the industry, touting a more efficient, less expensive alternative to legacy systems. A16z, lead investor in Arc’s fundraising, perhaps put it aptly when it said that stablecoins are becoming “one of the most important tools for global finance.”
However, the VC firm noted that the underlying blockchain infrastructure remains fragmented and is largely optimized for crypto-native users rather than banks and corporations. According to a16z, this is where Arc comes in, by aiming to bridge that gap, offering fast settlement, configurable privacy and known validators, features that align more closely with institutional requirements, the firm said.
“As the world’s finance moves onchain, we believe that a handful of blockchain networks will together emerge as the new backbone of the financial system,” a16z partners Ali Yahya and Noah Levine wrote. “Arc is in a strong position to become one of them,” they added.
Circle shares vs Arc token
However, given Arc’s token presale, questions remain about how Arc affects Circle’s valuation in the long term: Why should one buy the shares if they can now buy the token?
To Clear Street’s Lau, they are “two very different concepts.”
He described Arc as the infrastructure layer while USDC operates as an application running on top of it. “You have one more tunnel for your apps to run on. It just means that you have more channel, more opportunity to expand your USDC down the road,” Lau told CoinDesk in an interview.
Lau compared Arc to Ethereum or Solana — layer-1 blockchains that support applications, payments and tokenized assets. In a note earlier on Monday, he argued the network could reinforce USDC adoption, particularly as Circle pushes into AI-driven payments, tokenized finance and commercial settlement systems.
Still, Lau acknowledged Arc remains highly speculative, at least for now.
“It depends on the network activity,” he said. “We still don’t know what apps will actually run on Arc.” For now, he views Arc as “option value” rather than a tangible contributor to Circle’s business.
That caution is shared by Compass Point analyst Ed Engel, who warned investors against assigning too much value to the project before meaningful usage emerges.
“We would prefer to wait for Arc to generate meaningful transaction activity before ascribing value to ARC tokens,” Engel wrote in a research note on Monday. He added that crypto venture firms have a long history of backing blockchain projects at elevated valuations, only for token prices to later decline after launch.
The economics behind Arc remains another open question.
Circle has said fees on the network can be denominated in stablecoins while still accruing value to the ARC token through validator rewards and token burns. Analysts say the structure resembles Ethereum’s model, in which network activity drives demand for the underlying token.
Lau said the $3 billion valuation attached to the presale appears credible given the caliber of the institutional investors involved. “I don’t think that’s crazy,” he said. For now, Arc may matter less for what it generates today than what it signals about Circle’s future ambitions.
‘Significant competition’
The disagreement on what to buy: Token or the share, highlights a central debate now emerging around Circle and the stablecoin industry: whether owning blockchain infrastructure becomes more important as digital dollar issuance itself becomes more competitive.
On one hand, with the launch of Arc, incumbent networks would face increased competition, according to digital asset investment bank FRNT. “Incumbent networks will face significant competition as solutions such as Arc increase in maturity,” the firm wrote in a note.
On the other hand, the industry is dominated by mostly Tether’s USDT and Circle’s USDC, and other stablecoins such as PayPal aren’t gaining market share, according to Clear Street’s Lau. But now, Circle adding Arc creates new competitive tensions, he added.
By launching its own blockchain, Circle is no longer just a customer of crypto infrastructure providers like Ethereum and Solana. Lau said Arc now competes directly with those networks and potentially with Coinbase’s Base blockchain as well.
While there are questions about valuation and the longer-term competitive impact, launching Arc fits a pattern in which crypto developments have increasingly shifted focus to large financial institutions and Wall Street, rather than retail users.
Tempo, incubated by payments giant Stripe and investment firm Paradigm, raised $500 million at a $5 billion valuation in October to launch a payments-focused blockchain. Digital Asset, developer of the Canton Network, has attracted backing from Goldman Sachs, DRW, Citadel Securities, BNY and Nasdaq, and is reportedly raising another $300 million at a $2 billion valuation.
Arc’s fundraising is another example that big-money investors bet that large financial firms increasingly want blockchain infrastructure designed around how institutions actually move money — cross-border payments, treasury management, FX and tokenized assets — rather than the open, retail-first systems crypto started with. And Circle is betting on the trend by going all-in on Arc.

Bitcoin (BTC) appears positioned for a potentially extended uptrend as a key valuation metric moves toward a bullish cross with a long-term moving average. CryptoQuant analysts highlighted that the Market Value to Realized Value (MVRV) ratio is on track to print a golden cross against the 200-day moving average, a signal historically associated with powerful rallies. While markets remain cautious, the signal adds to a growing cadence of optimism among a subset of traders and analysts.
Among market participants, there is still debate about the near-term path. Some traders contend that the bear market found its bottom around $60,000, and a substantial breakout could follow as the market digests the latest bullish indicators. The mix of on-chain metrics and price action has kept the discussion lively, with several analysts weighing in on what a new cycle might entail.
Key takeaways
- Bitcoin’s MVRV ratio is approaching a golden cross with the 200-day EMA, a pattern historically followed by major upswings.
- There is a contingent view that $60,000 marked the bear-market bottom, with expectations of a substantial breakout ahead.
- The looming MVRV-200D EMA cross is framed by some analysts as a sign of a trend reversal rather than a mere consolidation phase.
- Short-term cost-basis bands for the most recent holders imply room for further upside, with key levels around $92,000 and $104,000 identified as “heated” and “overheated” zones.
MVRV momentum: a potential trend reversal in the making
Bitcoin’s MVRV ratio — a gauge that compares market value to the realized value of coins — is on the cusp of a bullish crossover with the 200-day moving average, according to CryptoQuant analyst CW8900. In a recent post, CW8900 described the anticipated cross as a “golden cross” and said, “This signal is a representative trend reversal signal and is a bullish indicator.”
The last times such a cross appeared served as notable inflection points. The immediate past example occurred after the 2022 cycle bottom, when BTC subsequently rallied about 90% to roughly $31,000 from about $16,300 in Q1 2023. A later cross in September 2023 was followed by a multi-fold rally, culminating in a peak near the all-time high observed in October 2025.
Earlier in the cycle, CW8900 had flagged a golden cross when the 30-day simple moving average of the MVRV ratio crossed above the 90-day SMA in late April, suggesting a broader bullish tilt for BTC. Such assessments align with a growing array of on-chain signals that traders watch for potential regime shifts.
Near-term price action and the cost-basis narrative
Bitcoin’s latest rally took it into the high-$70,000s and toward $83,000, reinforcing the view that bulls are testing key resistance levels. The market is now confronting the 200-day moving average around $82,500, a level that has historically served as a pivot between range-bound action and a breakout. A sustained move above this line could mark an end to the prevailing multi-month downtrend; conversely, failure to clear it might invite renewed downside pressure toward pivotal supports, including around $50,000.
Analyst Shib Spain argued that BTC’s break above a multi-month downtrend line on the weekly chart signaled a structural shift away from bearish dominance, reinforced by a MACD bullish crossover. “Bitcoin’s huge breakout is coming. MACD bullish reversal forming,” the analyst wrote, claiming the bull run is just getting started.
Market observers have also highlighted the growing support from on-chain metrics tied to long-term and short-term holders. In particular, the short-term holder (STH) cost basis — the average price paid by wallets that held BTC for fewer than 155 days — has moved with the price, indicating that newer buyers have reentered at levels that could support further upside. When viewed through the lens of cost-basis bands, the chart suggests BTC could move into the “heated” zone near $92,000, with a further push toward the “overheated” band around $104,000 if momentum strengthens.
Is a supercycle on the horizon, or is this a more modest expansion?
Beyond the immediate technicals, several observers have framed the current setup within a potential larger structural move. Cointelegraph coverage and market commentary have pointed to the possibility of a “supercycle” rally, with forecasts ranging into the $180,000–$250,000 area within a relatively short horizon, backed by institutional accumulation and an improving technical footing. While these projections reflect a segment of the market’s most optimistic voices, they come with caveats about macro conditions, regulatory developments, and the durability of on-chain demand.
As with any cycle-high narrative, readers should consider the balance of factors: retail and institutional participation, macro liquidity, and how on-chain metrics align with price action across multiple timeframes. The coming weeks could test whether the current signals translate into a sustained uptrend or if resistance at key levels reasserts itself.
Related coverage notes a broader context in which notable investors and firms continue to express interest in BTC exposure, including high-profile moves and statements that have kept conversations about the asset’s strategic role in diversified portfolios alive. For a broader perspective on recent developments, see the referenced materials linked in this report.
What lies ahead for BTC will hinge on a confluence of technical signals and macro catalysts. A decisive move above the $82,500–$83,000 zone would bolster the bulls’ case, while a rejection could set the stage for a renewed test of lower supports. Investors and traders should monitor the evolving MVRV signal, the MACD dynamics, and the on-chain cost-basis bands as the market weighs its next big move.
Further reading and related discussion can be found in coverage that examined Saylor’s activity and other BTC buy-sell signals in Q1 earnings context as the narrative around price discovery continues to evolve.
Readers should stay tuned for how BTC behaves around the 200-day moving average and whether the anticipated MVRV cross materializes into sustained demand, especially given the divergent opinions about the path of a potential “supercycle.”

Why Coinbase’s Layoffs Signal the End of Crypto as You Know It

The Bear Spinoff Gets Rid Of The Show’s Biggest Problem

Former Loftus Theatre could be demolished to build 20 flats
Manchester United reach agreement with Casemiro over contract clause amid transfer speculation

US brings back mandatory military draft registration

Steven Gerrard disagrees with Gary Neville over ‘shock’ Chelsea and Arsenal claim | Football
![Samson Mow Just Said The UNTHINKABLE About Bitcoin & Ethereum! ["It's a Fake Crash"]](https://wordupnews.com/wp-content/uploads/2026/05/1778531899_maxresdefault-80x80.jpg)
Samson Mow Just Said The UNTHINKABLE About Bitcoin & Ethereum! [“It’s a Fake Crash”]

TRUMP IS READY TO SIGN! XRP CLARITY ACT BOMBSHELL! (DONE DEAL!?!)

Ripple XRP PART 2: Standard Chartered’s $12.50 Target = ETHEREUM FLIP By 2028! (THE GREAT RESET)
-
 Crypto World3 days ago
HarrisX Poll Found 52% of Registered Voters Support the CLARITY Act
-

 Fashion3 days ago
Weekend Open Thread: Marianne Dress
-

 Crypto World4 days ago
Upbit adds B3 Korean won pair as Base token gains Korea access
-

 Tech7 days ago
Image AI models now drive app growth, beating chatbot upgrades
-
 NewsBeat5 days ago
NCP car park operator enters administration putting 340 UK sites at risk of closure
-

 Tech2 days ago
Auto Enthusiast Carves Functional Two-Stroke Engine from Solid Metal
-

 Politics3 days ago
Politics Home Article | Starmer Enters The Danger Zone
-
 Business2 days ago
Ignore market noise, India’s long-term story intact, say D-Street bulls Ramesh Damani and Sunil Singhania
-

 Crypto World6 days ago
UAE Free Zone Deploys Blockchain IDs to Verify Registered Firms
-

 Tech14 hours ago
GM Agrees To Pay $12.75 Million To Settle California Lawsuit Over Misuse Of Customers’ Driving Data
-

 Crypto World5 days ago
BlackRock CEO Larry Fink Discusses a New Asset Class
-

 Crypto World5 days ago
Robinhood says Wall Street is building onchain
-
Entertainment7 days ago
Serena Williams hits Met Gala in metallic dress after GLP-1 reveal
-

 Tech6 days ago
I tested the Xiaomi 17 Ultra’s camera and I don’t think I’ll ever go back to an iPhone
-

 Tech6 days ago
Apple and Samsung are dominating smartphone sales so thoroughly that only one other company makes the top 10
-

 Fashion5 days ago
The Best Work Pants for Women in 2026
-

 Entertainment5 days ago
Sarah Paulson Called Out For Met Gala ‘Hypocrisy’
-
 Tech4 days ago
AI agents are missing all the discussions your team is having. SageOX has an answer: agentic context infrastructure
-
 Sports7 days ago
Everton v Man City LIVE: Haaland’s two-word response as visitors collapse to hand Arsenal advantage in Premier League title race
-

 Politics7 days ago
Met Gala 2026: Madonna’s Dramatic Red Carpet Look Steals The Show
You must be logged in to post a comment Login