

Crypto World
There’s a huge $14 billion bitcoin options expiry this Friday and it points to $75,000 as price magnet
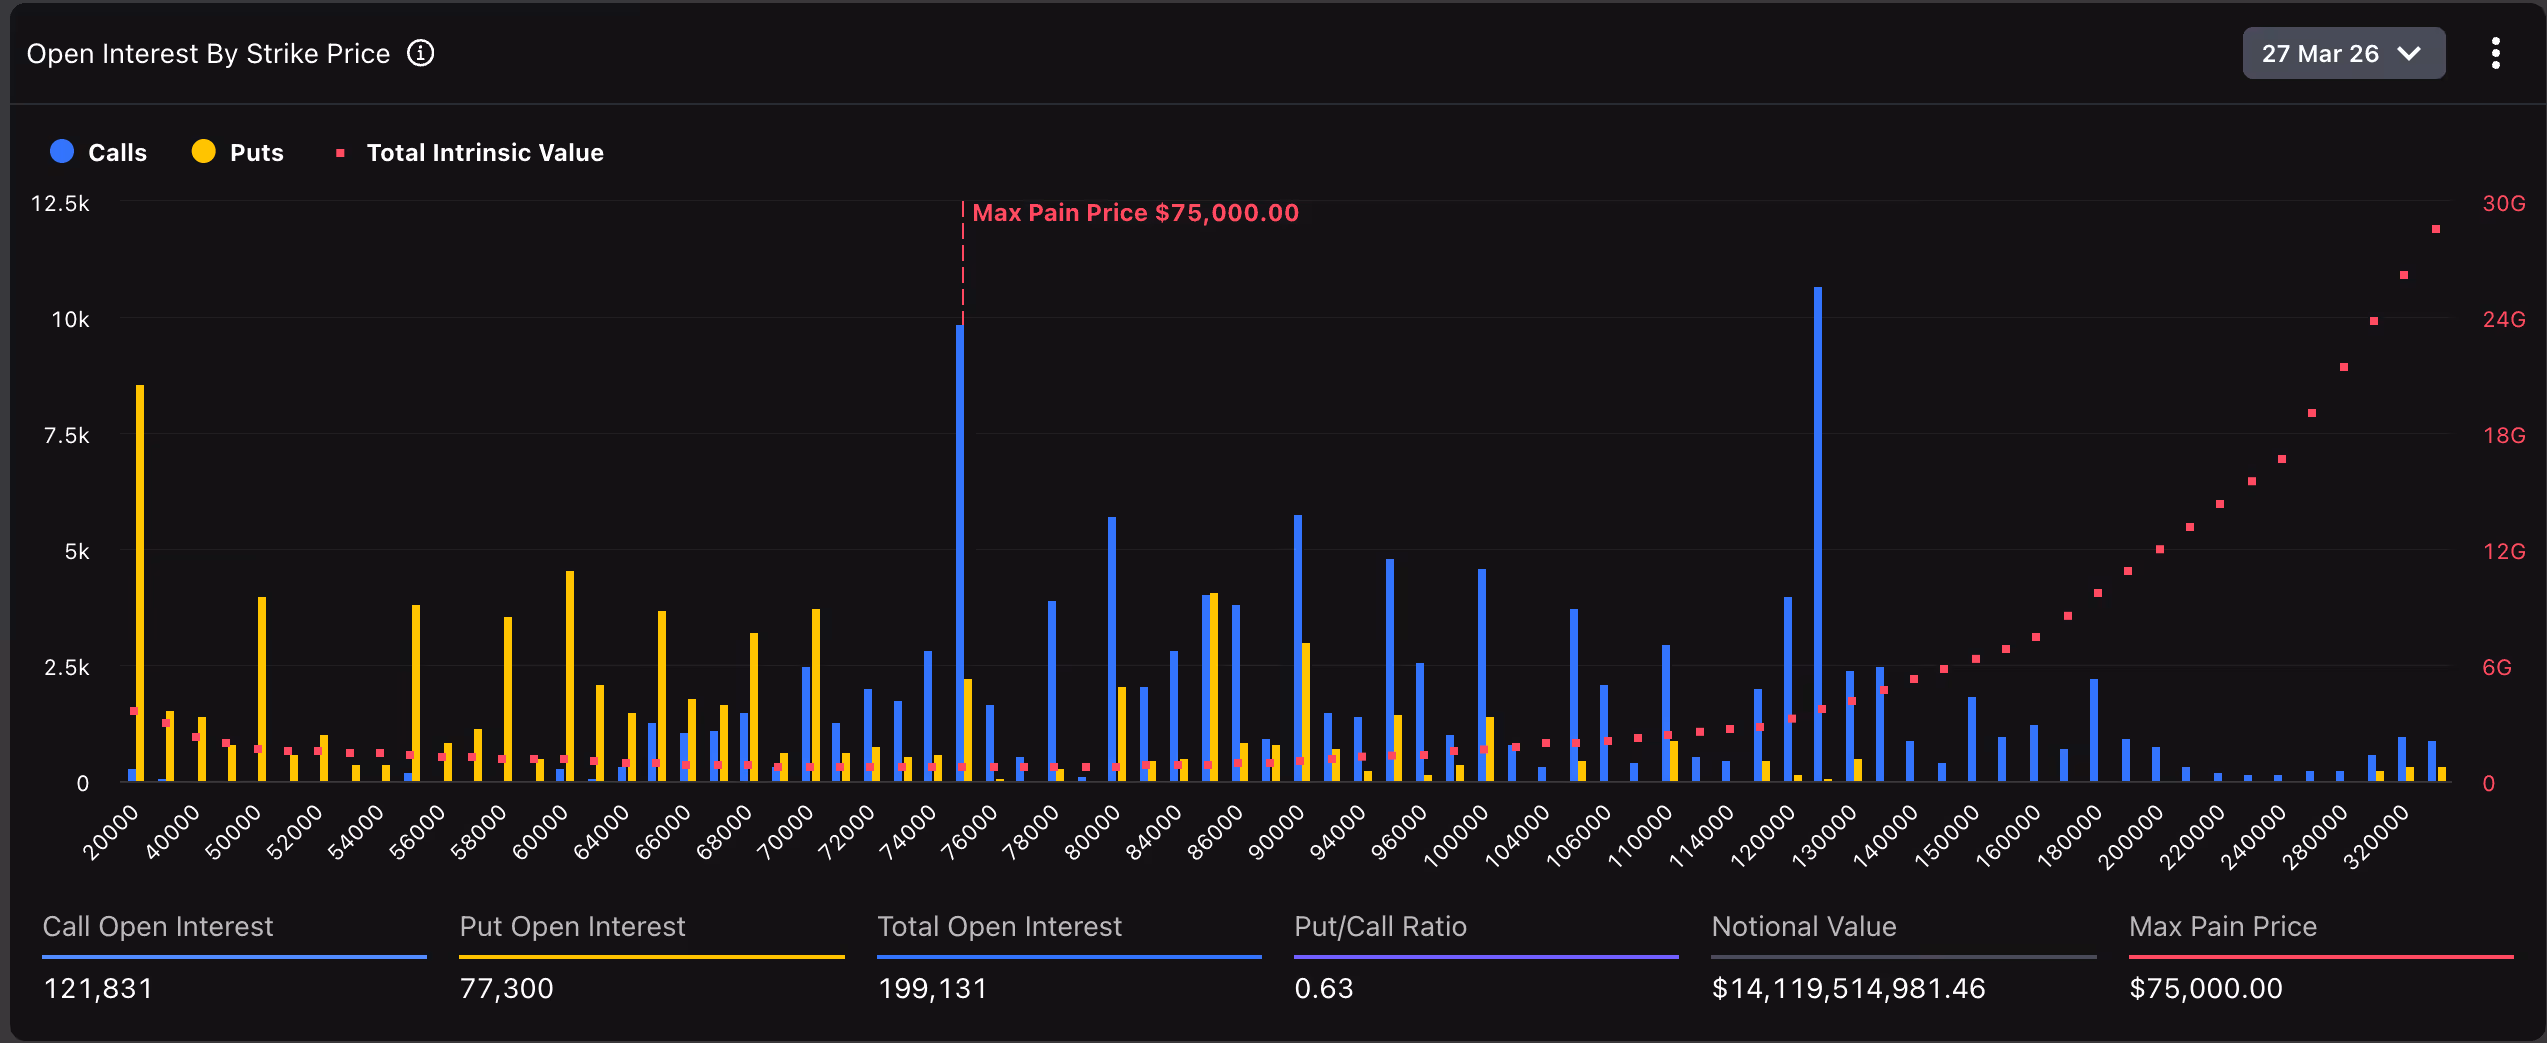
On Friday, bitcoin options or derivative contracts worth billions will expire on crypto exchange Deribit. Traders might want to note that the dynamics of the expiry are such that BTC’s market price could be lifted toward a very specific point: $75,000.
Deribit, the world’s largest crypto options exchange, will settle bitcoin options contracts worth $14.16 billion on Friday at 08:00 UTC. This means nearly 40% of all open interest – the dollar value of all active contracts on the exchange – ware set to expire in roughly 48 hours. On Deribit, one options contract represents one BTC.
Options are contracts that let you bet on whether the price of an asset, such as BTC, will go up or down. A call option is a bet that the price will go up, and a put option is a bet that it will go down. Traders buy options to try to profit from price swings, or write (short) options to earn income while taking on the risk that prices move in favor of the buyer.
Here’s why the expiry matters
According to Deribit’s data, the ‘max pain’ price — the level where the most contracts would expire worthless (lottery tickets that don’t win) — sits right at $75,000.
As such, this level could act as a magnet, according to Deribit’s Chief Commerical Officer Jean-David Péquignot.
“With Bitcoin currently trading near $71k, the $75k Max Pain price represents a gravitational pull. Historically, this encourages delta-hedging by market makers that can drive prices toward the strike where the most options expire worthless,” Péquignot told CoinDesk.

Here’s how it works. As per the max pain theory, option writers — typically large funds, institutions, or market makers with ample capital — control or influence the spot price toward the pain point to limit payouts to buyers and thereby inflict maximum damage on them. This happens through normal trading in the spot or futures markets, rather than as a guaranteed manipulation.
This mechanical buying and selling often pulls the spot price closer to the max pain level, which is $75,000 in bitcoin’s case.
While max pain is well-known in traditional markets, its influence on crypto remains debated. Deribit, however, flags the level as a potential magnet. Adding to the intrigue, several analysts have identified $75,000 as key resistance, above which bitcoin could go into a full-bull mode.
Controlled expiry
Quarterly expiries typically spark massive position adjustments and hedging flows. Still, the impending expiry is likely unfold normally, without an outsized volatility surge.
That’s evident from the decline in the implied volatility index.
“Over the last sessions, we have witnessed an implied volatility (IV) compression, with both BTC and ETH DVOL dropping by ~6 points. This suggests the market is pricing in a controlled expiry rather than an immediate explosion in volatility,” Péquignot said.
He added that the market data suggests that traders aren’t chasing a breakout as geopolitical uncertainty in the form of Iran war lingers. He specifically pointed to call writing by institutions at higher strikes (levels above going spot price) as the evidence of measured bullish sentiment. Traders typically write overhead calls to collect premiums on top of their spot market holdings.
“The Put/Call ratio for Bitcoin options remains healthy (0.63), but the concentration of sell-side calls suggests a ceiling of institutional resistance as traders have been overwriting their positions to bank premium while waiting for the geopolitical clock to run out,” he noted.
All in all, the big expiry with $75,000 acting as a magnet comes at an intriguing juncture: bitcoin has held up remarkably well through the Iran war turbulence, maintaining strength even as equities wobble and energy markets remain fickle.

XRP price is trading at $1.46, up 2% in 24 hours, and quietly outpacing both Bitcoin and Ethereum on a relative basis. The move builds on a breakout through $1.43 resistance that held traders hostage for weeks, and the volume behind it was anything but big.
The breakout accelerated yesterday when volume surged above $3.6 billion and forced the price through the $1.43 ceiling. XRP briefly tagged $1.50 before profit-taking pulled it back toward $1.45.
Meanwhile, network activity and institutional adoption metrics have been accelerating in parallel, adding structural weight to the technical setup.
Bitcoin sits at $81,000, and Ethereum is stalling at $2,330. Both are consolidating, and both also need triple-digit percentage gains to reach analyst targets.
Discover: The best crypto to diversify your portfolio with
Can XRP Price Hit $2 Short-Term, and Is $10 A Realistic Target?
XRP is holding above the prior breakout zone at $1.44–$1.45, which has flipped from resistance to support. As long as the price stays above it, the bullish thesis remains intact. Immediate resistance sits at $1.50, where sellers returned aggressively after the session high. A sustained close above $1.50 reopens momentum toward $1.60 first, then the $1.80 zone.
The scenario map breaks down cleanly. If XRP absorbs the $1.50 rejection, it could consolidate in a tight range to reclaim $1.50 on volume, which targets $1.80 and eventually $2.35 resistance. In this scenario, a breakout at that level points toward $3–$5.
We place the $10 trajectory in the context of XRP’s 580% surge from $0.50 to $3.40 between late 2024 and January 2025, a move that established the asset’s capacity for violent repricing. The $10 target is not fringe. A trader consensus is building around $10 before 2026 closes, citing regulatory clarity post-SEC settlement, RippleNet expansion, and Ripple Payments adoption by firms including Rakuten.
Discover: The best pre-launch token sales
LiquidChain Presale Approaches $750K as Cross-Chain Infrastructure Gains Attention
XRP’s outperformance reflects a market rotation into assets with clear utility narratives and institutional catalysts. But now, already more than 200% above its 2024 pre-surge levels, the asymmetric upside available to late entrants is structurally compressed compared to what early holders captured. That gap is driving renewed interest in early-stage infrastructure plays where price discovery has barely begun.
LiquidChain is one project attracting that attention. Positioned as a Layer 3 cross-chain infrastructure layer, it fuses Bitcoin, Ethereum, and Solana liquidity into a single execution environment. It is here, solving the fragmentation problem that forces traders and developers to manage separate positions across disconnected ecosystems.
The final layer emerges. — LiquidChain (@getliquidchain) May 10, 2026
LiquidChain is the future.  ⟁https://t.co/vqvBcdSQYC pic.twitter.com/gAhIyFxdXV
The presale is currently priced at $0.01458 per $LIQUID token, with $750K raised to date, and 1470% APY staking bonus. Key architecture features include a Unified Liquidity Layer, Single-Step Execution, Verifiable Settlement, and a Deploy-Once Architecture that lets developers access BTC, ETH, and SOL ecosystems without redeployment overhead.
Explore LiquidChain’s presale details here.
The post XRP Price Outperforms ETH and BTC: $2 Next Target as Ripple Token Eyes $10 appeared first on Cryptonews.

Strategy CEO Phong Le believes there is more to the company than the Bitcoin (BTC) on its balance sheet. Le stressed that the company’s enterprise business model remains a key part of operations after it posted its strongest financial quarter in a decade.
Enterprise Software Remains a Core Part
Le believes that its enterprise software business remains a crucial part of the company’s long-term plans. The software business serves over 3,000 customers and 500,000 active users, along with Fortune 500 companies, leading banks, healthcare companies, retailers, and government agencies.
According to Le, the software side of Strategy’s business, comprising engineers, enterprise customers, cloud teams, compliance systems, and global operations, gives the company an edge over other digital asset firms. However, Le’s arguments can only hold if the software side of Strategy’s business continues growing while competing with its Bitcoin strategy for investor attention.
Record Financial Quarter
Le highlighted Strategy’s stellar Q1 2026 performance to back his argument. The Bitcoin treasury company reported $124.3 million in total Q1 2026 revenue, up 12% from $111.1 million a year earlier. Strategy also reported $83.4 million in gross profit with a 67.1% gross margin. Le stated that Q1 2026 was the company’s strongest quarter in over a decade, supported by a 12% revenue growth and a 59% growth in cloud revenue. Controllable margin increased by 27%, helping Strategy fund its Bitcoin operations.
Bitcoin Strategy Under Scrutiny
Strategy’s Bitcoin strategy has come under intense scrutiny in recent months as debt and losses mount. The company reported a $12.54 billion net loss, significantly higher than the $4.22 billion loss in the same period last year. Strategy raised over $25 billion in 2025 to fund its Bitcoin operations. Strategy co-founder Michael Saylor recently said during an earnings call that the company could strategically sell some of its Bitcoin holdings to fund dividend obligations. Saylor’s comments have worried investors about the impact of such a move on the asset’s price.
Le sought to calm market jitters, clarifying that the company will sell BTC only in specific cases, adding that it will sell a small portion of its holdings to pay dividends on its Series A Perpetual Stretch Preferred Stock (STRC) and to offset taxes. The STRC pays 11.5% dividend to holders. Strategy currently holds 818,334 BTC, valued at around $66 billion.
Disclaimer: This article is provided for informational purposes only. It is not offered or intended to be used as legal, tax, investment, financial, or other advice.
Crypto World
Bitcoin (BTC) funds capture $700 million as institutions place their bets: Crypto Daily
This is an excerpt from CoinDesk newsletter ‘Daybook.’ Sign up here, if you haven’t already.
Institutional demand for crypto is real, and suggests there may be a sustained bitcoin price move above its pivotal 200-day simple moving average (SMA).
Investors poured $858 million into crypto funds issued by asset managers like BlackRock and 21Shares last week, extending a five-week inflow streak and marking the strongest weekly total since late April, according to CoinShares.
More importantly, bitcoin funds alone pulled in over $700 million, taking year-to-date flows to $4.9 billion. Talk about the demand for the leading cryptocurrency. The catalyst? Improving sentiment around the Clarity Act, according to CoinShares’ head of research, James Butterfill.
Bitcoin recently traded at $81,000, having narrowly missed the 200-day SMA positioned above $82,000 late Sunday. That’s the second such near miss since last week. Prices remain above $80,000, indicating that bulls are simply taking a breather, not retreating.
Analysts say the next big leg higher could unfold once prices top $82,000, effectively rising above the 200-day SMA, which is largely seen as a barometer of long-term trends.
“The clean next step is a daily close above $82,000 with steady spot demand. Without that, it can chop between $79,000 and $82,000 while macro sets the tone,” analysts at Marex said.
On the downside, immediate support is seen around $80,400, and the broader demand zone remains between $78,200 and $78,600., according to Vikram Subburaj, CEO of India-based Giottus.com, said in an email.
In the broader market, Sui blockchain’s SUI has surged 12% to $1.26 in 24 hours. The rally comes as developers behind the blockchain look to foray into privacy. Adeniyi Abiodun, co-founder and chief product officer of Mysten Labs, the development team behind Sui, posted on X that confidential transactions on Sui will be introduced this year, enabling fee-free privacy-preserving payments at scale.
Last week, Nasdaq-listed Sui Group Holdings (SUIG) said that it had staked most of the $108.7 million worth of SUI tokens in its treasury, removing roughly 2.7% of supply from the active market. That likely greased the bullish momentum.
The other major gainer is XDC Network’s XDC token, which climbed over 10%. Several other tokens, such as KAS, HASH and ATOM , have gained 5% or more in 24 hours.
In traditional markets, U.S. Treasury yields rose as dimming hopes of U.S.-Iran peace deal kept oil prices elevated. Stay alert!
Read more: For analysis of today’s activity in altcoins and derivatives, see Crypto Markets Today . For a comprehensive list of events this week, see CoinDesk’s “Crypto Week Ahead.”
What’s trending
Today’s signal

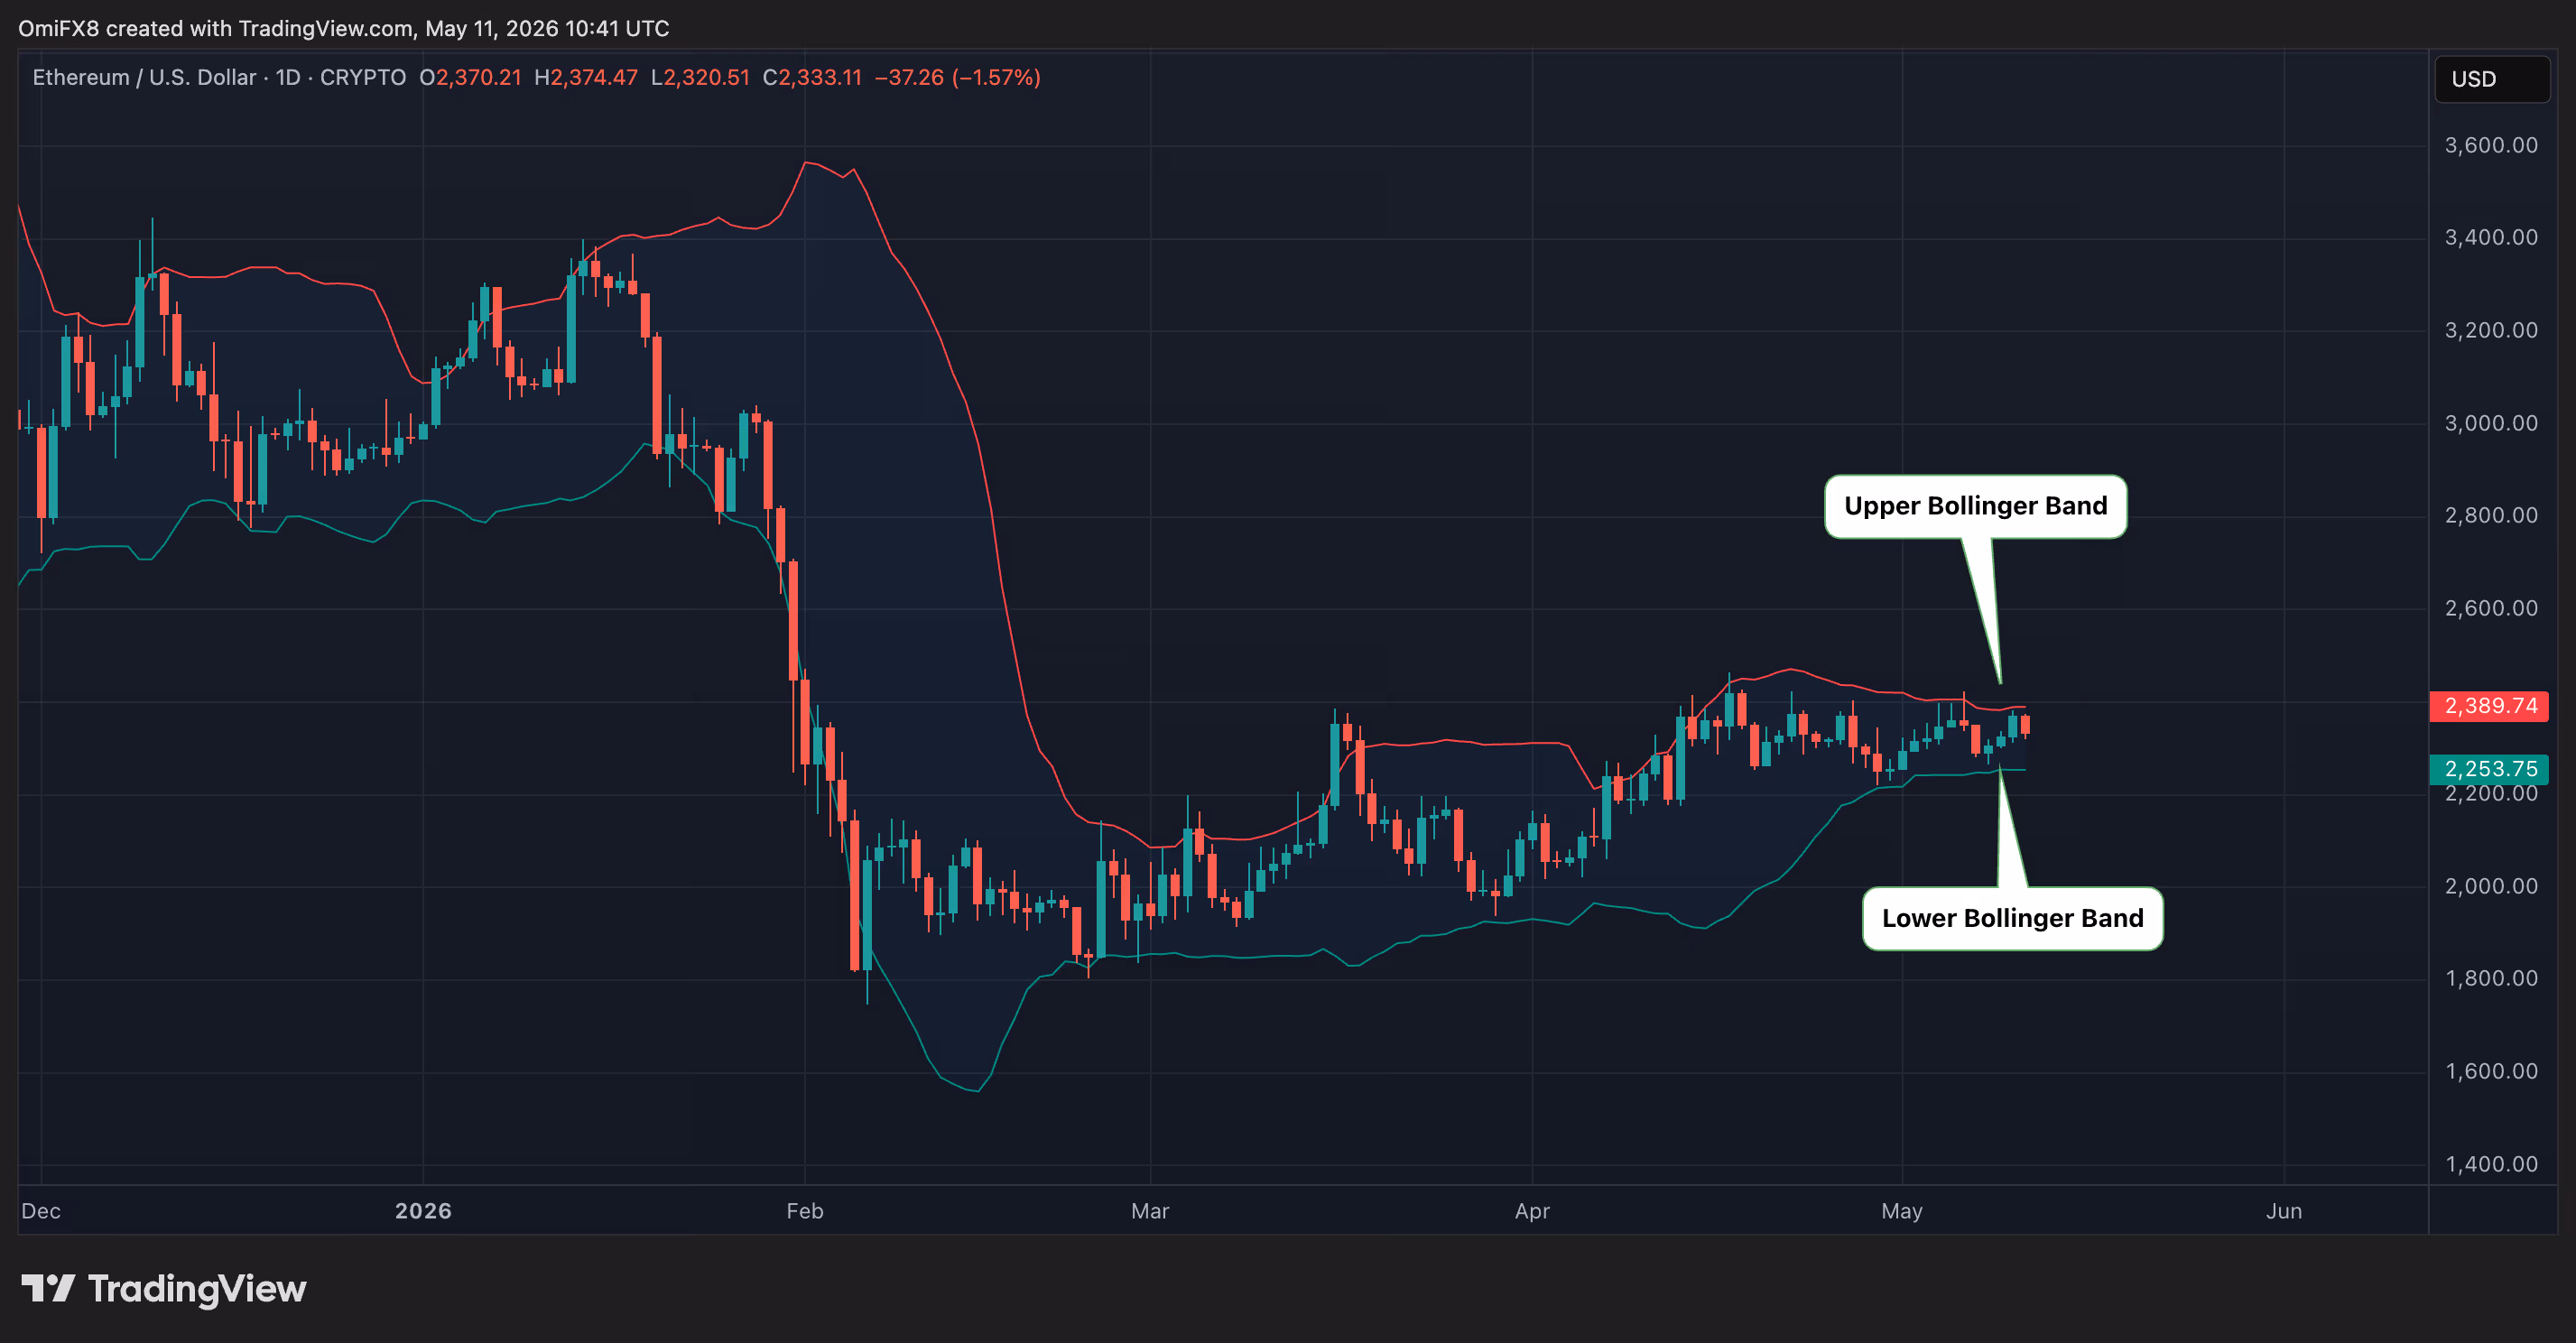
The chart shows ether’s (ETH) daily price swings in candlestick format since late 2025. Overlaid are Bollinger Bands, which are volatility bands placed two standard deviations around the 20-day moving average of the price.
The gap between upper and lower bands is currently the narrowest since late 2023. In other words, at their tightest in 2.5 years, signaling an extended period of compressed volatility.
Such tightening typically reflects a market in equilibrium, with both buyers and sellers unwilling to lead the price action. Such low-volatility phases tend not to persist for long, often resolving into sharper directional moves once bulls or bears reassert dominance.
In short: Watch out for a large directional move ahead.

A Bitcoin whale wallet that has been dormant since November 2013 is making huge news. The wallet moved 500 BTC, worth $40 million, to a new address at 19:16 UTC on Sunday, triggering a panic, although the destination address is not linked to any known exchange.
The transfer originated from address 1KAA8GGhVjjUjVTz1HKAjCyGNzAKQd882j, funded in late 2013 with probable mining rewards per Blockchair data, and landed at bc1qm6m6d33d02edr0k8yj9jgt027zl6dvx6thjrxy, a Bech32 native SegWit address created just the previous day on May 10, 2026. Freshly generated destination address, decade-old source wallet.
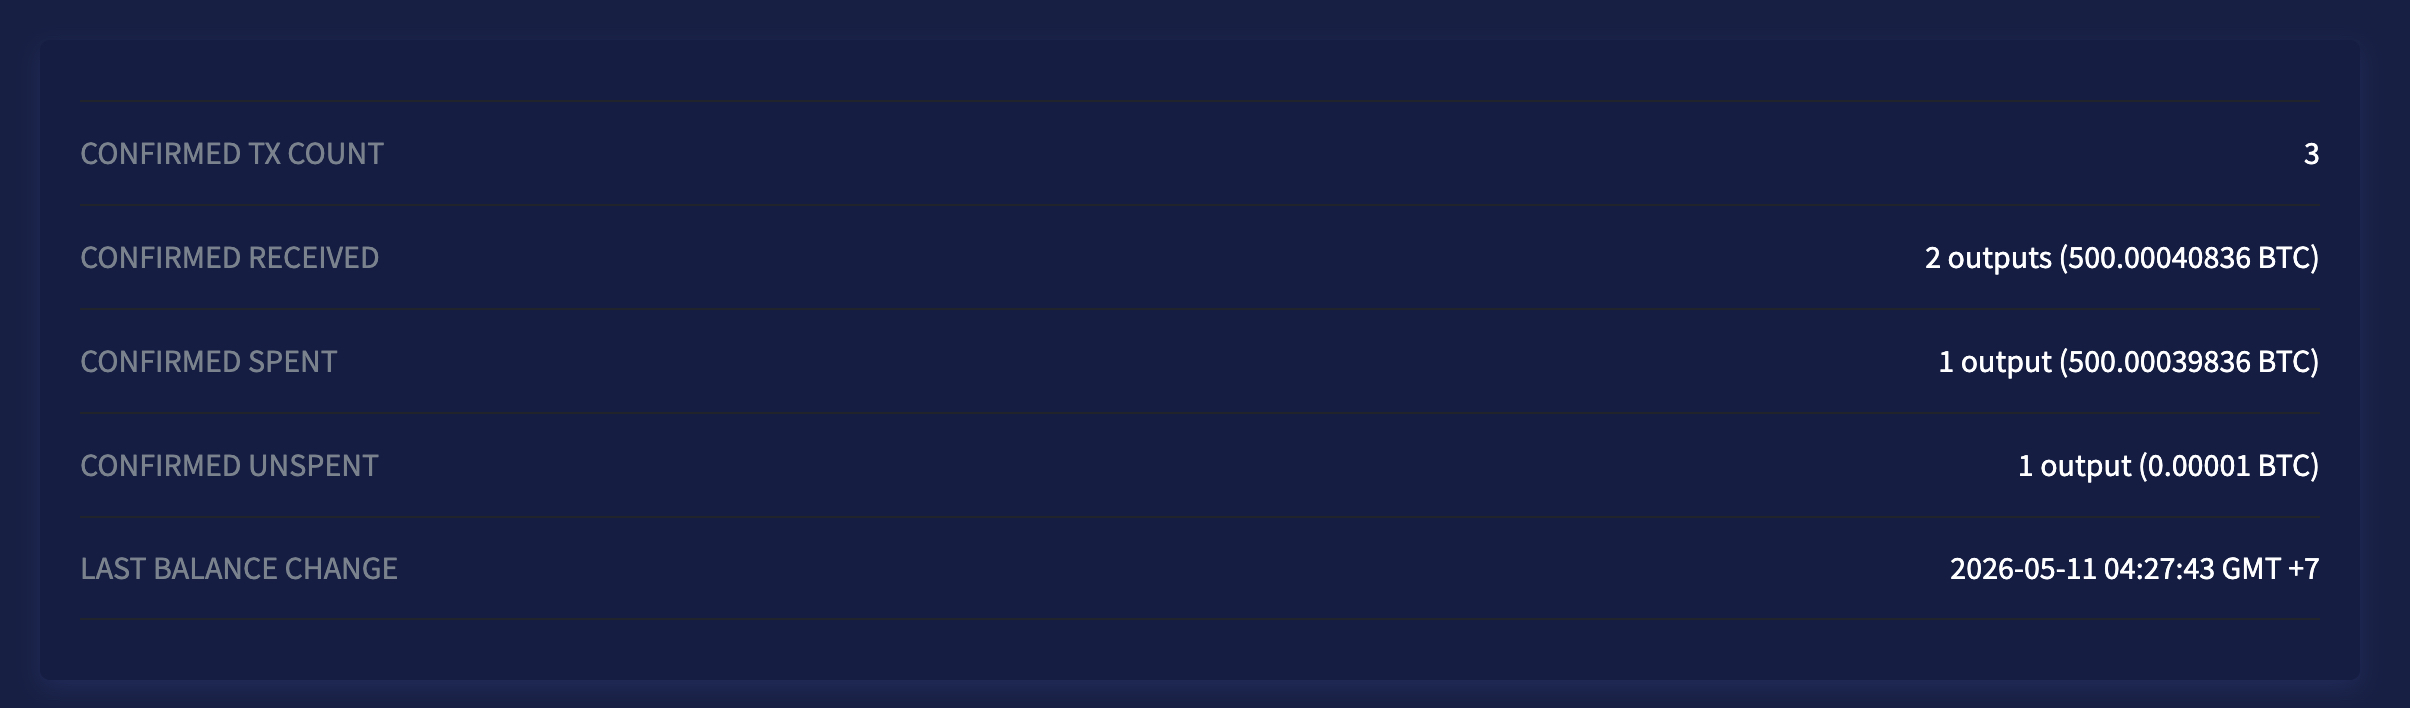
However, the transaction fee was 0.0001 BTC, or just $8 at current prices. For context, typical BTC exchange inflow transactions have average fees that are 10 times higher, according to Chainalysis’s 2026 Crypto Crime Report. Low fees signal non-urgent intent, with the whale not racing to hit a bid on a centralized exchange before the market moves.
Arkham Intelligence’s address labeling flags the destination format as consistent with custodial OTC desk infrastructure, matching patterns used by institutional counterparties for privacy-preserving large transfers.
The coins in this wallet qualify as a genuine Satoshi Era holding. The whale acquired when BTC traded under $100, now worth $40 million at $80,700 spot.
Discover: The best pre-launch token sales
Bitcoin News: Exchange Dump or OTC Absorption?
If this resolves as an OTC transaction, the sale is absorbed off-book, order-book depth is unaffected, and the spot price impact is minimal. If the coins route to a centralized exchange hot wallet, that is a different conversation entirely.
Ki Young Ju of CryptoQuant called it plainly on May 10: “Classic OTC prep, not dump pressure, low fees and non-CEX destination scream institutional.”
Lookonchain data reinforces that read: 72% of 2026 whale moves involving BTC dormant more than seven years resolved as OTC within 48 hours, per their tracking dashboard. T
A comparable November 2025 event, 500 BTC moved from a 2012 wallet to a Wintermute-linked address, was later confirmed OTC by the firm’s executives directly. The structural fingerprints here are nearly identical: aged UTXO, fresh SegWit destination, minimal fee, no exchange association. The data points toward OTC, not exchange sell pressure.

OTC desks typically distribute 10–25% of a position daily to avoid slippage. If outflows from that address begin routing toward known exchange deposit wallets, the thesis flips. Glassnode’s Exchange Inflow Multiple report, due May 14, will provide the aggregate view on whether dormant supply is hitting order books at scale.
Bitcoin was trading at $80,700, down just over 1% since midnight, as the market absorbed geopolitical headwinds that have kept BTC range-bound below the $83,000 resistance cluster.
Discover: The best pre-launch token sales
The post Bitcoin News: $40M Dormant BTC Whale Making A Move After 13 Years appeared first on Cryptonews.


Crypto traders paid annualized fees of 8,700% to service a leveraged, synthetic bet on the valuation of Anthropic.
Even as the privately-held AI giant neared a $1 trillion valuation, some paid 1% per hour, imputing an expected Anthropic rally to $88 trillion within a year, just to cover the cost of their leveraged long.
For context, the most valuable publicly-traded company in the world today, Nvidia, has a market capitalization of $5.2 trillion.
Worse, the market they selected doesn’t actually deliver real Anthropic shares.
A combination of arcane terminology and abbreviations, off-page terms of service, a small open interest cap, and a simplified interface for trading compressed those disturbing realities into an easy-to-click “Buy” button alongside a flickering price chart.
Normally, short-sellers pay their brokers for the privilege of loaning out shares to sell first, with the hopes of buying back cheaper later.
In the topsy-turvy world of crypto, buying long exposure to Anthropic was even more expensive than shorting over the weekend.
Paying 8,700% annualized fees to bet on Anthropic
Because Anthropic isn’t publicly traded, crypto exchange Hyperliquid lists a USDH-denominated contract using the Ventuals deployer on $7.5 million worth of Anthropic open interest partially based on Notice’s estimate of Anthropic’s valuation.
If you didn’t understand the above sentence, you haven’t read the full terms of service for ANTHROPIC on Hyperliquid and are probably no different than many traders who bought it anyway.
USDH calls itself a stablecoin, even though it’s traded between $0.72 and $1.11 over the past year.
In addition, Notice doesn’t actually know the real-time value of Anthropic.
Moreover, the whole artifice relies on two proprietary altcoins plus innumerable service provider risks.
Despite these stratospheric risks, traders paid up to 1% per hour to use 3x leverage on Anthropic’s private valuation.
For most of the past two days, the contract traded well above the Notice oracle’s reference price, forcing longs to pay hourly funding rates to shorts. Those payouts briefly made shorting one of the most-hyped AI companies a de facto, high-yield income strategy.
Don’t worry, funding is capped at 4% per hour
Incredibly, Hyperliquid settles funding rates hourly and caps them not at 1% but at 4% per hour.
On Hyperliquid’s ANTHROPIC, the hourly rate exceeded 1.5% over the weekend, equivalent to annualized fees in the five-digit percentages.
Across a 48-hour period this weekend, longs paid shorts over 15% of their position size in funding alone. That isn’t a typo. A $10,000 long with no Anthropic valuation movement at all would have bled $1,500 to the short side within two days.
Disclosures explaining these losses exist on off-webpage disclosures. In essence, the gap between the contract’s mark price and Notice’s oracle reference drives the funding rates on Ventuals contracts on Hyperliquid.
On the ANTHROPIC Ventuals contract, Notice’s oracle sat near $934 while Hyperliquid Ventuals traders paid over $1,060.
Each unit on Ventuals represents $1 billion of valuation, so those numbers translate to a $934 billion oracle-implied valuation relative to a $1.06 trillion Hyperliquid exponential moving average or “mark” valuation.
That 13.6% premium of mark over oracle, which varied by the hour, is what generated the lavish payouts to anyone willing to short Anthropic.
Read more: Sam Bankman-Fried’s $500M stake in AI startup ‘irrelevant’, prosecutors say
Fake shares in a real Anthropic
In February 2026, Anthropic closed a $30 billion Series G led by GIC and Coatue at a $380 billion post-money valuation. Annualized revenue then increased from $9 billion at year-end 2025 to $30 billion by April.
Forge Global’s CEO Kelly Rodriques told Business Insider that secondaries had pushed the implied price near $1 trillion within three months.
Bloomberg and the Financial Times have since reported that a fresh round near $900 billion is being lined up with Dragoneer, General Catalyst, and Lightspeed.
Notice is a private-market data vendor. Its algorithm folds private-market trade prints, bids and offers, fresh funding announcements, valuation marks of funds, appraisals, and a peer basket of listed companies, all into a single number.
Notice publishes its number with a three-second refresh.
Ventuals on Hyperliquid also discloses its lack of equity transference directly. “When you have a position in a company on Ventuals, you do not have any underlying economic ownership in the company – you’re merely speculating on its valuation change.”
Its documentation reiterates, traders “trade valuations, not shares.”
Although Anthropic funding rates on Hyperliquid annualized in the four- and even five-digit percentages over the weekend, they’ve settled down to triple- and double-digit rates as of publication time.
As funding rates fluctuate by the hour, no Anthropic shares ever need to change hands for bearish traders to be paid by exuberant bulls.
Got a tip? Send us an email securely via Protos Leaks. For more informed news and investigations, follow us on X, Bluesky, and Google News, or subscribe to our YouTube channel.

Key Takeaways
- Hims & Hers Health delivers Q1 2026 financial results following Monday’s market close on May 11
- Wall Street forecasts revenue between $616M and $619M, representing merely 5.2% annual growth — a dramatic slowdown from the 111% expansion witnessed in Q1 2025
- The telehealth platform secured an agreement with Novo Nordisk in March, obtaining authorization to distribute branded Wegovy and Ozempic — however, sales commenced March 26, limiting first-quarter financial contribution
- Earnings per share projections land at 3–4 cents, reflecting an approximately 90% decline compared to last year’s results
- Shares have surged nearly 50% during the previous month despite substantial short interest exceeding 35% and a predominantly neutral analyst consensus from 17 Wall Street firms
Heading into Monday’s quarterly disclosure, Hims & Hers Health (HIMS) trades at $28.46, posting gains of roughly 32% across the last 30 days and climbing approximately 77% from its February 27 fifty-two-week bottom. Yet the telehealth stock remains underwater for 2026, declining more than 23% year-to-date.
Hims & Hers Health, Inc., HIMS
Analysts characterize this upcoming report as a “transitional quarter.” Revenue projections cluster around the $616M–$619M range, translating to merely 5.2% year-over-year advancement. This marks a significant deceleration from the exceptional 111% revenue expansion HIMS achieved during the comparable period last year.
The dominant narrative surrounding this earnings release centers on the company’s strategic transition from compounded GLP-1 weight-management medications to branded Novo Nordisk alternatives. Following Novo Nordisk’s withdrawal of its patent litigation on March 9, both organizations finalized an arrangement granting HIMS distribution rights for Wegovy and Ozempic via its digital healthcare platform.
Timing presents a complication, however. These branded pharmaceutical products became available through the platform starting March 26. Since the first quarter concluded March 31, meaningful revenue contribution will probably materialize in Q2 reporting instead.
Subscription Metrics Under Close Examination
Wall Street will scrutinize subscriber acquisition and retention metrics carefully. HIMS surpassed 2.5 million active subscribers approaching the conclusion of 2025 — representing 16% growth from the 2.2 million subscriber count recorded at 2024’s end, and substantially exceeding the 1.5 million subscribers from late 2023.
Customer retention carries equal importance. Approximately 82% of platform users continue their subscriptions past the three-month threshold, while roughly 90% of recurring revenues originate from the established customer cohort. Should HIMS demonstrate stable or expanding subscriber figures, it reinforces confidence in full-year financial projections.
Profitability expectations remain modest — consensus estimates place earnings per share at just 3 to 4 cents, marking roughly a 90% annual contraction. While this deterioration may already factor into current valuations, any downward surprise could intensify selling pressure in a security already experiencing significant short-seller activity.
Wall Street Maintains Reserved Outlook
Among the 17 analysts providing HIMS coverage, four assign Buy ratings, 12 recommend Hold positions, and one issues a Sell rating. The consensus twelve-month price objective stands at $31.86 — approximately 12% above Friday’s closing price of $28.46.
Short interest positioning remains substantially elevated above 35% of available float, equating to approximately 70 million shares held short. With a volatility beta of 2.43, this equity demonstrates pronounced price movements in either direction.
Institutional accumulation accelerated during Q1, with institutional selling activity 88% below buying volume — marking a significant reversal from the considerable institutional outflows observed throughout Q4 2025.
The Food and Drug Administration has additionally proposed eliminating semaglutide, tirzepatide, and liraglutide from its 503B bulks inventory, which would retrospectively validate HIMS’s strategic decision to abandon the compounded GLP-1 segment.
HIMS has fallen short of Wall Street’s revenue projections on multiple occasions throughout the previous twenty-four months. Financial results are scheduled for release following Monday’s trading session on May 11.

Disclosure: The author of this story owns shares in Strategy (MSTR).
When executive chairman Michael Saylor confirmed on Strategy’s (MSTR) Q1 2026 earnings call on May 6 that the company was prepared to sell bitcoin, it appeared to mark a shift for the world’s largest publicly traded corporate holder of the cryptocurrency. But the move would not be unprecedented. In December 2022, Strategy sold bitcoin for tax-loss harvesting purposes — the same rationale the company now appears to be signaling to the market once again.
On Dec. 22, 2022, Strategy sold 704 bitcoin for approximately $11.8 million at $16,776 per coin, but immediately repurchased 810 bitcoin two days later.
The sale was designed to carry back capital losses against previous gains and generate a tax benefit. A tax loss harvesting event.
“MicroStrategy plans to carry back the capital losses resulting from this transaction against previous capital gains, to the extent such carrybacks are available under the federal income tax laws currently in effect, which may generate a tax benefit”.
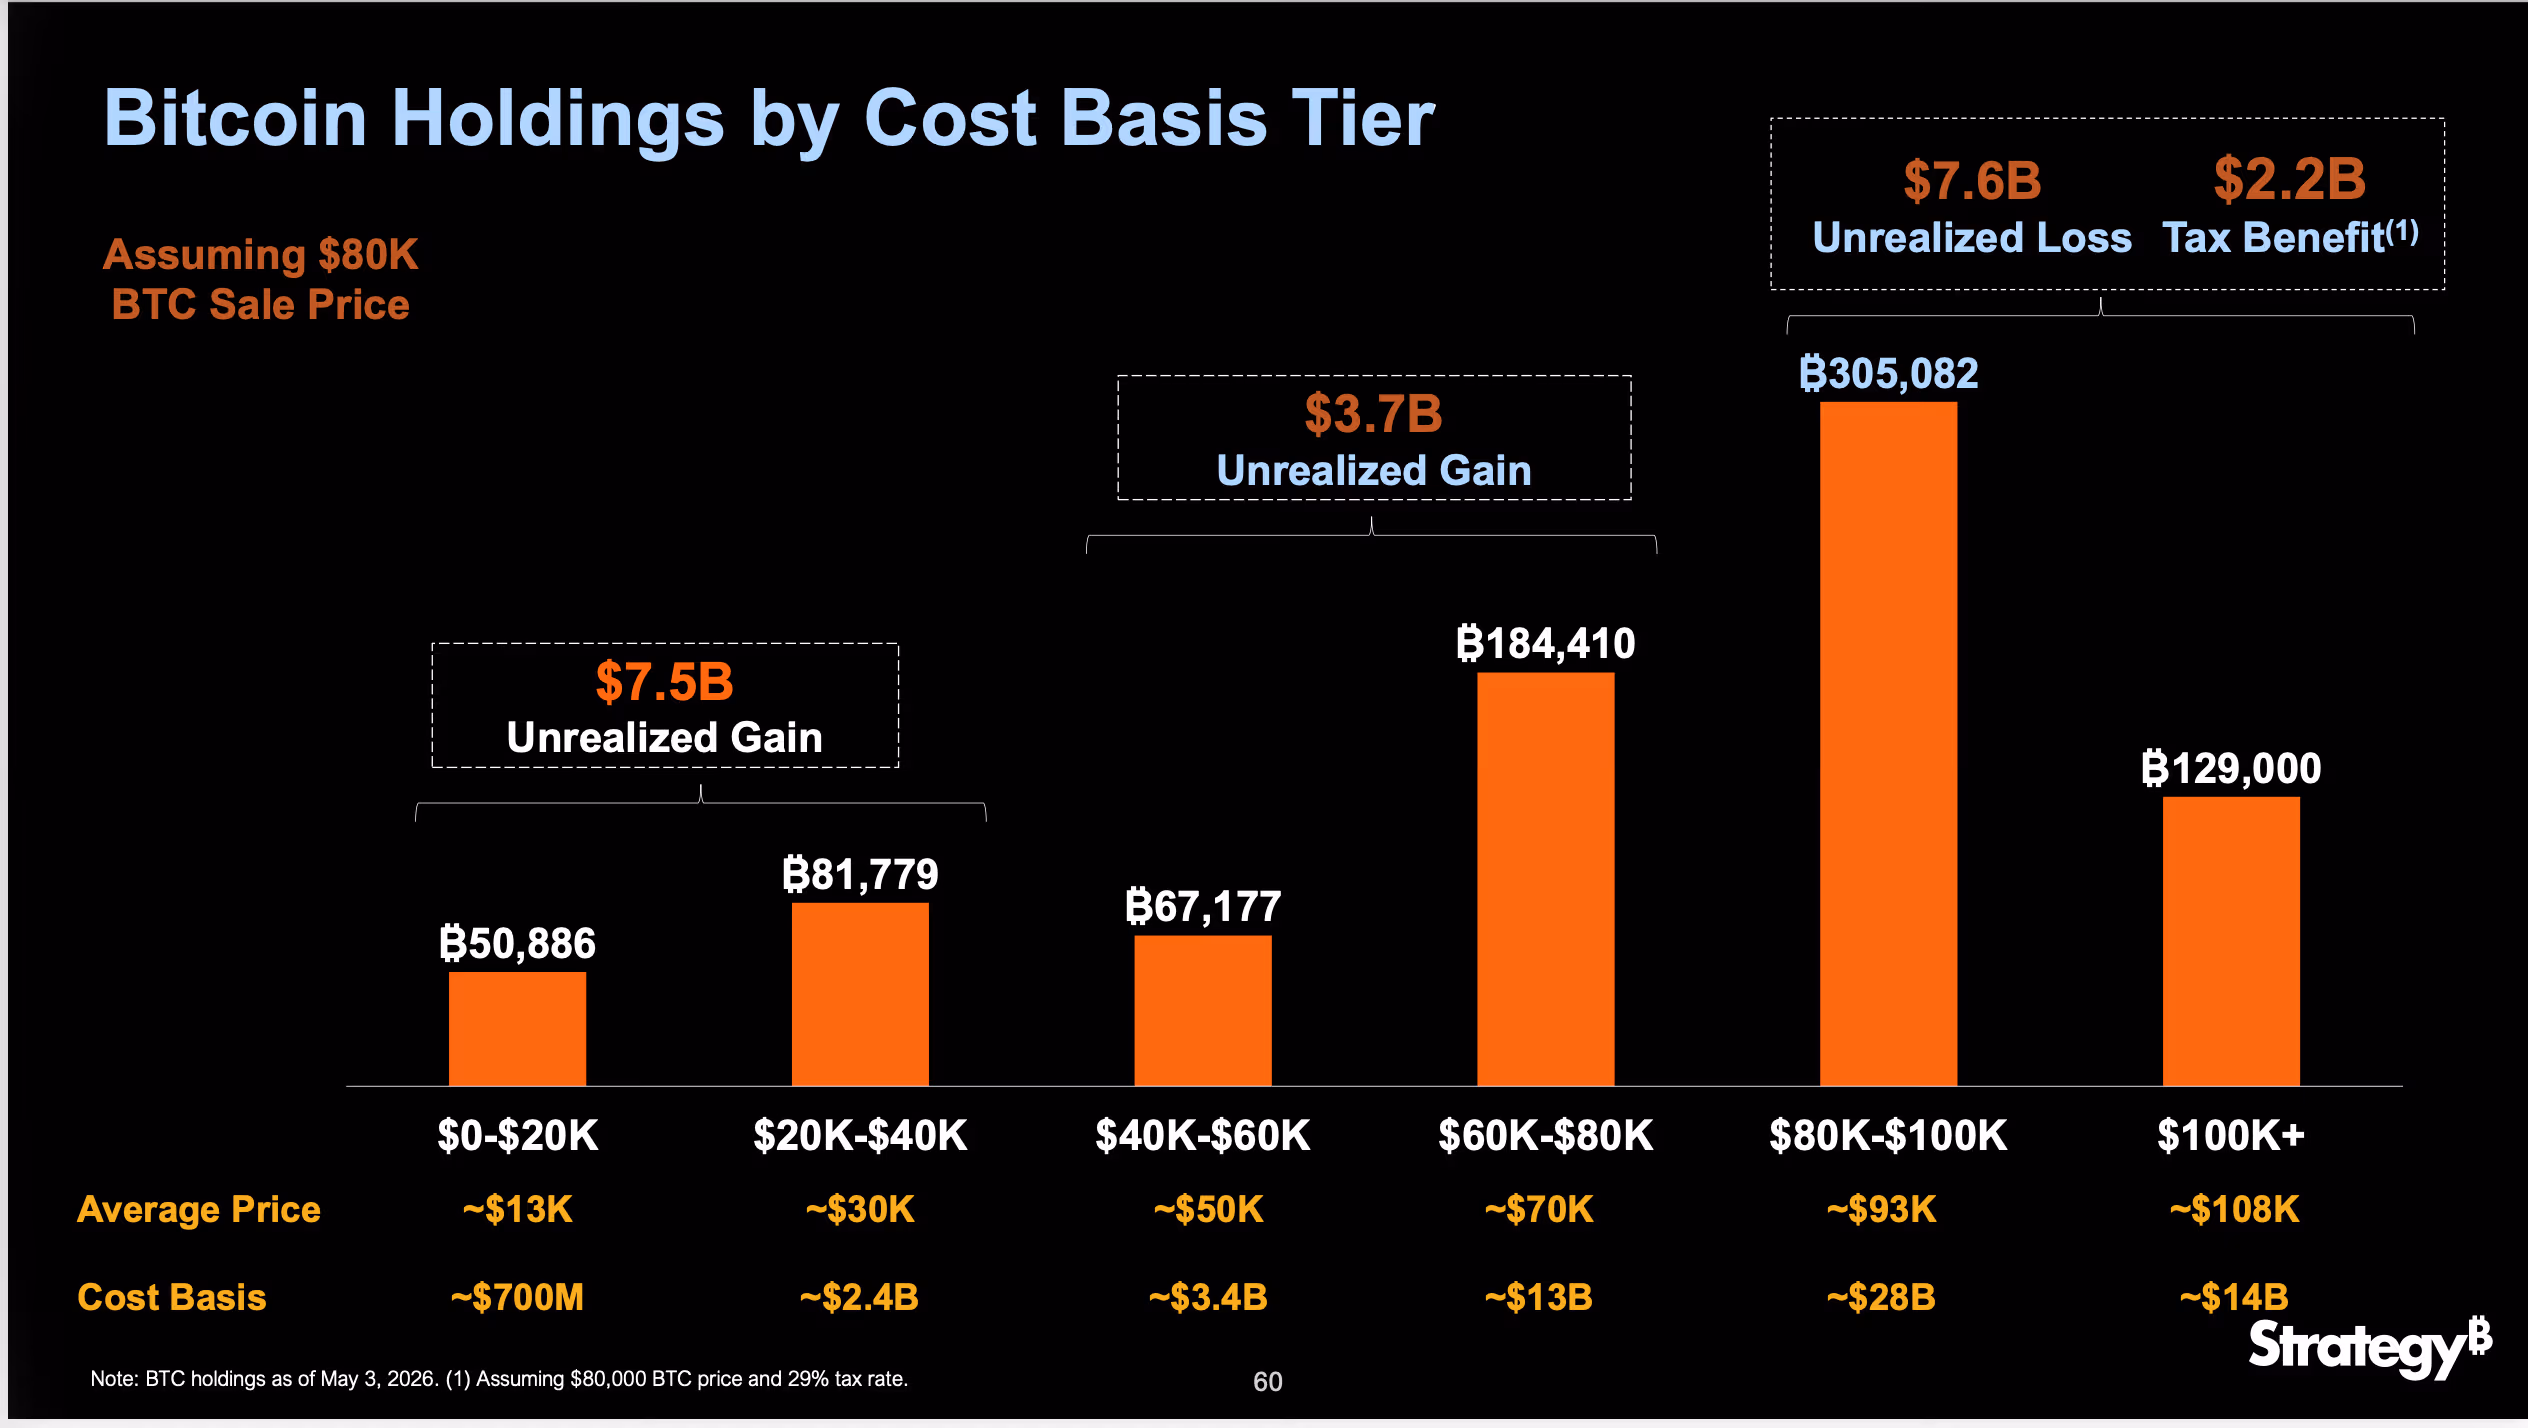
Bitcoin fell 23% in Q1 2026, from $87,500 to $67,700. Under FASB fair value accounting rules adopted Jan 1, 2025, Strategy marks its entire bitcoin holdings to market every quarter, in Q1 posted a $12.54 billion loss which pushed unrealized losses directly through the income statement and generating a $2.2 billion deferred tax asset across its higher cost basis holdings.
According to the MSTR earnings call, assuming an $80,000 bitcoin price, Strategy has purchased over 434,000 BTC above $80,000 generating a $7.6 billion unrealized loss and a $2.2 billion deferred tax asset at a 29% tax rate.

If bitcoin recovers and Strategy sells appreciated bitcoins, that $2.2 billion tax can offsets future gains.
The primary goal for the company is to increase “bitcoin per share” which is the ratio of Strategy’s total bitcoin holdings divided by its total diluted shares outstanding.
The use of proceeds from the bitcoin sale is to retire the $8.2 billion in convertible debt, purchase MSTR common stock when the multiple to net asset value falls below 1.22x or fund $1.5 billion in annual dividend obligations from its perpetual preferred stock Stretch (STRC).
MSTR is up 1% in pre-market trading, while bitcoin trades above $81,000.


- The Osmosis crypto price has surged on extreme trading volume and liquidity inflows.
- Cosmos governance rejection kept Osmosis independent and stable.
- Price now hinges on holding $0.065 and breaking $1 resistance.
The price of the Osmosis (OSMO) crypto has jumped sharply by nearly 200% in 24 hours, moving from a low near $0.03383 to around $1.

This sudden rally has placed the token among the strongest performers in the crypto market today, with trading activity and ecosystem developments both playing a major role in the move.
Notably, the price surge came alongside an extreme spike in trading activity, a shift in altcoin market flows, and a key governance outcome within the Cosmos ecosystem that removed uncertainty around Osmosis’s future structure.
Forces behind the Osmosis crypto price surge
One of the biggest drivers behind the sudden Osmosis crypto price surge is the dramatic rise in trading activity on the Osmosis decentralised exchange.
On-chain data shows a surge in 24-hour trading volume of more than 7,000%, reaching roughly $173.892 million, according to Coingecko data, at press time.
This level of activity is unusually high compared to the token’s typical liquidity profile and signals a sudden inflow of speculative capital.
This spike suggests that traders were actively rotating funds into Osmosis liquidity pools, likely driven by momentum strategies and short-term positioning.
When volume expands this rapidly relative to available liquidity, even moderate buying pressure can produce outsized price movements, which helps explain the sharp upward acceleration.
Another important factor is the broader market environment.
The Altcoin Season Index has risen to around 51, reflecting a mild shift in capital from major assets like Bitcoin into higher-risk altcoins.
In such an environment, mid-cap tokens tied to active ecosystems tend to experience amplified moves, and Osmosis has clearly benefited from this rotation.
The rally was also reinforced by a governance vote within the Cosmos ecosystem.
On April 17, 2026, a proposal to integrate Osmosis more directly into the Cosmos Hub narrowly failed.
While some market participants initially viewed integration as a potential long-term structural upgrade, the failure of the proposal removed uncertainty around Osmosis’s independence.
Following the vote, the Osmosis team confirmed that the network would continue operating independently, maintaining its current structure and focusing on profitability and user security.
The Cosmos Hub proposal to integrate Osmosis narrowly did not pass governance.
While this is not the outcome we thought was best for Cosmos, we want to thank the community, validators, and everyone who engaged deeply with the discussion.
Osmosis continues to operate as an…
— Osmosis 🧪 (@osmosis) April 17, 2026
This clarity appears to have reduced governance-related uncertainty and contributed to improved short-term sentiment.
At the same time, market conditions were already supportive.
The token was trading in a highly reactive range, and once momentum began building, price action accelerated quickly.
The combination of rising volume, altcoin inflows, and narrative confirmation created the conditions for a sharp upward breakout.
OSMO price outlook
From a technical perspective, the move in OSMO has the characteristics of a momentum-driven expansion phase.
The price nearly doubled in a single day, which is typically associated with speculative trading rather than gradual accumulation.
Eyes are not on the support near $0.065, which is an important level for the altcoin to maintain the bullish momentum.
If the token holds above $0.065, it could indicate consolidation after the initial spike.
A break above $1 and sustained trading above this level would suggest continuation of momentum, especially if trading volume remains elevated.
However, volume will play a decisive role in the next phase.
The same surge that pushed the Osmosis crypto upward could also reverse quickly if activity begins to fade.
A drop in trading volume below roughly $100 million would signal weakening participation and could increase the likelihood of a pullback.
If selling pressure increases, a breakdown below $0.055 would be an important bearish trigger.
Such a move would likely indicate that short-term traders are exiting positions after the sharp rally, potentially leading to a deeper retracement toward lower liquidity zones.
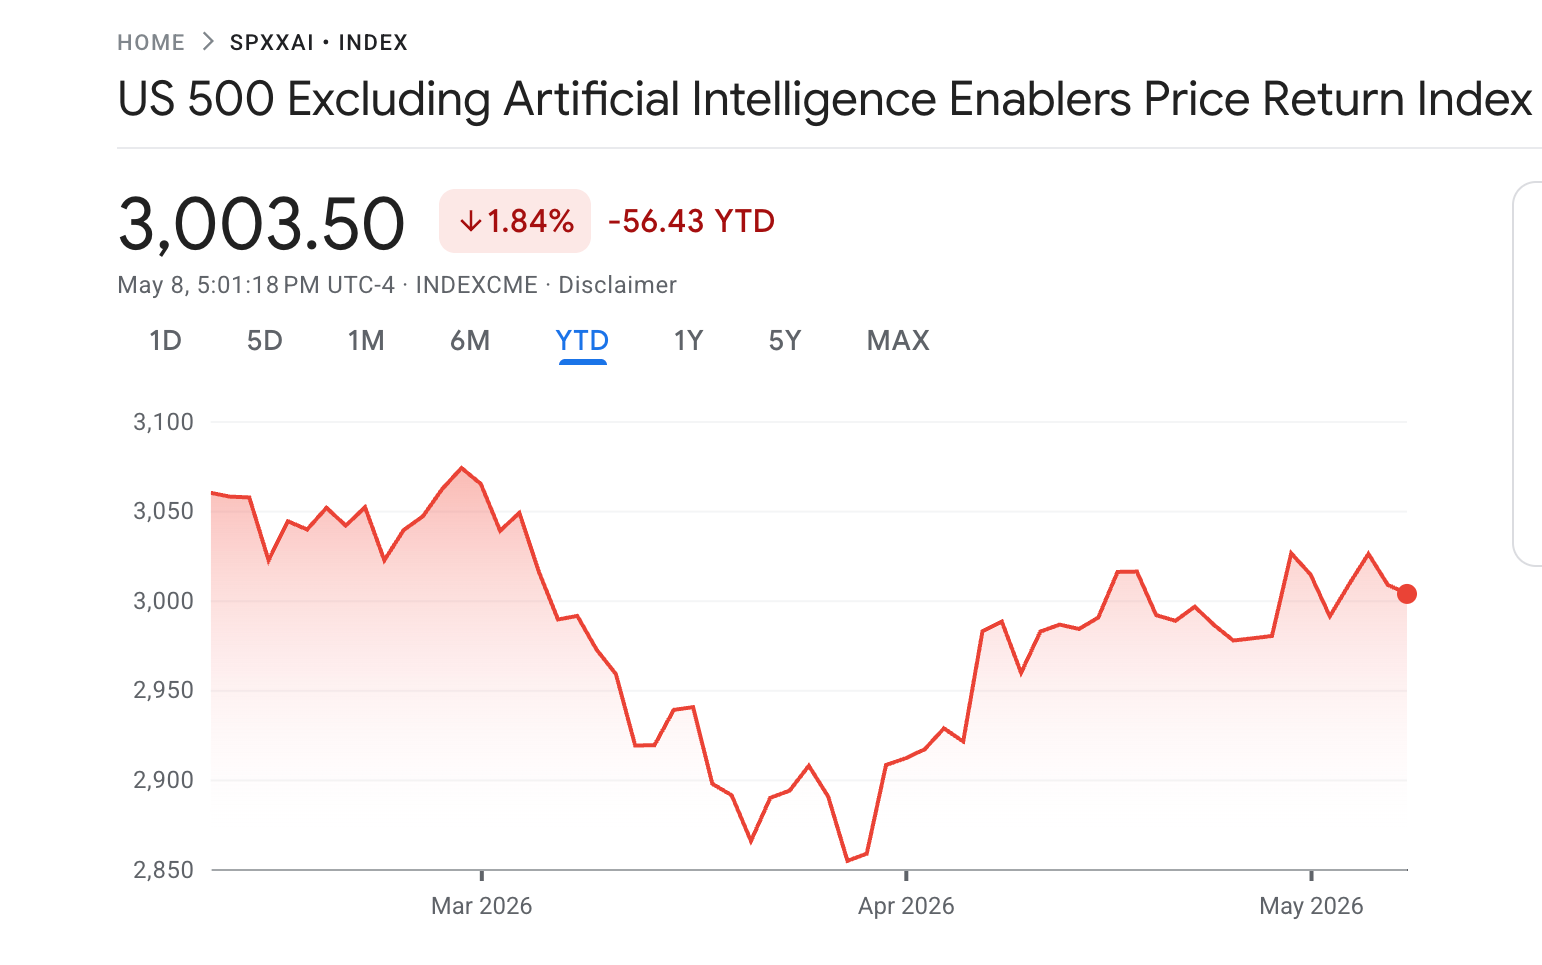
The S&P 500 has surged to fresh record highs in 2026, powering through milestone after milestone as Wall Street toasts another banner year.
Strip out the artificial intelligence stocks, though, and the rally all but disappears, leaving a market that has gone essentially nowhere since February.
S&P 500 ex-AI Index Flat Since February as Benchmark Climbs 8%
BeInCrypto recently reported that AI-linked stocks now account for a record 45% of the S&P 500’s market capitalization. Strong rallies in hyperscalers and AI-related stocks have helped push the index higher, as investors continue betting on the sector’s long-term growth potential.
The S&P 500 has climbed nearly 7% since early February. While the war-driven volatility caused notable losses in March, the rally accelerated in April, with the index gaining 15.5% since March 30.
However, the gains have not been evenly distributed across the market. According to Google Finance data, the US 500 Excluding Artificial Intelligence Enablers Price Return Index (SPXXAI) has fallen 1.84% since its February launch.
Follow us on X to get the latest news as it happens

Even after rebounding from its March lows, the index is up only around 5.07%. The contrast highlights how heavily AI-related stocks are driving the broader market rally.
Goldman’s earlier work flagged the divergence well before the current rally. Across three years through early 2026, the headline S&P 500 returned 76% versus 32% for the ex-AI version.
“The gap highlights how a handful of AI giants are driving nearly all market gains, fueling growing concerns that the current bull market is becoming dangerously reliant on the AI trade alone,” Coin Bureau wrote.
This is not just the case for US equities. Bloomberg recently reported that Asia’s AI-driven stock rally has been concealing broader market weakness, with surging tech shares offsetting the economic pressure and investor uncertainty stemming from the US-Iran conflict.
“Outside of AI, there is a genuine absence of catalysts, and many companies’ spending plans and margin outlooks remain on hold until there is greater clarity on the conflict,” said Fabien Yip, a market analyst at IG International.
While AI giants continue to lift headline indices to record highs, much of the broader market remains sluggish amid geopolitical tensions and economic uncertainty.
As a result, investor confidence increasingly hinges on whether the AI boom can continue sustaining market momentum on its own.
Subscribe to our YouTube channel to watch leaders and journalists provide expert insights
The post AI Stocks Drive Nearly All of S&P 500’s Gains, Data Reveals appeared first on BeInCrypto.
Crypto World
Solana Co-Founder Just Confirmed Near-Speed-of-Light Finality Is Coming Next Quarter: Is $150 Back on the Table?

Solana is surging back into focus after a huge Solana news drop. SOL price trades at $95.61, up 12% in the last 7 days, as a major protocol announcement out of Consensus Miami 2026 adds fundamental weight to an already-recovering chart.
Volume tells the real story, and something technical is coming that could redefine what “fast” means on-chain.
Solana co-founder Anatoly Yakovenko confirmed at Consensus Miami 2026 that the long-anticipated Alpenglow upgrade is on track to ship as early as next quarter.
“The Alpenglow release is basically due sometime this year, I think next quarter,” Yakovenko said during a fireside panel.
“That, to me, is this exciting step in the evolution of the protocol.” Alpenglow targets near-speed-of-light transaction finality, tightening confirmation guarantees to approach the physical limits of global data transmission.
For financial applications where milliseconds matter, this isn’t incremental. It’s architectural.
Solana News Bolsters TA: Can Solana Price Hit $150 Before the Alpenglow Launch?
SOL is pushing against a critical resistance band. Technical analysis confirms a breakout from an 8-week symmetrical triangle, with the daily EMA ribbon turning bullish for the first time since January.
That signal has historically preceded significant trending moves. Immediate resistance sits at $96 to $100. A clean break opens the path toward $136.15.
Binance Square analysts are projecting $150 on a confirmed break above $140, citing rising DeFi and NFT adoption alongside Western Union’s USDPT stablecoin launch on Solana via Anchorage as structural demand drivers.
Support holds at $85 to $88. That is the line that cannot break.
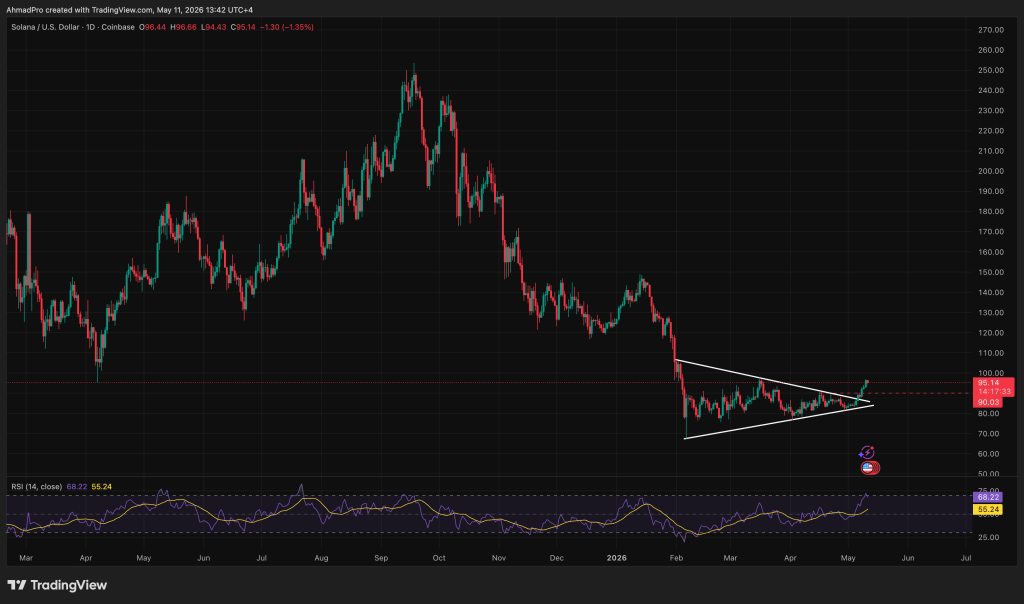
If BTC holds firm and SOL clears $100 on volume, the $136 to $150 target comes into play quickly.
If neither happens, price consolidates between $88 and $100 through the token unlock before attempting another push higher. Lose $85 on heavy sell pressure from the unlock event and the near-term bullish structure collapses.
The token unlock is the wildcard. 464,650 SOL worth roughly $38.90 million is releasing this week. Short-term supply shocks can override even the strongest narratives.
Watch volume closely on unlock day. Solana’s developer ecosystem momentum is a real structural tailwind, but it does not neutralize a poorly absorbed supply hit.
Can Bitcoin Hyper be The Solana of This Cycle?
SOL at $95 is compelling, but at this market cap, the asymmetric upside that early Solana buyers enjoyed simply isn’t available anymore. That window closed. Where does the next infrastructure-layer opportunity exist? (Rhetorical, but worth sitting with.)
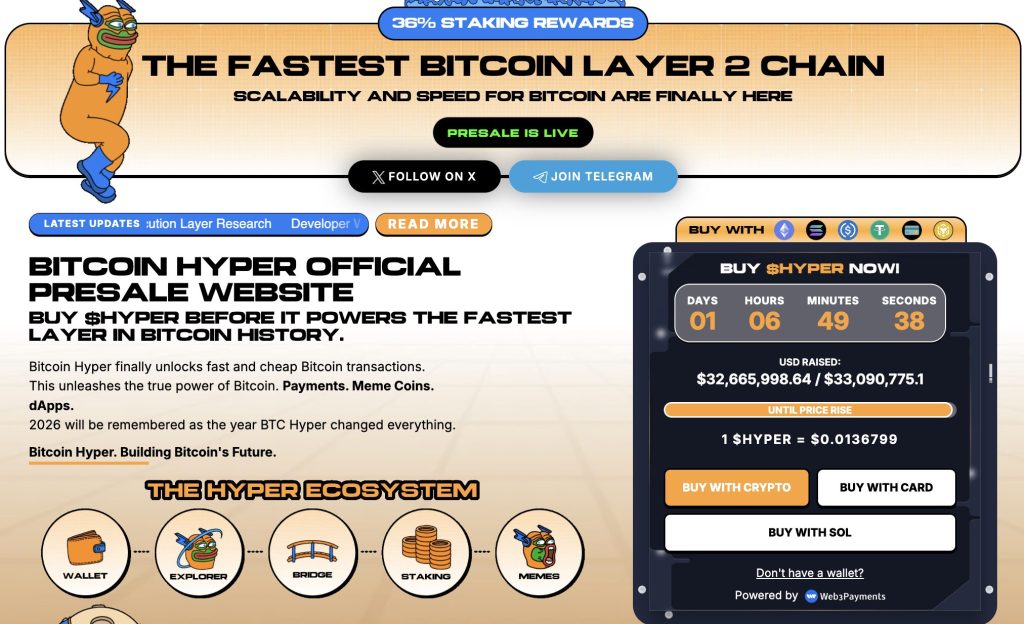
Bitcoin Hyper ($HYPER) is positioning in that exact gap: the first-ever Bitcoin Layer 2 with Solana Virtual Machine (SVM) integration, delivering sub-second finality on top of Bitcoin’s security layer. The pitch is straightforward: Bitcoin’s trust, Solana’s speed, without choosing between them.
The presale has now raised $32,664,913.69 at a current price of $0.0136799, with staking already live for early participants.
The Decentralized Canonical Bridge enables seamless BTC transfers into a fast, low-cost execution environment, solving Bitcoin’s programmability problem at the infrastructure level.
The project crossed $32M raised amid sustained presale demand. Presales carry real risk, token price at launch is never guaranteed, but the raise figure indicates serious market interest.
The post Solana Co-Founder Just Confirmed Near-Speed-of-Light Finality Is Coming Next Quarter: Is $150 Back on the Table? appeared first on Cryptonews.
‘I’m an American buying a house in the UK and 3 thing are baffling’
Priority Tech earnings beat by $0.09, revenue topped estimates
XRP Price Outperforms ETH and BTC: $2 Next Target as Ripple Token Eyes $10
Manchester United reach agreement with Casemiro over contract clause amid transfer speculation

US brings back mandatory military draft registration

Steven Gerrard disagrees with Gary Neville over ‘shock’ Chelsea and Arsenal claim | Football


-
 Crypto World3 days ago
HarrisX Poll Found 52% of Registered Voters Support the CLARITY Act
-

 Crypto World4 days ago
Upbit adds B3 Korean won pair as Base token gains Korea access
-

 Fashion3 days ago
Weekend Open Thread: Marianne Dress
-

 Tech7 days ago
Image AI models now drive app growth, beating chatbot upgrades
-
 NewsBeat4 days ago
NCP car park operator enters administration putting 340 UK sites at risk of closure
-

 Politics2 days ago
Politics Home Article | Starmer Enters The Danger Zone
-
 Business2 days ago
Ignore market noise, India’s long-term story intact, say D-Street bulls Ramesh Damani and Sunil Singhania
-

 Tech1 day ago
Auto Enthusiast Carves Functional Two-Stroke Engine from Solid Metal
-

 Tech5 hours ago
GM Agrees To Pay $12.75 Million To Settle California Lawsuit Over Misuse Of Customers’ Driving Data
-

 Crypto World6 days ago
UAE Free Zone Deploys Blockchain IDs to Verify Registered Firms
-
 Sports7 days ago
2026 NHL playoff picks: Second-round predictions, series odds, Stanley Cup bracket
-

 Crypto World5 days ago
BlackRock CEO Larry Fink Discusses a New Asset Class
-

 Crypto World4 days ago
Robinhood says Wall Street is building onchain
-
Entertainment6 days ago
Serena Williams hits Met Gala in metallic dress after GLP-1 reveal
-

 Tech5 days ago
Apple and Samsung are dominating smartphone sales so thoroughly that only one other company makes the top 10
-

 Entertainment7 days ago
Skai Jackson Responds To AI Baklash After Viral Snapchat Photos
-

 Tech5 days ago
I tested the Xiaomi 17 Ultra’s camera and I don’t think I’ll ever go back to an iPhone
-

 Politics6 days ago
Met Gala 2026: Madonna’s Dramatic Red Carpet Look Steals The Show
-

 Fashion5 days ago
The Best Work Pants for Women in 2026
-
 Sports7 days ago
Hearts v Rangers LIVE: Prediction, team news and line-ups as Scottish Premiership title rivals meet at Tynecastle
You must be logged in to post a comment Login