

Crypto World
Solana Price Prediction: DEX Activity Slumps to 1 Year Low as Memecoin Frenzy Fades

Solana is trading at $84, the price is down 71% from its January 2025 peak of $293, as weekly DEX volume collapses to levels not seen since early 2025, even with bullish prediction and hope. The memecoin engine that once powered Solana’s on-chain dominance is stalling.
For Solana, the next 72 hours around the Federal Reserve’s March 17–18 meeting could determine whether $80 holds or gives way entirely. One technical pattern already has a $59 target in view.
Weekly DEX volume across all networks registers at just $1.2B, way down from its $41B peak. Broader crypto market weakness in Q1 2026 hammered token speculation, with DEXs now capturing just 14.1% of centralized exchange volume, down sharply from a 21%+ peak in summer 2025.
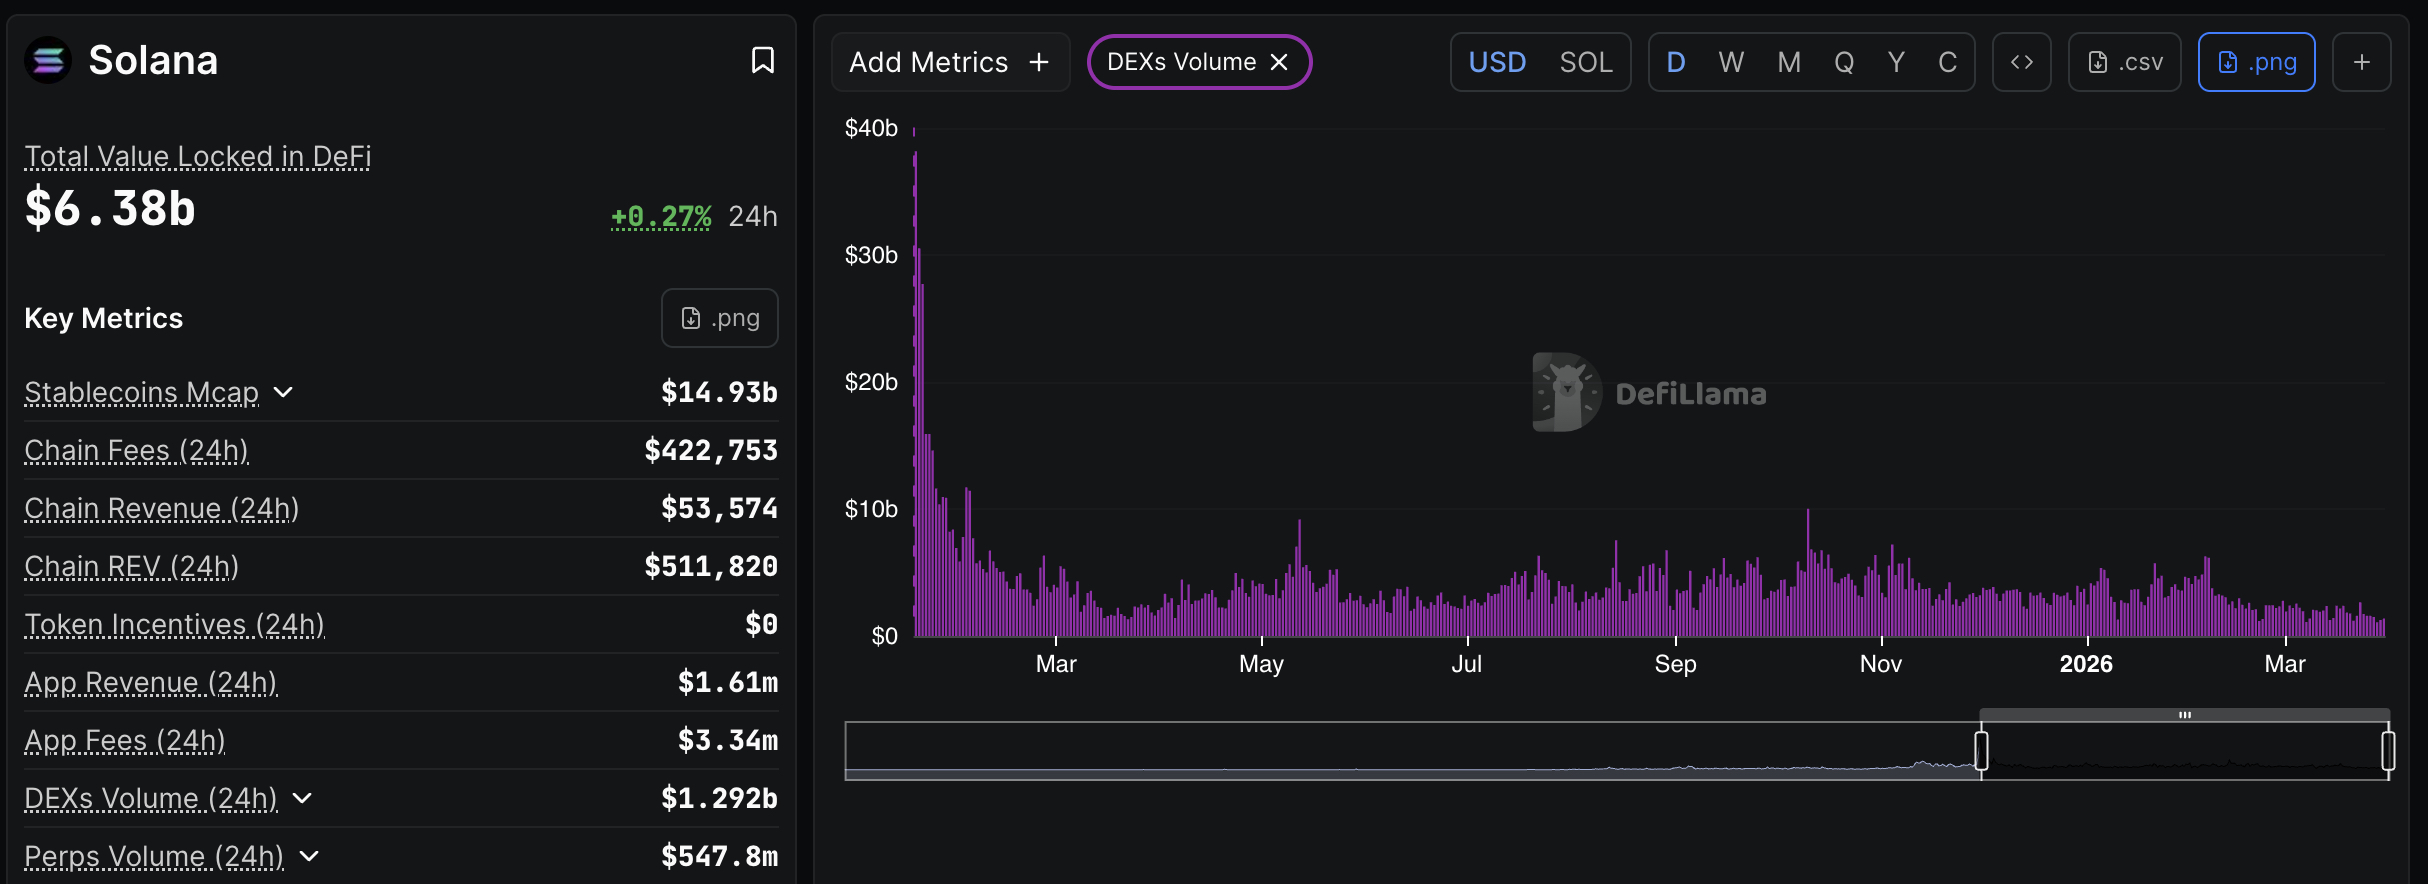
Solana still commands the largest individual network share at $11.42B, its 30th consecutive month leading peers, propped up by persistent PumpSwap and Pump.fun activity, but even that moat is narrowing as “star token” launches dry up.
The macro and technical backdrops are converging at a critical juncture. Here’s what the data suggests about SOL’s near-term path, and where traders are repositioning capital while waiting for clarity. Deep dive into our Solana Price Prediction
Discover: The best pre-launch token sales
Solana Price Prediction: Can Solana Reclaim $96 Support?
SOL sits at $84, pinned below the $86 pivot that separates consolidation from any credible recovery attempt. Volume metrics have been deteriorating alongside price, a combination that technically confirms distribution rather than accumulation.
RSI sits at a neutral 50 area, not oversold enough to trigger mean-reversion buying on its own, while the 50-, 100-, and 200-day SMAs all signal sell. The 200-day MA has been rising since March 9, which is the one structural bright spot bulls can point to.
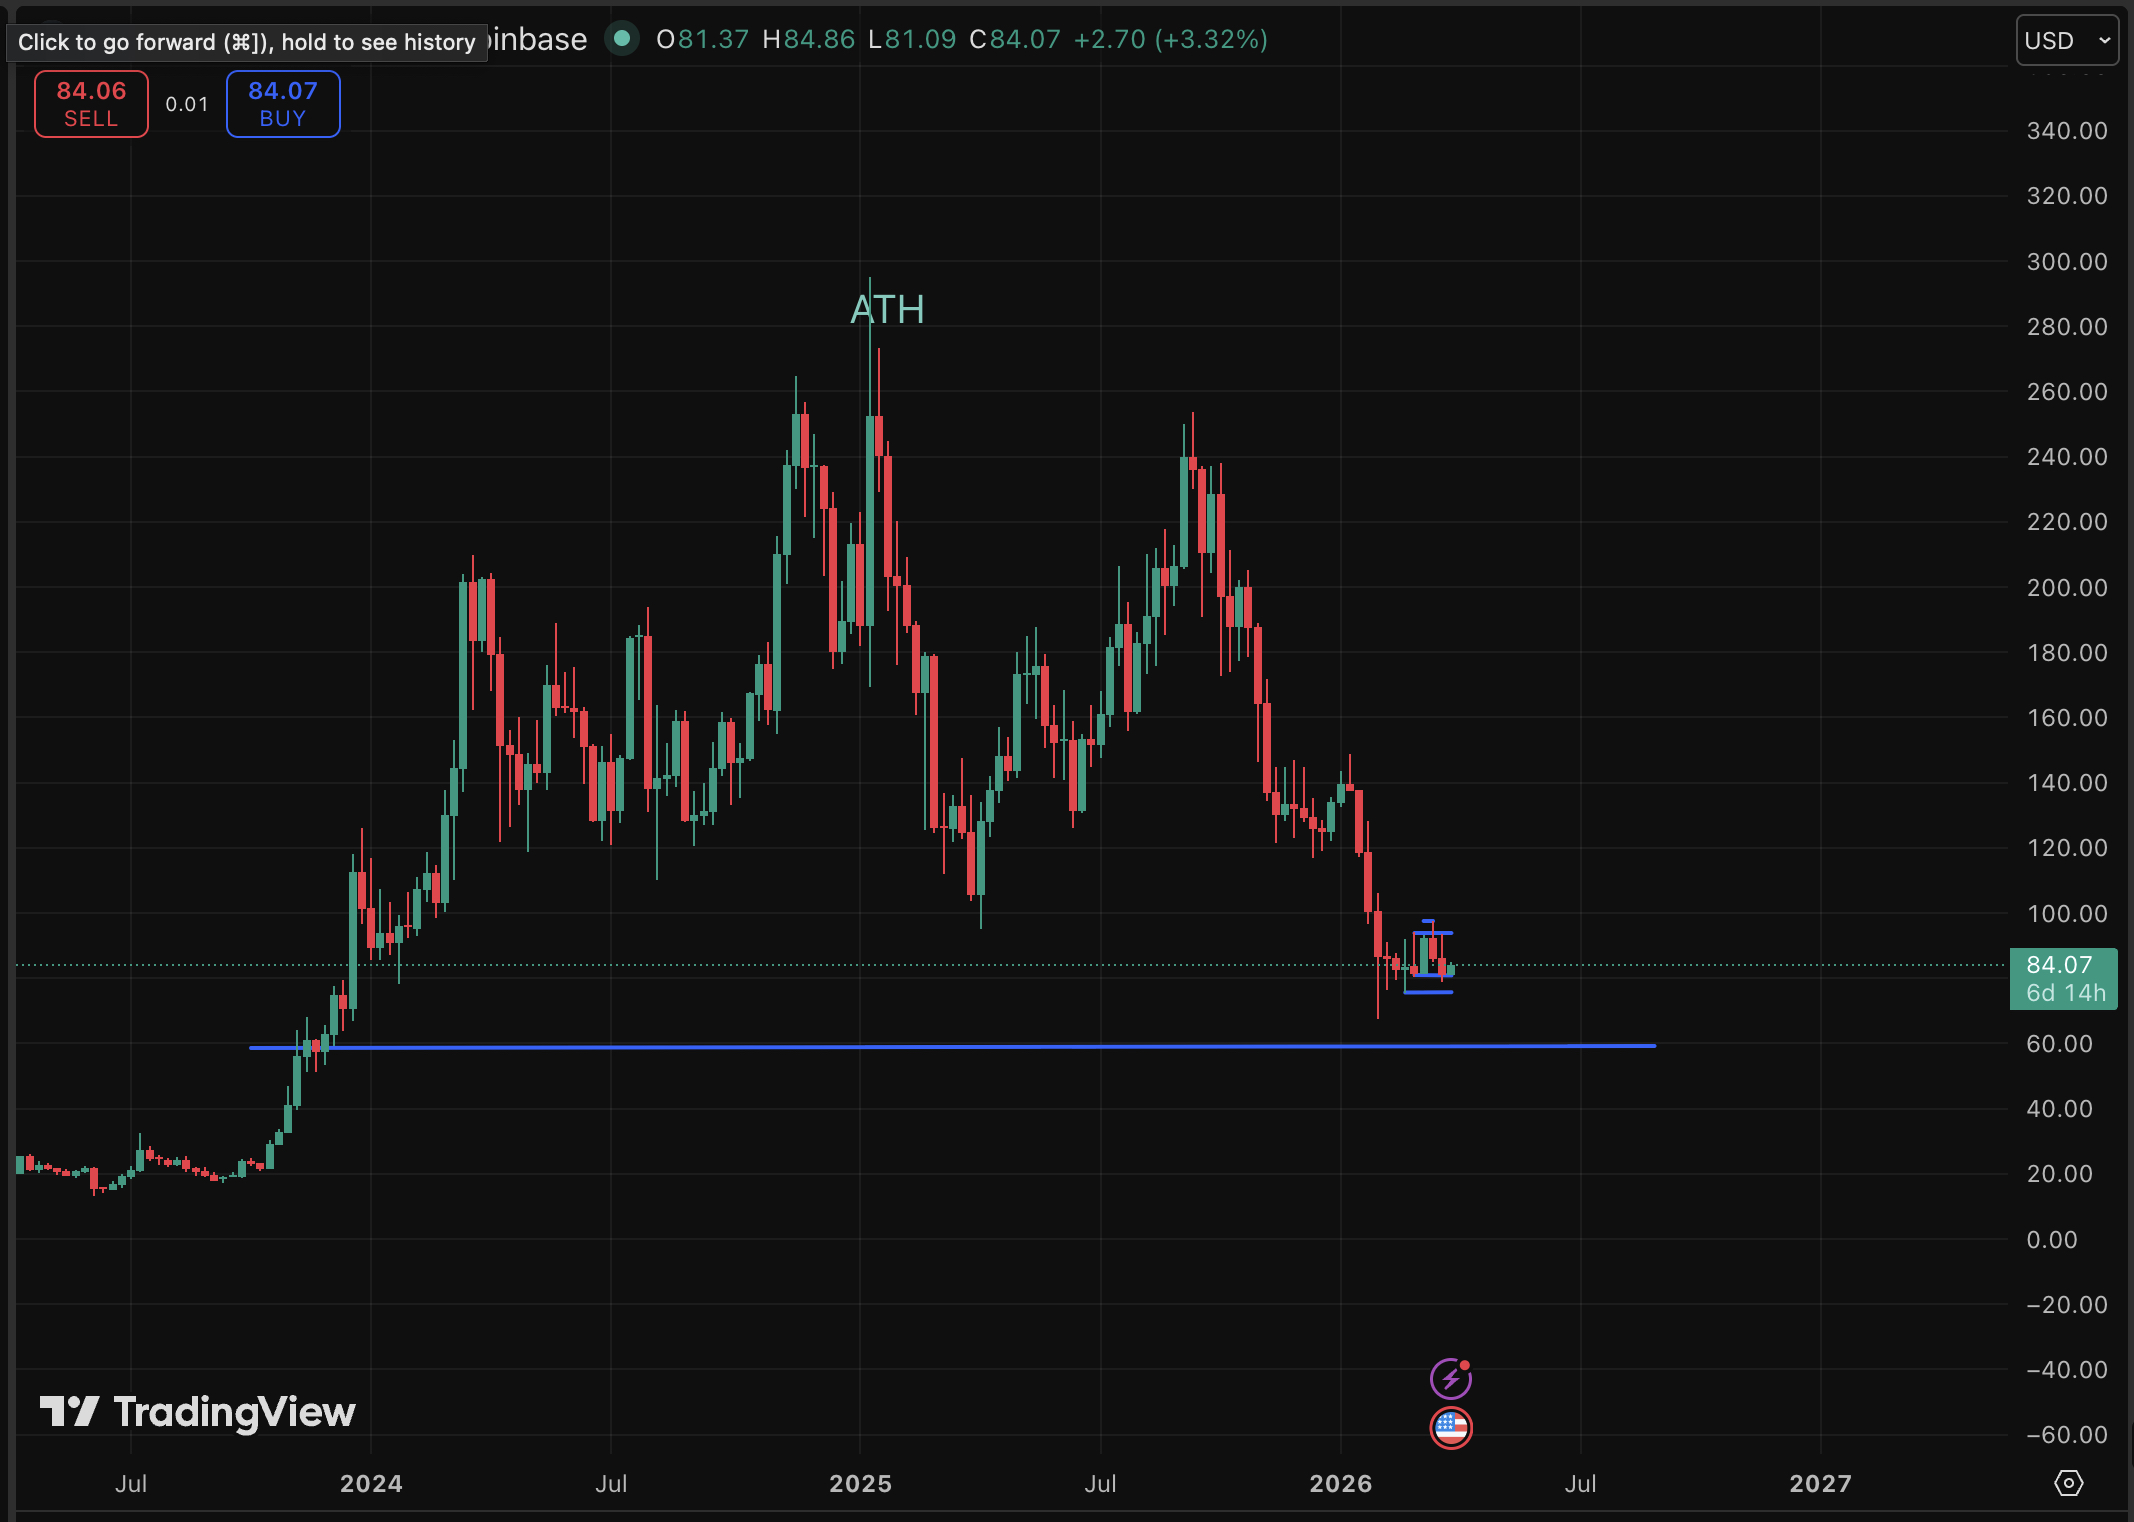
The head-and-shoulders pattern on the three-day chart is the dominant concern. A confirmed break below $80, assigned a 38.5% probability by current market structure, triggers the measured move toward $59. That would represent a further 28% decline from current levels. Resistance to reclaim sits at $96 first, then $105.
Discover: The best crypto to diversify your portfolio with
Maxi Doge Is an Early Mover With Upside Potential
When a leading L1 trades 70% off its highs, and DEX volumes hit annual lows, the rotation question becomes unavoidable: where does speculative capital go while waiting for the cycle to reset? Memecoin sentiment hasn’t disappeared; it has compressed, historically a precursor to violent repositioning once fear fades.
Maxi Doge ($MAXI) is a meme token built on Ethereum’s ERC-20 standard, positioning itself around what it calls “1000x leverage trading mentality,” with a canine mascot embodying the grind-and-hold bull market ethos.
The project has raised $4,7 million at a current presale price of just $0.000281, with 60% staking APY available to holders. Standout mechanics include holder-only trading competitions with leaderboard rewards and a Maxi Fund treasury allocated toward liquidity and partnerships.
Research MAXI DOGE here, and join the army.
This article is for informational purposes only and does not constitute financial advice. Crypto assets are highly volatile. Always conduct your own research before investing.
The post Solana Price Prediction: DEX Activity Slumps to 1 Year Low as Memecoin Frenzy Fades appeared first on Cryptonews.

Crypto World
China’s factory activity beats forecasts in May, private survey shows, despite softer official data

Workers make US flags ahead of the 2026 World Cup football tournament, at a factory in Qingdao, in China’s Shandong province on May 28, 2026.
– | Afp | Getty Images
BEIJING — China’s factory activity improved in May, a private survey showed Monday, beating expectations even as official data pointed to weaker momentum.
The seasonally-adjusted RatingDog China General Manufacturing Purchasing Managers’ Index came in at 51.8, a touch above the 51.6 expected in a Reuters poll. The 50 mark separates expansion from contraction.
China’s official manufacturing PMI for May fell to 50 from 50.3 in April, in-line with expectations and the lowest since a 49 print in February, according to data released Sunday.
Overall, the official PMI “suggest subdued manufacturing sector growth, increased services activity, and continued decline in the construction industry,” Goldman Sachs analysts said in a report Sunday.
While China’s retail sales growth hit a 40-month low in April, official figures showed overall domestic tourism and spending picked up during an extended May 1 holiday. Chinese hotel group H World said the 10 most popular destinations by occupancy rate were in smaller cities. Rates tend to be lower in those regions than major cities.
Bitcoin traded around the $73,500 mark on Sunday as traders eyed a May that could close in the red, with price action giving little impetus from global headlines. The market appears to be waiting for a clearer set of macro cues, particularly US labor-market data and the May ISM Manufacturing PMI, which traders say could set the tone for risk assets in the coming week.
TradingView data points to a quiet weekend for BTC/USD, with prices largely hovering near the lower end of the current range and still flirting with levels that have defined the year’s early drama. After a May that has already seen about a 3% monthly retreat, traders and analysts are watching whether BTC can regain momentum as the calendar turns.
US equities finished the week at fresh highs, yet Bitcoin did not draw strength from the easing geopolitical tensions that had helped markets at times this year. The conversation on social channels and research notes centered on whether the next wave of data—especially the labor market and manufacturing activity—will spark a repricing of risk assets, including bitcoin.
Key takeaways
- Bitcoin sits near the $73,000–$74,000 zone as May approaches its close, with a month-to-date decline around 3% per CoinGlass data.
- The upcoming US ISM Manufacturing PMI and monthly employment data are the focal point for crypto and broader risk markets, potentially driving volatility once released.
- A weekly close above $73,000 would be a meaningful signal for traders watching a possible trend continuation or a double-bottom breakout, according to market commentary.
- Analysts continue to describe a wide macro range for Bitcoin, with discussions of a broad $60k–$80k corridor likely to persist in the near term.
- Term structure around CME futures has shifted, with markets moving toward 24/7 trading and away from closing-level targets tied to CME gaps.
Macro catalysts on the radar as May nears its end
Beyond the price tag, traders are laser-focused on the macro calendar. The May ISM Manufacturing PMI, a gauge of the economic pulse for the manufacturing sector, has historically provided volatility cues for bitcoin and other risk assets when released alongside the monthly employment report. Analysts say that if the data reveals resilience in growth and risk appetite, BTC could reprice higher; if not, another leg down could unfold as investors reassess macro risk.
On social media, commentary has underscored the potential volatility attached to these releases. For example, a market note from the Kobeissi Letter framed the coming week as a test of the labor market’s strength, implying that employment data could be the dominant driver of sentiment for both equities and crypto. In a broader view, traders have cautioned that any misstep in growth indicators could rekindle volatility in a market already oscillating between macro optimism and caution.
Meanwhile, some analysts maintain that the price action in May is less about immediate catalysts and more about how Bitcoin responds to sustained shifts in risk sentiment. Andre Dragosch, European head of research at Bitwise, suggested that continued repricing would require evidence of stronger growth and risk appetite, with a move higher potentially signaling a more durable shift rather than a brief relief rally.
Technical framing: watching the $73k line and potential patterns
From a technical standpoint, the market has repeatedly tested the $73,000 region as a key inflection point for the monthly close. The latest commentary from traders such as Rekt Capital notes that a weekly close above $73,000 would push Bitcoin closer to validating a potential double-bottom breakout pattern observed on the weekly chart since late February. The notion of a “W” shaped bottom has formed over several weeks, suggesting that bulls are hoping for a sustained reacceleration rather than a quick snap back.
Technical watchers also flag the interplay of moving averages near current price levels. The weekly 200-period moving average and the accompanying EMA have been converging toward price, a configuration that some analysts interpret as supportive if the macro backdrop improves. In this context, traders have been fond of outlining a broad range in which BTC could oscillate for an extended period—roughly between $60,000 and $80,000—before a decisive breakout or breakdown occurs.
Another structural note from the market community is the diminishing influence of CME futures gaps on near-term price targets. As Cointelegraph has observed, BTC’s price action in recent periods has moved away from CME gap-driven targets, with futures markets now operating around the clock and reducing the likelihood of gap-induced reversals shaping daily moves. This shift underpins a more continuous trading environment and underscores the importance of ongoing macro cues over discrete futures-based triggers.
What this means for traders and investors
For traders, the looming data releases represent both a risk and an opportunity. A surprise stronger-than-expected PMI or nonfarm payrolls would likely lift risk assets broadly, including BTC, as investors reassess growth and inflation dynamics. Conversely, softer data that dampens expectations for a rapid risk-on move could keep Bitcoin tethered to a lower end of its range, testing patience among bulls who are hoping for a more durable breakout later in the year.
In this context, the $73,000 bar remains an anchor for the month’s price action. A successful weekly close above that level would not only enhance the case for a bullish continuation, but also feed into a narrative of a potential trend extension from a double-bottom pattern. If the market holds below that level, traders will likely look for further confirmation signals from macro data before committing meaningfully in either direction.
For longer-term participants, the current dynamic reinforces the value of a patient, data-driven approach. The macro regime remains sensitive to policy signals, growth surprises, and geopolitical developments that influence risk sentiment. While the immediate catalysts are upcoming PMI and employment data, the broader takeaway is that Bitcoin’s trajectory continues to ride on how investors gauge the health of the economy and the pace of liquidity in the system.
On balance, the week ahead promises a clearer read on whether Bitcoin can sustain a move beyond the current consolidation zone or if volatility will linger as markets digest incoming data and reassess risk tolerance. Market participants should remain attentive to the PMI release, job numbers, and any shifts in central-bank commentary, all of which could tilt the balance between risk-off caution and renewed appetite for crypto exposure.
As the market eyes the finishing bell on May, what remains uncertain is not the level of price, but the durability of any move that breaks above it. With the macro backdrop still evolving, investors would be wise to monitor both the headline data and the undercurrents of market psychology that often drive crypto markets when traditional assets begin flashing mixed signals.

Greg Abel, CEO of Berkshire Hathaway, speaks during the Berkshire Hathaway Annual Shareholders Meeting in Omaha, NE on May 2, 2026.
CNBC
Berkshire Hathaway agreed Sunday to acquire homebuilder Taylor Morrison Home in a $6.8 billion deal, deepening the conglomerate’s bet on the U.S. housing market after a prolonged downturn.
The Omaha, Nebraska-based company will pay $72.50 per share in cash for Taylor Morrison, according to a statement. The offer represents a 24% premium to the homebuilder’s closing price on May 29 and values the company at about $8.5 billion, including debt.
The acquisition marks one of the first major strategic deals under Warren Buffett’s successor Greg Abel, who took over as CEO at the start of 2026. The acquisition, expected to close in the second half of 2026, is relatively modest by Berkshire standards as it’s sitting on a cash hoard nearing $400 billion.

“Berkshire is acquiring a best-in-class national homebuilder, led by an exceptional team and backed by a trusted reputation for customer experience,” Abel said in the statement. “Over time, we expect to unify our site-built homebuilding operations into a combined platform enabling us to deliver the dream of homeownership to more Americans.”
The deal suggests Berkshire is positioning for a recovery in U.S. housing demand despite elevated mortgage rates and affordability pressures that have weighed on the sector in recent years.
“They are betting the housing cycle will turn and that there is pent-up demand,” Bill Stone, Glenview Trust CIO and a Berkshire shareholder, told CNBC.
The acquisition expands Berkshire’s already sizable footprint in housing. The conglomerate owns manufactured-home giant Clayton Homes, a slew of building product companies as well as Berkshire Hathaway HomeServices, one of the largest residential real estate brokerage franchise networks in the U.S.
Berkshire’s last major deal came in October, when it reached a $9.7 billion cash deal to purchase of OxyChem, the chemical business of Occidental Petroleum.

TLDR:
- Ethereum (ETH) holds support despite growing short interest clustered above current price levels
- Whale activity remains dominant as retail traders stay cautious amid mixed market sentiment
- Large liquidity pools above the spot price increase the possibility of a short squeeze event
- Whale vs Retail Delta turns higher again, signaling renewed accumulation by larger holders
Ethereum (ETH) price remains range bound as growing short exposure and increasing activity from large holders create tough market conditions for traders.
Ethereum (ETH) Faces Rising Short Squeeze Potential
Ethereum (ETH) has spent recent months trading near the lower end of its broader range, struggling to establish sustained upside momentum.
On the surface, the price structure appears weak, reinforcing a cautious outlook among traders expecting further downside pressure. However, liquidation data is revealing a different narrative beneath current market conditions.
Recent positioning metrics show a substantial concentration of short-side liquidity sitting above the current Ethereum (ETH) price. As those positions accumulate, they effectively build future buying pressure if prices begin moving higher.
A widely circulated market update on X pointed to this imbalance between price action and positioning. According to the analysis, Ethereum (ETH) continues absorbing selling pressure despite persistent bearish bets.
Market participants often view liquidity as a magnet. In Ethereum’s case, one of the largest liquidity pools remains above the spot price.
The longer the asset maintains support without breaking lower, the greater the pressure becomes on traders positioned for a decline.
Sentiment remains noticeably more bearish than price performance. Many traders continue positioning for a breakdown, yet Ethereum (ETH) has avoided a decisive collapse. This divergence has become a key talking point among analysts evaluating near-term market structure.
Whale Activity Diverges From Retail Market Behavior
While liquidation data points toward potential volatility, whale activity is presenting another important development for Ethereum (ETH).
Recent Whale vs Retail Delta metrics show large holders maintaining stronger participation levels than smaller traders across much of the market cycle.
Notably, whale dominance remained positive even during periods when Ethereum (ETH) experienced sharp declines from previous highs.
Instead of reducing exposure, larger market participants appeared to increase activity during weakness. This trend contrasts with retail behavior, which often becomes more defensive during uncertain market conditions.
Several of the strongest positive delta readings occurred during periods of market stress rather than during rallies.
Such activity suggests that large investors continued engaging while broader sentiment weakened. More recently, after a brief period of increased retail influence, the metric shifted sharply back in favor of whales.
The analysis noted that larger holders appear increasingly active despite Ethereum (ETH) remaining well below prior cycle peaks. Although price has yet to produce a decisive breakout, positioning data indicate building exposure.

TLDR:
- Argentina’s crypto fraud crackdown led to 24 arrests across 90 raids targeting scam networks
- Authorities seized over $8M USDT tied to fake investment platforms and WhatsApp fraud schemes
- Criminal rings used fake apps, WhatsApp hijacking, and malware to steal investor funds
- Funds were converted into USDT via P2P markets and traced to overseas crypto wallets
Argentina’s crypto fraud crackdown authorities dismantled multiple investment scam networks and seized more than $8 million in USDT.
The operation, one of the country’s largest crypto-related enforcement actions, exposed sophisticated fraud schemes that allegedly generated billions of pesos in investor losses.
Argentina Crypto Fraud Crackdown Nets 24 Arrests and $8M USDT
Argentine authorities launched Operation “Fake Coins” on May 31, executing 90 coordinated raids across the country. The nationwide action resulted in the arrest of 24 suspects linked to alleged cryptocurrency and investment fraud activities.
According to prosecutors, the networks targeted victims through fake investment opportunities promoted on WhatsApp and WhatsApp Business.
The schemes reportedly promised attractive returns while directing users toward fraudulent platforms disguised as legitimate financial services.
The investigation uncovered nearly ARS 3 billion in alleged losses connected to more than 100 complaints. Authorities also seized almost ARS 60 million in cash and confiscated 80 electronic devices, including computers and mobile phones used during the operation.
The officials recovered more than 8 million USDT, surpassing the amount confiscated during the widely publicized RainbowEx case in 2024.
Prosecutors said private virtual asset service providers cooperated with investigators to freeze digital assets associated with the operation. However, authorities did not disclose the names of all entities involved in the asset recovery process.
Investigators Uncover Three Distinct Fraud Operations
The investigation revealed that the criminal activity operated through three separate groups, each employing different methods to obtain funds from victims.
The first network allegedly used a fake trading application distributed through the Google Play Store. Unregistered advisers reportedly guided investors through multiple deposits while presenting the platform as a legitimate investment service.
A second group focused on WhatsApp account compromises and impersonation tactics. Investigators said stolen funds were converted into USDT through Binance’s peer-to-peer marketplace before being transferred to overseas accounts, including destinations linked to Venezuela.
Authorities identified more than 100 activation codes associated with WhatsApp accounts used during the scheme. Investigators believe these accounts played a central role in contacting victims and maintaining fraudulent communications.
The largest crypto seizure came from a third organization based in San Isidro. Prosecutors alleged that the group developed piracy applications embedded with infostealer malware designed to steal passwords and banking credentials.
Blockchain analysis enabled authorities to trace transactions connected to the stolen funds, leading investigators to significant cryptocurrency holdings.
The suspects now face allegations that include aggravated fraud, money laundering, illicit association, and intellectual property violations.
As judicial proceedings move forward, authorities will determine how the seized USDT is handled and whether recovered assets can be directed toward compensating affected victims.
Crypto World
Coinbase makes a major play for India’s booming $3 billion crypto market with local currency launch


Nasdaq-listed Coinbase exchange announced Monday a major market move: the launch of direct rails for Indian rupees (INR).
Starting June 1, 2026, the exchange’s Indian customers can deposit and withdraw rupees directly from their bank accounts via the Immediate Payment Service (IMPS), a move designed to eliminate the need for intermediaries and simplify the often-clunky process of entering the crypto market in the region.
For a long time, Indians have had to rely on Peer-to-Peer (P2P) markets or third-party intermediaries to fund their crypto accounts. This method can be slow and, at times, risky, often leaving vulnerable users to payment scams or the sudden freezing of their bank accounts by law enforcement due to suspicious fund trails from unknown counterparties. Coinbase is bypassing that by integrating directly with the Immediate Payment Service (IMPS).
Coinbase’s latest move means its customers can transfer funds from their local bank accounts directly to the Coinbase platform and back again.
“India has long been one of the most important markets in crypto, in terms of developer talent, trading activity, and the broader adoption of blockchain technology,” said John O’Loghlen, Coinbase’s Head of APAC, in the announcement shared with CoinDesk.
The country has been ranked among the top countries driving crypto adoption in the APAC market in 2025, and ranked first in the Global Crypto Adoption Index, according to Chainalysis data. In fact, according to the consulting firm Imarc, the Indian cryptocurrency market reached $3.04 billion in 2025 and is projected to reach $14.21 billion by 2034, growing at a CAGR of 18.66% during 2026-2034 time period.
‘Here for the long-term’
The launch isn’t just for beginners, however. While retail traders can access spot markets for major assets, the platform is also introducing perpetual futures contracts.
For the “pro” crowd, the “Coinbase Advanced” suite will offer institutional-grade tools, including TradingView integration and sophisticated APIs. Notably, by building local INR order books, Coinbase ensures users aren’t trading against global prices but have dedicated liquidity right at home.
The goal is to provide the same platform trusted by global institutions to India’s massive retail base, Coinbase said.
Regulation has always been the elephant in the room for crypto in India.
Coinbase first opened its platform to Indians in 2022 but ran into a roadblock within days when the UPI operator, National Payments Corporation of India (NPCI), dismissed Coinbase’s then launch of UPI support, saying it was unaware of any such arrangement involving a crypto exchange.
Coinbase is tackling regulatory challenges head-on this time by registering with the Financial Intelligence Unit (FIU-IND), the central national agency responsible for analyzing and disseminating information on suspicious financial transactions.
The FIU registration is a clear signal that the exchange is seeking a long-term presence in the world’s fastest-growing major economy and most populous country.
The latest offering builds on years of quiet groundwork. Coinbase is already an investor in local exchange CoinDCX and has funneled over $1 million into Indian developers through its “Base” Layer 2 network.
“With the launch of direct INR rails, we’re making Coinbase fully accessible to Indian retail traders, with the same platform trusted by institutions and traders around the world. We’re registered with FIU-IND and here for the long-term,” O’Loghlen said.
Crypto World
XRP Inflows to Binance Fall to Lowest Level Since Early 2026 as Holding Sentiment Grows
TLDR:
- XRP inflows to Binance dropped to just 215 million XRP in May, the lowest recorded since early 2026.
- The steady decline in inflows since Q2 began reflects reduced short-term selling intent among XRP holders.
- Historically low exchange inflows may point to tightening short-term supply, supporting steadier price action.
- Analyst Ali Charts watches $1.34 channel support, with upside targets set at $1.37 and $1.40 for XRP.
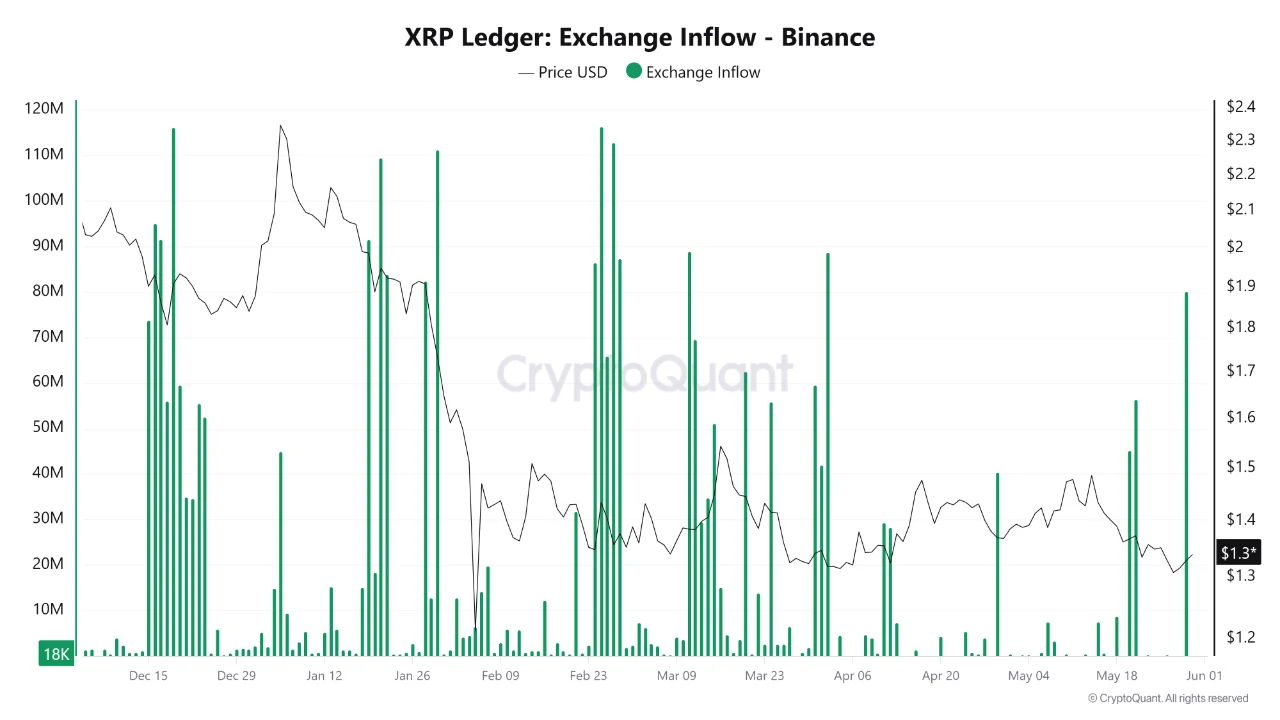
XRP inflows to Binance dropped sharply in May, reaching their lowest level since the start of 2026. Data shows only 215 million XRP moved to the exchange during the month.
That figure carries an estimated value of roughly $292 million. The decline came alongside continued uncertainty across the broader cryptocurrency market. Analysts are now watching what this shift could mean for near-term price behavior.
Declining Exchange Inflows Point to Reduced Selling Activity
Exchange inflows are a widely used metric for gauging investor behavior. Higher inflows generally suggest that holders intend to sell or trade their assets. A drop in inflows, on the other hand, often points to reduced selling intent.
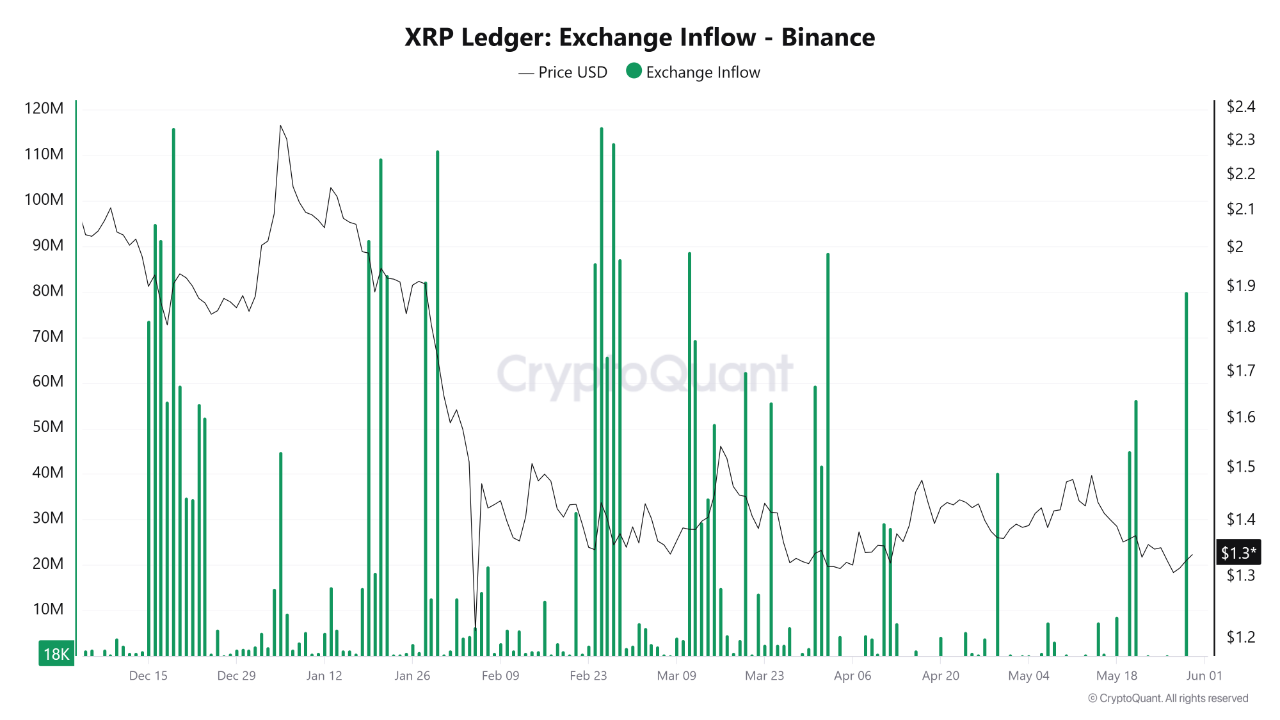
Source: Cryptoquant
In May, XRP inflows to Binance, the world’s largest crypto exchange, fell considerably. This marked a continuation of a gradual downtrend that started at the beginning of the second quarter. The decline coincided with relative price stability and lower volatility compared to earlier months.
The pattern suggests that fewer holders moved their XRP to centralized platforms last month. That behavior typically reflects a preference for holding assets off-exchange for longer periods. It also points to less rapid, short-term speculation in the market.
While falling inflows are not a guaranteed bullish indicator, they can reflect tightening short-term supply. When fewer coins reach exchanges, immediate sell-side pressure tends to ease. That condition may support steadier price action over time.
Technical Levels Draw Attention as Channel Support Holds
Beyond on-chain data, technical analysts are also monitoring XRP’s price structure. Crypto analyst Ali Charts noted on X that XRP remains inside a well-defined rising channel on the one-hour chart. The analyst identified the lower boundary near $1.34 as a key area to watch.
According to Ali Charts, that level aligns with current price action and could serve as a buying zone if buyers respond.
The repeated defense of channel support suggests bulls are maintaining higher lows. That pattern is commonly seen as a sign of trend continuation.
If XRP holds the $1.34 level, the next resistance sits near $1.37. A break above that level could then open a path toward $1.40, which matches the upper end of the ascending channel. A close below $1.34, however, would weaken the current setup and raise the risk of a deeper pullback.
Together, the on-chain and technical data present a cautious but watchful picture for XRP in June. Inflows remain historically low, and the price channel is still intact.
Market participants are now monitoring whether these conditions will hold or shift in the weeks ahead.
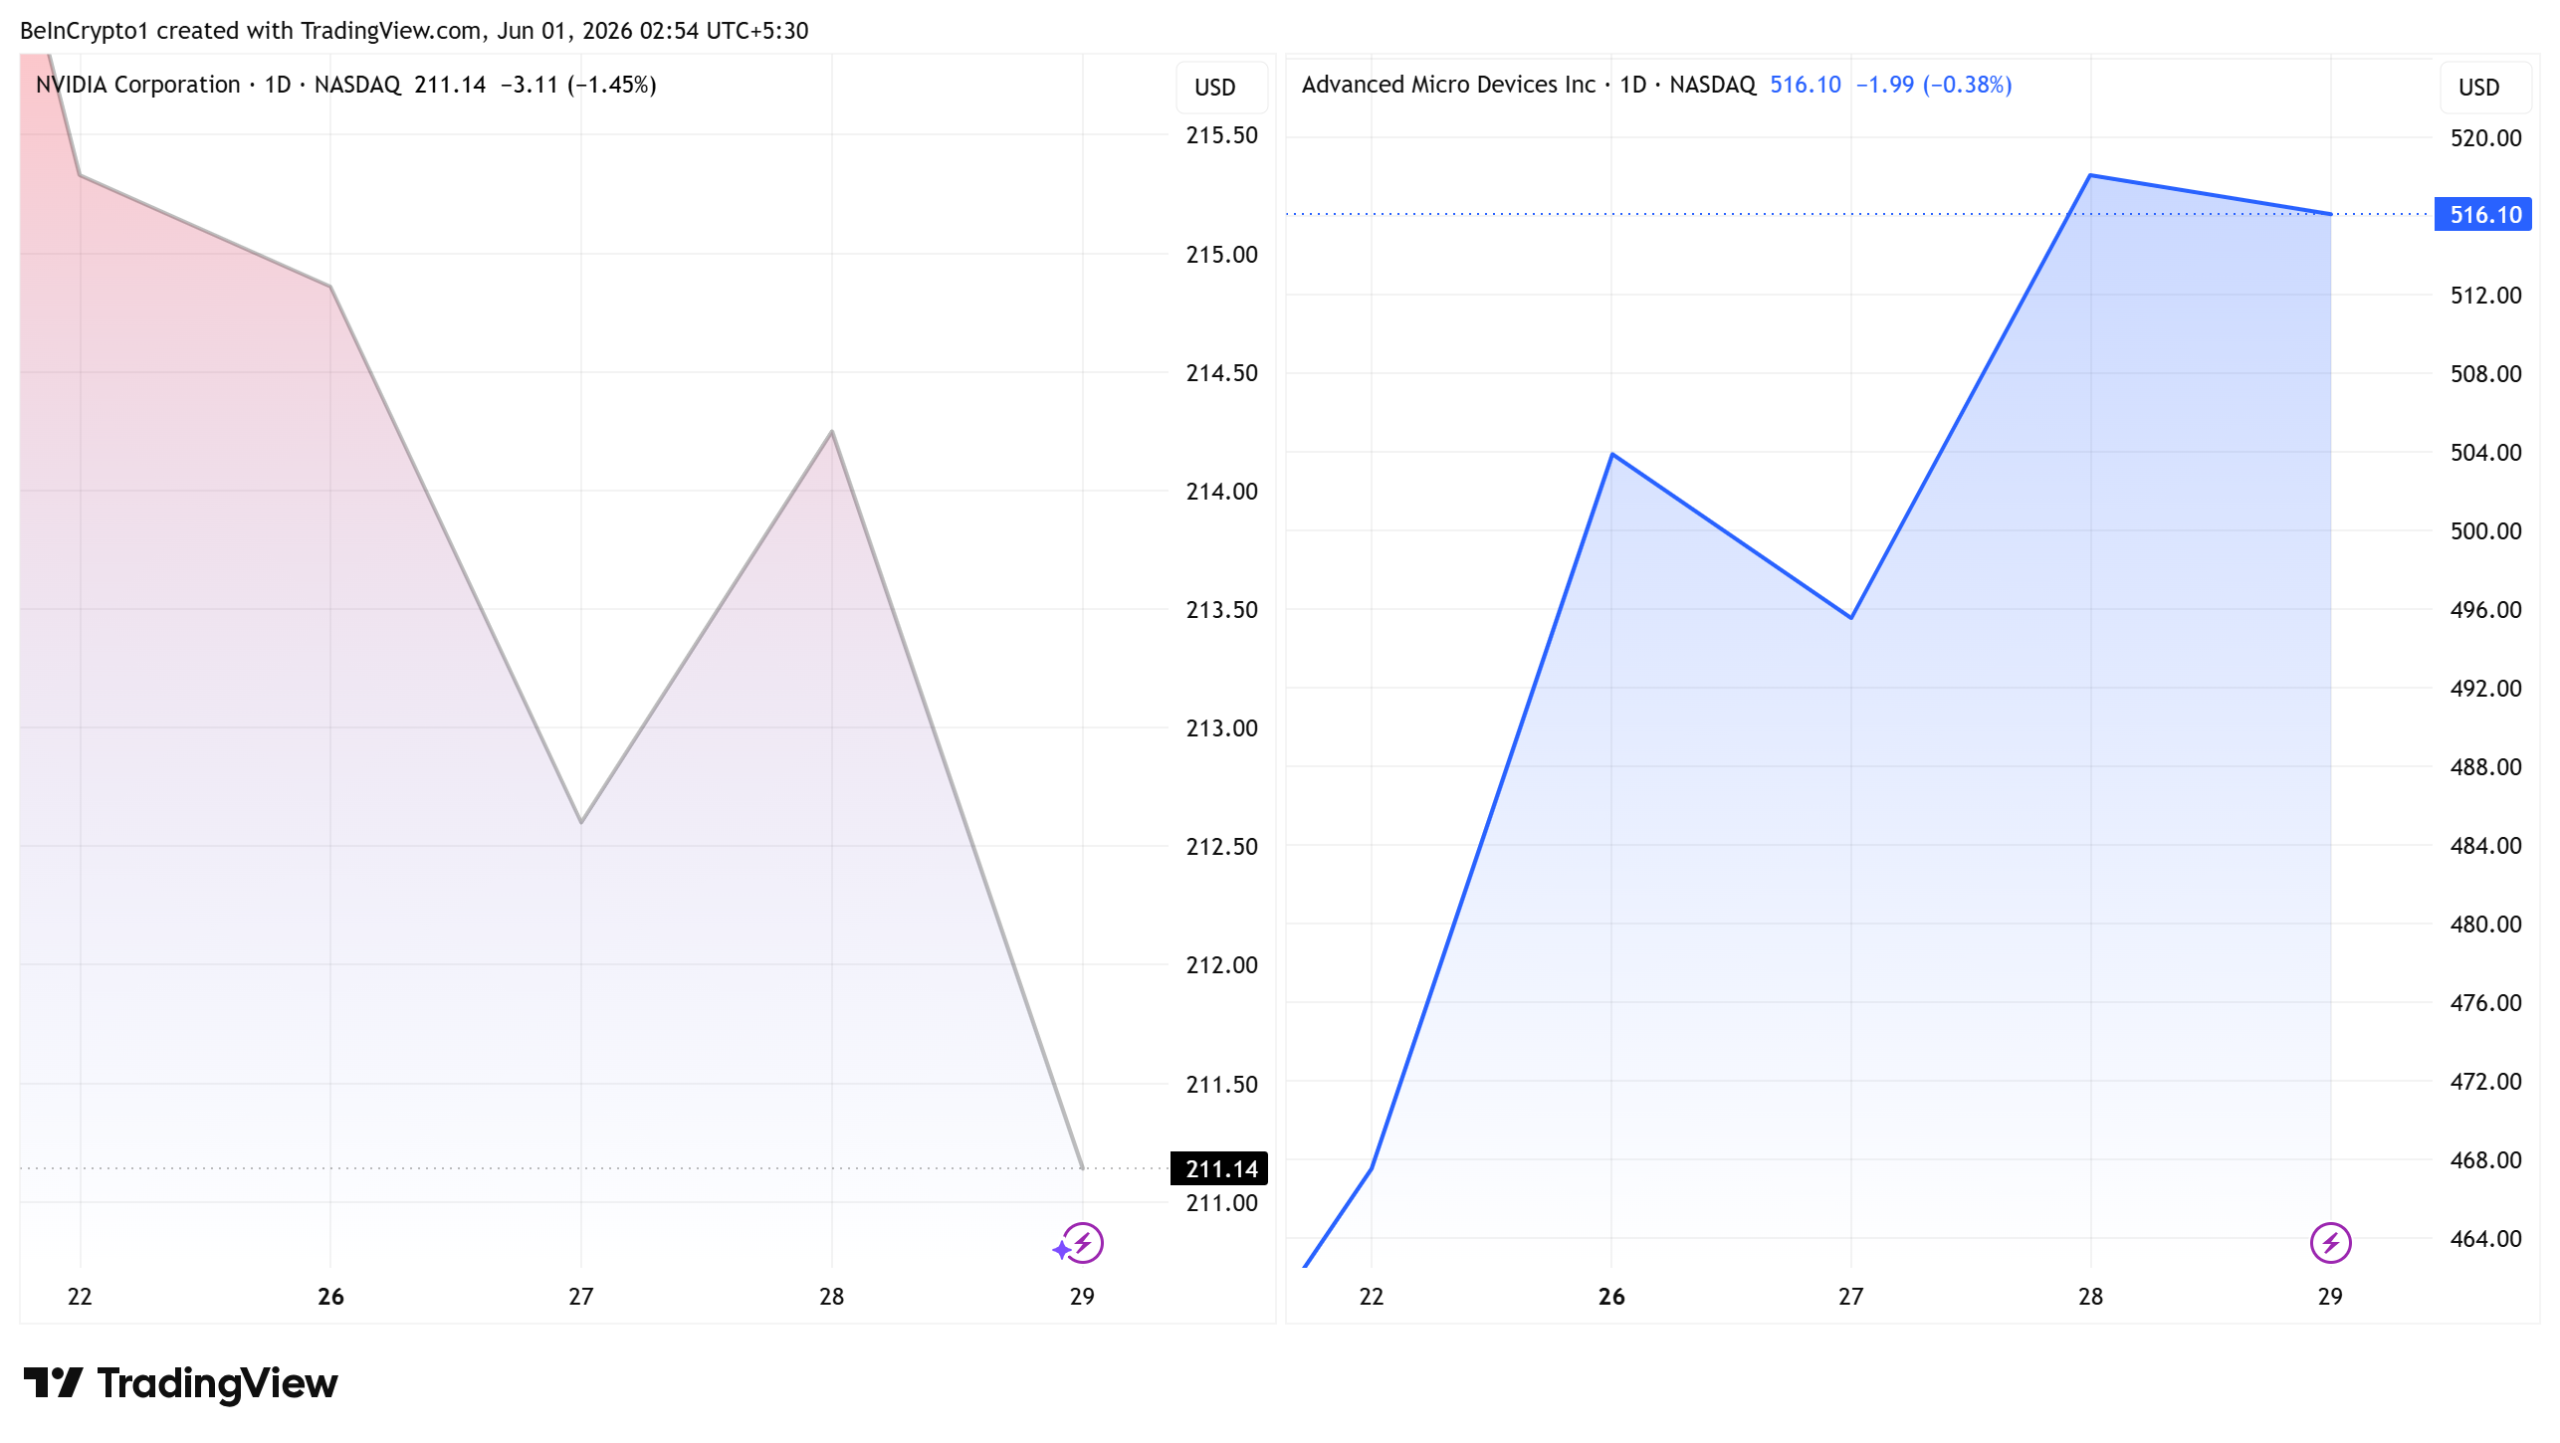
Nvidia (NVDA) and AMD shares are set to face renewed pressure when US markets open Monday. Weekend guidance from the Bureau of Industry and Security (BIS) extends license rules to advanced AI chips sold to Chinese-owned firms abroad.
The Trump administration left a year-long enforcement gap after rescinding the Biden-era AI Diffusion Rule last May. Industry sources say hundreds of thousands of advanced chips slipped through to Chinese-linked buyers abroad.

Why Monday’s Open Could Get Bumpy
Earlier draft rules requiring approval for global AI chip exports sent Nvidia down 1.8% and AMD down 2.2% in prior sessions. A similar but more contained reaction looks possible Monday.
The new guidance is enforcement clarification, not a sweeping ban. Existing licensed sales of lower-tier chips can continue under earlier terms. Already-shipped products remain in customer hands.
Direct earnings damage may be limited. Nvidia disclosed zero Data Center Hopper shipments to China in fiscal Q1 2027.
That compares with $4.6 billion a year earlier. Total Data Center revenue still hit a record $75.2 billion on Blackwell 300 demand.
Follow us on X to get the latest news as it happens
What the New Rule Actually Does
The clampdown applies to top-tier processors. Affected products include Nvidia’s Rubin and Blackwell families and AMD’s MI350x accelerator. BIS will now require licenses for any buyer whose ultimate parent sits in China.
The clarification follows earlier China export rules that capped advanced semiconductor sales. The administration rescinded the broader Biden framework before its May 2025 effective date.
Industry sources told Reuters hundreds of thousands of advanced chips reached overseas Chinese-owned firms during the gap year. Singapore and Malaysia rank among the suspected routing hubs.
Federal prosecutors have previously charged operators of a $2.5 billion GPU smuggling ring tied to similar diversion patterns.
Compliance Tightens, Crypto Sympathy in Play
Exporters must verify the ultimate parent of every buyer, not just the destination country. Distributors and cloud resellers face a higher bar on know-your-customer checks.
Entity list additions and Middle East export restrictions have layered atop the China framework since 2024.
Trump’s earlier cancellation of broader Biden controls left entity-level restrictions intact.
AI-themed crypto tokens often trade in sympathy with US semiconductors. Correlated weakness is possible if chip sentiment sours into the cash session.
Recent moves in top AI stocks have tracked Blackwell shipments closely.
The clampdown could dent flagship revenue or redirect capacity toward US and allied customers.
Next quarter’s earnings will offer the first hard read.
The post U.S. AI Chip Export Clampdown Likely to Pressure Nvidia and AMD Shares at Open appeared first on BeInCrypto.

Federal Reserve Governor Christopher Waller signaled that the rising use of dollar-backed stablecoins could extend the United States’ monetary influence, potentially importing US monetary conditions into other economies as these tokens gain traction globally. Speaking at the 32nd Dubrovnik Economics Conference, Waller framed stablecoins as a payment instrument rather than a threat, suggesting they intensify competition in the payments space rather than undermine it.
In the same Dubrovnik event, Megan Greene, a Bank of England policymaker and fellow panelist on “Stablecoins and monetary policy,” offered a more apprehensive take. Greene argued that stablecoins could fade from view within a few years, while she predicted tokenized deposits might become the dominant pillar of the digital monetary landscape. Their exchange highlighted a broader debate about how different digital money formats could coexist or supplant one another in the coming years.
Key takeaways
- Dollar-backed stablecoins could extend US monetary conditions internationally, according to a senior Federal Reserve official.
- Stablecoins are viewed by some as ongoing payment competition, not inherently dangerous, and they may bring competitive dynamics to global payments.
- There is a contrasting, evolving view on CBDCs and tokenized deposits, with some policymakers expecting tokenized deposits to become more prominent than stablecoins.
- US policy on stablecoins and yield remains a hurdle for broader crypto legislation, even as a framework moves through Congress.
Dollar-stablecoins and the reach of US monetary policy
During the Dubrovnik discussion, Waller emphasized that stablecoins—when backed by the dollar—need not be painted as inherently problematic. He described stablecoins as “a payment instrument” and asserted that they introduce competition into the payments ecosystem. His remarks align with a broader view among some policymakers that dollar-denominated stablecoins can serve as a bridge for cross-border payments, potentially reflecting US monetary policy conditions in other economies that adopt these tokens.
Bloomberg News relayed Waller’s remarks, noting that countries leaning more on US-dollar stability through stablecoins could import US monetary conditions. While Waller stopped short of embracing stablecoins as a policy fix or a substitute for traditional central banking tools, his stance underscores a realization among policymakers that digital money forms are altering the cadence of monetary transmission, even if the governance and risk frameworks remain unsettled.
Greene’s counterpoint at the same stage highlighted a more dynamic, if uncertain, trajectory for digital money. She argued that tokenized deposits—essentially bank deposits expressed in a tokenized format—could become a dominant force in relatively short order, possibly outpacing stablecoins in scale and speed of adoption. Reuters captured her metaphorical framing of the evolving ecosystem: “a massive race between the tortoise, the hare and the rhino,” with the tortoise representing central bank digital currencies (CBDCs), the hare symbolizing stablecoins, and the rhino standing for tokenized deposits. Greene suggested the rhino might ultimately surge ahead, taking off in the near future.
The divergent viewpoints reflect a long-standing debate about the future of state-backed digital money versus privately issued digital currencies. Waller expressed a degree of skepticism about CBDCs, while Greene suggested that the market could settle into a triad of technologies—CBDCs, stablecoins, and tokenized deposits—each serving different use cases and regulatory footprints. Their exchange occurred within the context of a broader policy dialogue about how to balance innovation with financial stability and consumer protection.
It’s worth noting that the Dubrovnik discussion occurred amid a broader regulatory environment in which central banks have grown cautious about the speed and design of digital money initiatives. The Bank of England’s stance, as echoed in Greene’s remarks, contrasts with Waller’s caution, indicating a spectrum of priorities among major economies when contemplating CBDCs, stablecoins, and the possibility of programmable money via tokenized deposits.
US policy hurdles and the path to clarity
The Dubrovnik panel’s informal atmosphere did little to obscure a central tension in US policy: progress on crypto regulation has been slowed by debates over stablecoin yields and the regulatory framework for digital assets. The Digital Asset Market Clarity Act, a key component of the broader regulatory push, has advanced within Congress but faces an uncertain path to enactment.
The legislation, often described as one of the most significant crypto regulatory efforts in the United States, has cleared hurdles in the Senate Banking Committee but has not yet secured passage in both chambers. The bill’s fate is intertwined with the broader political calendar, including midterm elections and the banking lobby’s influence, which has at times opposed certain stablecoin provisions and yield strategies. As of the latest reporting, it remained uncertain whether the CLARITY Act would be signed into law in 2026, despite its passage through committee.
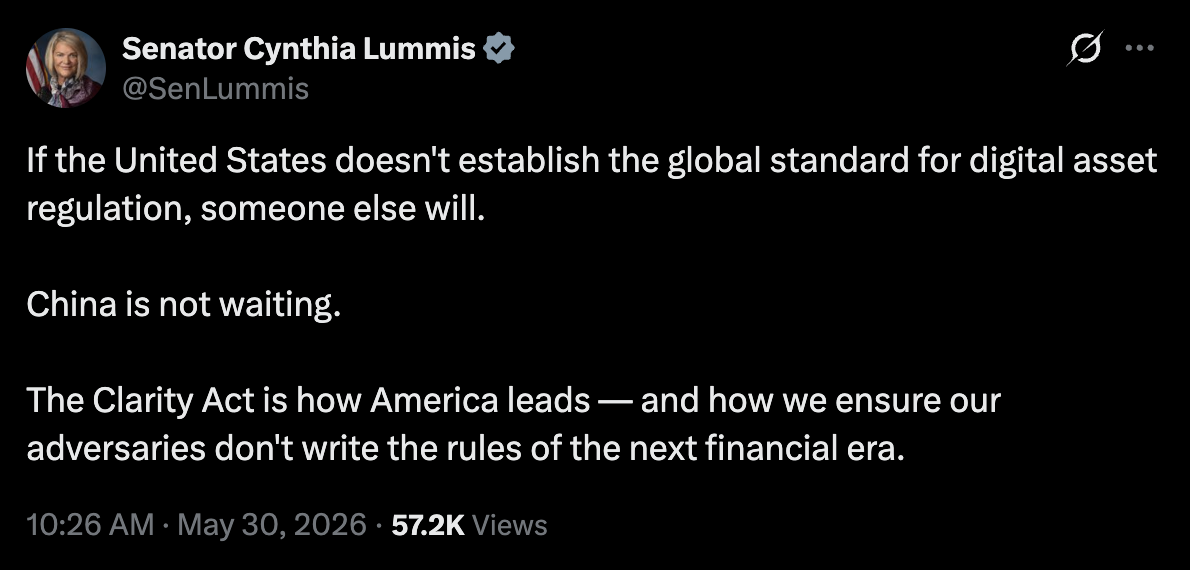
In parallel, Senator Cynthia Lummis has warned that failure to pass the framework could cost the US its leadership role in crypto. In a recent X post, she argued that America’s dollar-dominated financial system has anchored global stability for a century and that the CLARITY Act would help the US build the next iteration of that system—“before Beijing decides it will.” Lummis’ message underscores a strategic imperative within the US policy arena: moving from debate to enactment to preserve influence in a rapidly digitizing financial world.
The broader implication for market participants is nuanced. While a clear regulatory regime could unlock investment and innovation, the transition period remains fraught with risk as different agencies and lawmakers weigh issues such as stablecoin yield, consumer protection, and the prudential requirements for tokenized deposits. The sense of urgency expressed by lawmakers like Lummis reflects a concern that lagging policy could invite competitive pressure from other jurisdictions that move more decisively on digital asset frameworks.
Context surrounding the EU and other jurisdictions also colors the policy backdrop. For instance, reporting around European discussions on euro stablecoins has underscored regulators’ emphasis on financial stability risks and the need for robust safeguards. While not the focus of the Dubrovnik discussion, these regional developments contribute to a global pattern: policymakers are balancing innovation with systemic risk as digital money becomes more embedded in everyday commerce.
As the policy dialogue evolves, investors, traders, and builders are watching not just the letter of the law but how its interpretation and enforcement will shape product design, custody solutions, and the monetization pathways for digital assets. The CLARITY Act’s progress will continue to be a bellwether for the pace at which the United States integrates digital money into its financial framework—and, by extension, how it competes on the world stage with other digital finance ecosystems.
In sum, the Dubrovnik debate highlighted a tension baked into the future of digital money: a landscape where CBDCs, stablecoins, and tokenized deposits each have roles to play, but where policy clarity and timely enactment will determine which path gains traction first. Market participants should monitor developments in the US legislative process, watching for signs that a comprehensive regulatory framework for digital assets is near, and for indicators about how rapidly tokenized deposits and stablecoins will scale in a shifting global payments regime.
Readers should stay tuned for updates on the CLARITY Act’s progress through Congress, any new central-bank stances on digital money, and how evolving regulatory expectations will influence the design and adoption of dollar-backed stablecoins and tokenized deposits in the coming months.

US Federal Reserve governor Christopher Waller said Sunday that the growing use of dollar-backed stablecoins could bolster the global influence of US monetary policy.
Waller told participants at the 32nd Dubrovnik Economics Conference that countries that increasingly rely on stablecoins backed by the US dollar may effectively import US monetary conditions, Bloomberg News reported Sunday.
“I’ve always just looked at stablecoins as a payment instrument; there’s nothing evil about it, nothing dangerous about it,” Waller said. “They are just bringing competition into the payments world,” Reuters reported.

Source: The 32nd Dubrovnik Economic Conference
A contrary view was presented by his fellow presenter, Bank of England policymaker Megan Greene, who said stablecoins could fade from view in a matter of a few years. She said:
“I think tokenized deposits are probably going to take over from stablecoins and five years from now, I suspect we might wonder why we were talking about stablecoins.”
Both were part of a panel discussion titled “Stablecoins and monetary policy” at the annual Croatian National Bank event.
A long-time skeptic of central bank digital currencies (CBDC), Waller said that enthusiasm for CBDCs has faded among many central banks. BoE’s Greene disagreed.
“I like to think of it as a massive race between the tortoise, the hare and the rhino.” Greene said. “The tortoise is the central bank digital currency …the hare is stablecoins and the rhino is tokenized deposits. We’ll probably end up with all three, but if I had to put money in one … it would be the rhino, tokenised deposits, which I think will probably take off,” Reuters reported.
Related: ECB pushes back on euro stablecoin proposals, citing financial stability risks
Stablecoin policy stymies US crypto legislation
Debate over US policy on stablecoin yield has stymied progress on the US Digital Asset Market Clarity Act under consideration in the US Senate.
The crypto market structure bill is one of the most significant pieces of crypto regulations in the US, but it is unclear if it will be signed into law in 2026 due to opposition from the banking lobby and the looming US midterm elections.
The CLARITY Act, which aims to establish a federal regulatory framework for digital assets passed out of the Senate Banking Committee on May 15 after months of debate between banks and the crypto industry over stablecoin yield provisions. However, it must still pass both chambers of Congress before heading to the president’s desk.
Wyoming Senator Cynthia Lummis warned Saturday that the US will lose its leadership position in crypto to other countries, including China, if lawmakers fail to pass the legislation this year.
Source: Senator Cynthia Lummis
“America built the dollar-dominated financial system that has anchored global stability for a century. The Clarity Act ensures we build the next one. The time to act is now, before Beijing decides it will,” Lummis said in an X post.
Learn: Why banks are fighting stablecoins after shaping the rules

🚨Official: Mexico unveil Javier Aguirre’s squad for the World Cup

Off-Grid OCR Server Powered By IPhone
Families unite in remembrance of Troubles victims at Derry church service


-

 NewsBeat5 days ago
Israel says it has killed new Hamas military leader in Gaza City airstrikes
-

 Tech5 days ago
NASA taps Blue Origin to deliver lunar rovers for Moon Base initiative
-

 Politics7 days ago
Bridgerton Season 5: Cast, Release Date And Everything We Know So Far
-

 News Videos5 days ago
XRP *JUST* SUCCEEDED!!!! CLARITY ACT EXPOSED!!! (SHE EXPOSED IT)
-

 Sports6 days ago
2026 NBA Finals schedule, odds: Knicks await Thunder or Spurs after winning East
-
Crypto World5 days ago
Micron Crosses $1 Trillion Market Cap as AI Demand Reshapes Memory Sector
-

 Business5 days ago
Selena Gomez Reportedly Upset Over Benny Blanco’s Comments on Her ‘Terrible’ Diet
-

 News Videos3 days ago
This is BROKEN! INSANE 5x MONEY CAR WASH WEEK! The NEW GTA Online UPDATE Today! (GTA5 New Update)
-

 Business7 days ago
BTS Sells Out Four Las Vegas Shows at Allegiant Stadium for ARIRANG World Tour
-
 NewsBeat6 days ago
Hottest May day ever as London hits 34.8C in 2C leap from previous records
-
 Tech6 days ago
China assigns ID codes to 28,000+ humanoid robots
-

 Business6 days ago
Nikkei 225 Surges Past 65,000 for First Time as Iran Peace Hopes Fuel Record Rally
-

 Tech7 days ago
Microsoft’s quiet Claude Code retreat and the real cost of enterprise AI
-

 Tech3 days ago
Waymo dominates autonomous vehicle registrations as Tesla trails behind
-

 NewsBeat6 days ago
Crowds find riverside shade in York as temperatures soar
-
Tech5 days ago
The Samsung pay deal is the moment Korean unions changed register
-

 Tech7 days ago
Westone Audio and Etymotic Acquired by Fidelity Collective in Major IEM Market Move
-
 Entertainment6 days ago
‘Breaking Bad’ Star’s Easy-to-Binge 6-Part Crime Series Spin-Off Is Finally Heading to Free Streaming
-

 Tech5 days ago
Millions of AI agents imperiled by critical vulnerability in open source package
-
Crypto World5 days ago
SpaceX’s $2 Trillion IPO: Why Tech Giants Nvidia (NVDA), Apple (AAPL), and Microsoft (MSFT) May Face Pressure
You must be logged in to post a comment Login