
Crypto World
Gate 2026 Q1 Spot Listing Key Stats: 35.7% of Exclusive Listings Gained 100%+ in One Week
In the first quarter of 2026, against the backdrop of overall pressure in the crypto market and a more cautious risk appetite among capital, high quality early stage assets remained one of the most attractive structural opportunities in the market.
Gate listed a total of 37 new spot assets in Q1, covering 77.1% of the newly added projects across major exchanges during the same period, of which 27 were first listings, accounting for 73% of Gate’s new listings for the quarter; additionally, 14 were exclusive listings, representing 37.8%.
Amid heightened market volatility, Gate maintained a steady listing pace, strong capability in onboarding high quality projects, and a consistent ability to deliver positive return opportunities.
Overall Overview
From the perspective of total sample size, in the first quarter of 2026, using seven major platforms including Gate as the sample, a total of 48 new projects were listed across leading exchanges.
Among them, Gate listed 37 projects during the quarter, corresponding to a coverage rate of 77.1%, meaning that among the newly added high quality supply competed for by major platforms in Q1, Gate covered more than three quarters of the projects.
For general users, the importance of coverage is self evident. It directly determines whether users can access a sufficiently complete set of core new market listings on a single platform. If a platform has relatively low coverage, even if a few projects perform well, it can still leave users with the impression that important projects are not fully represented.
A coverage rate of 77.1% indicates that at least during Q1, Gate remained closely aligned with the mainstream pipeline of new project supply, allowing users to access most of the new assets worth paying attention to on the platform.
However, what truly defines Gate’s competitiveness is not only the breadth of coverage, but also the structure of that coverage.
Among the 37 new assets listed by Gate in Q1, 27 were first listings, accounting for 73%, while 14 were exclusive listings, representing 37.8%. If calculated based on the overall sample of major exchanges, Gate’s first listing coverage reached 56.3%. In other words, among the 48 new projects listed across major exchanges in Q1, more than half were first listed on Gate.
A high proportion of first listings indicates that Gate has strong attractiveness at the critical stage when projects transition from primary market narratives into secondary market trading. Projects choosing Gate as one of their initial public trading venues essentially reflects recognition of Gate’s user base, liquidity absorption capacity, initial price discovery efficiency, and market distribution capability. A platform that consistently secures first listings is often in a relatively proactive position in competition for project resources.
A meaningful share of exclusive listings reflects another layer of capability with substantial value. First listings demonstrate a platform’s ability to participate in mainstream high quality supply, while exclusive listings indicate whether the platform possesses independent judgment and differentiated sourcing capabilities.
Especially in a weak market environment, the selection difficulty for exclusive projects is higher, as exclusivity implies a lack of sufficient external validation from other platforms, requiring the platform to bear the responsibility of early judgment. If selection proves inaccurate, post listing performance will quickly reflect the issue; if exclusive projects perform well after listing, it not only indicates access to resources but also strong forward looking evaluation capability.
From this overall overview, Gate’s core foundation in Q1 can be summarized in three key characteristics.
(1) Broad coverage, indicating continuous participation in top tier new supply;
(2) High proportion of first listings, indicating strong capability to capture high quality projects at their entry into the market;
(3) A meaningful share of exclusive listings, showing that the platform is not merely following the market, but actively identifying and positioning differentiated assets in advance.
Taken together, these three factors form the foundation of Gate’s spot listing system in Q1. Only when coverage, first listings, and exclusivity all hold simultaneously can a platform’s listing framework be considered complete.
Post Listing Performance: Consistent Positive Return Coverage Across Short Term and 7 Day Windows
The quality of a platform’s listing performance cannot be evaluated solely by whether it secures projects, but also by whether those projects demonstrate stable performance after listing. A key characteristic of Gate in Q1 is that newly listed projects exhibited relatively consistent time series behavior across multiple holding periods, with overall positive return coverage remaining relatively stable.
Figure 1: Share of Gate New Listings With Price Increases Across Timeframes (5m–7d)
From the perspective of the share of price increases, among newly listed projects in Q1, 58.3% rose within the first 5 minutes after listing, 54.1% maintained gains at the 1 hour interval, 56.8% still recorded positive returns after 24 hours, 54.1% were up after 3 days, and 50.0% remained in an upward trend after 7 days. The data shows that the positive return coverage of Gate’s listed projects remained relatively stable across multiple holding periods.
Many new projects are driven by early speculative capital, short term sentiment, and traffic momentum at the opening stage, often leading to rapid initial price surges. However, if the project lacks fundamental support or if the platform’s liquidity absorption is insufficient, such gains tend to fade quickly, resulting in significantly weaker performance after 24 hours.
This is not the case for Gate’s Q1 sample. Across 5 minutes, 1 hour, 24 hours, and 3 days, the share of projects with price increases consistently remains above 50%, indicating that most listed projects did not exhibit a typical pattern of opening high and trending downward during the core price discovery window.
The 24 hour and 3 day intervals are particularly meaningful as reference points. Most participants in new listings are not ultra short term traders, and many operate on intraday, overnight, or short cycle holding strategies.
For these users, the fact that 56.8% of projects are up after 24 hours and 54.1% are up after 3 days reflects a more realistic trading experience. It indicates that positive return opportunities for Gate’s new listings are not limited to the initial opening phase, but show a degree of continuity during the key post listing holding window.
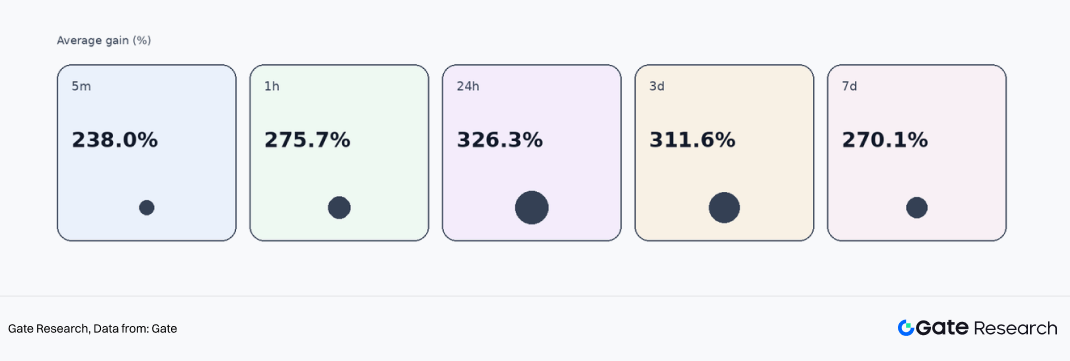
Further examining the average gains of projects that recorded price increases provides a clearer view of return elasticity. In Q1, the average gains for rising projects across the 5 minute, 1 hour, 24 hour, 3 day, and 7 day intervals were 238.0%, 275.7%, 326.3%, 311.6%, and 270.1%, respectively.
This indicates that once high quality new listings on Gate establish early positive momentum, the potential for price expansion remains substantial. Notably, during the 24 hour and 3 day windows, average gains remain around 300%, suggesting that the wealth effect of high quality projects has not disappeared in a weak market, but is instead more concentrated in a subset of carefully selected assets.
Figure 2: Average Gains of Rising Gate New Listings Across Timeframes (5m–7d)
Of course, looking at average gains alone does not provide a complete picture, as averages are easily influenced by extreme outliers, which can obscure the typical performance of most projects. Therefore, the median is particularly important in this context.
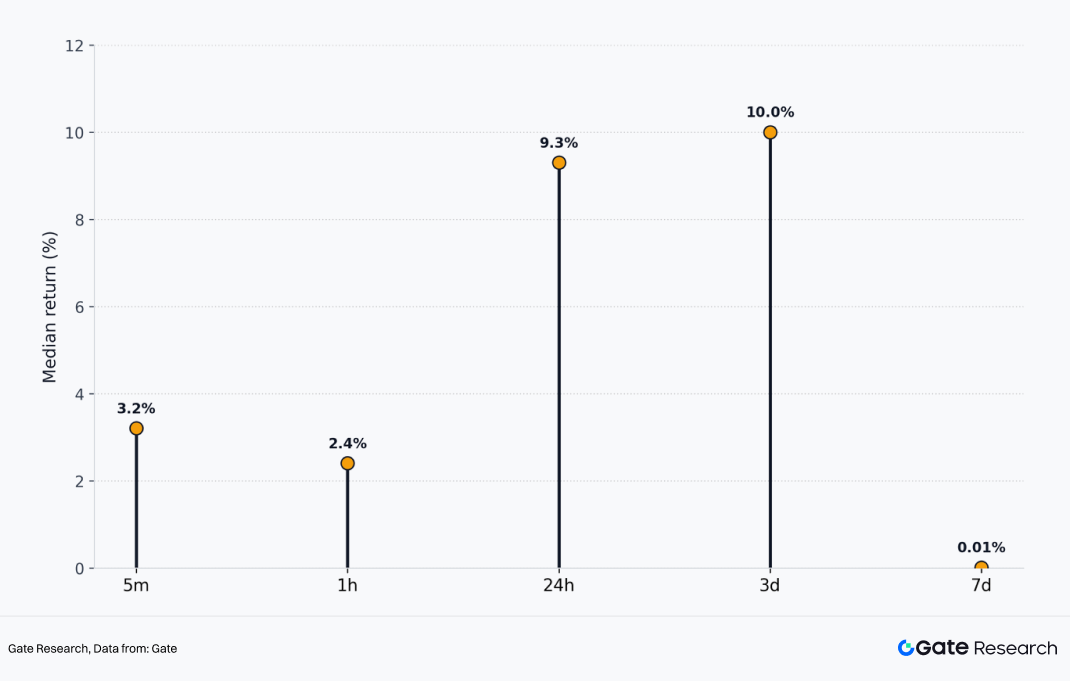
The median gains of newly listed projects in Q1 were +3.2% at 5 minutes, +2.4% at 1 hour, +9.3% at 24 hours, +10.0% at 3 days, and +0.01% at 7 days. Even when excluding the impact of extreme high multiple projects, the typical project performance within the sample still shows clearly positive returns at the 24 hour and 3 day stages.
This indicates that the overall performance of Gate’s spot listings during the quarter was not driven solely by a small number of outliers lifting the average, but rather that most projects maintained a certain level of positive return potential during the core post listing observation window.
Figure 3: Median Price Increase of Gate New Listings Across Timeframes (5m–7d)
For general users, what truly determines the participation experience is not whether there are one or two projects with extremely high returns, but whether the overall quality of new listings on the platform is consistent and whether it demonstrates a certain level of repeatability.
Based on the median data, Gate provided a clear answer in Q1, at least within the 24 hour to 3 day window: its spot listings exhibited strong consistency and a certain level of positive expected returns.
At the same time, the near flat median at 7 days also reflects another fact. The advantage of new listings is primarily concentrated in the early stage of post listing price discovery rather than extending indefinitely.
After 7 days, the market enters a more advanced phase of differentiation and elimination, where disparities between projects expand rapidly. Therefore, for users, not all new listings are suitable for long term holding; instead, within the first 24 hours to 3 day window after listing, the market presents a clearer and more stable density of return opportunities.
First Listings and Non-First Listings: A Dual Track Structure
When discussing a platform’s listing capability, many tend to focus entirely on first listings. While first listings are important, a platform with a truly mature listing system demonstrates its strength not only through first listings, but through the ability of different types of projects to form their own clear return logic. Based on Q1 data, this characteristic is particularly evident for Gate.
First Listings: Dominant in Quantity with Stronger Return Elasticity
In Q1, Gate recorded 27 first listings, accounting for 73% of all new listings. First listings formed the core of Gate’s listing structure in Q1, meaning that in most cases, the platform directly participated in the initial stage when projects entered the secondary market.
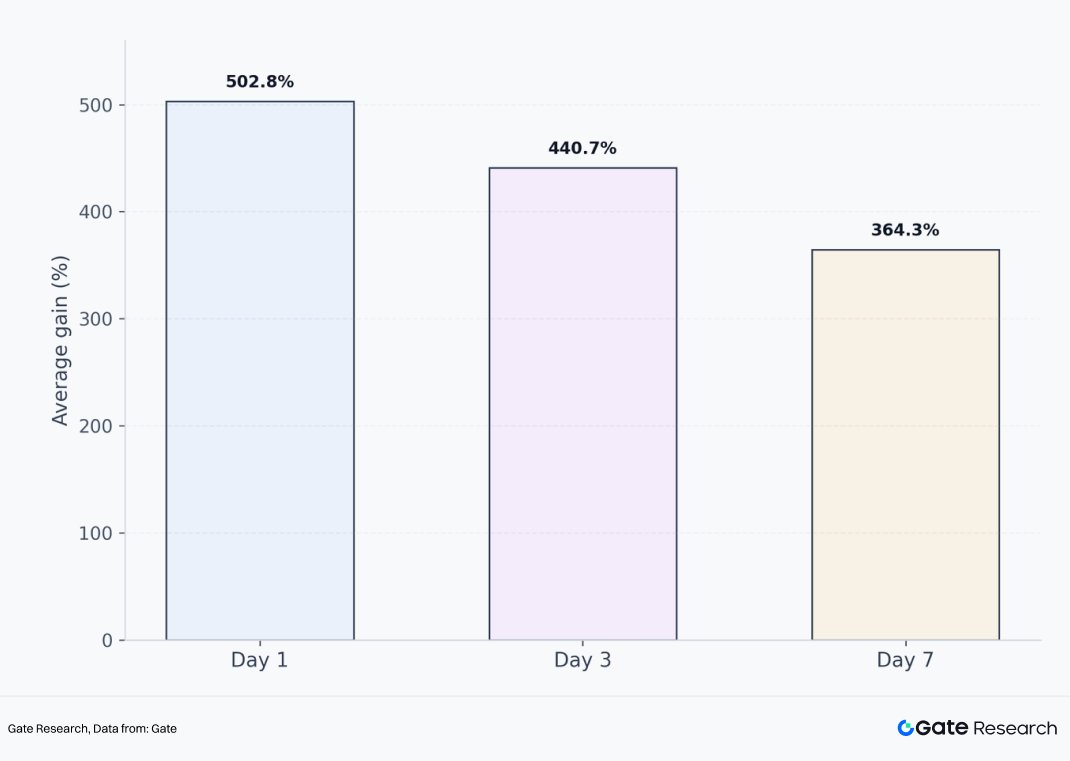
In terms of performance, the most notable characteristic of first listings is their strong return elasticity. Data shows that nearly 46% of first listed projects remained in an upward trend after 7 days; among the projects that increased in price, the average gains reached 502.8%, 440.7%, and 364.3% on the first day, 3 day, and 7 day intervals, respectively.
This indicates that the core advantage of Gate’s first listings lies not only in early access, but in their ability to build market momentum starting from Gate, often resulting in stronger price expansion potential.
Figure 4: Average Returns of Rising Gate Listings Across Holding Periods (1d, 3d, 7d)
From the perspective of extreme return distribution, this high elasticity is further validated. Among first listings in Q1, 7.4% of projects recorded gains exceeding 500% and even 1,000% within 24 hours. This indicates that within Gate’s listing system, the first listing segment serves as an entry point for high payoff opportunities.
Not every project is guaranteed to surge, but once a selected first listing aligns with market attention, narrative strength, and traffic momentum, the resulting price response is often more pronounced.
The underlying logic is straightforward. First listings occur at the earliest stage of public trading, where price discovery is still incomplete, market understanding is rapidly forming, and capital can concentrate more easily within a short period.
For platforms, the ability to secure high quality projects at this stage determines their capacity to provide users with high payoff, high attention early trading opportunities. For users, first listings offer the potential for earlier participation and higher return elasticity, but also come with greater volatility and faster divergence.
Non-First Listings: Smaller in Number but More Stable in Trend
Compared with first listings, Gate recorded 10 non-first listings in Q1, representing a significantly smaller share. However, in terms of performance, these projects demonstrate more stable median returns.
Figure 5: Win Rate and Median Price Increase of Gate Non-Initial Listings Across Timeframes (5m–7d)
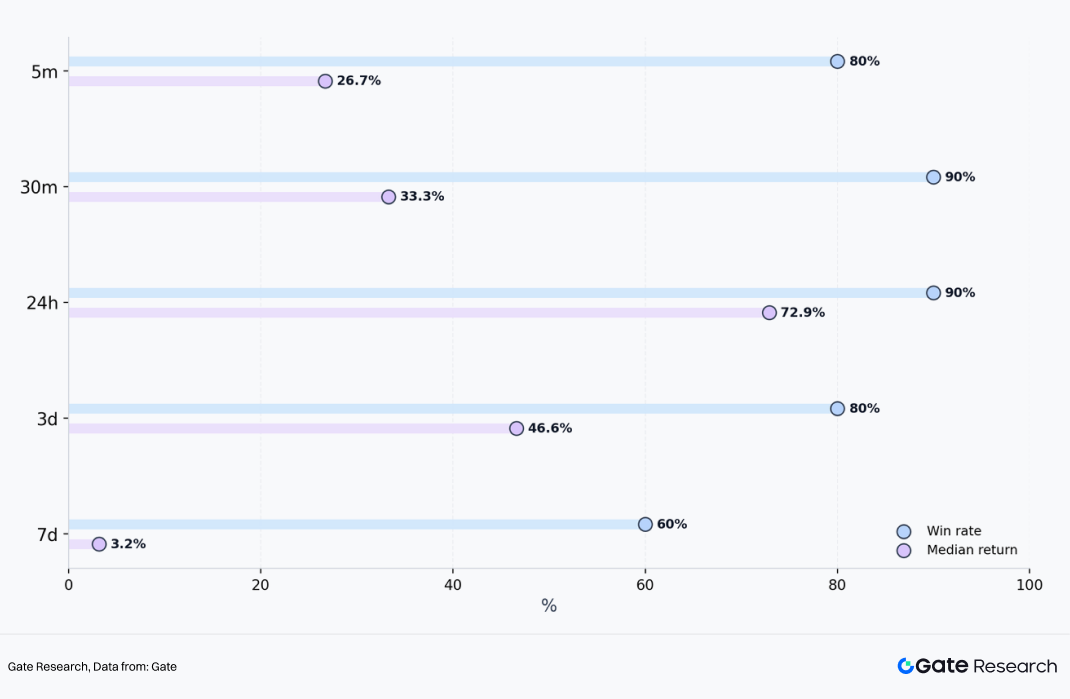
Data shows that non-first listings recorded price increase shares of 80%, 90%, 90%, 80%, and 60% across the 5 minute, 30 minute, 24 hour, 3 day, and 7 day intervals, respectively; the corresponding median gains were +26.7%, +33.3%, +72.9%, +46.6%, and +3.2%. In addition, 40% of non-first listing projects achieved gains exceeding 100% within 24 hours.
The data indicates that although non-first listings do not possess the same initial pricing advantage as first listings, they demonstrate higher success rates of price increases under Gate’s screening mechanism.
This is because non-first listing projects have typically undergone initial market validation, allowing the platform to conduct a second layer of selection based on more comprehensive factors such as price performance, community attention, narrative diffusion, and market absorption conditions, thereby offering greater certainty compared to first listings.
Overall, Gate’s listing structure does not rely solely on first listings to demonstrate its advantage, but instead forms two complementary pathways: first listings provide higher elasticity and stronger wealth effects, while non-first listings deliver more stable median returns.
The former is more aligned with an aggressive approach, while the latter is more aligned with a stable strategy, together enabling the platform to serve different user preferences. From the platform perspective, this dual track structure is more mature than relying solely on first listings.
It shows that Gate is not mechanically pursuing a higher number of first listings, but is also able to continuously provide effective opportunities through the timing and secondary selection of non-first listing projects.
Exclusive Listings: The Segment That Best Reflects Gate’s Proactive Judgment Capability
If first listings reflect a platform’s ability to participate in mainstream high quality supply, exclusive listings reflect a more proactive capability in project selection, resource acquisition, and forward looking judgment. Exclusive listings directly reveal a platform’s project evaluation standards, risk control capability, and execution efficiency.
In Q1, Gate exclusively listed 14 projects, accounting for 37.8% of all new listings. This proportion itself indicates that Gate was not merely passively following the mainstream market listing cycle during the quarter, but instead maintained a differentiated project pipeline to a significant extent. More importantly, these exclusive projects did not underperform after listing; on the contrary, they demonstrated strong competitiveness across multiple key time windows.
Figure 6: Win Rate and Median Price Increase of Gate Exclusive Listings Across Timeframes (24h–7d)
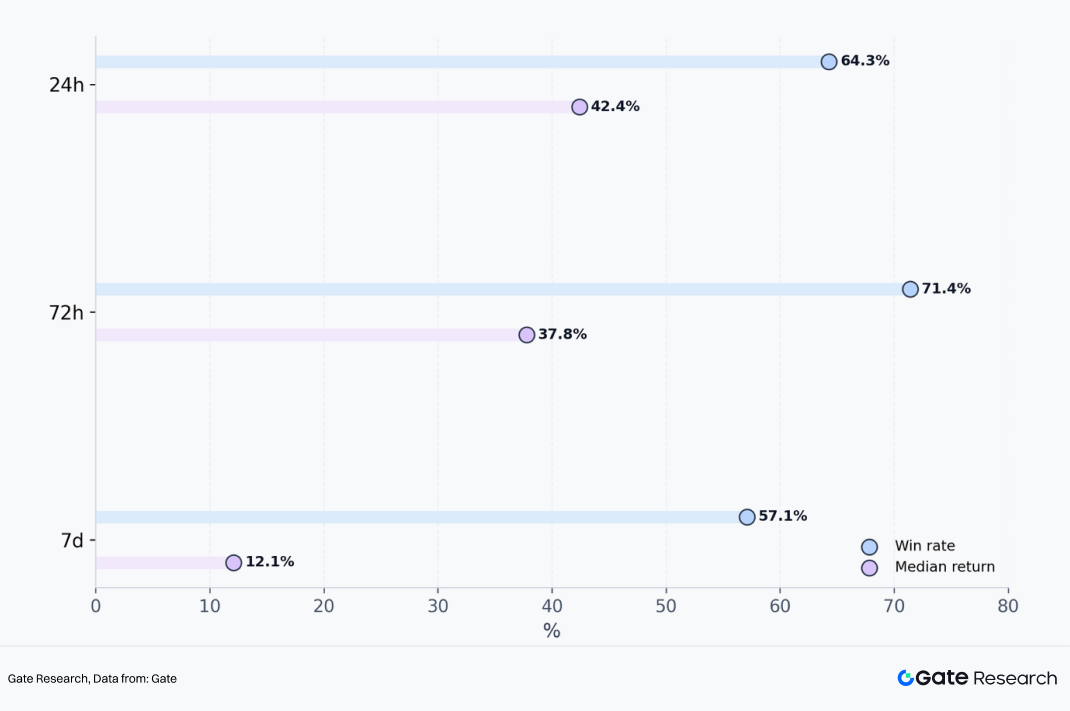
From the perspective of success rate, exclusive listings recorded price increase rates of 64.3%, 71.4%, and 57.1% across the 24 hour, 72 hour, and 7 day intervals, respectively, with the 72 hour window showing the strongest performance. This means that during the period from day 2 to day 3 after listing, Gate’s exclusive projects did not weaken rapidly as initial listing momentum faded, but instead demonstrated clearer capital absorption and upward price momentum.
From the perspective of median returns, exclusive listings achieved +42.4%, +37.8%, and +12.1% across the 24 hour, 72 hour, and 7 day intervals, respectively. This indicates that exclusive projects not only have a relatively high share of price increases, but also deliver median returns that are significantly higher than the overall sample. This suggests that the strong performance of exclusive listings is not driven by a small number of extreme cases, but rather that most projects provide solid return quality within the core observation windows.
Further examining the distribution of extreme returns makes the characteristics of exclusive listings even clearer. From 30 minutes after listing up to 30 days, more than 20% of exclusive projects consistently achieved gains exceeding 100%; during the 3 to 7 day window, the share of projects with gains above 100% reached as high as 35.7%, significantly higher than the 15.4% observed among all first listings; even when extended to a 30 day horizon, 12.5% of exclusive projects still recorded gains exceeding 500% and even 1,000%.
Taken together, these data points indicate that Gate’s exclusive listings do not rely solely on initial scarcity driven momentum at the opening stage, but are able to sustain price discovery and attract consistent buying support across multiple post listing time windows, with a relatively high probability of delivering more pronounced return trajectories.
Case Review
Based on Q1 cases, Gate’s project selection broadly followed three pathways: one category consists of high attention projects where Gate completed early first listings or priority onboarding, followed by validation from other platforms; another category includes exclusive listings on Gate that delivered strong subsequent performance, reflecting the platform’s independent selection capability; the third category consists of narrative driven projects with strong community traction and topic diffusion, demonstrating the platform’s sensitivity to sentiment driven sectors.
Solana Mobile (SKR): Early First Listing Execution on High Attention Projects
Solana Mobile belongs to the DePIN sector, achieving an ATH increase of 2,459% after TGE and a 30 day gain of 715%. As a combination of Solana’s official hardware phone and Web3 applications, Solana Mobile benefits from inherent brand endorsement, a strong community foundation, and significant dissemination advantages. Gate conducted a simultaneous first listing with two other CEXs and went live one day ahead of B*** Alpha to capture market share, indicating that Gate maintained strong responsiveness to globally high attention projects in Q1.
From the SKR listing, it can be seen that Gate is able to enter the key early window for projects with high traffic, strong narratives, and elevated expectations, allowing users to participate before broader market coverage occurs. This capability reflects Gate’s competitive position in accessing mainstream high quality project supply.
CodexField (CODEX): A Representative High Return Exclusive Listing
CodexField belongs to the content creation sector and is one of the most representative exclusive listings on Gate in Q1. It recorded an ATH increase of 4,900% and maintained a gain of 2,566% as of March 25, while B***, B***, and B*** had not yet listed the project.
If exclusive listings best reflect a platform’s proactive selection capability, then CodexField serves as a clear demonstration of Gate’s strength in this area. The project received institutional investment from Gate Labs prior to listing, and Gate provided the initial secondary market pricing venue, ultimately generating a strong wealth effect.
For projects that are not yet widely covered but possess strong growth potential and market imagination, Gate has the ability to establish early positioning and, through its platform liquidity and user base, convert these opportunities into verifiable market outcomes.
Lobster: An Early Positioning Case in AI plus Meme Narratives
The combination of AI and Meme was a high attention yet highly differentiated direction in Q1. Many projects had strong narratives but lacked sustainability, while others demonstrated strong dissemination capability without translating into trading results. Lobster belongs to the AI plus Meme category and was first listed on Gate, achieving an ATH increase of 286% and a 7 day gain of 164%; B*** Alpha followed with a listing the next day after observing Gate’s market signal. This case highlights Gate’s early positioning capability in highly viral narratives, as well as its ability to lead early price discovery.
Overall, these cases show that Gate’s spot listing performance in Q1 was not driven by a single type of project, but rather by a combination of multiple sectors, styles, and narratives. The platform is capable of onboarding high attention mainstream projects while also identifying exclusive growth oriented projects; it covers both technology and product driven projects, as well as community culture and sentiment driven assets. This diversity itself reflects the maturity of Gate’s listing system.
Conclusion
Overall, Gate’s spot listing performance in the first quarter of 2026 can be summarized in one sentence: in a market phase characterized by overall pressure, reduced opportunity density, and intensified project divergence, Gate continued to maintain a relatively high quality pipeline of new listings and convincing post listing performance.
During a period where strong outcomes are not easy to achieve, Gate’s overall sample maintained a relatively high share of price increases across multiple time windows, with median returns at 24 hours and 3 days remaining positive. New listings demonstrated a certain breadth of performance, where first listings provided stronger return elasticity, non-first listings delivered higher success rates, and exclusive listings reflected greater scarcity and stronger mid term performance. The platform’s listing capability is not driven by isolated strengths, but by a systematic and integrated framework.
For users, Gate provides a more complete and structured early stage participation framework. Users seeking higher return elasticity can focus on first listings for higher payoff opportunities; users preferring more stable pathways can look to the higher success rate characteristics of non first listings; users aiming to access differentiated assets before broad market coverage can pay closer attention to Gate’s exclusive listing segment. For project teams, Q1 data also demonstrates that Gate possesses strong capabilities in initial trading support, liquidity organization, and price discovery.
From a longer term perspective, the core competition in spot listing capability among exchanges ultimately lies in whether they can consistently maintain strong project sourcing, selection, and outcome realization across different market cycles. Gate’s Q1 data clearly demonstrates this point: even in a weak market, Gate is able to list accurately, select with stability, and deliver tangible results.
Gate Research is a comprehensive blockchain and cryptocurrency research platform that provides deep content for readers, including technical analysis, market insights, industry research, trend forecasting, and macroeconomic policy analysis.
Disclaimer: Investing in cryptocurrency markets involves high risk. Users are advised to conduct their own research and fully understand the nature of the assets and products before making any investment decisions. Gate is not responsible for any losses or damages arising from such decisions.
The post Gate 2026 Q1 Spot Listing Key Stats: 35.7% of Exclusive Listings Gained 100%+ in One Week appeared first on BeInCrypto.


Bitcoin spot ETFs may soon surpass gold ETFs in assets under management, fracturing the long-standing narrative that “digital gold” is a perfect stand-in for investors seeking a safe haven. Bloomberg ETF analyst James Seyffart shared the view in an interview linked to the Coin Stories podcast, arguing that Bitcoin’s multiple use cases — from store of value to growth asset and liquidity driver — create a broader appeal than gold, which the market typically frames in a single light.
“There are just more use cases of why somebody would put a Bitcoin ETF in a portfolio,” Seyffart said on the podcast. He emphasized Bitcoin’s roles as a store of value, a portfolio diversifier, a form of digital capital, and even a growth-risk asset, suggesting that the crypto may attract a wider spectrum of investors than gold over time. While gold has historically served as a hedge against monetary debasement, Bitcoin’s evolving narrative as both a digital asset and a potential macro hedge underpins the case for larger ETF demand in the years ahead.
Key takeaways
- Bitcoin ETFs could grow to exceed gold ETFs in total assets under management as demand broadens beyond the traditional “digital gold” story, according to James Seyffart, a Bloomberg ETF analyst.
- March ETF flows show divergent momentum: U.S. spot Bitcoin ETFs attracted about $1.32 billion in net inflows, while U.S. gold ETFs recorded net outflows of roughly $2.92 billion.
- A single-day move underscored fragility in precious metals: GLD, the flagship gold ETF, posted a $3 billion withdrawal on March 4, the largest daily outflow in more than two years.
- Longer-run macro signals remain mixed, with data suggesting a rotation dynamic between gold and Bitcoin rather than a single clear trend; Fidelity highlighted a historical pattern of leadership rotating between the two assets.
Flow dynamics in March: what they reveal about narrative shifts
The contrast in March ETF flows underscores shifting investor appetites for duration, liquidity, and narrative potential. Gold ETFs in the United States posted net outflows totaling about $2.92 billion in March, signaling renewed challenges for the traditional safe-haven metal in a period of evolving macro cues. In the same month, US spot Bitcoin ETFs drew approximately $1.32 billion in net inflows, illustrating a growing appetite for crypto exposure in diversified portfolios.
The divergence sits against a broader context in which Bitcoin and gold have moved more cohesively in recent weeks despite the divergent flows. The data points to a market that is re-evaluating the roles of these two hedges and growth assets in a landscape of persistent inflation concerns, evolving monetary policy expectations, and expanding acceptance of crypto-based investment products.
Gold’s pullback and retail versus institutional dynamics
Several pressures shaped gold’s March performance. The largest daily outflow in over two years hit GLD on March 4, reflecting sell-side and perhaps macro rotation pressures that have periodically punctured the gold regime. Meanwhile, more broad-based BIS data — cited by Cointelegraph — show retail gold purchases tripling over the past six months, while Wall Street selling has accelerated over the last four months. The juxtaposition implies a nuanced narrative: retail demand remains resilient even as institutional appetite shifts toward crypto exposure and related investment vehicles.
These dynamics sit alongside anecdotal expectations that a growing cadre of investors view Bitcoin as a “growth risk asset,” complementary to its role as a hedge-friendly reserve. The evolving taxonomy — Bitcoin as a stores of value, digital currency with intrinsic scarcity, and liquidity-rich growth asset — contributes to a broader array of reasons to own a Bitcoin ETF beyond simply “digital gold.”
Price action and broader market context
As of publication, Bitcoin traded around $66,918, down about 8% over the prior 30 days, according to CoinMarketCap data. Gold hovered near $4,676 per ounce, down about 8.25% over the same period, per GoldPrice metrics. The near-term move preserves the sense that both assets have faced headwinds in a mixed macro backdrop, yet the flow data suggests that investor interest in Bitcoin ETFs remains persistent and possibly expanding even as gold faces episodic outflows.
The longer-term rotation story received some color from Fidelity Digital Assets analyst Chris Kuiper. In December 2025, Kuiper noted that historically gold and Bitcoin have rotated leadership, with gold performing strongly at times and Bitcoin catching up in others. That framework remains relevant as market participants weigh regulatory clarity, ETF availability, and the evolving ecosystem around Bitcoin-based investment products.
Implications for investors and markets
The potential overtaking of gold ETFs by Bitcoin ETFs in AUM would mark a notable shift in how investors allocate capital in search of diversification, liquidity, and growth exposure. If Bitcoin ETFs continue to capture inflows beyond the “digital gold” narrative, the market could see a broader base of participants embracing crypto exposure through regulated vehicles. This would not only change the composition of ETF portfolios but could also influence liquidity, product development, and the pace at which financial institutions bring more crypto-enabled offerings to retail and high-net-worth investors alike.
From a portfolio-management perspective, the idea of Bitcoin acting as hot sauce in a diversified mix is persuasive for those seeking a growth-oriented, liquidity-rich sleeve within a broader asset allocation. Yet the data also underscores the need for caution and continued monitoring of regulatory developments, product approvals, and market structure changes that shape the appeal and risk profile of spot BTC ETFs.
In practical terms, readers should watch ETF inflow trends in the coming quarters, the rate of new product approvals, and the evolving evidence on how Bitcoin-based funds perform relative to gold during different macro regimes. The March data points demonstrate that the narrative around Bitcoin ETFs is gaining traction in investor discourse, even as gold maintains its own complex set of drivers and vulnerabilities.
Beyond price moves, the debate now centers on whether Bitcoin ETFs can sustain and broaden their appeal to a broader investor universe — from traditional equity and bond strategists to macro hedge funds and retail savers seeking diversified exposure. If inflows continue and more products arrive, the BTC ETF story may transition from a niche crypto offering to a core component of diversified portfolios.
What matters next is the trajectory of ETF approvals and listings, clear and consistent data on inflows across different regimes, and how macro factors like inflation momentum and monetary policy directions shape the risk-reward calculus for these funds. Investors should stay attentive to monthly flow prints, regulatory signals, and the evolving narrative around Bitcoin’s role in modern asset allocation.
As the market awaits further clarity, the ongoing dialogue around Bitcoin’s ETF potential points to a future where crypto exposure becomes an increasingly standard instrument within traditional investment frameworks. The next few quarters will be telling, as inflows, product breadth, and price action converge to reveal whether Bitcoin ETFs can definitively eclipse gold ETFs in practical assets under management.

Spot Bitcoin exchange-traded funds (ETFs) could surpass gold ETFs in total assets under management (AUM) as investor demand expands beyond the traditional “digital gold” narrative, according to ETF analyst James Seyffart.
“There are just more use cases of why somebody would put a Bitcoin ETF in a portfolio,” Seyffart said on the Coin Stories podcast published to YouTube on Friday. He pointed to Bitcoin’s (BTC) role as digital gold, a store of value, a portfolio diversifier, and a form of digital capital and property, adding that the market also views Bitcoin as a “growth risk asset.”
Seyffart explained that Bitcoin has “all these different ways” of being viewed, while gold only has “one of those things.”
“Our view is that Bitcoin ETFs will be larger than gold ETFs,” he added.
Bitcoin ETFs are a “hot sauce” in the portfolio
“There are so many people that could use it. They could be viewing it to put in their portfolio because they want to bet on like a growth and liquidity trade,” he said. “It can be hot sauce in a portfolio in that way,” he added.

Bitcoin is often compared to gold due to its limited supply and perceived role as a hedge against monetary debasement.
US-based gold ETFs recorded net outflows of $2.92 billion in March, while US spot Bitcoin ETFs attracted $1.32 billion in net inflows over the same period.
Gold and BTC have declined over the past 30 days
The largest US gold-backed ETF, GLD, recorded a $3 billion outflow on Mar. 4, the largest daily withdrawal in more than two years.
On Mar. 19, Cointelegraph cited data from the Bank for International Settlements (BIS) showing retail gold purchases have tripled over the last six months, while Wall Street selling has accelerated over the past four months.
Related: Bitcoin ‘done’ with 85% crashes, says Cathie Wood amid new $34K target
Despite the divergence in ETF flows, both assets have moved broadly in tandem in recent weeks.
Bitcoin is trading at $66,918 at the time of publication, down 8.07% over the past 30 days, according to CoinMarketCap. Meanwhile, gold is trading at $4,676, down 8.25% over the past 30 days, according to GoldPrice data.
In December 2025, Fidelity Digital Assets analyst Chris Kuiper said that, “historically, gold and Bitcoin have taken turns outperforming. With gold shining in 2025, it would not be surprising if Bitcoin takes the lead next.”
Magazine: Solana exec trolls crypto gamers, Pixel tackles play-to-earn issues: Web3 Gamer

TLDR:
- The tokenized US Treasury market hit $12B, far below the $6T traditional money market fund sector.
- Regulatory obligations follow the entities managing assets, not the tokens representing them onchain.
- Embedded compliance built into RWA protocols removes costly intermediary layers found in traditional markets.
- Major jurisdictions including the EU, Singapore, Hong Kong, and Japan are actively building RWA frameworks.
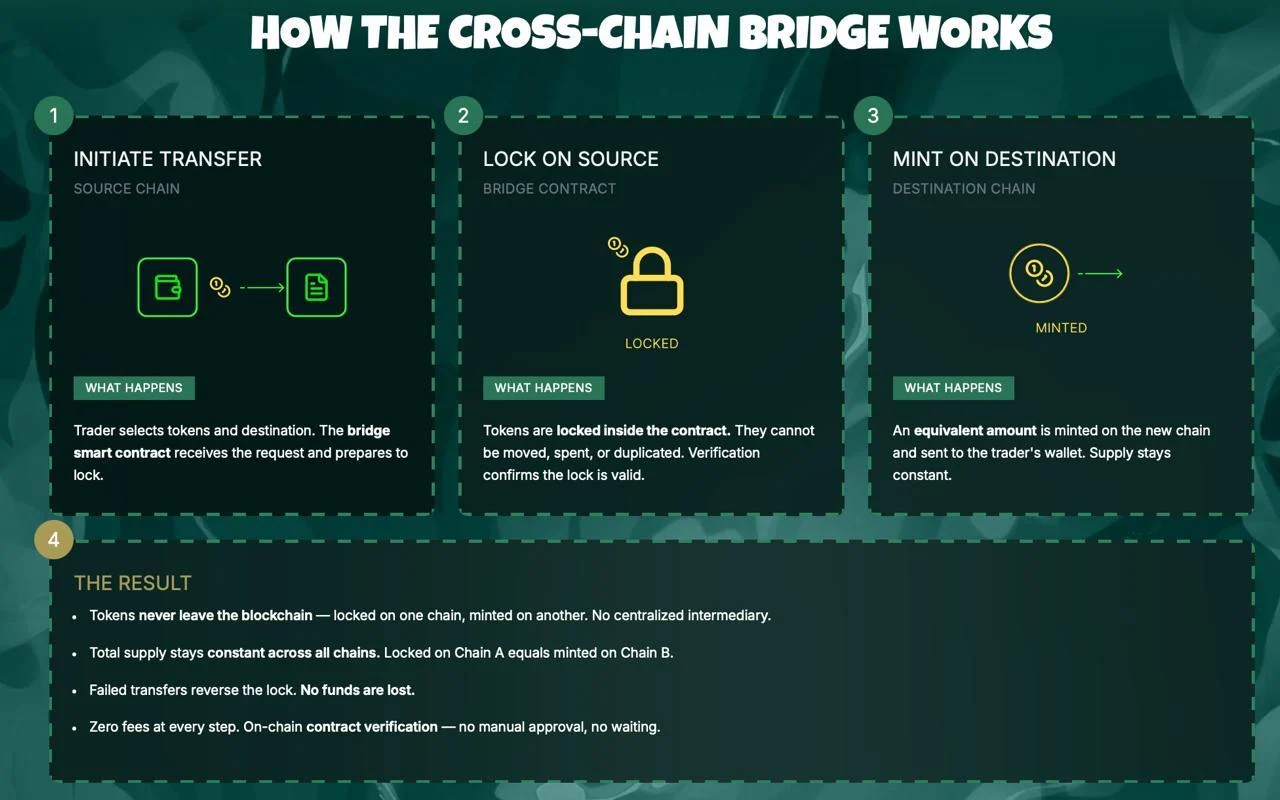
RWA regulation is no longer a side conversation in crypto — it has become the central pillar of tokenized asset infrastructure. As real-world assets move onchain, they carry existing legal obligations with them.
The technology to tokenize bonds, private credit, and equities already works well. However, the legal and compliance layer determines whether those assets carry real, enforceable value for investors.
Without regulatory infrastructure, a tokenized bond is simply a token referencing a bond — nothing more.
The Trust Gap Holding Back Institutional Capital in RWA
The tokenized US Treasury market reached roughly $12 billion as of March 2026. By contrast, the traditional US money market fund industry manages over $6 trillion.
That gap is not a technology problem. The blockchain settles transactions faster, and onchain access is broader than in legacy markets.
The barrier is trust, not capability. A pension fund evaluating a tokenized product needs far more than a working smart contract.
Its compliance team, legal counsel, and board must each confirm that the obligations governing the underlying asset are fully met. That confirmation cannot be approximated — it must be complete.
That standard reflects fiduciary responsibility. These allocators manage other people’s money and carry strict legal accountability for each product they hold.
Every tokenized instrument must meet the same legal standards as traditional market instruments alongside it. That is not a preference — it is a legal requirement.
Plume Network addressed this issue through its RWA Academy series. The team noted that regulatory clarity is “the precondition for institutional capital” in the RWA space.
Regulatory obligations do not sit with the asset itself — they sit with the entities that issue, transfer, and facilitate trading in it. RWA infrastructure must allow those entities to discharge their responsibilities clearly.
Embedded Compliance Is Transforming How RWA Infrastructure Is Built
One key shift in RWA is the transition from bolt-on compliance to embedded compliance. In traditional markets, intermediaries handle compliance at every step of a transaction. Each additional layer adds cost, introduces delay, and reduces transparency for all parties.
Onchain systems can instead build compliance directly into the protocol itself. Transaction screening, transfer restrictions, and KYC/AML verification can all operate within the system. That design eliminates the need for separate compliance layers added after the fact.
The result is a network where compliance is an intrinsic property rather than an add-on feature. That distinction matters enormously for regulated institutions evaluating RWA markets. Institutional adoption of RWA depends on this structural credibility, not just smart contract functionality.
Regulators across major jurisdictions are aligning around the same direction. Europe’s MiCA framework took effect in 2024 and covers all 27 member states.
Hong Kong’s Project Ensemble and Singapore’s Project Guardian are both testing tokenized financial markets with regulatory involvement.
South Korea and Japan are each updating their digital asset laws to accommodate onchain flows. Cross-border fragmentation remains a challenge, but shared principles across frameworks are becoming clearer each month.

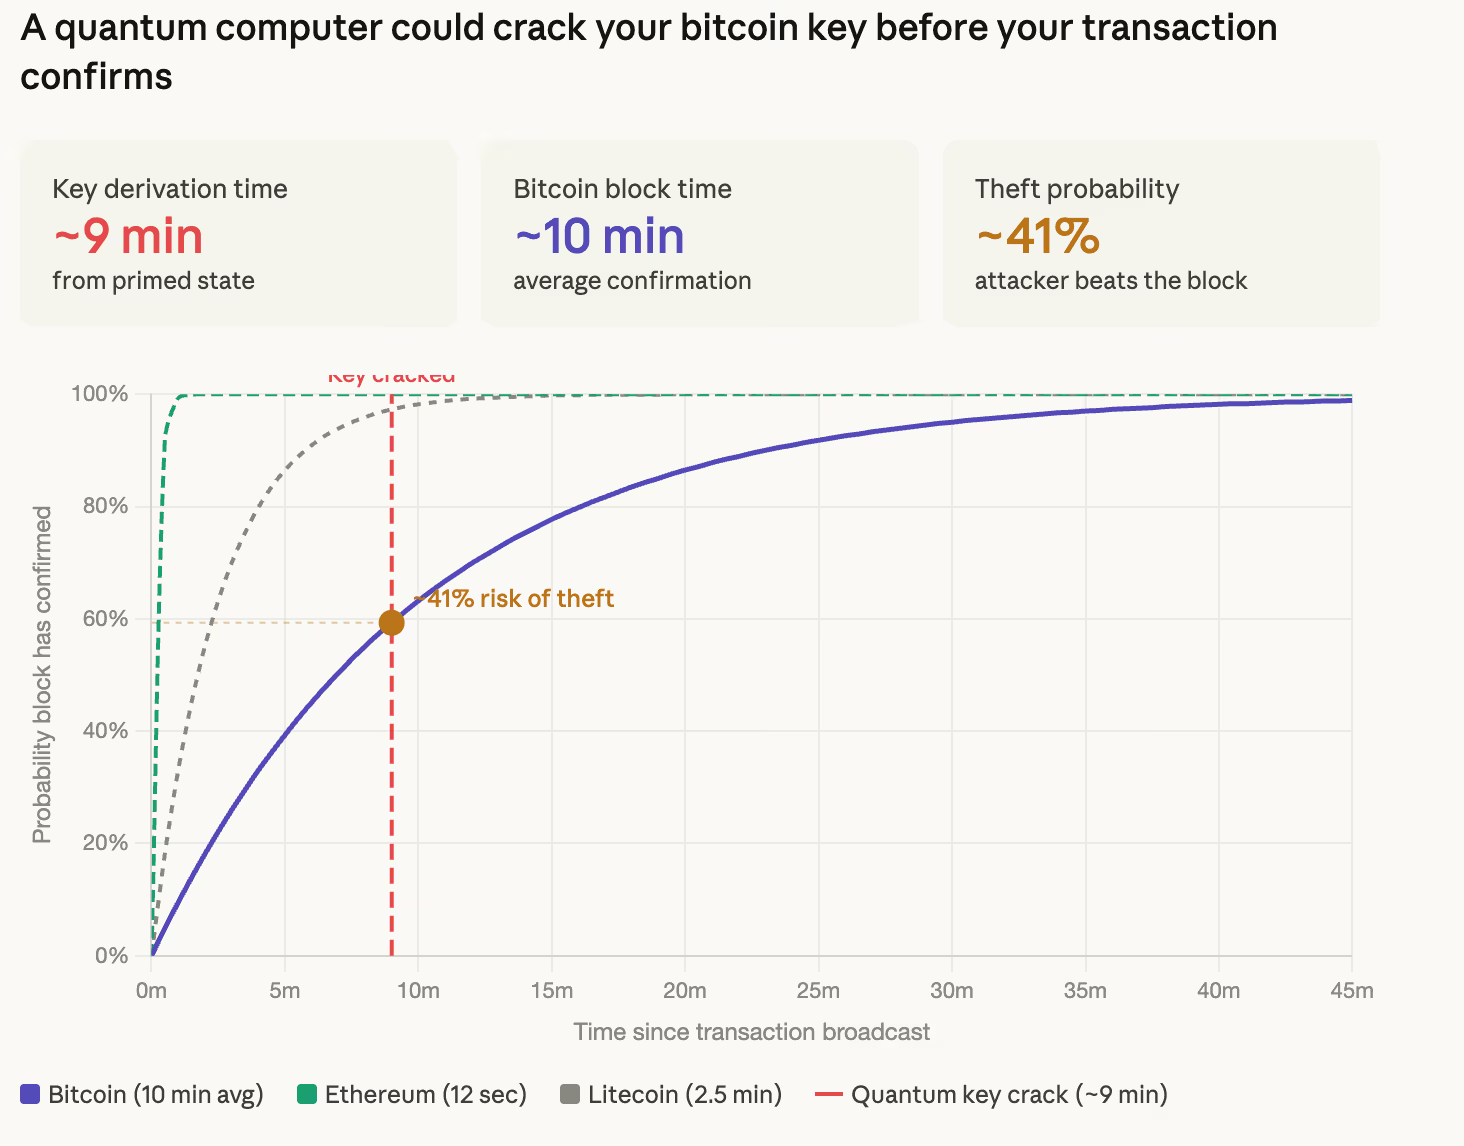
Google’s Quantum AI team said earlier this week that a future quantum computer could derive a bitcoin private key from a public key in roughly nine minutes. The number ricocheted across social media and spooked markets.
But, what does it actually mean in practice?
Let’s start with how bitcoin transactions work. When you send bitcoin, your wallet signs the transaction with a private key, a secret number that proves you own the coins.
That signature also reveals your public key, a shareable address, which gets broadcast to the network and sits in a waiting area called the mempool until a miner includes it in a block. On average, that confirmation takes about 10 minutes.
Your private key and public key are linked by a math problem called the elliptic curve discrete logarithm problem. Classical computers can’t reverse that math in any useful timeframe, while a sufficiently powerful future quantum computer running an algorithm called Shor’s could.
Here’s where the nine minutes part comes in. Google’s paper found that a quantum computer could be “primed” in advance by pre-computing the parts of the attack that don’t depend on any specific public key.
Once your public key appears in the mempool, the machine only needs about nine minutes to finish the job and derive your private key. Bitcoin’s average confirmation time is 10 minutes. That gives the attacker a roughly 41% chance of deriving your key and redirecting your funds before the original transaction confirms.
Think of it like a thief spending hours building a universal safe-cracking machine (pre-computation). The machine works for any safe, but each time a new safe appears, it only needs a few final adjustments — and that last step is what takes about nine minutes.

That’s the mempool attack. It’s alarming but requires a quantum computer that doesn’t exist yet. Google’s paper estimates such a machine would need fewer than 500,000 physical qubits. Today’s largest quantum processors have around 1,000.
The bigger and more immediate concern is the 6.9 million bitcoin, roughly one-third of total supply, that already sit in wallets where the public key has been permanently exposed.
This includes early bitcoin addresses from the network’s first years that used a format called pay-to-public-key, where the public key is visible on the blockchain by default. It also includes any wallet that has reused an address, since spending from an address reveals the public key for all remaining funds.
These coins don’t need the nine-minute race. An attacker with a sufficiently powerful quantum computer could crack them at leisure, working through exposed keys one by one without any time pressure.
Bitcoin’s 2021 Taproot upgrade made this worse, as CoinDesk reported earlier Tuesday. Taproot changed how addresses work so that public keys are visible on-chain by default, inadvertently expanding the pool of wallets that would be vulnerable to a future quantum attack.
The bitcoin network itself would keep running. Mining uses a different algorithm called SHA-256 that quantum computers can’t meaningfully speed up with current approaches. Blocks would still be produced.
The ledger would still exist. But if private keys can be derived from public keys, the ownership guarantees that make bitcoin valuable break down. Anyone with exposed keys is at risk of theft, and institutional trust in the network’s security model collapses.
The fix is post-quantum cryptography, which replaces the vulnerable math with algorithms that quantum computers can’t crack. Ethereum has spent eight years building toward that migration. Bitcoin hasn’t even started.

Coinbase’s bid to build a federally supervised custody and market infrastructure business took a significant step forward when the Office of the Comptroller of the Currency (OCC) granted conditional approval for a national trust bank charter after a six-month review. The decision, however, drew swift pushback from banking groups and reform advocates who argue that the application reveals gaps in risk management, profitability planning, and resolution strategies and that expanding trust powers for crypto activities may exceed the OCC’s statutory remit.
The Independent Community Bankers of America (ICBA) argued that the OCC’s move reflects a broader trend: nonbank entities seeking the benefits of a bank charter without meeting the full regulatory framework that governs traditional lenders. In a statement accompanying its critique, the ICBA warned that the approval could create new safety and soundness risks for consumers and the broader financial system.
The sudden influx of applications demonstrates nonbank entities are seeking the benefits of a US bank charter without satisfying the full scope of US bank regulations.
Coinbase’s bid to broaden its custody and market infrastructure footprint enters a federal regulatory arena that remains unsettled for many crypto activities.
Key takeaways
- OCC grants conditional approval for Coinbase to pursue a national trust bank charter after a six-month review, signaling a potential federal framework for crypto custody and related services.
- Industry and reform groups counter that the application highlights regulatory gaps and could shift risk toward consumers and the financial system if not fully aligned with traditional banking standards.
- Separately, a broad debate over stablecoins and yield-bearing products intensifies scrutiny of how crypto yields fit within or outside existing banking rules, including concerns about potential asset leakage from banks.
- Policy discussions in Washington continue around the US Digital Asset Market Clarity Act, with progress claimed by some lawmakers but key sticking points, such as yield, delaying formal committee action.
Regulatory pushback surrounds Coinbase bank-charter approval
Stablecoins and yield debate intensifies regulatory scrutiny
Bank of America CEO Brian Moynihan estimated that up to trillions of dollars could migrate away from conventional banks if such yields were broadly permitted, potentially constraining banks’ ability to lend and raising borrowing costs for households and businesses.
Policy momentum, investor implications, and what comes next
What to watch next: a clearer alignment on the Digital Asset Market Clarity Act’s key provisions, updates on whether yield-bearing products will be reconciled within traditional banking restrictions, and any further OCC or federal guidance that could define the contours of crypto custody and market infrastructure under a national bank charter.
Crypto World
Chainlink’s $42M LINK Transfer to Binance Sparks Caution as Whale Wallets Hit a One-Year High
TLDR:
- Around 4.9 million LINK tokens worth roughly $42M were transferred to Binance during a low-volume weekend session.
- A single wallet address was responsible for moving 2.5 million LINK directly to Binance in one concentrated transfer.
- Chainlink whale wallets holding 1M or more LINK grew from 100 to 125 between April 2025 and April 2026.
- Analysts remain cautious as large exchange inflows can signal selling pressure, especially during low-liquidity trading periods.
Chainlink has attracted renewed attention following a large on-chain transfer over the weekend. Around $42 million worth of LINK tokens moved to Binance during a period of typically low trading activity.
The movement came alongside fresh data showing a rise in whale wallet accumulation over the past year. Both developments have placed the asset under closer watch from market participants tracking its near-term direction.
The timing has added to growing interest surrounding Chainlink’s current on-chain behavior.
Large LINK Transfers Raise Questions About Exchange Inflows
On-chain analyst Darkfost flagged the transfer on social media this weekend. According to the post, roughly 4.9 million LINK tokens were sent to Binance.
Within that total, 2.5 million LINK came from a single wallet address. The concentration of funds from one source drew added attention to the movement.
The transfers occurred during a weekend, when trading volumes tend to stay lower than usual. Low-liquidity windows can strengthen the price effect of large exchange inflows.
Some participants move large sums during these periods to avoid immediate market disruption. Others may use the timing to position ahead of the regular trading week.
Darkfost outlined two possible explanations for the movement. One is that the Chainlink team relocated funds for custody or under a Binance arrangement.
The other is that a whale or large entity chose Binance for access to its deep order book. The actual reason behind the transfer has not been confirmed.
Large exchange inflows call for a measure of caution from market observers. Funds sent to a trading platform can, under the right conditions, translate into sell-side activity.
Chainlink’s order book is now being watched for any follow-through from these transfers. No major sell event had been reported at the time of publication.
Whale Accumulation in Chainlink Points to Long-Term Confidence
Santiment published data on April 3 showing a notable shift in Chainlink’s whale count. The number of wallets holding one million or more LINK tokens grew from 100 to 125.
That change occurred between April 2025 and April 2026, a period marked by a broader crypto bear market. The data points to quiet accumulation by large holders throughout that time.
Accumulation of this scale often goes unnoticed when price action is flat. On-chain whale metrics, however, offer a longer view of how an asset is being positioned.
Chainlink’s rising whale count reflects steady demand from the top tier of holders. That trend continued even as market conditions remained difficult.
The contrast between exchange inflows and long-term wallet growth presents a layered picture. Near-term transfers to Binance suggest possible selling pressure, while whale accumulation signals continued holding behavior.
These two trends carry different weight depending on one’s investment horizon. Both are expected to remain in focus in the weeks ahead.
Chainlink’s price was recorded at $8.69 at the time of the on-chain activity. Analysts and traders continue to monitor both flows and wallet data for further developments.
Crypto World
Tokenized Real-World Assets Hit $27.65B as Ondo Finance Dominates Equities With 60% Market Share
TLDR:
- The tokenized RWA market reached $27.65B in April 2026, growing 4.07% while most crypto sectors contracted.
- U.S. Treasury debt leads the RWA market at $12.78B, nearly half the total, followed by commodities at $5.4B.
- Tokenized equities hit $941M with a $2.94B monthly transfer volume, marking an 85.78% jump in 30 days.
- Ondo Finance controls 60.07% of the tokenized equity market at $557M, spanning 230 products across 8 asset classes.
Tokenized real-world assets have reached $27.65 billion in total distributed value as of April 2026. The sector grew 4.07% over the past 30 days, standing apart from most crypto verticals.
Capital inflows into RWA remain structurally positive while other segments contract. U.S. Treasuries lead at $12.78 billion, followed by commodities at $5.4 billion and asset-backed credit at $3.19 billion. Tokenized equities are now approaching the $1 billion threshold.
RWA Market Holds Steady as Capital Flows Into Tokenized Instruments
The tokenized RWA market is drawing consistent institutional interest in blockchain-based financial instruments. Investors are moving capital into on-chain versions of Treasuries, commodities, and credit products.
These assets offer dollar-denominated yield without traditional brokerage accounts or wire transfer requirements. Global access without timezone or geographic barriers is a key draw for institutional allocators.
U.S. Treasury debt at $12.78 billion accounts for nearly half the total market value. Commodities follow at $5.4 billion, while asset-backed credit holds $3.19 billion.
Together, these three categories make up the bulk of the $27.65 billion total. The composition reflects a market led by yield-generating and capital-preservation instruments.
The 4.07% monthly growth rate is notable given the current crypto environment. Most sectors are recording outflows, yet RWA continues to attract fresh capital.
That contrast points to a structural shift in how institutional money views on-chain assets. Investors appear to be treating tokenized instruments as a long-term allocation category.
The broader data from rwa.xyz reinforces this trend with consistent upward movement. Monthly figures have held positive across multiple reporting periods.
The market is not being driven by short-term speculation, but by allocation patterns familiar in traditional finance. That behavioral shift separates RWA from most other crypto verticals.
Ondo Finance and xStocks Lead a Concentrated Tokenized Equity Sector
Tokenized equities now sit at $941 million, closing in on the $1 billion mark. Monthly transfer volume reached $2.94 billion, a jump of 85.78% over 30 days.
That creates a 3:1 ratio between transfer volume and total asset value. The ratio points to active trading rather than passive holding behavior among participants.
According to data shared on X, OndoFinance holds 60.07% of the tokenized equity market at $557 million. The platform operates across 230 products and grew 8.28% over the past month.
@xStocksFi holds 26.24% at $243.3 million, making it the second-largest platform. Together, the two platforms control 86% of the entire tokenized equity market.
Securitize, the next closest competitor, holds only $60 million across a single product. That platform declined 38.32% over the same 30-day period.
Every other platform in the space holds under $25 million. The drop-off from the two leaders to the rest of the market is sharp.
Ondo’s growth reflects a portfolio that has evolved well beyond its original design. The platform started with OUSG and USDY as Treasury yield products. It now covers eight asset classes, with U.S. Treasury debt at $2.4 billion making up 76.9% of its total value.
The equity vertical at $557 million has become its second-largest and fastest-growing segment, with top products including S&P 500 ETFs and NVIDIA shares.
Crypto World
Best Crypto to Buy Now as the Search Leads to Pepeto With $8M Raised and 100x Before Binance Listing
The search led right here. The best crypto to buy now is not SOL at $80.49 grinding toward 36% or ADA at $0.24 waiting for a hard fork. It is a presale at millionths of a cent that raised more than $8 million during extreme fear because wallets found it before the crowd had reason to look.
This entry has a higher ceiling because a working exchange stands behind the token, and analysts project 100x before the confirmed Binance listing opens. The search for the best crypto to buy now was leading to Pepeto all along, and the wallets inside acted on that signal first.
Kentucky House Bill 380 mandated hardware wallet backdoors, forcing manufacturers to assist with seed phrase resets per CoinDesk. The provision destroys the foundation of self custody.
CoinGecko showed the market dropping as fears spread across positions. The best crypto to buy now benefits from this shift because capital seeking safety flows toward audited presales with verified contracts, confirmed listings, and tools that protect every wallet before any transaction clears.
Custody Shift and the Presale the Keyword Search Was Leading To
Pepeto: Risk Scorer and Bridge Live With 100x Before Listing
Protecting capital from threats requires action, not another search. Pepeto, considered the best crypto to buy now, delivers contract checking through the risk scorer, keeping wallets safe from malicious tokens before any position opens, the kind of protection that makes a presale entry worth committing to before listing. This is why searching for another update is the wrong approach when the presale fills and the listing draws closer.
The math proves the conviction. More than $8 million entered at $0.000000186 during extreme fear, and analysts project 100x before the Binance listing. That means presale capital converts into returns that SOL at 36% and ADA at 2x cannot come close to matching from current levels.
This setup is why wallets leave large cap targets for the Pepeto entry. The cross chain bridge moves assets at zero cost keeping capital whole, and PepetoSwap processes zero fee trades. The platform condenses research into seconds through a clean interface where every tool runs and the layout makes finding what matters simple.
The cofounder who created the original Pepe coin turned zero products into $11 billion, SolidProof audited every contract, and a former Binance expert drives the listing. Staking at 189% APY compounds returns while listing approaches, and every round filling means fewer entries remain for the wallets that have not moved yet.
Solana (SOL): $80.49 Recovering From $285M Drift Protocol Exploit
SOL sits at $80.49, down 2.77% on the week after the $285 million Drift exploit per CoinMarketCap. Support at $75, resistance at $88.
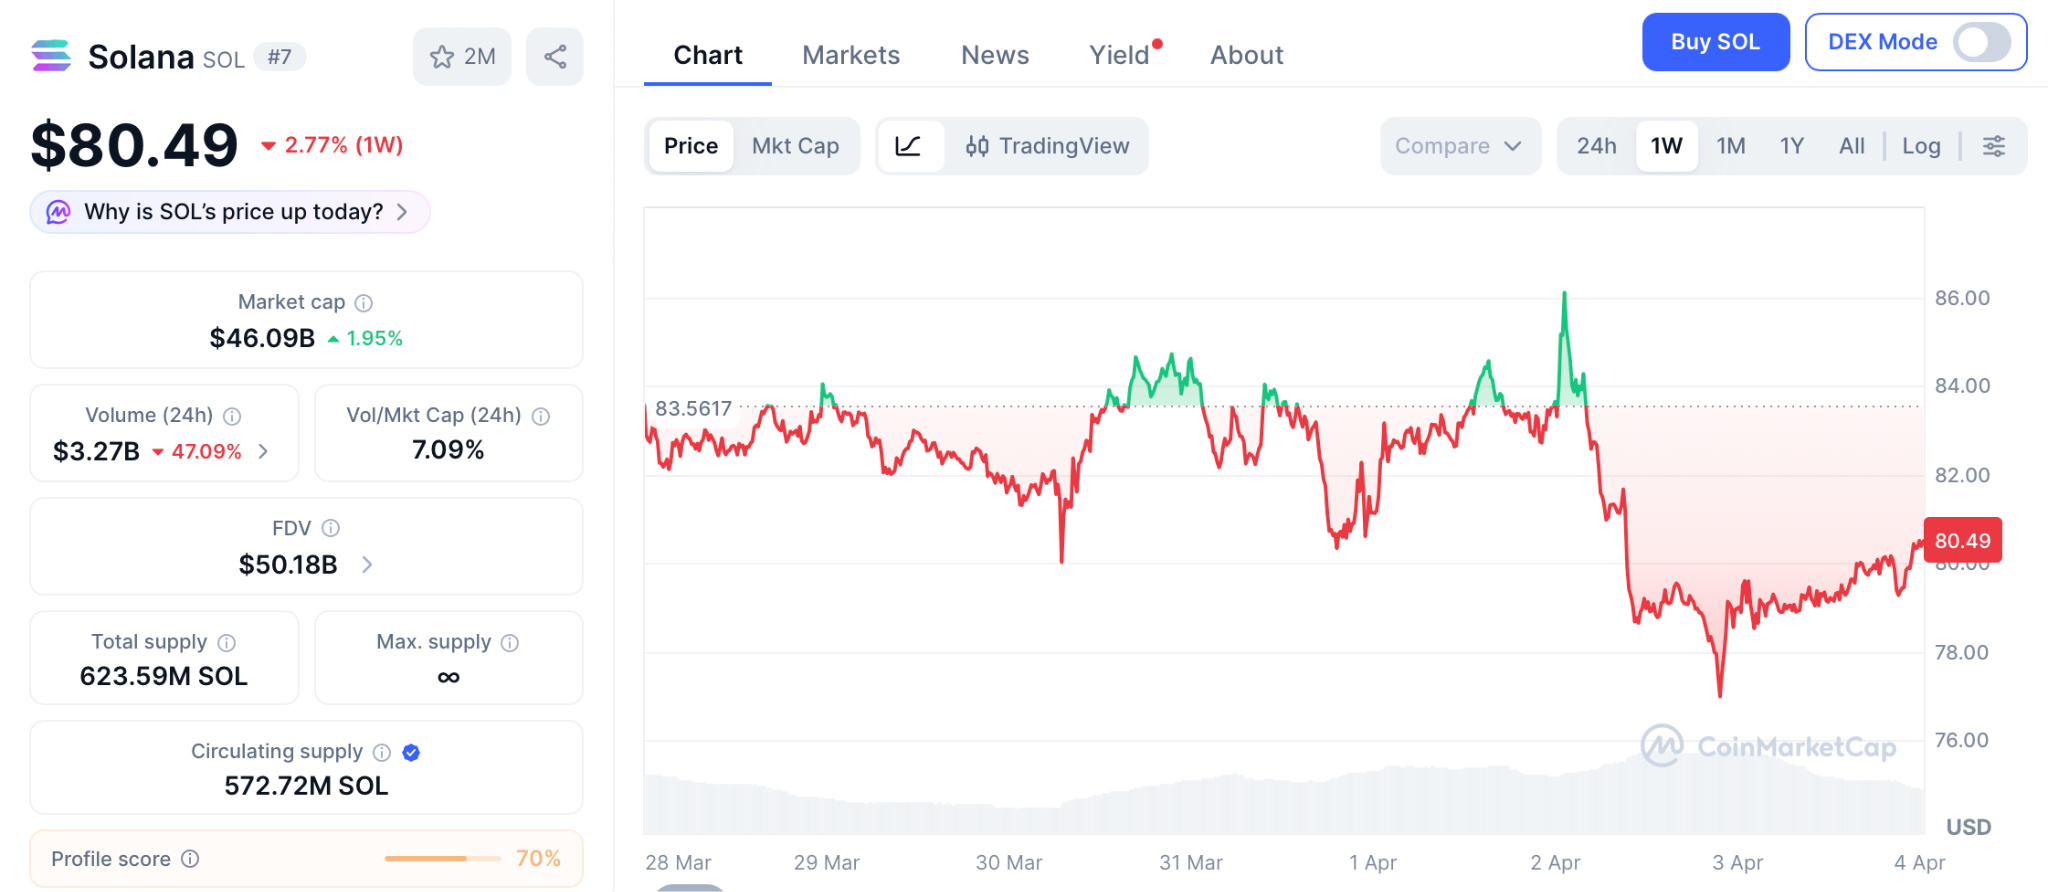
Even $120 delivers 52%, modest next to the presale entry where 100x projections carry a working exchange.
Cardano (ADA): $0.24 Awaits Protocol 11 Governance Overhaul
ADA trades at $0.24 per CoinGecko. Protocol 11 adds on chain governance with the Midnight sidechain.
Even $0.50 delivers 2x from $0.24, a ceiling presale math multiplies past before listing day arrives.
Conclusion: Why the Best Crypto to Buy Now Already Answered the Search
The presale fills right now, making this the best time to enter before the price moves. Another search will not change the outcome for wallets still outside. Early wallets acted before the crowd had reason to look, and the best crypto to buy now has a higher ceiling because a working exchange stands behind the token instead of a whitepaper.
The Pepeto official website shows capital arriving while SOL and ADA debate their next percentage, and entering now means joining the wallets that found the answer before the listing confirms what the capital already proved.
Find the answer at Pepeto before the listing closes the entry the search was leading to.

FAQs
What is the best crypto to buy now in April 2026?
Pepeto leads the best crypto to buy now with a working exchange, risk scorer, and 100x projections before a confirmed Binance listing.
How does the Kentucky bill affect the best crypto to buy now?
The bill threatens custody, making audited presales with verified contracts the safer choice through the Pepeto official website where tools protect positions.
How does the best crypto to buy now compare to SOL and ADA?
SOL and ADA cap returns modestly, while Pepeto offers 100x with working tools, making it the answer the search was leading to.
Disclaimer: This is a Press Release provided by a third party who is responsible for the content. Please conduct your own research before taking any action based on the content.
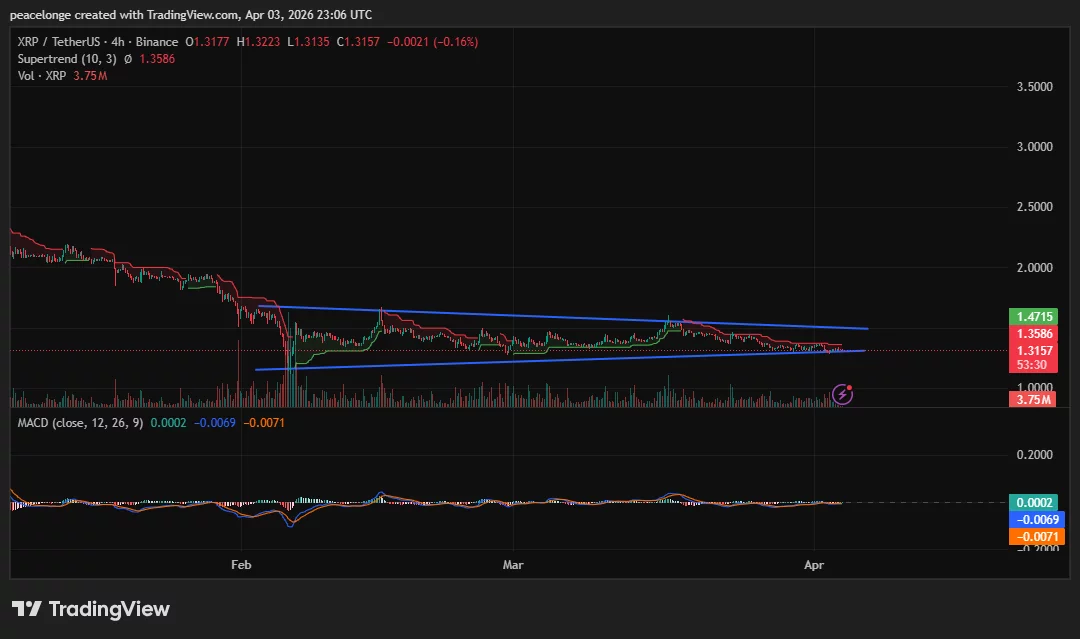
XRP is compressing into the apex of a descending wedge at $1.3157 after months of lower highs and lower lows, with the 4H MACD signal line just crossing into positive territory for the first time since February — a sign that bearish momentum may be approaching exhaustion ahead of what could be the pattern’s most consequential candle close.
Summary
- XRP is trading at $1.3157, pressing against the apex of a descending wedge pattern visible on both the daily and 4H charts, with the daily Supertrend bearish at $1.4894.
- The daily MACD histogram stands at -0.0222, while on the 4H chart the signal line has just crossed marginally into positive territory, signalling that bearish momentum is approaching exhaustion ahead of the wedge resolution.
- A confirmed daily close above $1.47 targets $1.50 and a potential challenge of $1.60, while a break below $1.27 risks an acceleration toward $1.14.
XRP (XRP) is trading at $1.3157 on April 3, 2026, down 0.33% on the day and compressing near the apex of a descending wedge pattern that has formed across both the daily and 4H timeframes since February. The Supertrend indicator on the daily chart sits at $1.4894, in red above price, confirming the prevailing bearish regime. Yet the formation itself is a structure that technical analysts typically associate with bullish reversal potential when it emerges at the end of a prolonged downtrend, provided the lower trendline holds.
On the daily chart, two converging trendlines are clearly visible: a descending upper resistance line and a slightly rising lower support line. Price at $1.3157 is nearing the apex, with the most recent daily low printed at $1.3033. The daily MACD shows a histogram of -0.0222, with the MACD line at -0.0287 below the signal at -0.0065. The reading remains bearish, but the histogram has been contracting, a sign that selling pressure is gradually fading.

On the 4H chart, the same wedge structure is intact. The upper descending trendline aligns with the 4H Supertrend at $1.3586, and the lower rising trendline has provided support on each test since early February. Critically, the 4H signal line has crossed marginally into positive territory at 0.0002, while the MACD line at -0.0069 is approaching zero from below. A full bullish MACD crossover has not yet occurred, but the convergence at near-zero is an early signal of bearish exhaustion.
Key Levels, Price Targets, and Invalidation
Bull case: a daily close above the descending wedge resistance near $1.47 would confirm the breakout, initially targeting $1.4894, the Supertrend level, then $1.50. Above that, $1.60 is the key structural zone where the broader descending channel from July 2025 would be meaningfully challenged. Technical analyst Ali Martinez noted on X (formerly Twitter) that XRP “could offer a short-term buying opportunity” within its multi-year ascending triangle structure at current levels, though he also identified a potential further decline of approximately 30% before a sustained long-term recovery becomes likely.
Bear case: a daily close below $1.27 would break the wedge support and expose XRP to $1.14, the conservative channel breakdown target. A dense supply cluster of approximately 19.6 million XRP is concentrated between $1.27 and $1.28, per Coinglass cost-basis data, making this the most critical demand zone to defend.
Invalidation of the bull case: a daily close below $1.27. Invalidation of the bear case: a daily close above $1.47.
On-Chain and Derivatives Context
U.S. spot XRP ETF monthly inflows turned negative in March 2026 for the first time since the products launched in November 2025, according to SoSoValue data, removing a structural buy-side catalyst that had underpinned price through Q1. XRP open interest across all exchanges now sits near $2.45 billion, down approximately 73% from the September 2025 peak, as detailed in prior crypto.news coverage.
Funding rates have shifted to a positive 0.008%, suggesting fresh long positions are entering near current levels. However, the six-to-twelve month holder cohort has begun trimming positions since March 27, reducing a layer of structural support precisely as the wedge reaches its apex.
As crypto.news has covered, recovery attempts have repeatedly stalled below descending resistance, and the pattern remains intact until buyers produce a decisive daily close above the wedge’s upper trendline. With the 4H signal line at zero and the apex approaching, the next directional candle carries outsized weight.
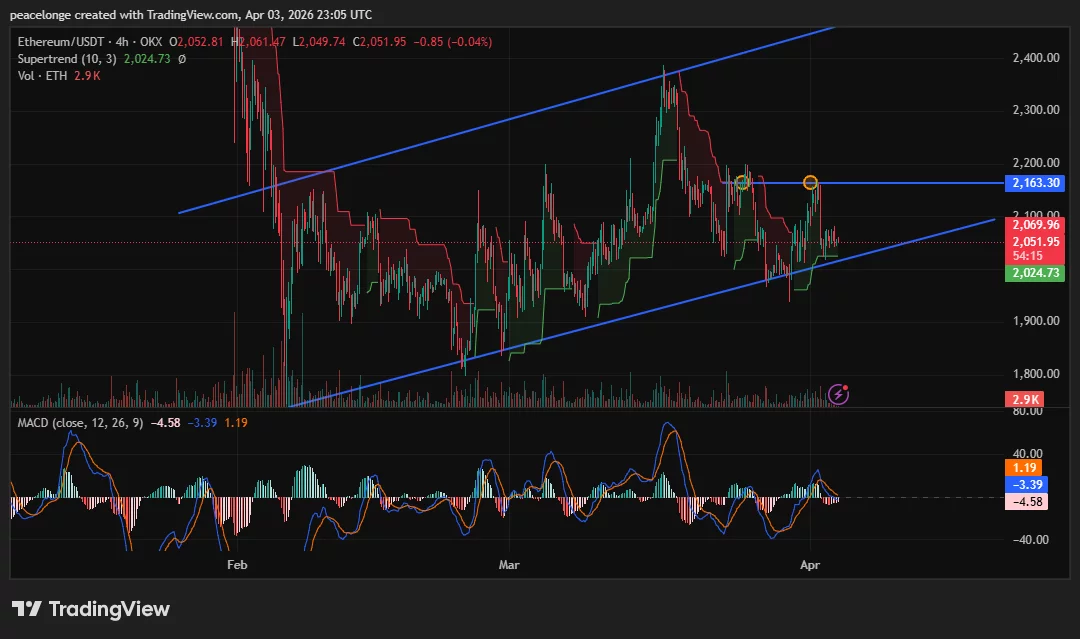
Ethereum is pressing against a double-top resistance zone at $2,163 after two consecutive rejections from the upper boundary of its rising parallel channel, while a marginal bullish MACD crossover on the 4H chart raises the question of whether buyers can finally break through or whether the pattern will resolve to the downside toward $1,980.
Summary
- Ethereum is trading at $2,051.80, holding inside a rising parallel channel on both the daily and 4H timeframes after twice rejecting from the $2,163-$2,166 resistance zone.
- The 4H MACD histogram has just turned positive to 1.19, signalling a bullish crossover, while the daily Supertrend at $1,980.92 remains green, indicating the broader trend structure has not yet broken.
- A confirmed daily close above $2,166 targets $2,250-$2,300, while a loss of $2,024 Supertrend support opens the door to $1,980 and potentially $1,900.
Ethereum (ETH) is trading at $2,051.80 on April 3, 2026, holding inside a rising parallel channel that has been intact since the February lows. Two consecutive rejection candles at the $2,163-$2,166 zone, marked clearly on both the 4H and daily charts, have created a double-top structure at the channel’s upper boundary. With $6.3 billion in Ethereum options having expired today and CME futures offline for Good Friday, traders face a thin-liquidity weekend that could amplify any directional move.
On the 4H chart, Ethereum is trading between the channel’s lower support near $2,024 and the upper resistance at $2,163. The 4H Supertrend at $2,024.73 is still green, confirming the short-term trend has not flipped bearish. More notably, the 4H MACD histogram has just crossed into positive territory at 1.19, with the MACD line at -3.39 crossing above the signal line at -4.58. This is a marginal but technically meaningful bullish crossover, the first since mid-March.

On the daily chart, the picture is more cautious. The MACD histogram sits at -7.33, with the MACD line at -11.11 still below the signal at -3.78. The daily Supertrend at $1,980.92 remains green, meaning the daily trend has not broken bearish. Two orange markers on the chart precisely identify the double-top rejection zone at $2,163-$2,166. A daily close above $2,166 would invalidate the double-top and confirm the rising channel’s upper trendline as the next target.
Key Levels, Price Targets, and Invalidation
Support is layered at $2,024 (4H Supertrend) and $1,980 (daily Supertrend). A daily close below $1,980 would flip the daily Supertrend bearish and break the rising channel structure that has defined price since February, opening a move toward $1,900 as the next major floor.
Resistance: the $2,069 area (the 4H Supertrend upper band visible on the chart) acts as a near-term ceiling, then the double-top zone at $2,163-$2,166. A clean daily close above $2,166 targets $2,250 initially, with $2,300-$2,400 as the broader bull case if the channel’s upper trendline is the objective.
Invalidation for the bullish channel thesis: a 4H close below $2,024 Supertrend support. Invalidation for the bearish double-top thesis: a daily close above $2,200.
Options Expiry and Macro Context
Approximately $6.3 billion in Ethereum options expired on April 3, according to data from Deribit, with spot price trading near the max pain zone for the expiry. Analysts at AnalyticsInsight noted the event is “more like a routine settlement than a major turning point,” given price proximity to max pain, limiting the probability of an expiry-driven spike in either direction.
As crypto.news reported, Ethereum fell 3.4% toward the $2,000 support on April 2 during the broader market selloff tied to U.S.-Iran escalation and the $285 million Drift Protocol exploit on Solana. The fact that the 4H Supertrend held at $2,024 through that sell event is a meaningful signal of buyer resilience at that level.
A sustained hold above $2,024 heading into next week, particularly with the 4H MACD histogram staying positive, would be the first concrete signal that bulls are retaking short-term control. If $2,024 fails, the double-top breakdown and a move toward $1,900 become the primary scenario to watch.
Noughties heartthrob unrecognisable as he hits stage after heartbreak

Concurrent Gainers: 9 smallcap stocks that rose for 5 days in a row

Politics Home Article | Are The Lib Dems Still Haunted By Tuition Fees?


![OMG...The IMF Said Ripple/XRP Will Be LEVERAGED and 99% of XRP Holders MISSED THIS! [HARDCORE PROOF]](https://wordupnews.com/wp-content/uploads/2026/04/1775281159_maxresdefault-80x80.jpg)
-

 NewsBeat1 day ago
Steven Gerrard disagrees with Gary Neville over ‘shock’ Chelsea and Arsenal claim | Football
-

 Business1 day ago
No Jackpot Winner and $194 Million Prize Rolls Over
-
Entertainment5 days ago
Fans slam 'heartbreaking' Barbie Dream Fest convention debacle with 'cardboard cutout' experience
-

 Fashion12 hours ago
Weekend Open Thread: Spanx – Corporette.com
-

 Crypto World2 days ago
Gold Price Prediction: Worst Month in 17 Years fo Save Haven Rock
-

 Tech5 days ago
The Pixel 10a doesn’t have a camera bump, and it’s great
-
 Entertainment6 days ago
Lana Del Rey Celebrates Her Husband’s 51st Birthday In New Post
-
Crypto World4 days ago
Dems press CFTC, ethics board on prediction-market insider trades
-

 Tech5 days ago
Avatar Legends: The Fighting Game comes out in July and it looks pretty slick
-

 Sports4 days ago
Tallest college basketball player ever, standing at 7-foot-9, entering transfer portal
-

 Tech4 days ago
EE TV is using AI to help you find something to watch
-

 Fashion6 days ago
Amazon Sundays: Soft Spring Layers
-

 Business2 days ago
Login and Checkout Issues Spark Merchant Frustration
-

 Tech6 days ago
Elon Musk’s last co-founder reportedly leaves xAI
-

 Tech4 days ago
How to back up your iPhone & iPad to your Mac before something goes wrong
-

 Crypto World4 days ago
U.S. rule change may open trillions in 401(k) funds to crypto
-

 Tech5 days ago
Apple will hide your email address from apps and websites, but not cops
-

 Politics4 days ago
Should Trump Be Scared Strait?
-

 Fashion5 days ago
The Best Spring Trends of 2026
-

 Tech4 days ago
Flipsnack and the shift toward motion-first business content with living visuals
You must be logged in to post a comment Login