
Crypto World
Market Analysis: Gold Price Slips Back, WTI Crude Oil Rally Gains Fresh Strength

Gold price rallied above $4,750 before correcting lower. Crude oil prices are rising and could climb further higher toward $110.00.
Important Takeaways for Gold and WTI Crude Oil Prices Analysis Today
· Gold price gained pace for a move toward $4,800 and recently corrected lower against the US Dollar.
· A key bullish trend line is forming with support at $4,630 on the hourly chart of gold at FXOpen.
· WTI Crude oil prices are moving higher above the $100.00 resistance zone.
· There was a break above a bearish trend line with resistance at $97.00 on the hourly chart of XTI/USD at FXOpen.
Gold Price Technical Analysis
On the hourly chart of Gold at FXOpen, the price was able to climb above $4,500. The price even surpassed $4,750 before the bears appeared.
The price traded close to $4,800 before there was a downside correction. There was a move below $4,750 and $4,700. The price settled below the 50-hour simple moving average, and RSI dipped below 50. There was a move below the 38.2% Fib retracement level of the upward move from the $4,351 swing low to the $4,800 high.
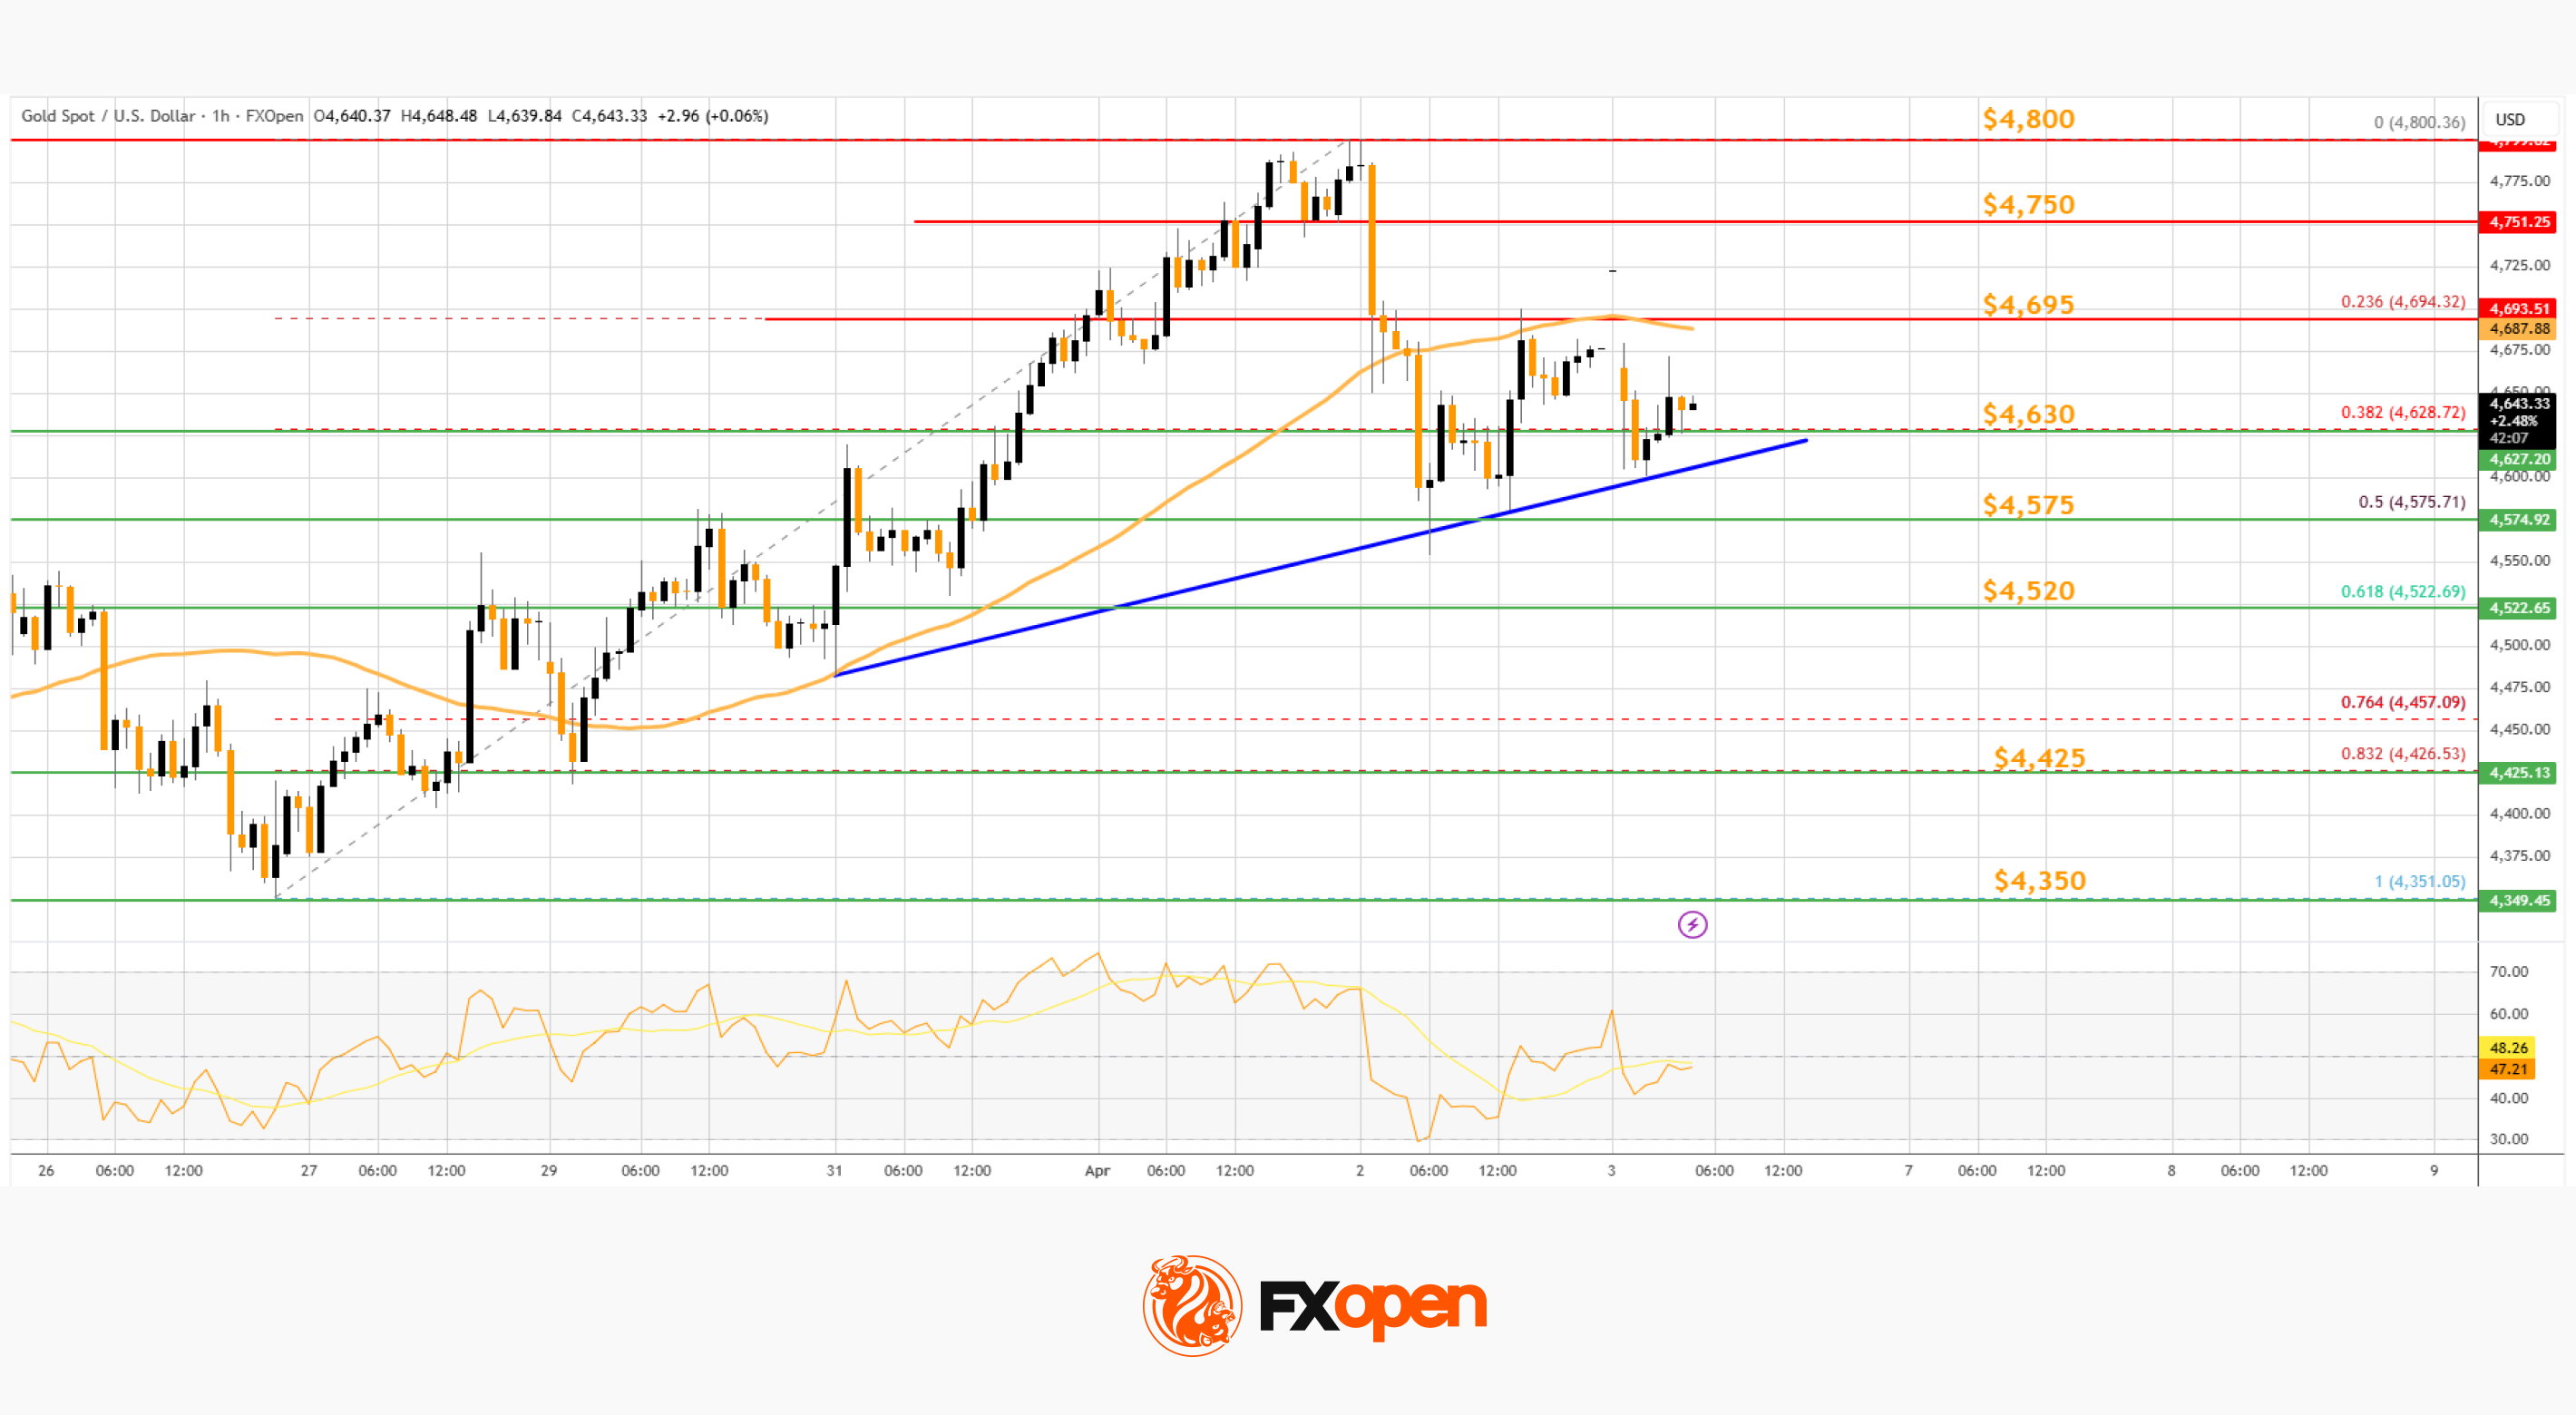
However, the bulls are active above $4,575 and the 50% Fib retracement. There is also a key bullish trend line forming with support at $4,630.
Immediate hurdle on the upside is $4,695 and the 50-hour simple moving average. The next major breakout level is $4,750. An upside break above $4,750 could send Gold price toward $4,800. Any more gains may perhaps set the pace for an increase toward $4,880.
If there is no fresh increase, the price could continue to move down. Initial support on the downside is near $4,630 and the trend line. The first key breakdown zone could be $4,520. If there is a downside break below $4,520, the price might decline further. In the stated case, the price might drop to $4,350.
WTI Crude Oil Price Technical Analysis
On the hourly chart of WTI Crude Oil at FXOpen, the price started a steady increase against the US Dollar. The price gained bullish momentum after it settled above $96.40.
The bulls pushed the price above the 50-hour simple moving average, and the RSI climbed toward 75. Besides, there was a break above a bearish trend line with resistance at $97.00. The price tested the $105.85 zone and is currently consolidating gains.
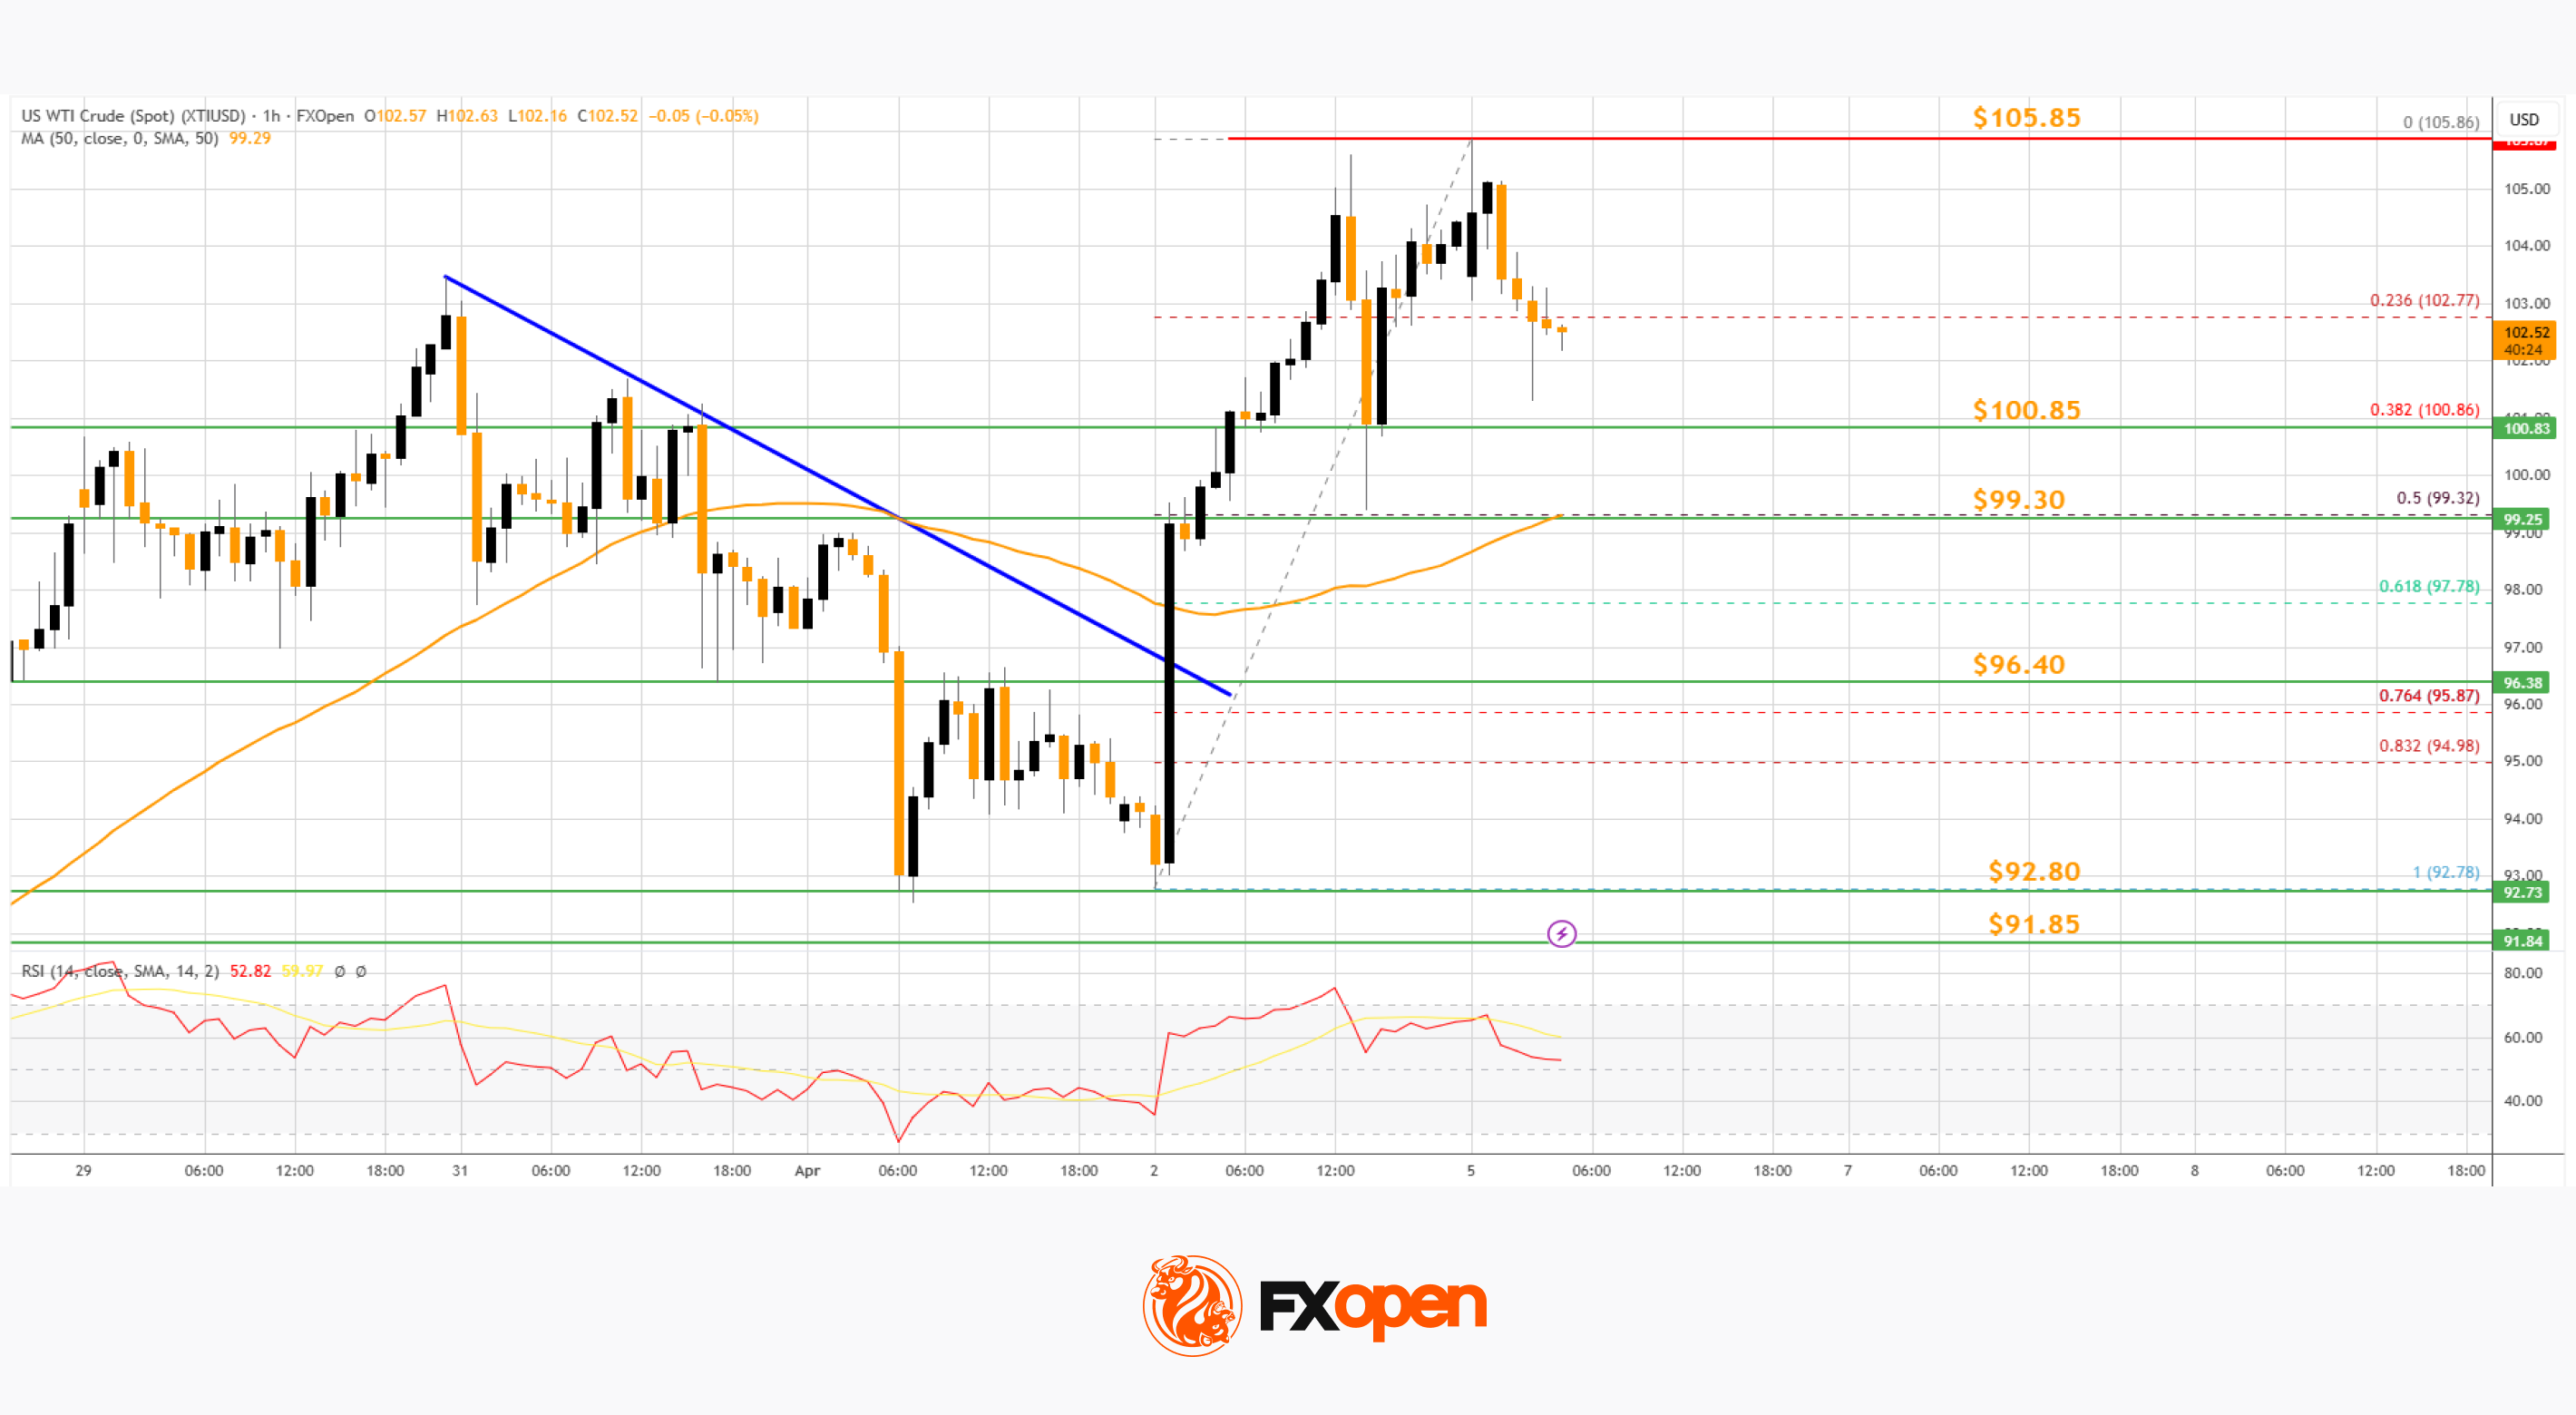
There was a minor pullback below $103 and the 23.6% Fib retracement level of the upward move from the $92.78 swing low to the $105.86 low.
If there is a fresh increase, the price could struggle near $105.85. A close above $106.85 could send the price toward $108. The next key area of interest might be $110. Any more gains might send the price toward $112.
Conversely, the price might correct gains and test $100.85. The main bid area on the WTI crude oil chart could be $99.30, the 50% Fib retracement level, and the 50-hour simple moving average. If there is a downside break, the price might decline toward $96.40. Any more losses may perhaps open the doors for a move to $92.80.
Start trading commodity CFDs with tight spreads (additional fees may apply). Open your trading account now or learn more about trading commodity CFDs with FXOpen.
This article represents the opinion of the Companies operating under the FXOpen brand only. It is not to be construed as an offer, solicitation, or recommendation with respect to products and services provided by the Companies operating under the FXOpen brand, nor is it to be considered financial advice.

James Wynn, one of crypto’s most closely tracked traders, has been liquidated after shorting Bitcoin (BTC) on decentralized exchange Hyperliquid. On-chain intelligence firm Arkham Intelligence confirmed the wipeout.
Follow us on X to get the latest news as it happens
The liquidation left Wynn’s account at just over $900, with a loss of $20 million according to HypurrScan data.
“In just the past 2 weeks, he has been liquidated 6 times!,” blockchain analytics firm Lookonchain added.
Wynn had warned traders over the weekend that conditions across markets would worsen before improving. He outlined his multi-asset defensive strategy, which included shorting both the S&P 500 and the Nasdaq, going long on WTI crude oil, and selectively buying BTC dips with spot capital.
The trader’s bearish positioning coincided with heightened geopolitical tensions around the Strait of Hormuz and oil prices hovering above $100 per barrel. However, Bitcoin moved sharply against his short.
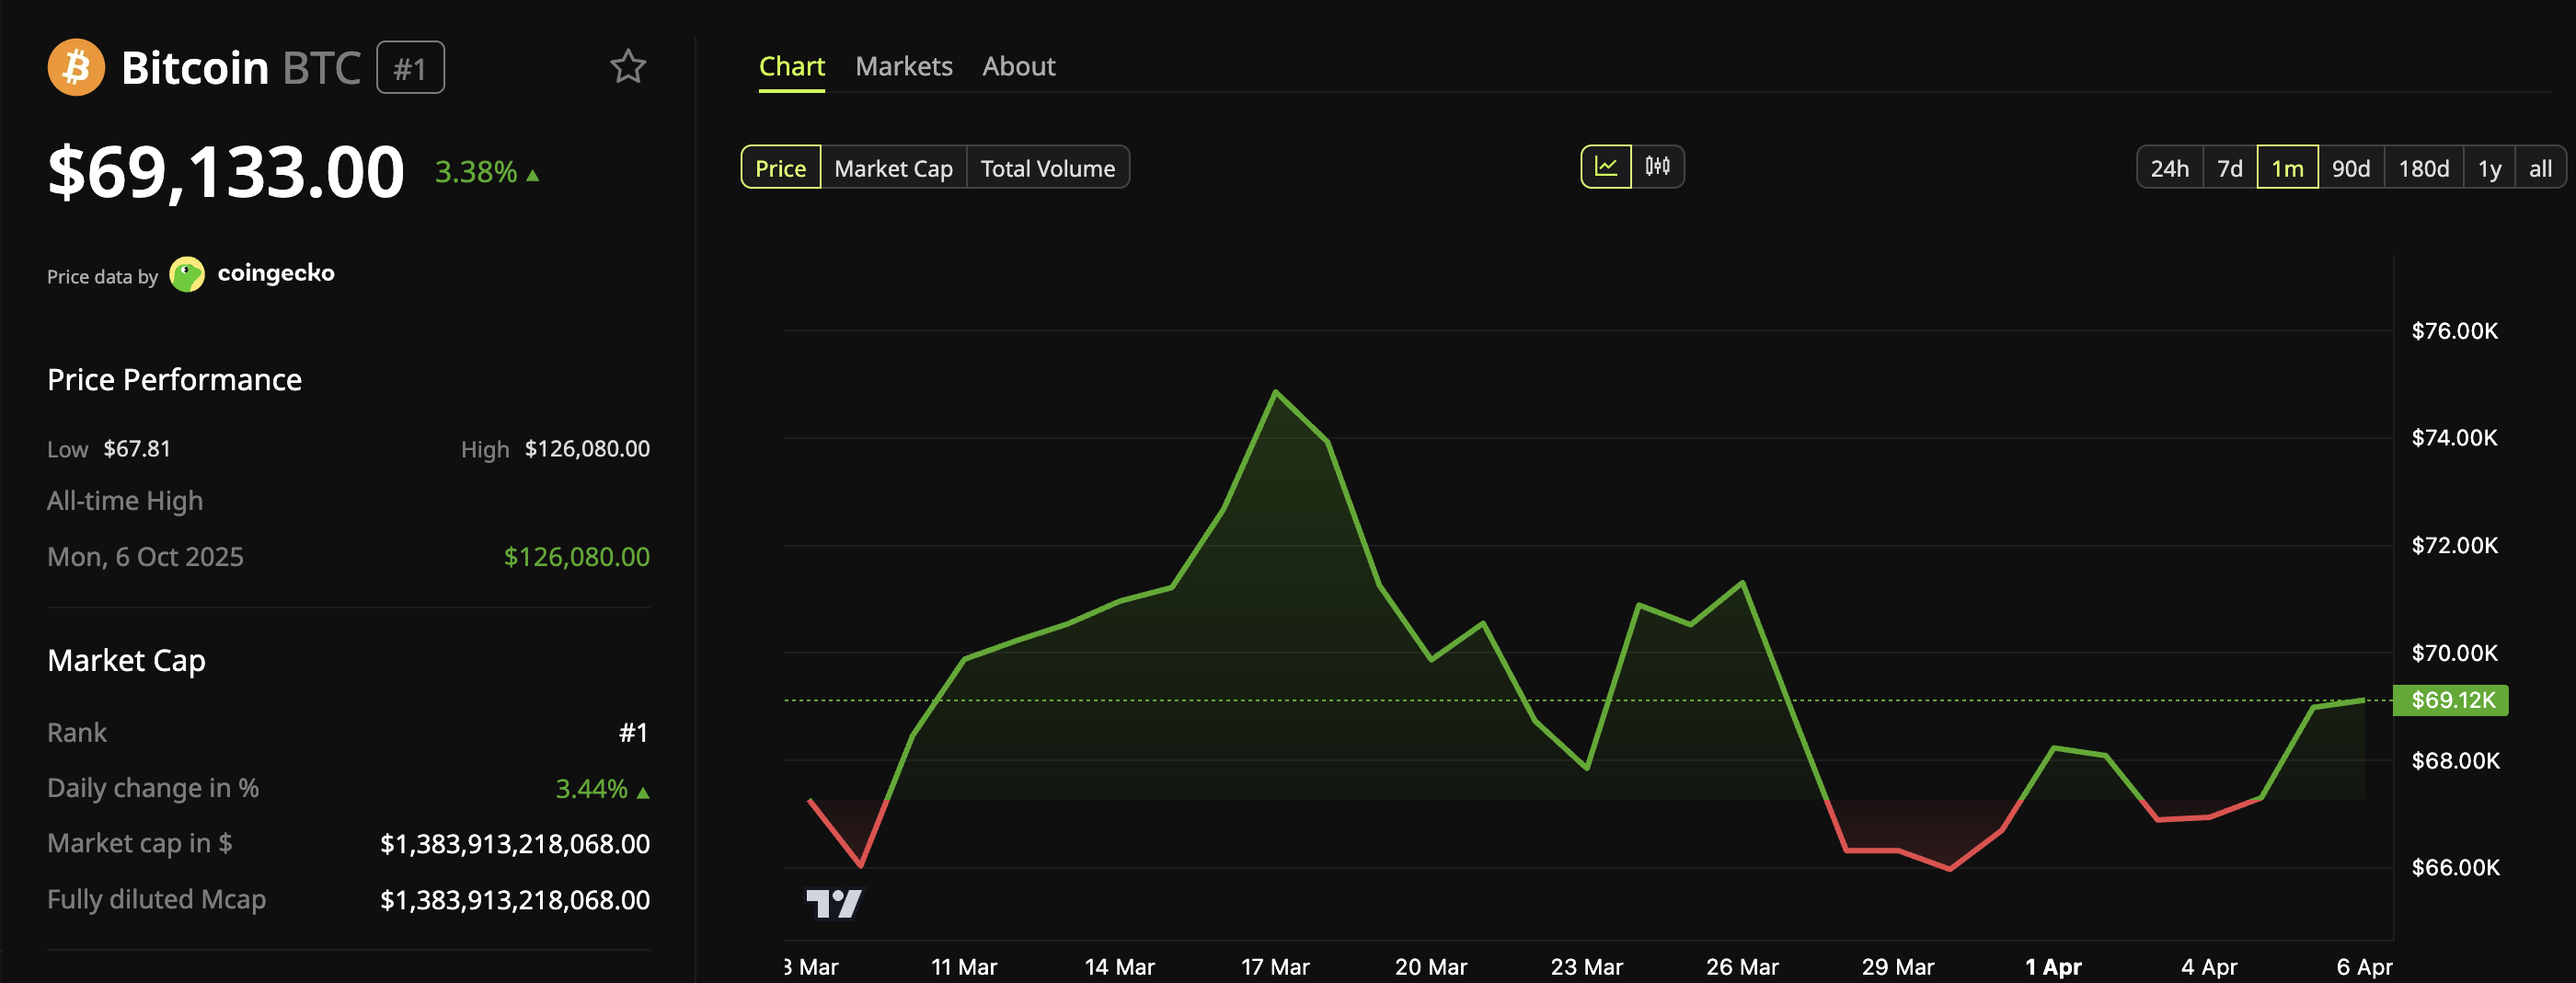
BTC climbed 3% over the past 24 hours. Earlier today, the cryptocurrency surged to an intra-day high of over $70,000, its highest level in more than a week. BeInCrypto Markets data showed that at press time, it traded at $69,133.
BeInCrypto reported that the rally was driven by a derivatives-led short squeeze that liquidated roughly $196 million in short positions across the market. The total crypto market capitalization recovered to $2.35 trillion on April 6, adding approximately $89 billion from the $2.27 trillion low hit on April 5.
Subscribe to our YouTube channel to watch leaders and journalists provide expert insights
The post James Wynn’s Account Drops to $900 After Latest Bitcoin Liquidation on Hyperliquid appeared first on BeInCrypto.
TLDR
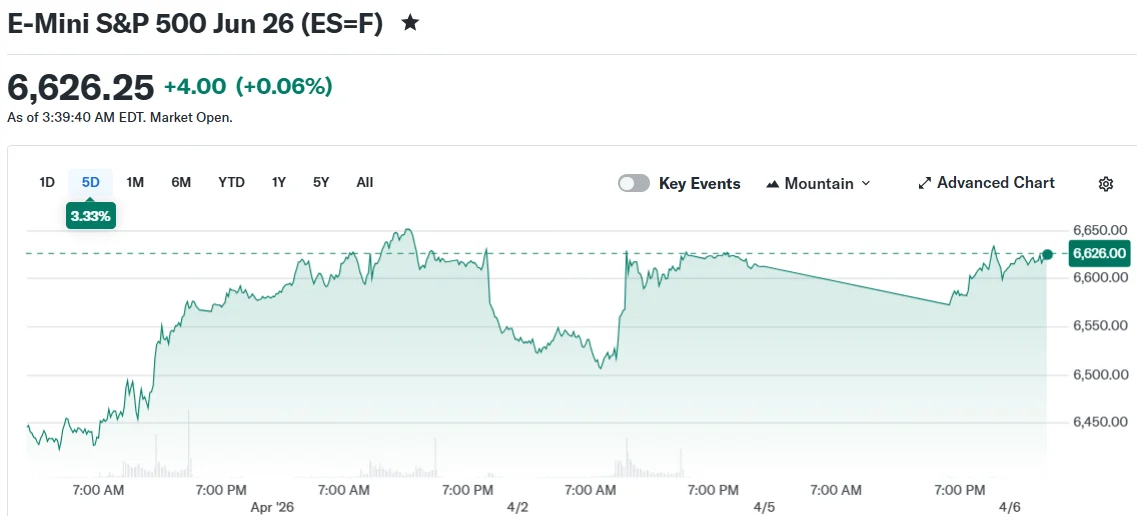
- Futures for the S&P 500 climbed 0.4% while Nasdaq 100 futures advanced 0.6% during Monday trading
- Diplomatic negotiations between Washington and Tehran, with Pakistan serving as mediator, boosted investor confidence
- President Trump extended his Iran ultimatum to Tuesday at 8:00 PM Eastern, warning of strikes on electrical infrastructure
- The critical Strait of Hormuz shipping channel continues to operate at minimal capacity, impacting approximately 20% of worldwide petroleum transport
- Crude prices retreated following ceasefire news, with Brent declining roughly 1.6% to settle near $107 per barrel
Wall Street futures posted solid gains Monday following emerging reports of potential diplomatic progress between Washington and Tehran. The positive movement arrived after a weekend marked by military escalation and aggressive rhetoric from the White House.
The S&P 500 futures contract advanced approximately 0.4%. Nasdaq 100 futures climbed 0.6%. The Dow Jones Industrial Average futures showed more modest growth at 0.1%.

Equity markets experienced brief volatility overnight following fresh warnings from President Trump directed at Iran. However, sentiment improved as news of diplomatic channels emerged.
According to Reuters, both Washington and Tehran have been presented with a preliminary ceasefire framework brokered by Pakistani officials. The framework reportedly calls for an immediate cessation of hostile actions. To date, neither government has publicly acknowledged or endorsed the terms.
In parallel negotiations, American officials alongside regional intermediaries are advocating for an extended 45-day truce that could potentially conclude hostilities permanently. Sources close to the discussions caution that prospects for success remain uncertain.
President Trump’s initial 10-day ultimatum to Iran reached its expiration Monday. However, Trump announced a postponement via social media, declaring the revised deadline as “Tuesday, 8:00 P.M. Eastern Time.” In comments to the Wall Street Journal, he warned that American forces would target Iran’s entire electrical grid if the Strait of Hormuz shipping lane remains blocked beyond that timeframe.
Crude Markets Retreat on Diplomatic Progress
The strategically vital Strait of Hormuz, a waterway that typically facilitates approximately 20% of global petroleum shipments, remains severely restricted to commercial tanker traffic. This ongoing blockade has sustained upward pressure on oil prices throughout recent trading sessions.
Crude futures had surged nearly 3% at Sunday evening’s market opening. However, prices reversed course following the ceasefire developments. Brent crude retreated approximately 1.6% to trade around $107 per barrel. West Texas Intermediate declined roughly 2% to approximately $109.
A noteworthy market anomaly emerged: WTI pricing exceeded Brent levels, an uncommon occurrence. Market analysts attribute this inversion to contract timing discrepancies, with WTI still trading May delivery contracts while Brent has transitioned to June settlements.
Researchers at Gavekal Research suggest Iran may be leveraging its control over the strait to extract substantial passage fees from vessels. They characterize this as an emerging revenue strategy for Tehran.
Other Markets
Gold appreciated 0.9% to approximately $4,720 per ounce during Monday’s session. The benchmark 10-year US Treasury yield edged higher to 4.362%.
American military forces successfully extracted a US aviator who had been detained inside Iranian territory over the weekend. Iranian forces continued launching missiles and unmanned aerial vehicles toward Gulf nations and Israel through Monday morning.
The geopolitical landscape remains uncertain, with Tuesday evening’s deadline representing the next critical juncture for both financial markets and international diplomacy.

Bitcoin (BTC) faces a fresh showdown this week as macro tensions contrast with a bullish BTC price trend reversal.
-
A classic BTC price metric is above to flip bullish for the first time in nearly a year — last time, price gained $25,000 in two months.
-
Short time frames see liquidations as “aggressive” traders pile in at $70,000.
-
Iran war tensions are at breaking point as US President Donald Trump’s “Bridge Day” deadline nears.
-
US inflation data will come thick and fast as the war begins to reflect in the numbers.
-
The Bitcoin bear flag stays in play, with analysis warning that new lows are “likely just a matter of time.”
MACD indicator teases key bullish cross
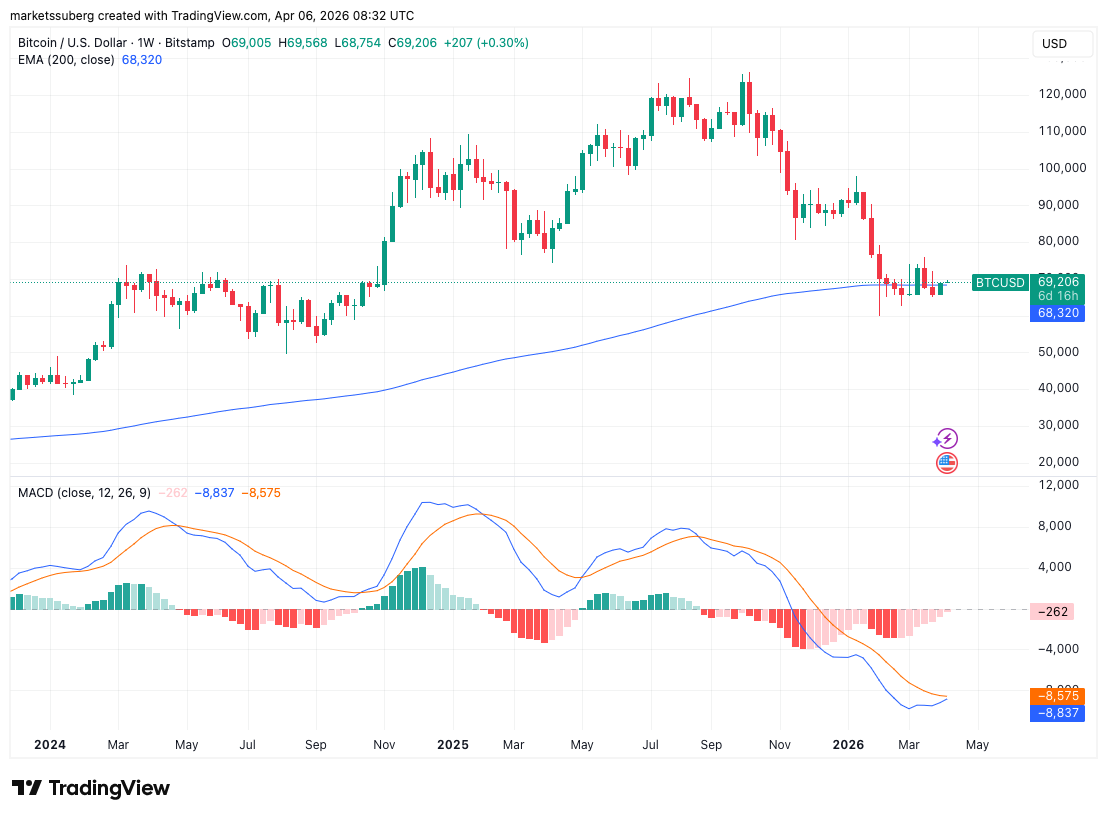
On longer time frames, the weekly chart has become a source of hope for Bitcoin bulls this week.
The weekly close reclaimed the 200-week exponential moving average (EMA) trend line, but more than that, a classic BTC price metric is about to produce a key bull signal.
On a weekly basis, the moving average convergence/divergence (MACD) hinted that Bitcoin’s latest downtrend is in the process of reversing.
“Holding this level is crucial for the entire Crypto industry,” X commentator Crypto Seth argued on Monday, noting that Ether (ETH) was also due an MACD cross.

Bitcoin’s last bullish weekly MACD flip occurred in May 2025, around one month after BTC/USD put in its 2025 low near $74,500. Over the following two months, price went from $94,000 to $119,000, setting new all-time highs.
Continuing on the phenomenon, X trading resource GalaxyTrading flagged key MACD comparisons across Bitcoin’s past two bear markets.
“In the 2018 bear market, it took around 245 days for the weekly MACD to turn positive,” it noted.
“In 2022, it also took 245 days to turn bullish. In 2026, we will reach 245 days by the end of April.”

Liquidations spike as Bitcoin tags $70,000
Bitcoin managed a trip beyond $70,000 after the weekly close, data from TradingView confirms, reaching new April highs.

While some traders remained skeptical over pre-market price action, the close itself was notable, bringing back both the 200-week EMA and old 2021 all-time high as potential support.
As Cointelegraph reported, both levels have courted suspicion over their reliability.
$BTC pumping on a Sunday and everyone celebrating…
You guys will never learn.
— Roman (@Roman_Trading) April 6, 2026
The move to the local highs caught short positions off guard, with total crypto liquidations passing $250 million over the 24 hours to the time of writing, per data from CoinGlass.
In his latest analysis, trader CrypNuevo continued to eye longs closer to $64,000 for a potential liquidity hunt to the downside.
“There are some HTF liquidations between $64k-$64.5k. This adds fuel a move lower. I don’t see conclusive data on LTF liquidations,” he commented in an X thread on Sunday.

In one of its “QuickTake” blog posts, onchain analytics platform CryptoQuant flagged the return of “aggressive short-term positioning” — spikes in both cumulative net taker volume and open interest on Binance.
This matters because Bitcoin’s move is being driven not only by price strength, “but also by renewed speculative participation in derivatives,” contributor Amr Taha commented.
“In simple terms, traders are becoming more willing to add fresh exposure as BTC pushes higher. If this trend continues, it could reinforce short-term momentum.”

Trump’s Iran “Bridge Day” puts markets on edge
A combination of geopolitics and key US inflation data makes for a week of “extreme volatility,” analysis predicts.
The US-Israel and Iran war continues to guide market sentiment, and oil prices reflect the uncertainty over the fate of key issues such as the partial closure of the Strait of Hormuz. WTI crude oil started the week with a trip above $115 per barrel.
Traders are now eyeing one deadline in particular when it comes to how the conflict might play out: Tuesday, 8pm Eastern time. This is when US President Donald Trump promises major infrastructure strikes if no deal with Iran is reached.
In a post on Truth Social at the weekend, Trump appeared particularly impatient, calling the day of the deadline “Power Plant Day” and “Bridge Day” while demanding that Hormuz reopen.

Headlines remain mixed, however, with talk of a 45-day ceasefire now a focus.
“This is being described as a ‘last-ditch effort’ to prevent ‘massive strikes on Iranian civilian infrastructure,’” trading resource The Kobeissi Letter reported on X.
Kobeissi noted that S&P 500 futures “erased all losses” on the news, underscoring risk-asset vulnerability to war-related triggers. As Cointelegraph reported, Bitcoin remains no exception.

Last week, macro investor and former hedge fund manager James Lavish nonetheless said that markets were pricing in odds of the war ending sooner rather than later.
A potential drawdown for BTC price action should markets experience a “black swan” event, he told Cointelegraph, could be up to 20%.
Risk assets face two major US inflation prints
Markets will thus be juggling war shocks and inflation data concurrently this week, with multiple US prints due.
Among them is the Personal Consumption Expenditures (PCE) Index, known as the Federal Reserve’s “preferred” inflation gauge.
February’s PCE release matched market expectations, but did not reflect inflation trends after the war had started.
“Following the jump in oil prices and potential spillover impact from fertilizer shortages on food prices, challenges around the inflation outlook still poses a major risk,” trading resource Mosaic Asset Company summarized in the latest edition of its regular newsletter, “The Market Mosaic.”

That risk also applies to the week’s last and arguably most important inflation number: the Consumer Price Index (CPI).
Here, the oil-price jump is especially pertinent, thanks to its direct impact on CPI inflation trends.
“Oil prices are now crossing above $115/barrel in the US. As a result, our models indicate that if current levels are sustained another ~7 weeks, US CPI inflation will rise to ~3.7%,” Kobeissi commented.
Kobeissi said that its “base case” for CPI inflation was now 3% — considerably higher than the Fed’s target.

Like PCE, the most recent CPI print was flat, helping temper the impact of previous overshoots.
The latest data from CME Group’s FedWatch Tool meanwhile shows practically no chance of the Fed either raising or lowering interest-rates at its next meeting at the end of April.

New lows “just a matter of time?”
As macro events play out, Bitcoin still has a specific cloud hanging over it that traders fear will only lead price downward.
Related: Bitcoin ‘done’ with 85% crashes, says Cathie Wood amid new $34K target
BTC/USD continues to battle for support at the bottom of its second bear flag of 2026. The first, which appeared in January, resulted in a drop of roughly $25,000.
“Structurally, $BTC price action is still nearly identical to the prior bear flag structure,” Keith Alan, cofounder of trading resource Material Indicators, warned last week.
“Nothing says that it has to continue to mimic that price behavior, but I’m following it like roadmap until price deviates from that path.”

When it comes to new lows, Cointelegraph reported on broad consensus that February’s downside wick below $60,000 will be revisited.
“When that breakdown eventually happens, watch the behavior closely. If price starts repeatedly sweeping the lows, making it psychologically difficult to enter longs, that’s when a true bottom is more likely forming,” pseudonymous trader LP told X followers this weekend.
LP said that new lows were “likely just a matter of time.”

Alan, meanwhile, eyed a trip to the mid-$40,000 range as part of a “measured move” below bear-flag support.
“Expecting to test resistance in the $67k – $69k range before the next leg down,” he wrote while discussing the topic on X.
“End to the war or a really strong Q2 Open could invalidate the bear flag and challenge resistance at the MACRO structure.”
This article is produced in accordance with Cointelegraph’s Editorial Policy and is intended for informational purposes only. It does not constitute investment advice or recommendations. All investments and trades carry risk; readers are encouraged to conduct independent research before making any decisions. Cointelegraph makes no guarantees regarding the accuracy or completeness of the information presented, including forward-looking statements, and will not be liable for any loss or damage arising from reliance on this content.

Prediction markets rapidly repriced the odds of a U.S. escalation in the Iran crisis, offering a real-time read on geopolitical risk for traders. Platforms such as Polymarket and Kalshi adjusted odds in tandem with shifting signals from Washington, while Bitcoin moved higher, climbing about 3.5% on the day.
Industry practitioners say these markets are increasingly embedded in professional portfolios. Fabian Dori, chief investment officer at Sygnum Bank, described prediction markets as providing priced outcomes with real capital behind them. “Prediction markets price discrete, named outcomes with real capital behind them. For crypto in particular, where price action is often driven by binary events, regulatory decisions, geopolitical developments and protocol upgrades, that is a categorically different signal,” Dori told Cointelegraph.
Throughout the Iran crisis, odds on de-escalation appeared to shift ahead of broad-media coverage, with a visible correlation to Bitcoin price action, according to Dori.
Key takeaways
- Prediction markets are increasingly used as macro risk monitors on professional desks, not just as niche tools.
- Institutional money is flowing in: March data showed about 191 million prediction-market transactions, up 2,838% year-on-year, with notional volume around $23.9 billion.
- Traditional market infrastructure is embracing prediction markets, highlighted by ICE’s $600 million investment in Polymarket in late March.
- While growing in adoption, the sector faces fairness and integrity questions, including insider-trading concerns and market removals after controversy.
- ARK Invest has integrated Kalshi’s data into its investment process, signaling a move toward mainstream corporate usage of event-based odds data.
Prediction markets migrate into macro playbooks
On increasingly active professional desks, prediction markets are being employed as a real-time event monitor amid fast-moving geopolitical developments. They run alongside traditional risk tools such as funding-rate data, options surfaces and flows to help quantify the probability of outcomes like war, sanctions or ceasefires. In this context, markets that continuously update a capital-weighted probability of major geopolitical events are a natural fit for structured risk assessment.
Kalshi’s data and activity have become part of institutional workflows, with ARK Invest noted for incorporating Kalshi data into its decision-making process. This signals a broader trend: event odds are migrating from niche platforms to mainstream investment processes, shaping how teams frame risk scenarios rather than simply reacting to headlines.
As prediction markets grow, they are increasingly used to form a contextual layer for decision-making. The aim is to anticipate, rather than chase, outcomes before they occur, leveraging markets that reflect evolving probabilities around war, sanctions or engagement dynamics.
Institutional money and growing scrutiny
The scale of activity in prediction markets has begun to move traditional conversations about liquidity and reliability. In March, the number of prediction-market transactions reached about 191 million, up 2,838% year-on-year, with monthly notional volume around $23.9 billion. The flows have drawn attention from mainstream finance operators who see potential value in event-driven risk analytics.
Concretely, Intercontinental Exchange (ICE), the parent company of the New York Stock Exchange, completed a new $600 million investment in Polymarket on March 27, deepening its conviction in the space. This milestone underscores a growing appetite among traditional market participants to engage with prediction markets as part of macro risk assessment and portfolio construction.
Industry practitioners caution that the core question for investors is now about how to incorporate these signals into analysis in a way that adds genuine analytical value rather than introducing noise. “This is no longer a niche product,” Dori said, emphasizing that prediction markets are entering mainstream risk workflows. The challenge remains to balance insight with due diligence, especially as the ecosystem confronts questions about market fairness and integrity.
Not all developments have been positive. Polymarket faced controversy over insider trading when six traders netted around $1 million betting on the timing of U.S. strikes on Iran in late February. The platform also removed a market related to a missing U.S. pilot after backlash, highlighting concerns about the social and political consequences of betting markets tied to real-world events.
Regulatory frames, integrity and what to watch
As prediction markets gain prominence, regulators and market operators are navigating questions around fairness, information asymmetries and the proper boundaries of event-based wagering. The industry has already been exploring its legal limits in different jurisdictions, including strict Asian markets where regulatory testing has taken place. The ongoing dialogue around governance and integrity will shape how widely and deeply these markets are adopted by institutions in the coming months.
What to watch next is how mainstream players integrate these tools without compromising risk discipline. Readers should monitor: whether more asset managers formalize the use of event-odds in risk models, how regulators respond to elevated liquidity and possible manipulation concerns, and whether new interfaces or data feeds emerge to standardize the integration of prediction-market signals into traditional research workflows.
As geopolitics and policy continue to move at machine speed, the market’s appetite for probabilistic signals tied to real outcomes will likely intensify. The coming weeks could reveal how far prediction markets can travel from niche experimentation toward a core element of macro risk assessment.
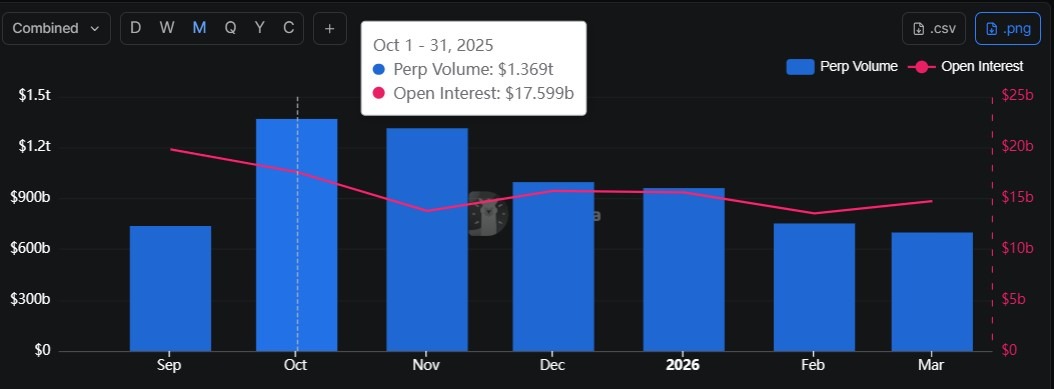
Onchain perpetual futures trading has cooled for five straight months since peaking in October 2025.
Perp volume on decentralized exchanges (DEXs) fell to $699 billion in March 2026 from October’s $1.36 trillion, according to DefiLlama data.
The decline has been steady across the period, with volumes slipping through November and December before losses extended through the first quarter of 2026.
Daily activity also shows signs of softening. On April 4, perp DEX volume fell to $8.4 billion, the first time it dropped below $10 billion since Sept. 6, 2025. This also marks the lowest level since July 5, 2025, according to DefiLlama.
The trend signals a sustained cooldown in onchain perpetual futures trading following the 2025 surge. Perp volumes serve as a proxy for speculative demand and leveraged positioning in crypto markets.

Hyperliquid leads perp DEX volumes over the past 30 days
DefiLlama data shows that trading activity remains concentrated among the top perp DEX platforms. In the past 30 days, Hyperliquid put up about $185.5 billion in reported volume, accounting for roughly 34% of total volume among the top 10 perp DEXs.
This puts the platform significantly ahead of rivals such as edgeX, which reported $73 billion, and Aster, at $68 billion.
Related: Bitcoin shorts risk $2.5 billion liquidation at $72K: Are bears in danger?
Other platforms recorded notably lower volumes over the same period, including Lighter at about $50 billion and Grvt at nearly $40 billion. Smaller venues like ApeX Protocol, Variational and StandX each recorded between roughly $16 billion and $33 billion in 30-day volume.
The data shows that a large share of onchain perpetual futures activity is concentrated in the top platforms, as overall volumes have declined from late-2025 highs.
Perp DEX slowdown follows rapid growth
The slowdown follows a period of rapid growth in onchain derivatives trading. In 2025, perp DEXs nearly tripled cumulative volume to $12.09 trillion, with about $7.9 trillion, about 65%, generated in 2025 alone.
This was largely driven by monthly activity averaging nearly $1 trillion each month in the fourth quarter.
Perpetual futures exchanges are becoming a key battleground across crypto ecosystems. Blockchains have been racing to launch or host perpetual DEXs to capture trading activity, though liquidity has historically tended to consolidate around a small number of dominant platforms.
Magazine: Aster delisting exposes DeFi’s growing integrity crisis
Crypto World
Crypto Liquidations Top $75 Million As Bitcoin Tests $70,000 For the First Time in April
Bitcoin reclaimed above the $70,000 psychological level on Monday, testing levels last seen in March.
The move caught traders off-guard, especially the naysayers, blowing tens of millions in positions out of the water.
Bitcoin Briefly Tests $70,000, Liquidates Over $70 Million Short Positions
The move above $70,000 lasted only briefly, with the pioneer crypto trading for $69,743 as of this writing after recording an intra-day high of $70,283 on the Binance exchange.
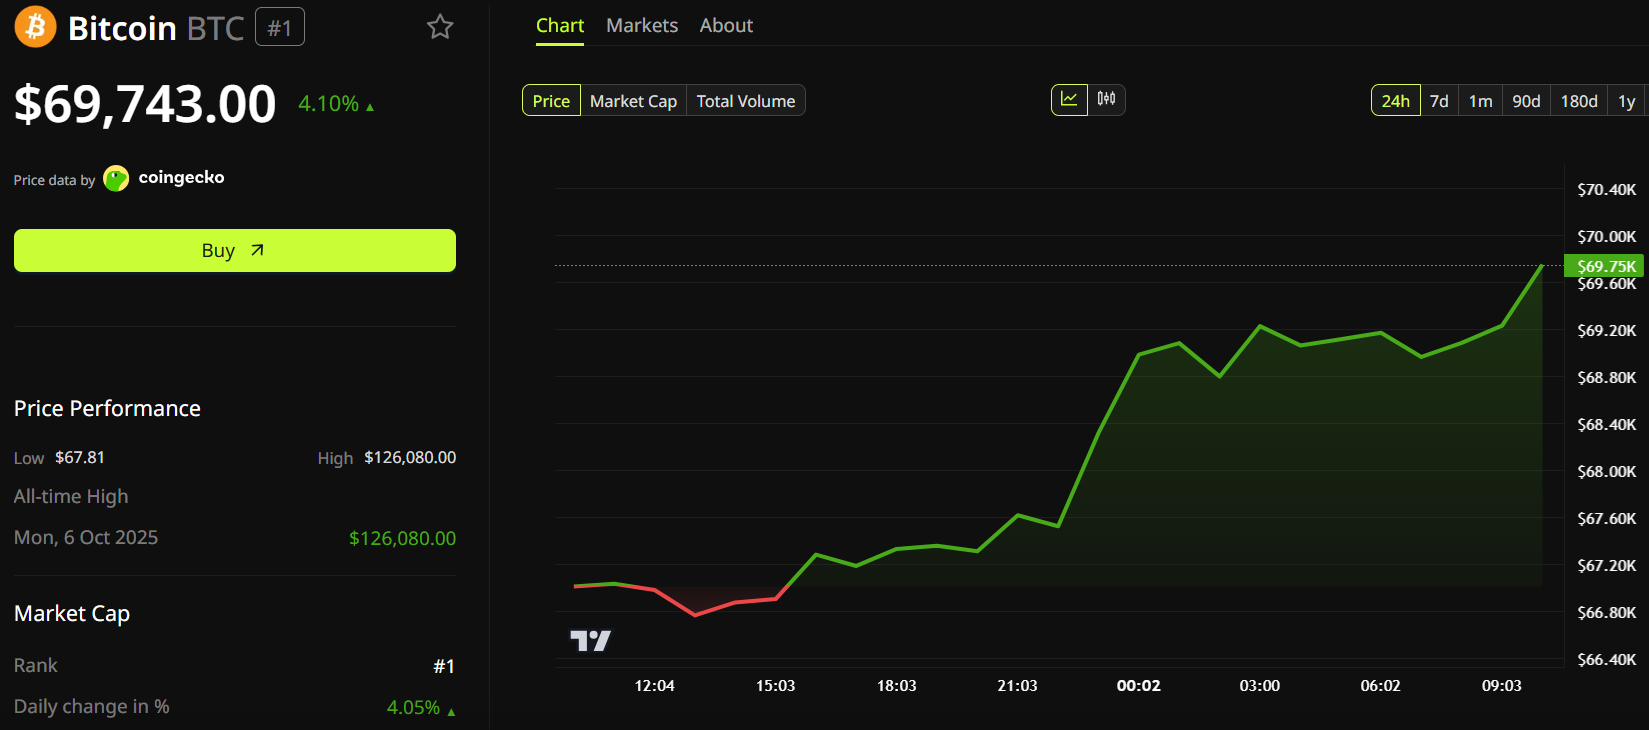
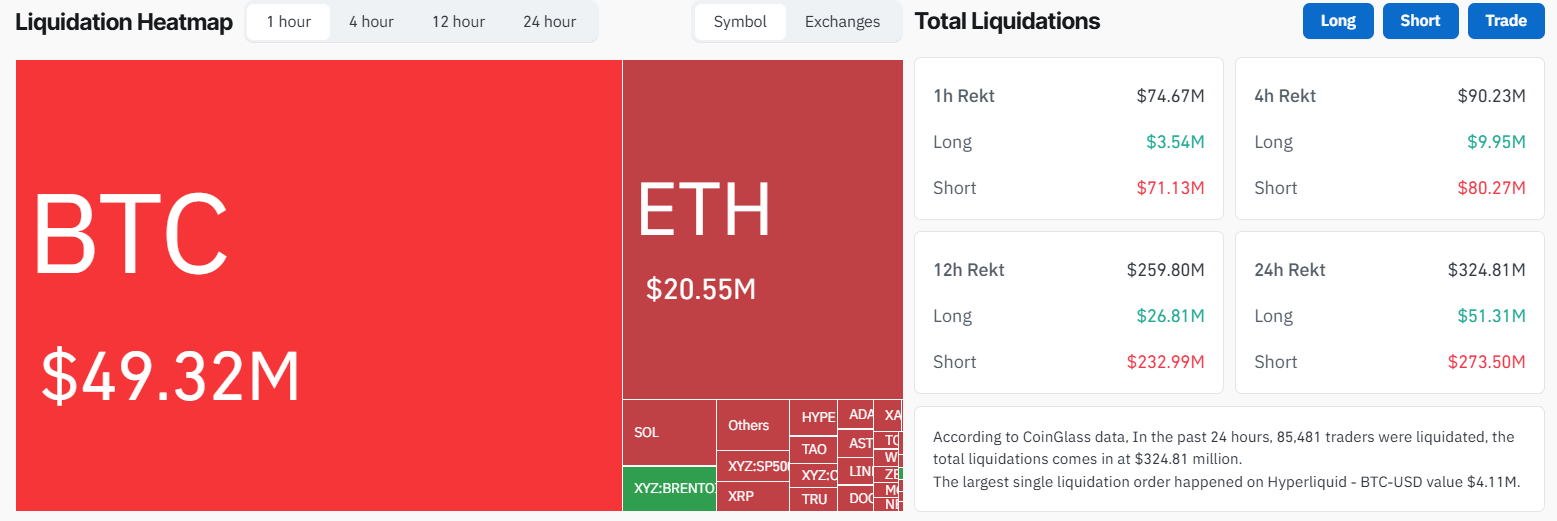
The move was abrupt, blowing out $71 million in short positions while nearly $4 million in positions were also liquidated. Total liquidations in the last hour reached $75 million.
According to data from Coinglass, 85,506 traders were liquidated over the past 24 hours, with total liquidations totaling $324.83 million.
The move above $70,000 inspired bullish bets among Bitcoin traders, as the Weighted Volume Profile Pivot Points (WVPPP) indicator showed a strong bullish signal above the $70,000 psychological level.
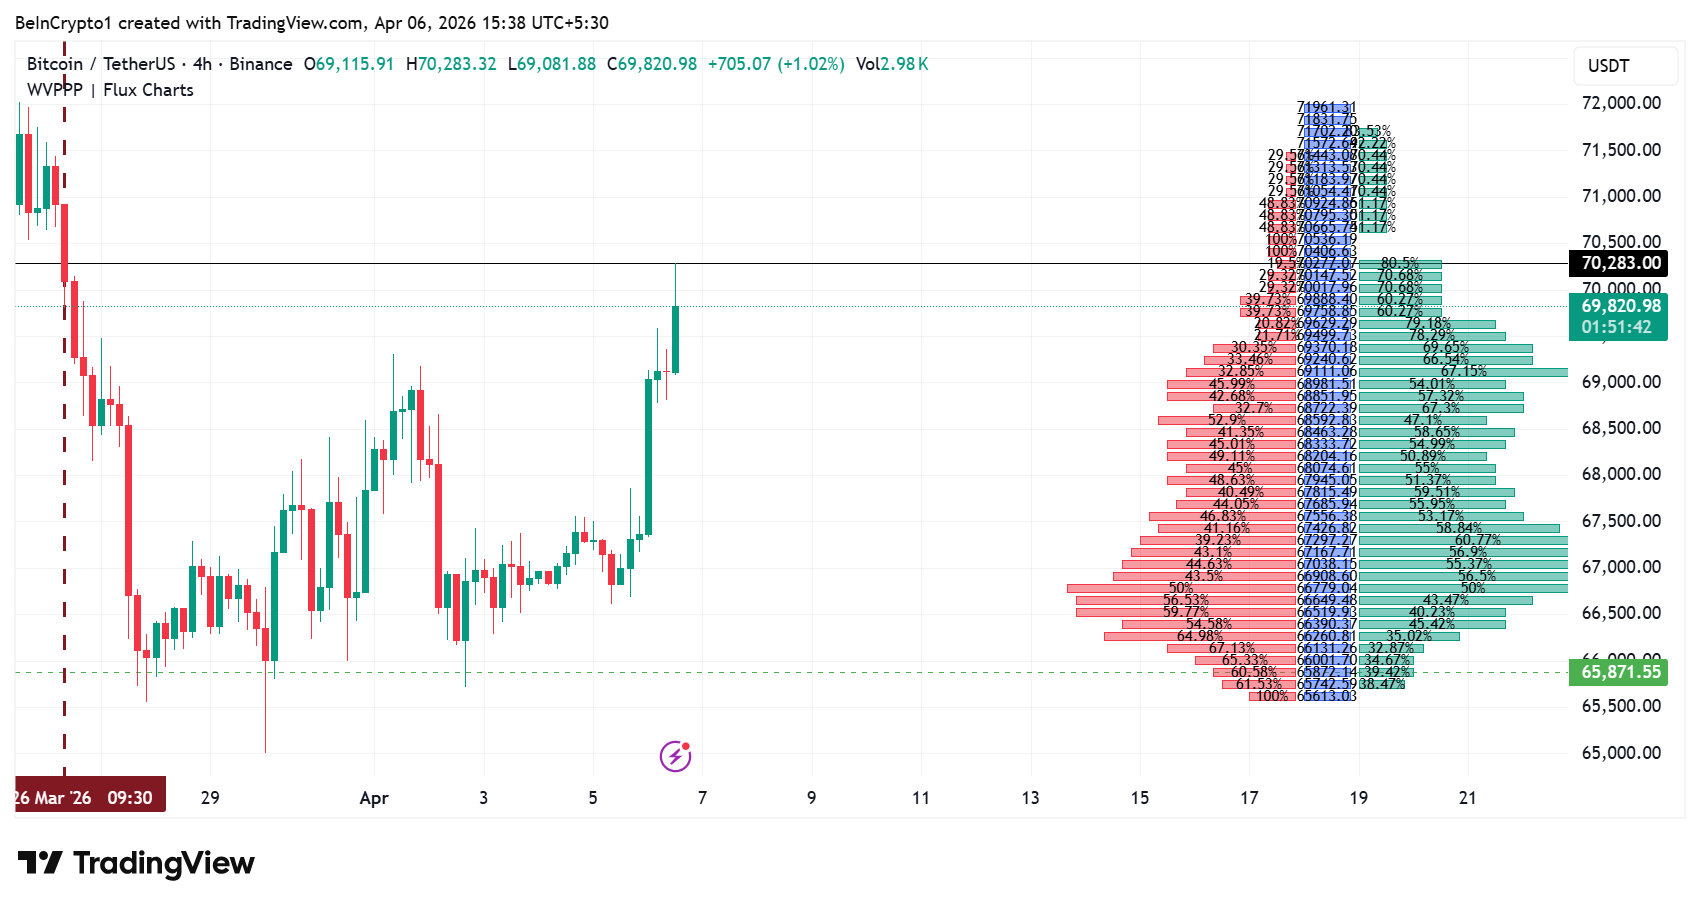
Looking at the above 4H BTC/USDT chart with the WVPPP indicator, above $70,000, the WVPPP bars thin out dramatically. Buy-side dominance runs 70–80% at current levels near $70,283, but participation drops fast above $70,500.
The $70,500–$71,500 range is a low-volume gap with minimal resistance. Sellers only clustered near the $71,961 high. Thin air fast moves likely in either direction.
The post Crypto Liquidations Top $75 Million As Bitcoin Tests $70,000 For the First Time in April appeared first on BeInCrypto.
By Omkar Godbole (All times ET unless indicated otherwise)
It’s risk-on again for markets after a Reuters report suggested a ceasefire plan between the U.S. and Iran could come into effect on Monday, potentially reopening the Strait of Hormuz.
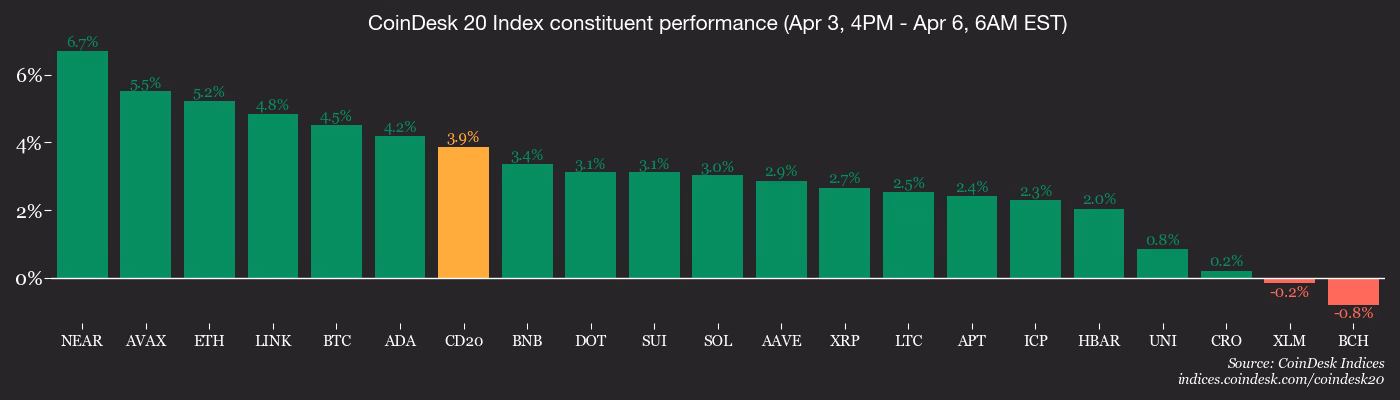
Bitcoin has climbed over 4% over 24 hours to nearly $70,000, lifting sentiment across the broader market. The CoinDesk 20 Index and XRP (XRP) also added 4%, while ether (ETH) jumped over 5%, alongside a 3% gain in solana (SOL).
The tone is reinforced by bullish signals in the futures market, a continued decline in bitcoin’s 30-day implied volatility index, and a 0.8% gain in Nasdaq 100 futures.
Meanwhile, Michael Saylor, founder of Strategy — the world’s largest publicly listed bitcoin holder — hinted at another BTC purchase. The company already holds 762,099 BTC, underscoring its dominant reserve position and long-term accumulation strategy. The Organization of the Petroleum Exporting Countries (OPEC) agreed to increase oil output quotas by 206,000 barrels per day for May, a symbolic effort to relieve energy market stress.
Together, these point to potential for further upside in crypto.
But there’s a caveat. Recent ceasefire headlines citing unidentified sources have proven unreliable, often being debunked or outright rejected by Iran. If that pattern repeats, markets could quickly reverse course.
Another key question is whether any U.S.-Iran ceasefire would be binding on Israel. If not, the current risk-on sentiment may prove short-lived.
Notably, the latest ceasefire push is being described as a last-ditch effort to prevent the “massive strikes on Iranian civilian infrastructure,” President Donald Trump threatened over the weekend.
Meanwhile, the oil market continues to inject inflationary pressure into the global economy. Earlier today, Bloomberg reported that Saudi Arabia raised the price of its Arab Light crude for Asia-bound shipments in May to a record-high premium over Middle Eastern benchmarks.
Some observers warned that oil prices are nearing a danger zone. The 12-month rate of change in oil stands at 92%. Historically, a move to 100% has coincided with stock market collapses. Stay alert!
Read more: For analysis of today’s activity in altcoins and derivatives, see Crypto Markets Today
What to Watch
For a more comprehensive list of events this week, see CoinDesk’s “Crypto Week Ahead“.
- Crypto
- April 6, 12 p.m.: DeFi Dev Corp. (DFDV) to host a March 2026 recap and Ask Me Anything (AMA) session on X Spaces.
- Macro
- April 6, 09:00 a.m.: U.S. ISM Services PMI for March est. 55 (Prev. 56.1)
- Earnings (Estimates based on FactSet data)
Token Events
For a more comprehensive list of events this week, see CoinDesk’s “Crypto Week Ahead“.
- Governance votes & calls
- Aave DAO is voting to adjust oracle configurations, reduce liquidation thresholds, and modify interest-rate models across its V2 markets to support their continued deprecation. Voting ends April 6.
- Decentraland DAO is voting to require the DAO Council and Regenesis Labs to formally publish a 2030 definition of success and contingency plan. The proposal currently has support from voters. Voting ends April 6.
- Unlocks
- April 6: Hyperliquid (HYPE) to unlock 0.14% of its circulating supply worth $11.94 million.
- Token Launches
Conferences
For a more comprehensive list of events this week, see CoinDesk’s “Crypto Week Ahead“.
Market Movements
- BTC is up 3.56% from 4 p.m. ET Friday at $69,805.19 (24hrs: +4.23%)
- ETH is up 4.34% at $2,154.80 (24hrs: +5.42%)
- CoinDesk 20 is up 3.78% at 1,977.26 (24hrs: +4.06%)
- Ether CESR Composite Staking Rate is unchanged at 2.69%
- BTC funding rate is at 0.0058% (6.3400% annualized) on Binance

- DXY is down 0.11% at 99.91
- Gold futures are up 1.60% at $4,726.10
- Silver futures are up 1.00% at $73.46
- Nikkei 225 closed up 0.55% at 53,413.68
- Hang Seng closed down 0.70% at 25,116.53
- FTSE 100 closed on Thursday up 0.69% at 10,436.30
- Euro Stoxx 50 closed down 0.70% at 5,692.86
- DJIA closed down 0.13% at 46,504.67
- S&P 500 closed up 0.11% at 6,582.69
- Nasdaq Composite closed up 0.18% at 21,879.18
- S&P/TSX Composite closed up 0.46% at 33,108.20
- S&P 40 Latin America closed up 4.26% at 3,623.86
- U.S. 10-Year Treasury rate is down 1 bps at 4.31%
- E-mini S&P 500 futures are unchanged at 6,644.00
- E-mini Nasdaq-100 futures are unchanged at 24,370.25
- E-mini Dow Jones Industrial Average futures are unchanged at 46,779.00
Bitcoin Stats
- BTC Dominance: 59.02% (unchanged)
- Ether to bitcoin ratio: 0.030877 (1.02%)
- Hashrate (seven-day moving average): 954 EH/s
- Hashprice (spot): $31.75
- Total Fees: 1.61 BTC / $108,359
- CME Futures Open Interest: 106,600 BTC
- BTC priced in gold: 14.9 oz
- BTC vs gold market cap: 4.66%
Technical Analysis

- The chart shows swings in WTI oil’s price since 1986 in the upper pane. The lower pane shows the 12-month rate of change (ROC).
- Historically, whenever the ROC rises to 100%, stock markets have collapsed. And now, the ROC is approaching that marker again.
- “Every major market crash since 1987 was preceded by one signal,” Jack Prandelli, a commodity market analyst and author of the Substack-based Merchant’s News said on X.
Crypto Equities
- Coinbase Global (COIN): closed on Friday at $171.46 (–0.88%), +3.80% at $177.97 in pre-market
- Galaxy Digital (GLXY): closed at $17.64 (+1.55%), +2.44% at $18.07
- MARA Holdings, Inc. (MARA): closed at $8.71 (+8.33%), +3.10% at $8.98
- Riot Platforms, Inc. (RIOT): closed at $12.86 (+2.47%), +2.49% at $13.18
- Core Scientific, Inc. (CORZ): closed at $16.23 (+6.08%), +1.79% at $16.52
- CleanSpark, Inc. (CLSK): closed at $8.79 (+1.97%), +3.30% at $9.08
- Exodus Movement, Inc. (EXOD): closed at $6.10 (–8.68%)
- CoinShares Bitcoin Mining ETF (WGMI): closed at $35.76 (+2.58%)
- Bullish (BLSH): closed at $36.37 (+3.71%), +2.06% at $37.12
- Circle Internet Group (CRCL): closed at $90.26 (–0.53%), +4.20% at $94.05
Crypto Treasury Companies
- Strategy (MSTR): closed at $119.83 (–2.40%), +4.04% at $124.67
- SharpLink (SBET): closed at $6.19 (–4.18%), +4.52% at $6.47
- Strive Asset Management (ASST): closed at $9.75 (–4.04%), +3.59% at $10.10
- Upexi (UPXI): closed at $0.98 (–1.32%), +3.59% at $1.01
- Lite Strategy (LITS): closed at $1.12 (–0.88%)
ETF Flows
Spot BTC ETFs
- Daily net flows: $9 million
- Cumulative net flows: $55.93 billion
- Total BTC holdings ~1.29 million
Spot ETH ETFs
- Daily net flows: -$71.2 million
- Cumulative net flows: $11.51 billion
- Total ETH holdings ~5.68 million
Source: Farside Investors
While You Were Sleeping


China’s regulators are pushing for banks to upgrade the “bank-tax interaction” model in a bid to expand financing for small businesses.
Summary
- China has urged banks to upgrade the bank tax interaction model using blockchain and shared data to improve financing access for small businesses.
- Authorities are pushing for better credit models and faster approvals, with a focus on extending loans to compliant and tax paying enterprises.
According to a policy notice issued by the State Administration of Taxation and the National Financial Regulatory Administration, banks and taxpayers should standardize data sharing to reduce information asymmetry between tax authorities, banks, and enterprises.
Further, the agencies suggested improving credit models, enhancing approval efficiency, and increasing the supply of financing services to “honest, tax-paying enterprises.”
China published a National Development and Reform Commission roadmap in January 2025 that directed the integration of blockchain into data infrastructure, with nationwide implementation expected by 2029.
Key officials like Shen Zhulin, deputy director of the National Data Administration, believe the initiative could attract around 400 billion yuan (about $58 billion) in yearly investments.
Meanwhile, in 2019, Chinese President Xi Jinping called blockchain a “breakthrough” and urged its integration into the real-world economy; subsequently, China expanded the country’s first blockchain-based electronic invoice system through the Shenzhen Tax Bureau.
China’s anti-crypto push
Despite backing blockchain development, China has remained strict on cryptocurrencies and speculative digital asset trading.
In 2021, authorities issued a joint circular effectively imposing a nationwide ban on crypto transactions and mining.
More recently, in February 2026, regulators expanded this framework to explicitly cover stablecoins and tokenized real-world assets, requiring prior approval for any RMB-pegged stablecoin issuance and warning that unlicensed tokenization activities will be treated as illegal financial operations.

Disclosure: This article does not represent investment advice. The content and materials featured on this page are for educational purposes only.
Quantum computing advances raise concerns over crypto security and volatility for major assets.
Summary
- Quantum computing advances raise concerns over crypto security and volatility, reshaping investor strategies
- AI-driven trading gains momentum as investors seek to navigate increasingly complex crypto market conditions
- ConfluxCapital promotes automated trading bots, highlighting high daily earning potential amid market volatility
Amidst continuous breakthroughs in quantum computing, the cryptocurrency market is entering a phase characterized by heightened complexity and uncertainty. Mainstream assets — exemplified by Bitcoin and Ethereum — may face a dual challenge in the future, grappling with issues of both security and volatility.
Given this trend, relying solely on manual trading has become increasingly inadequate for keeping pace with market dynamics; consequently, AI-driven automated quantitative trading is emerging as the preferred choice for a growing number of investors. Taking the ConfluxCapital fully automated quantitative trading bot as an example, its core advantages and operational steps are outlined below.

Core advantages: Why choose AI quantitative trading?
First and foremost, the most significant advantage lies in “24/7 Operation.” The system enables uninterrupted market monitoring around the clock — 24 hours a day, 7 days a week — eliminating the need for manual market surveillance and ensuring that no potential trading opportunities are missed. This is particularly critical in the cryptocurrency market, an environment that never closes.
The second advantage is “Execution Speed and Precision.” Quantitative systems can complete data analysis and execute trading decisions within milliseconds — a distinct advantage over manual trading. When the market experiences extreme volatility — such as that potentially triggered by expectations surrounding quantum computing — this difference in speed often directly determines the ultimate profit or loss outcome.
The third advantage is “Emotional Detachment.” Manual trading is often susceptible to the influence of emotions such as fear and greed; AI systems, however, operate entirely based on data and algorithms. This allows them to maintain consistent strategy execution even during extreme market conditions, thereby preventing irrational decision-making.
Furthermore, these platforms typically possess “Multi-Strategy Synergy Capabilities.” By combining various quantitative models, the system can flexibly switch between strategies to adapt to different market regimes, whether ranging, trending upward, or trending downward, thereby enhancing the stability of overall returns.
Finally, there is the “Intelligent Risk Management System.” The system automatically adjusts position sizing and risk exposure in response to market fluctuations, minimizing drawdown risk as much as possible within highly volatile environments. This feature will be particularly vital in mitigating the potential market shocks that may arise from future advancements in quantum computing.
From a practical operational standpoint, the entire participation process is relatively simple and straightforward:
Step 1: Account Registration
Visit the ConfluxCapital platform, complete the basic information registration, and set up a personal trading account.
(Sign up now and receive a $20 bonus)
Step 2: Capital Preparation
Determine an appropriate capital allocation based on personal circumstances, then deposit funds into your account to support the subsequent execution of trading strategies.
Step 3: Strategy Selection or Bot Activation
Select a quantitative strategy that aligns with risk tolerance, or directly activate a fully automated trading bot to initiate system operations.
Step 4: Automated Trade Execution
The platform will analyze real-time market data to automatically execute buy and sell orders, requiring no manual intervention.
Step 5: Profit Management and Compound Growth
Users can monitor their earnings at any time and, as needed, choose to withdraw profits or reinvest them to facilitate long-term capital growth.
Strategy Name
unit price
Days
Total Revenue
Starter Strategy
$100
2 days
$100+$6
Basic Strategy
$600
5 days
$600+$45
Advanced Strategies
$5,000
15 days
$5,000+$1,215
Elite Strategy
$25,000
25 days
$25,000+$11,250
Quantum Strategy
$90,000
20 days
$90,000+$36,000
Infinite Strategy
$200,000
25 days
$200,000+$110,000
A critical juncture: Why act early?
We are currently at an extremely critical stage: while quantum computing has not yet fully disrupted cryptographic systems, the pace of its development is already accelerating rapidly. This implies that there is still room to capitalize on market opportunities — though this window of opportunity is gradually narrowing.
By leveraging ConfluxCapital’s fully automated, free trading bot, users can capitalize on current market volatility to unlock a potential daily earning capacity of up to $5,000. Compared to the potentially more complex and volatile market environments that may lie ahead, now could be the most advantageous time to get involved.
Conclusion
When technological change arrives, the market never waits for the hesitant.
Against the backdrop of the continuous advancement of quantum computing, the landscape of cryptocurrency investment is undergoing a profound transformation.
For more information, visit the official website or download the application.
Email: [email protected]
Disclosure: This content is provided by a third party. Neither crypto.news nor the author of this article endorses any product mentioned on this page. Users should conduct their own research before taking any action related to the company.

Key Takeaways
- The number of Chainlink whale wallets holding more than 1 million LINK has increased by 25% year over year.
- Tighter LINK supply from institutional involvement is pushing prices higher.
- LINK is trading within a range but may be ready to break out to $27.
Accumulation of Whales Points to Building Confidence
The whales have shown strong activity around Chainlink’s coin in the last year, indicating growing confidence in this asset.
According to statistics, the number of addresses holding at least one million LINK has risen from 100 in April 2025 to 125 in April 2026, a 25% increase.
Although whales have been accumulating LINK tokens, prices have not responded positively.
However, accumulation by whales is generally a positive long-term outlook as opposed to short-term speculation and price increases.
Institutional Adoption Narrows Supply-Demand Dynamics
Other than whale actions, institutional adoption has become key in dictating Chainlink’s future prospects. The Chainlink Reserve fund has increased consistently by over 137,000 LINK tokens worth about $1.17 million. The total amount held in the reserve fund stands at over 2.93 million LINK tokens, thus decreasing the amount of LINK in circulation.
Moreover, Chainlink’s platform infrastructure keeps gaining traction among enterprises. Applications using Chainlink’s oracle technology are providing fee revenues, thus boosting the ecosystem’s operations. Specifically, token distribution and stablecoin distribution applications are providing enhanced liquidity and higher demand for LINK tokens.
The development of data-based platforms has led to more growth. More transactions have been seen in data feeds and oracle networks, leading to billions of dollars worth of trading volumes with thousands of active users.
Imminent Breakout Hints at Price Consolidation Point
Technically speaking, LINK has been consolidating around $8-$9.40 during the last few weeks after early February.
The period of consolidation means uncertainty in the market when neither bulls nor bears fully control the situation.
Nonetheless, the creation of a slanting resistance trend line means that the price might soon break out. Currently, the MACD is mildly bearish but the declining red histogram hints that selling strength is fading away.
In general, past history has shown that similar consolidation points have usually been followed by a breakout towards new highs in LINK’s price action. Prior times in which the asset experienced such a consolidation phase ended up in substantial rallies once the resistance was breached.
A potential breakout from the slanting resistance trend line will probably increase the bullish activity as well as the ongoing accumulation among whales.
Will LINK Return to $27?
The $27 level is a crucial resistance point for Chainlink. Although the price currently stands well below this level, it should be noted that there is nothing theoretically stopping LINK from reaching these heights.
Breaking out of the current consolidation pattern with the help of continued accumulation by whales and institutions would trigger the beginning of an uptrend. Nevertheless, traders must keep in mind other elements, including the state of the cryptocurrency market and the economy as a whole.
Chainlink is currently at an important crossroads, with whales accumulating and institutions adopting the project, but its price failing to rise correspondingly. It is clear that the limited supply and expanding network serve as a great starting point.
Although LINK appears to be in a range-bound situation, it should not be forgotten that technical analysis points toward an eventual breakout. If the momentum rises, achieving new price levels—including $27—becomes a possibility.

MILLIONAIRE EXPLAINS: If I Started 2026 With $0, Here’s My Exact Plan
Man City now know exactly how to beat Arsenal as Pep Guardiola shown blueprint

Bristol’s Aviva Arena targets Brit Awards as 20,000-capacity venue prepares for 2028 opening


-

 NewsBeat4 days ago
Steven Gerrard disagrees with Gary Neville over ‘shock’ Chelsea and Arsenal claim | Football
-

 Business4 days ago
No Jackpot Winner and $194 Million Prize Rolls Over
-

 Fashion3 days ago
Weekend Open Thread: Spanx – Corporette.com
-
Entertainment7 days ago
Fans slam 'heartbreaking' Barbie Dream Fest convention debacle with 'cardboard cutout' experience
-

 Crypto World5 days ago
Gold Price Prediction: Worst Month in 17 Years fo Save Haven Rock
-

 Business12 hours ago
Three Gulf funds agree to back Paramount’s $81 billion takeover of Warner, WSJ reports
-
Crypto World6 days ago
Dems press CFTC, ethics board on prediction-market insider trades
-

 Sports2 days ago
India men’s 4x400m and mixed 4x100m relay teams register big progress | Other Sports News
-

 Business4 days ago
Login and Checkout Issues Spark Merchant Frustration
-

 Tech7 days ago
Apple will hide your email address from apps and websites, but not cops
-

 Tech6 days ago
EE TV is using AI to help you find something to watch
-

 Sports6 days ago
Tallest college basketball player ever, standing at 7-foot-9, entering transfer portal
-

 Politics7 days ago
Should Trump Be Scared Strait?
-
Tech6 days ago
Daily Deal: StackSkills Premium Annual Pass
-

 Tech6 days ago
Flipsnack and the shift toward motion-first business content with living visuals
-

 Sports7 days ago
Women’s hockey camp eyes fitness boost, tactics ahead of WC 2026 campaign | Other Sports News
-

 Crypto World7 days ago
U.S. rule change may open trillions in 401(k) funds to crypto
-

 Tech6 days ago
How to back up your iPhone & iPad to your Mac before something goes wrong
-

 Politics7 days ago
BBC slammed for ignoring author of The Fraud
-

 Tech7 days ago
This is a 3D-Printed Macintosh That Apple Never Built
You must be logged in to post a comment Login