

Crypto World
Bitcoin Nears Key Resistance as Bearish Flag Persists Within Rising Channel Structure


TLDR:
- Bitcoin trades near $72K, approaching strong resistance within a well-defined ascending channel range.
- Analysts warn a move toward $77K may trigger a liquidity grab before a possible bearish reversal.
- Strong support remains at $60K–$62K, where buyers have repeatedly prevented deeper declines.
- Market remains in a compression phase, with a breakout or rejection likely to define the next move.
Bitcoin continues to trade within a defined range after a sharp decline, with price action showing controlled recovery.
Market participants remain cautious as resistance nears, while analysts monitor whether the current structure leads to a breakout or renewed downside pressure.
Bitcoin Trades Within Ascending Channel as Resistance Nears
A recent tweet by Captain Faibik outlines a cautious outlook for Bitcoin despite short-term upward movement. He maintains that a bearish flag remains active on the daily timeframe, even as price attempts minor recoveries.
According to his view, brief rallies have repeatedly shifted sentiment, though broader control still leans toward sellers.
The chart shared alongside the tweet shows Bitcoin recovering from a steep drop near the $95,000 to $100,000 range.
That decline extended toward the $58,000 to $60,000 zone, where strong buying interest emerged. Since then, price has formed a structured recovery, building higher lows and gradually moving within an ascending channel.
Currently, Bitcoin trades near the $71,000 to $72,000 level. This places it in the upper-middle section of the channel, where momentum appears stable but constrained.
The upper boundary between $74,500 and $77,000 has acted as resistance, rejecting multiple attempts to move higher.
At the same time, the lower boundary around $60,000 to $62,000 continues to serve as a demand zone. Buyers have consistently stepped in at this level, preventing deeper declines.
As price approaches resistance again, traders are watching closely for either a breakout or another rejection.
Bearish Bias Remains Despite Altcoin Activity
Captain Faibik noted in his tweet that a move toward the $77,000 to $78,000 region could occur before a potential decline.
He pointed to a possible liquidity grab followed by a drop toward the $54,000 to $56,000 range. However, he emphasized that confirmation is still required before taking positions.
He also explained his contrasting stance on Bitcoin and altcoins. While maintaining a bearish view on Bitcoin, he has remained active in select altcoins over recent months.
His allocation strategy reflects this approach, with roughly half of his funds held in stable assets and the rest split between midterm altcoin positions and swing trades.
Meanwhile, key levels continue to guide market behavior. Immediate support sits near $70,000, while a mid-channel range between $66,000 and $68,000 acts as a balance zone.
Resistance remains firm below $77,000, and a clear break above this area would shift focus toward the $80,000 to $85,000 region.
Price action within the channel suggests a period of compression. This type of structure often precedes a sharp move once resistance or support gives way.
Until then, Bitcoin remains range-bound, with both upward continuation and downside rotation still possible.
The tweet reflects a wait-and-see approach, with no active trades opened yet. Market participants continue to monitor price behavior near resistance, as confirmation will likely determine the next directional move.


XRP had a rather difficult start to 2026 from a price standpoint, but the underlying XRP Ledger showed notable signs of growth, according to the latest State of XRP report by Messari.
The analytics firm outlines a sharp contrast between the weaker market performance and strong network fundamentals, with stablecoin adoption, real-world asset tokenization, and transaction activity all increasing during the quarter.
XRP Price Falls as Trading Activity Cools
During the first quarter of the year, XRP was, for the most part, the fourth-largest non-stablecoin cryptocurrency by means of total market capitalization, trailing only Bitcoin, Ethereum, and Binance Coin.
However, the token wasn’t immune to the broader market downturn. Its market cap declined by 26% quarter-over-quarter to about $82 billion, while its price dropped by 27% to $1.34 at the time of this writing.
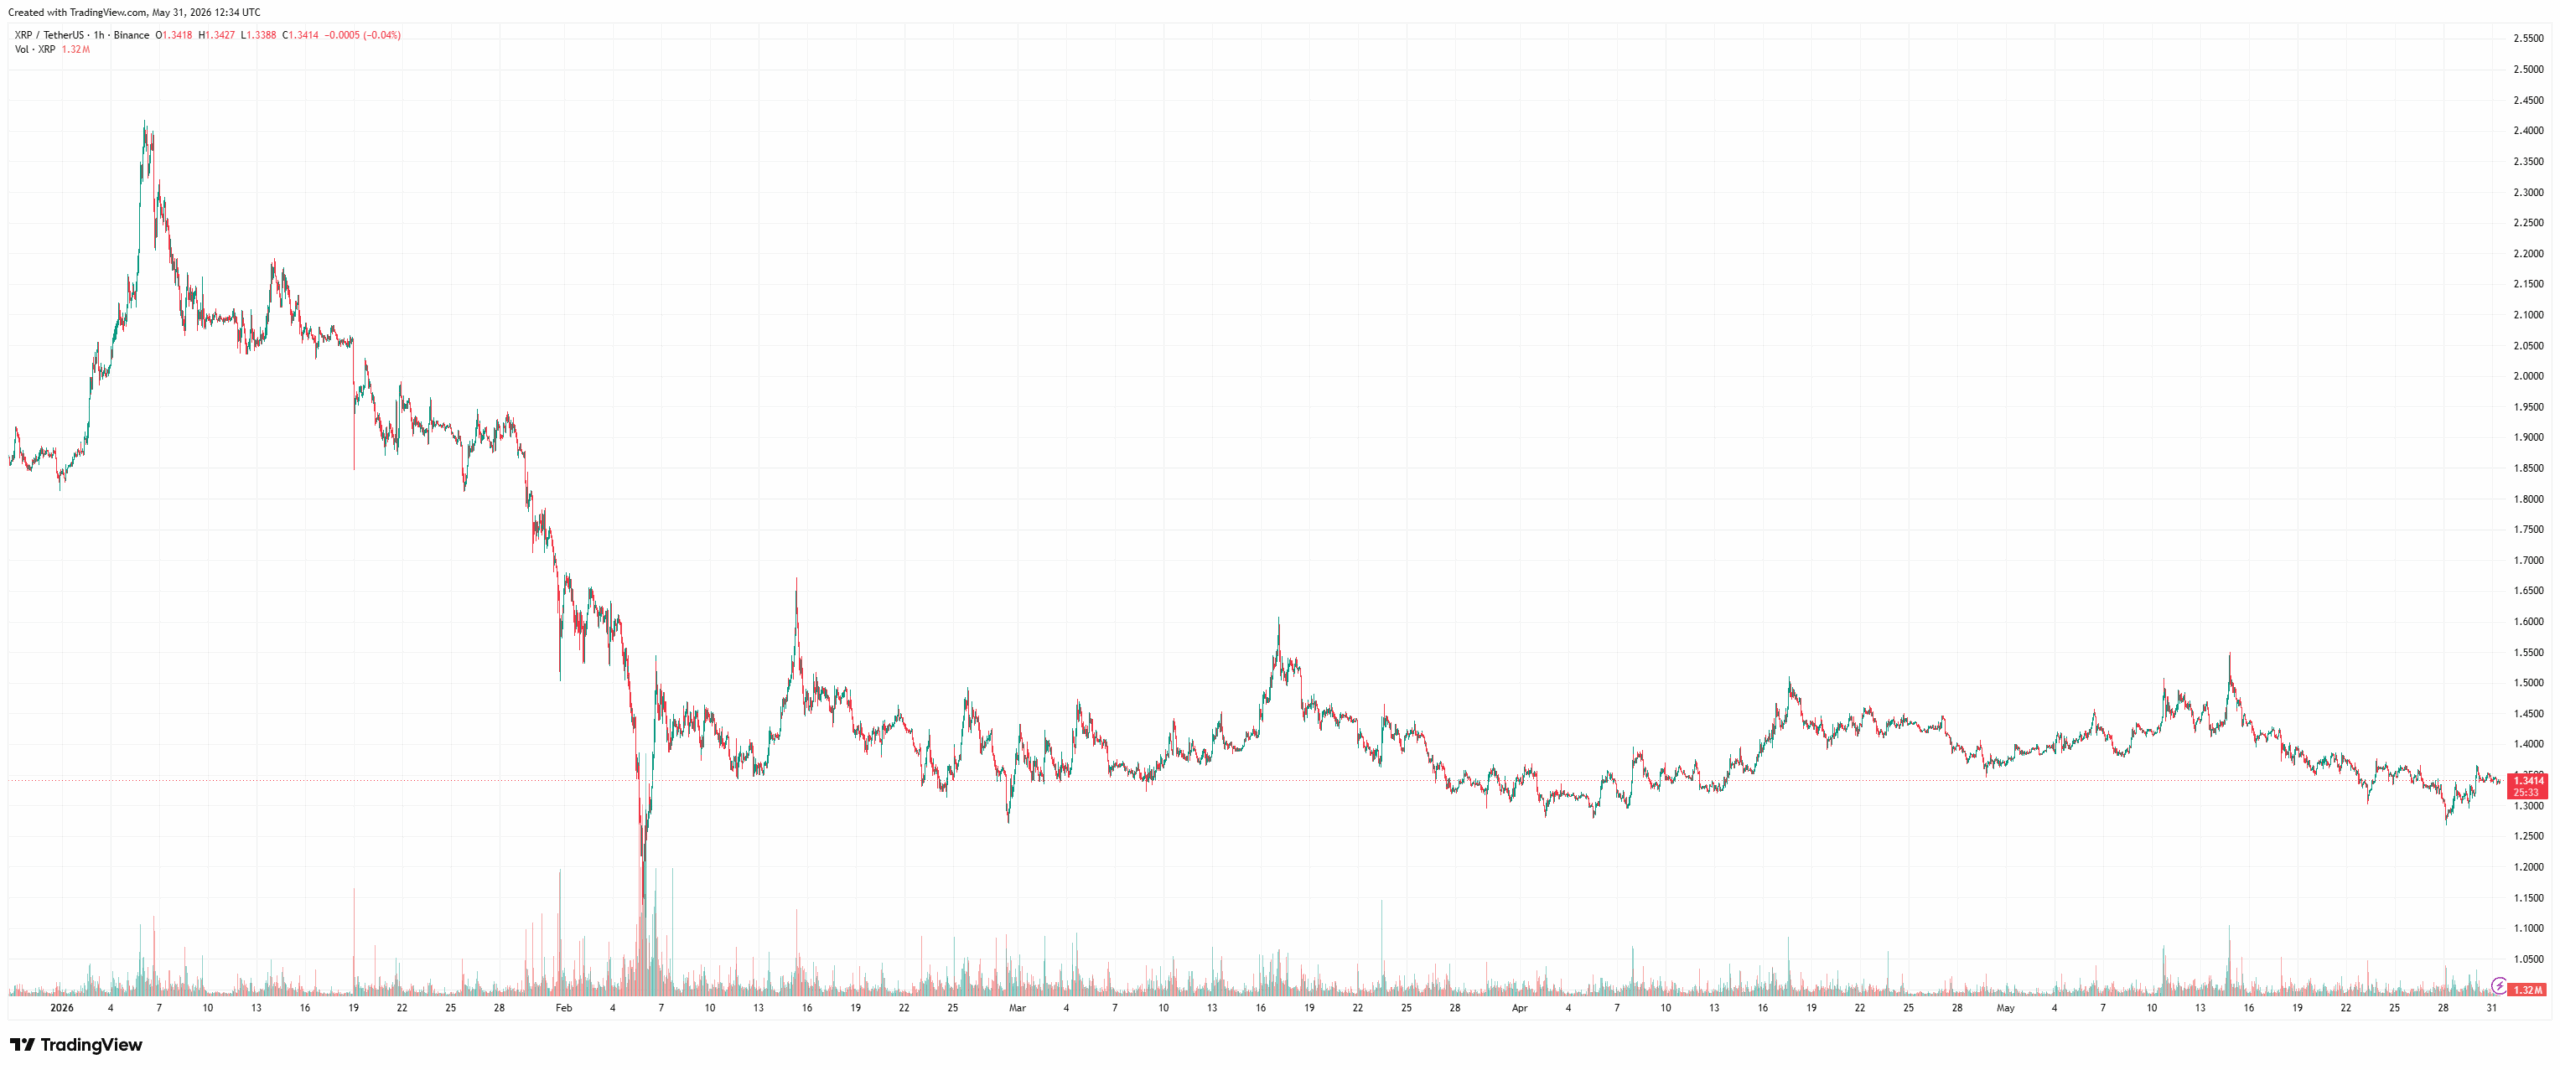
Per Messari’s report, trading activity also slowed down during the cited period. Average daily spot volume declined by 32%, while perpetual futures volume declined by 28.6%. That said, institutional exposure continued to build, as CryptoPotato covered recently. The quarter ended with ETFs holding about 775.4 million XRP, which is roughly 1.26% of the asset’s currently circulating supply.
XRPL Sees Growth in RWAs, Transactions, and Stablecoins
While XRP’s price struggled, XRPL activity moved in the opposite direction, supporting the case for strong fundamental support. Messari indicated that average daily transactions increased by 35% quarter-over-quarter, increasing from 1.83 million to 2.48 million.
The network also saw growing adoption across stablecoins and tokenized assets.
Ripple’s RLUSD stablecoin expanded to a market cap of $340.3 million on the XRPL by the end of the quarter, up 45% from the previous quarter. Meanwhile, XRPL’s real-world market cap soared by 124% QoQ to an all-time high of $2.25 billion.
Messari also reported that new infrastructure is being built in institutional-oriented decentralized finance. During the quarter, permissioned domains, permissioned DEX, and token escrow went live. Meanwhile, native lending protocols and asset vaults are still in voting.
All in all, these developments can be taken to suggest that XRPL’s institutional finance narratives continued to strengthen, despite the weakening price performance of XRP.
The post XRP Ledger Activity Soars in Q1 Despite XRP Price Slump: Messari appeared first on CryptoPotato.
TLDR:
- Bittensor runs 120+ live AI subnets processing hundreds of billions of inferences daily right now
- TAO mirrors Bitcoin’s 21M fixed supply with no premine, no ICO, and no team token allocation
- A single Bittensor subnet recently listed on the marketplace at a $970,000 standalone asking price
- Grayscale’s GTAO Trust creates institutional demand as post-halving supply tightening takes hold
Bittensor’s native token, TAO, is drawing renewed attention from analysts and institutional investors. The network operates over 120 active subnets processing hundreds of billions of AI inferences daily.
Unlike most crypto projects, Bittensor functions as a live, decentralized marketplace for machine intelligence. Its Bitcoin-style tokenomics and growing builder activity are reshaping how some market participants frame its valuation.
Bittensor’s Subnet Economy Drives Real AI Output
Bittensor runs through a system of specialized subnets, each serving as a competitive market for specific AI work. These include text generation, image recognition, code debugging, and financial prediction.
Miners produce AI outputs while validators assess and reward the best work. This creates a continuous, stake-weighted intelligence market operating block by block.
The network directs resources toward the most valuable AI work without any central authority. No board or committee controls funding decisions.
Validators with the most staked TAO carry the most influence over reward distribution. Miners who consistently underperform lose emissions and eventually exit the network.
As @2xnmore noted, “Bittensor is not a crypto project that does AI. It is an AI network that happens to use a token.” That distinction matters for how analysts apply valuation frameworks.
Most market participants are currently pricing TAO as a crypto asset rather than AI infrastructure. That gap between framework and reality is where some analysts see opportunity.
One subnet on the Bittensor marketplace recently listed at a $970,000 asking price. The buyer assessed emission rates, miner quality, and validator coverage before placing that value.
High-performing subnets generate continuous TAO emissions, functioning like yield-bearing assets with fixed-supply cash flows.
Supply Structure and Institutional Activity Support the Thesis
TAO has a maximum supply of 21 million tokens, mirroring Bitcoin’s model. There was no ICO, no premine, and no team allocation.
Every token in circulation was earned through mining or validation. The halving has already occurred, tightening daily supply entering the market.
Grayscale launched its GTAO Trust, creating programmatic institutional demand alongside tighter supply. Polychain Capital, Digital Currency Group, and Dao5 have all invested in the network.
These firms conduct deep technical due diligence before committing capital, lending credibility to the infrastructure thesis.
James Altucher built bluetao.ai, a TAO-powered ChatGPT alternative running on Bittensor subnets. He also launched the TAO Pod podcast targeting mainstream audiences outside crypto.
When builders outside the crypto-native world commit to a network, user adoption can grow through different channels.
Chutes AI, a leading subnet, currently processes over 150 billion tokens per day. TAO trades at roughly $313 with a $3.42 billion market cap.
Analysts circulating price targets between $1,000 and $2,000 tie those figures to an AI infrastructure repricing that has not yet occurred.
Quick Summary
- Friday brings the May employment report; April’s numbers showed 115,000 new positions and a 4.3% unemployment rate
- Major earnings releases include Dollar General, Five Below, Broadcom, Palo Alto Networks, and CrowdStrike
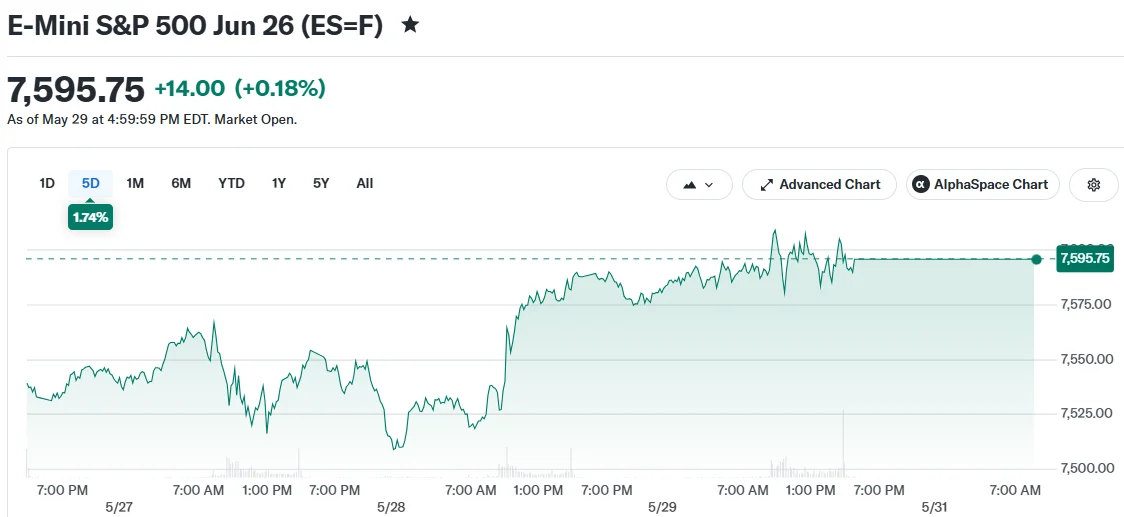
- May ended with markets at all-time peaks: S&P 500 reached 7,580 while the Dow hit 51,032
- Bitcoin declined 0.53% to $73,702, whereas gold advanced 1.28% to $4,575 per ounce
- Dell stock jumped over 32% on robust AI server sales; Anthropic secured $65 billion funding at $965 billion valuation
Investors enter the new trading week following record market performance, a full slate of corporate reports, and anticipation building around one of the year’s most significant employment releases. Here’s what market participants should monitor.
May Wraps With Markets at Peak Levels
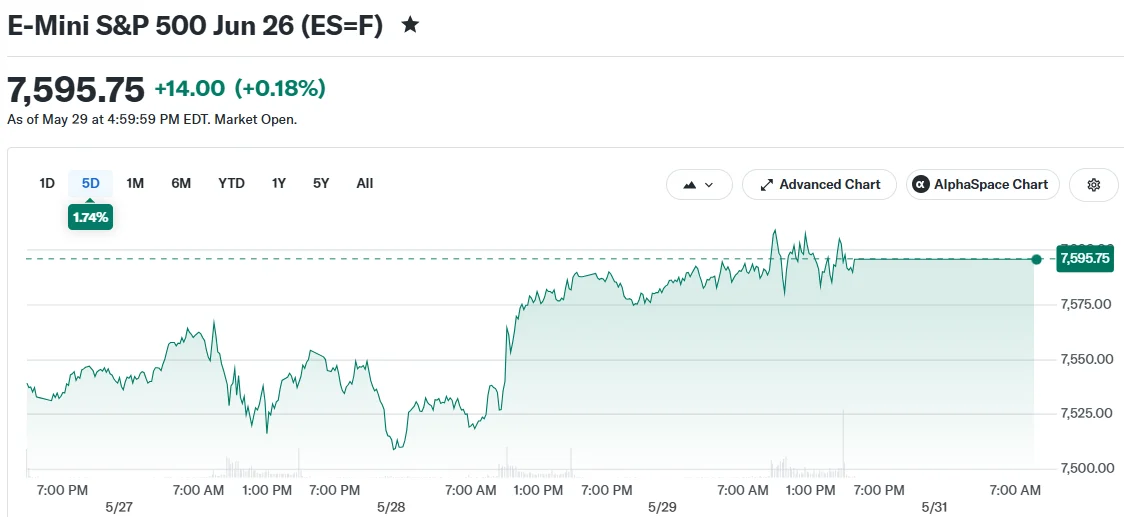
Major equity benchmarks concluded May with solid gains. The Dow Jones Industrial Average climbed 0.72% to reach 51,032. The S&P 500 advanced 0.22% to 7,580, while the Nasdaq 100 rose 0.36% to settle at 30,333.
Technology shares provided significant momentum. Dell rocketed more than 32% following impressive quarterly results and upgraded forward guidance, with executives highlighting increased appetite for AI-powered servers. Broadcom stock has climbed over 25% year-to-date following partnership agreements with Meta, Google, and Anthropic.
The 10-year Treasury yield advanced to 4.44%. This uptick in fixed-income yields continues applying headwinds to rate-sensitive equities and remains a focal point for market observers.
Oil fell sharply. West Texas Intermediate crude closed the week approximately 9% lower at $87.98 per barrel. The decline signals reduced friction between the United States and Iran alongside prospects for a potential ceasefire agreement.
Cryptocurrency and Precious Metals Show Divergence
Bitcoin edged down 0.53% through the week, finishing at $73,702. Despite numerous headlines, digital asset markets maintained relative stability.
Gold appreciated, climbing 1.28% to reach $4,575 per ounce. Market participants seem to be gravitating toward gold as protective holdings amid rising bond yields and ongoing geopolitical tensions.
Key Events for the Coming Week
The most significant release arrives Friday with the May employment report, scheduled for 8:30 a.m. ET from the Bureau of Labor Statistics. April’s data revealed 115,000 jobs created, declining from March’s 178,000, while unemployment remained steady at 4.3%.
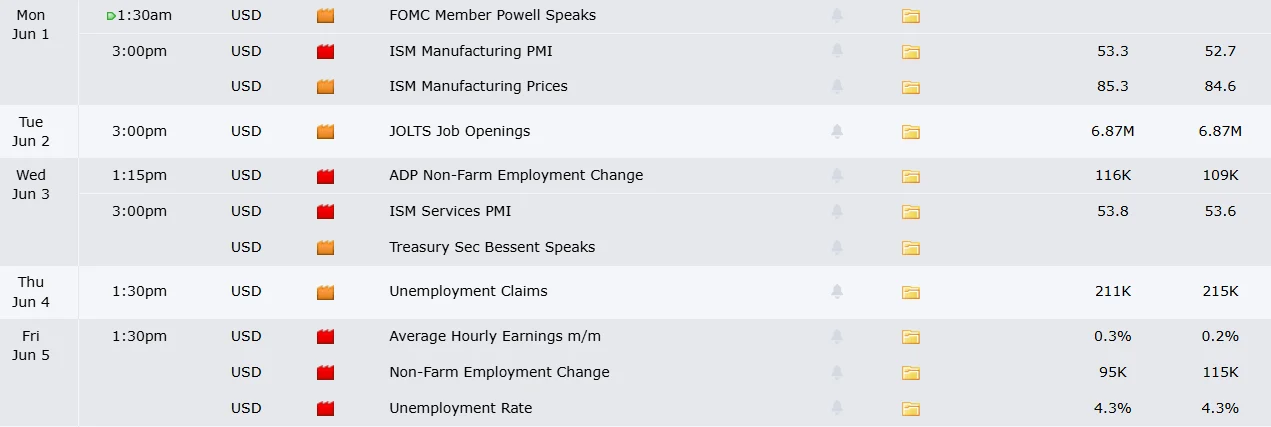
Analysts remain split on interpreting the figures. Some point to labor market resilience. Others argue the expansion primarily stems from healthcare sector hiring tied to demographic shifts rather than comprehensive economic vigor.
New Federal Reserve Chair Kevin Warsh approaches his inaugural policy meeting scheduled for mid-June. Warsh has signaled the Fed will adopt less transparency regarding interest rate deliberations, potentially forcing investors to lean more heavily on economic indicators like employment statistics.
Corporate Earnings Take Center Stage
Dollar General and Five Below deliver quarterly results Tuesday and Wednesday respectively. These retailers cater to budget-conscious consumers, making their performance a valuable gauge of lower-income spending patterns amid persistent inflation.
Within technology, Palo Alto Networks announces Tuesday after market close. The cybersecurity firm exceeded projections last quarter but reduced annual forecasts citing elevated acquisition-related expenses. CrowdStrike follows Wednesday. Broadcom closes out Wednesday’s session with its report.
Lululemon presents Thursday. The athletic apparel company has seen shares tumble roughly 60% over the past year and is currently transitioning to new chief executive leadership.
Artificial Intelligence Momentum Persists
Anthropic, creator of the Claude AI platform, completed a $65 billion funding round at a $965 billion valuation. This capital raise positions Anthropic on the cusp of becoming the first privately-held AI enterprise valued at one trillion dollars.
Microsoft is purportedly developing an integrated super application consolidating its Copilot AI capabilities into a unified platform spanning coding, communication, and productivity functions. Nvidia chief executive Jensen Huang delivers his keynote address at Computex Taipei Sunday evening, with expectations high for AI-related product announcements.

Key Takeaways
- NuScale holds the exclusive distinction of being the sole U.S. nuclear firm with NRC approval for its small modular reactor design, providing a crucial regulatory advantage.
- First quarter 2026 revenue totaled a mere $565,000—a staggering 95.8% decline from the previous year—falling far short of the $7 million analyst forecast.
- Shares currently hover between $12 and $13, representing a steep 65% drop from year-ago levels, with the 52-week peak reaching $57.42.
- Significant insider divestment occurred in recent months, notably Director Corp Fluor’s April sale of 13.5 million shares valued at more than $159 million.
- Analyst consensus stands at “Hold,” with a mean price target of $15.92, while institutional stakeholders control 78.37% of outstanding shares.
NuScale Power (SMR) has experienced a dramatic descent, with shares now changing hands below $13—a precipitous 65% decline from levels seen twelve months earlier. This substantial valuation contraction has captured investor attention, though the underlying fundamentals present a nuanced picture.
NuScale Power Corporation, SMR
Shares commenced Thursday’s session at $12.05, operating within a 52-week trading band spanning $8.85 to $57.42. The company’s market capitalization hovers around $4.4 to $4.5 billion—a remarkably large valuation for an enterprise that generated merely $565,000 in quarterly revenue.
That first-quarter performance wasn’t simply underwhelming—it represented a dramatic shortfall against Wall Street’s $7 million projection. The year-over-year revenue collapse of 95.8% accompanied an operating deficit of $57 million for the three-month period.
NuScale disclosed Q1 earnings per share of -$0.14, falling short of the -$0.11 consensus forecast. Full-year projections call for EPS of -$0.79.
Why Some Remain Bullish on NuScale
The optimistic perspective centers on regulatory positioning. NuScale stands alone among American nuclear reactor developers in possessing Nuclear Regulatory Commission certification for its small modular reactor architecture. Competitors including Oklo and Nano Nuclear Energy lack this critical approval and may require multiple years to obtain similar authorization.
NuScale maintains engagement in two significant projects. The company collaborates with a Romanian energy provider to construct a 462-megawatt facility at a decommissioned coal plant location. Domestically, through partnership with ENTRA1, it pursues 6 gigawatts of SMR deployment for the Tennessee Valley Authority.
Both initiatives anticipate completion timelines extending beyond 2030. Consequently, NuScale functions essentially as a pre-commercialization enterprise commanding a multi-billion dollar market valuation.
The organization does maintain substantial financial reserves—approximately $1 billion total, including $341 million in cash and cash equivalents. While this provides operational runway, it doesn’t yet translate to profitability.
Heavy Insider Divestment Amid Institutional Support
Recent insider transaction patterns warrant examination. Over the trailing 90-day period, company insiders divested more than 40 million shares representing nearly $475 million in aggregate value. The most substantial transaction involved Director Corp Fluor, which disposed of 13.5 million shares throughout April at a mean price of $11.81, totaling approximately $159 million.
Corporate insider ownership has contracted to just 1.28% of total shares outstanding.
Conversely, institutional investors maintain a commanding 78.37% ownership stake. Seven Grand Managers LLC established a fresh position valued at $1.77 million during Q4. Multiple additional investment firms—including MAI Capital Management and Harbour Investments—expanded their existing holdings.
Wall Street sentiment presents a mixed landscape. B. Riley reduced its price objective from $24 to $19 while maintaining a “Buy” recommendation. HSBC initiated coverage with a “Hold” rating and $13 target. Royal Bank of Canada lowered its projection from $21 to $14. TD Cowen downgraded the stock from “Buy” to “Hold” in February.
The aggregate view across 17 covering analysts settles at “Hold,” with a mean price target of $15.92—representing approximately 25% upside from current trading levels.
NuScale’s 50-day moving average stands at $11.41, while its 200-day moving average rests at $15.38, with the stock currently positioned between these technical indicators.
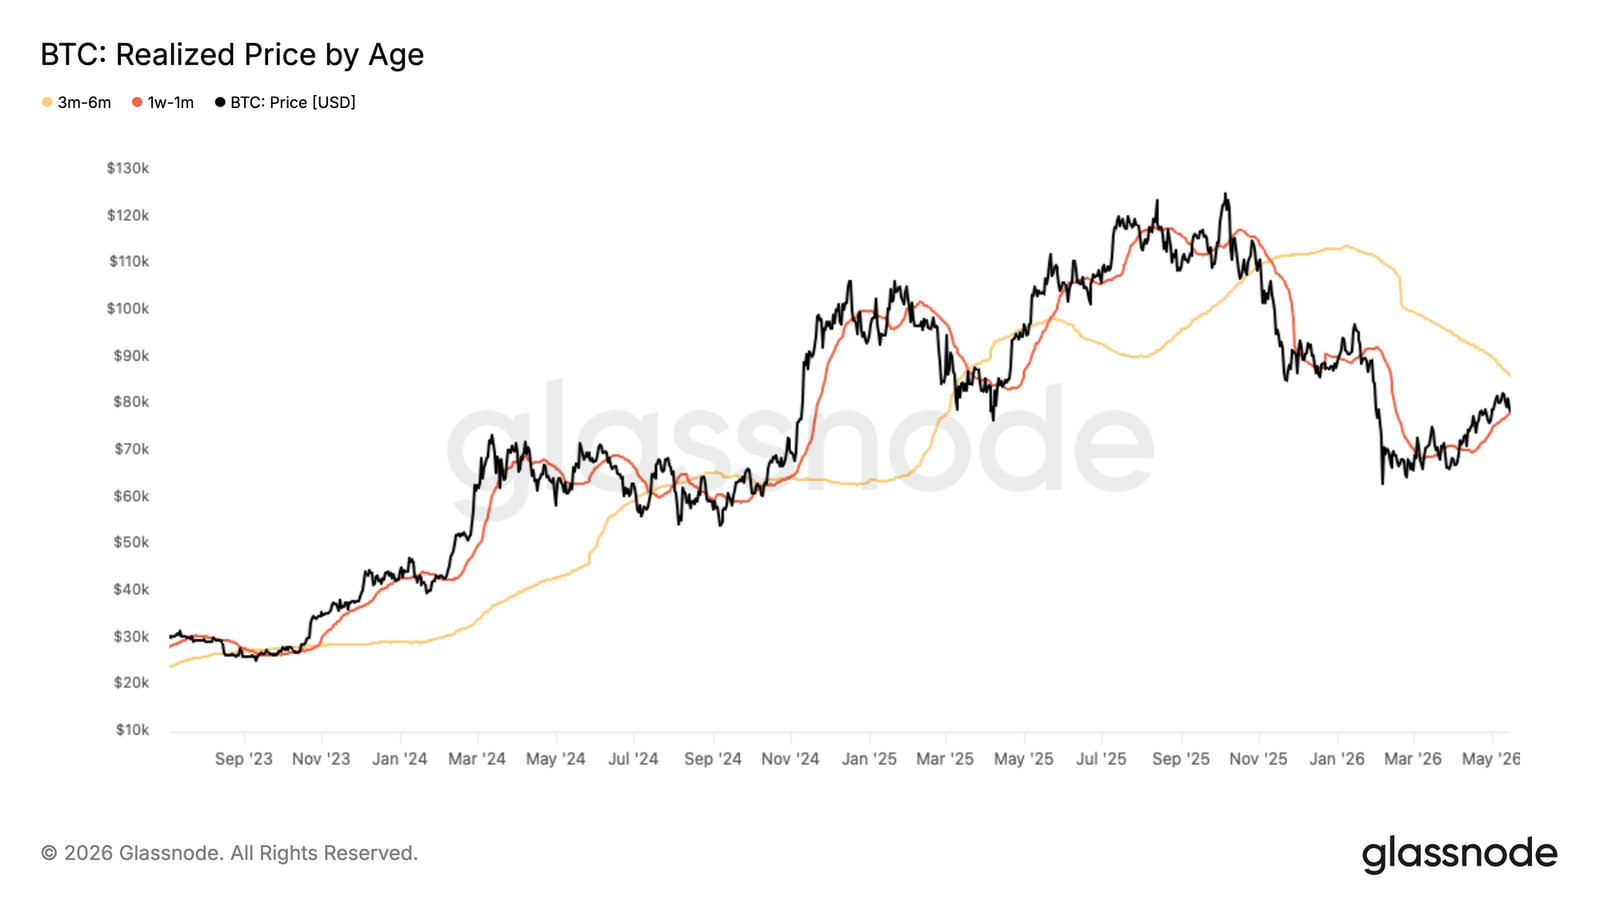
Bitcoin (BTC) is rebounding from a key on-chain support zone, putting the $78,000 level back in focus for bulls.
Key takeaways:
- BTC is eyeing a rebound to $78,200, the realized price of BTC held for three to six months.
- A sustained move above this cost basis could put Bitcoin on track for a push above $100,000 by year-end.
BTC’s short-term holders defend $71,400 cost basis
Bitcoin rebounded roughly 2.5% over the weekend to reach $74,000 on Sunday, with the recovery beginning near $72,500.
The local low came close to the realized price of BTC held for three to six months (orange), a cohort often used to gauge medium-term investor conviction.
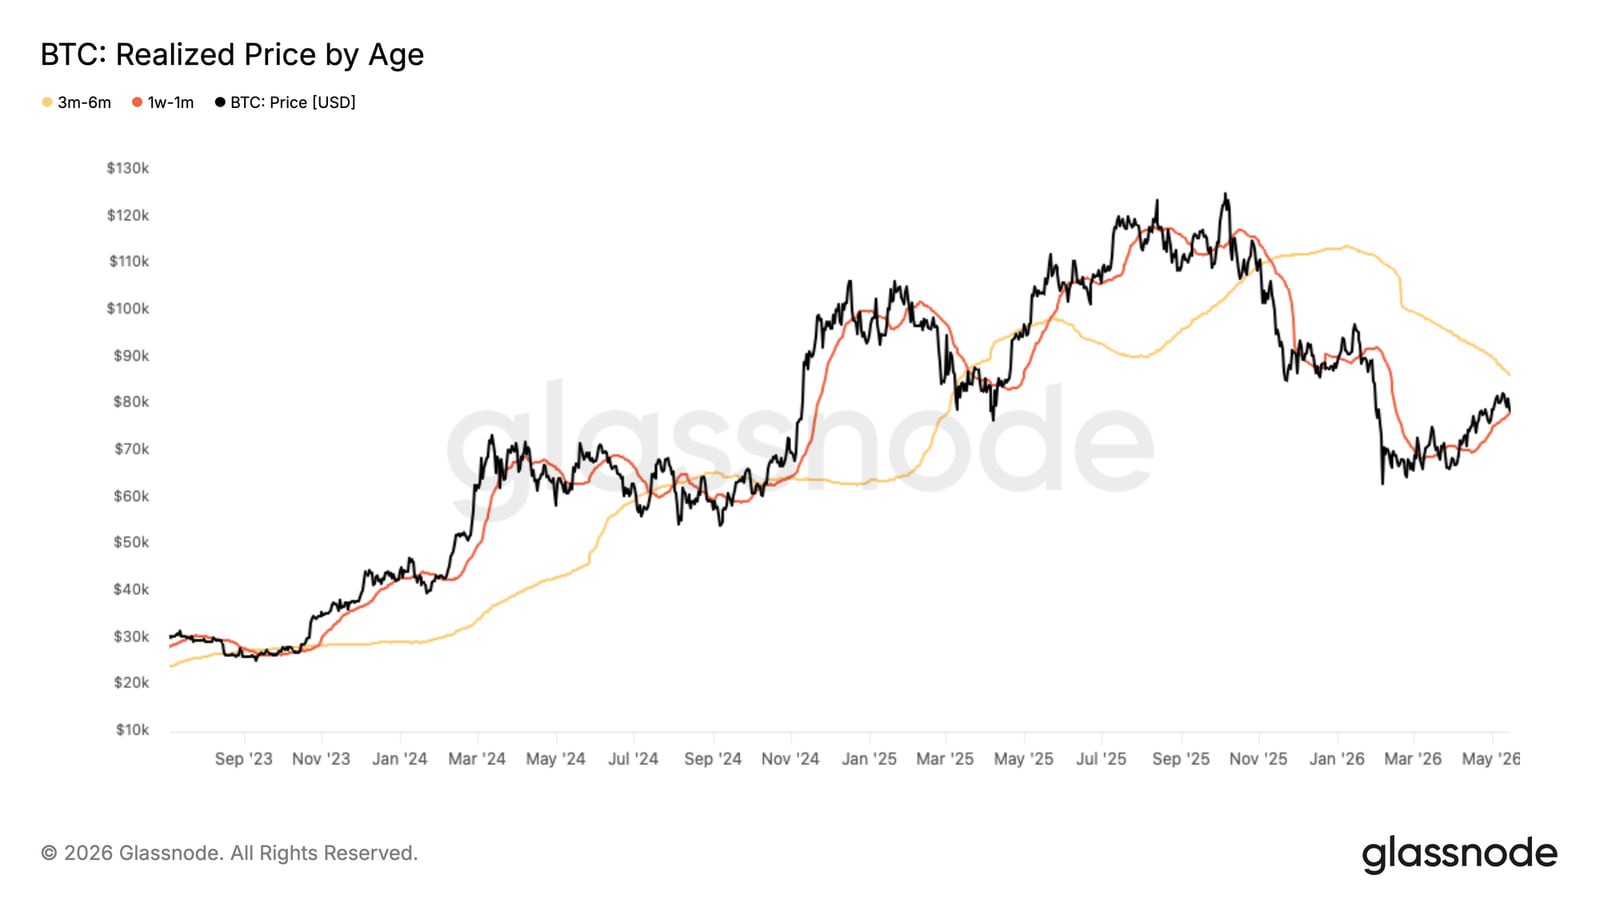
BTC realized price by age vs. price. Source: Glassnode
realised
Glassnode data placed that group’s cost basis near $71,400, which analyst Marcus Corvinus described as Bitcoin’s “strongest near-term support.”
“This cohort is still holding profits, creating a strong incentive to defend the level,” Corvinus said in a Sunday post.
The analyst highlighted $78,200 as the next potential upside target for Bitcoin because the level aligns with the realized price of BTC held for three to six months (yellow). Bulls lost the level during the October 2025 market rout.
What happens after Bitcoin breaks above 3m-6m cost basis?
Bitcoin’s rebound above its three-to-six-month holder cost basis (yellow) has historically preceded stronger returns over longer time frames since 2017.
After similar breakouts, BTC has averaged a 2.3% gain over the following 30 days, a 21.9% gain after 90 days, and a 36.6% gain after 180 days.
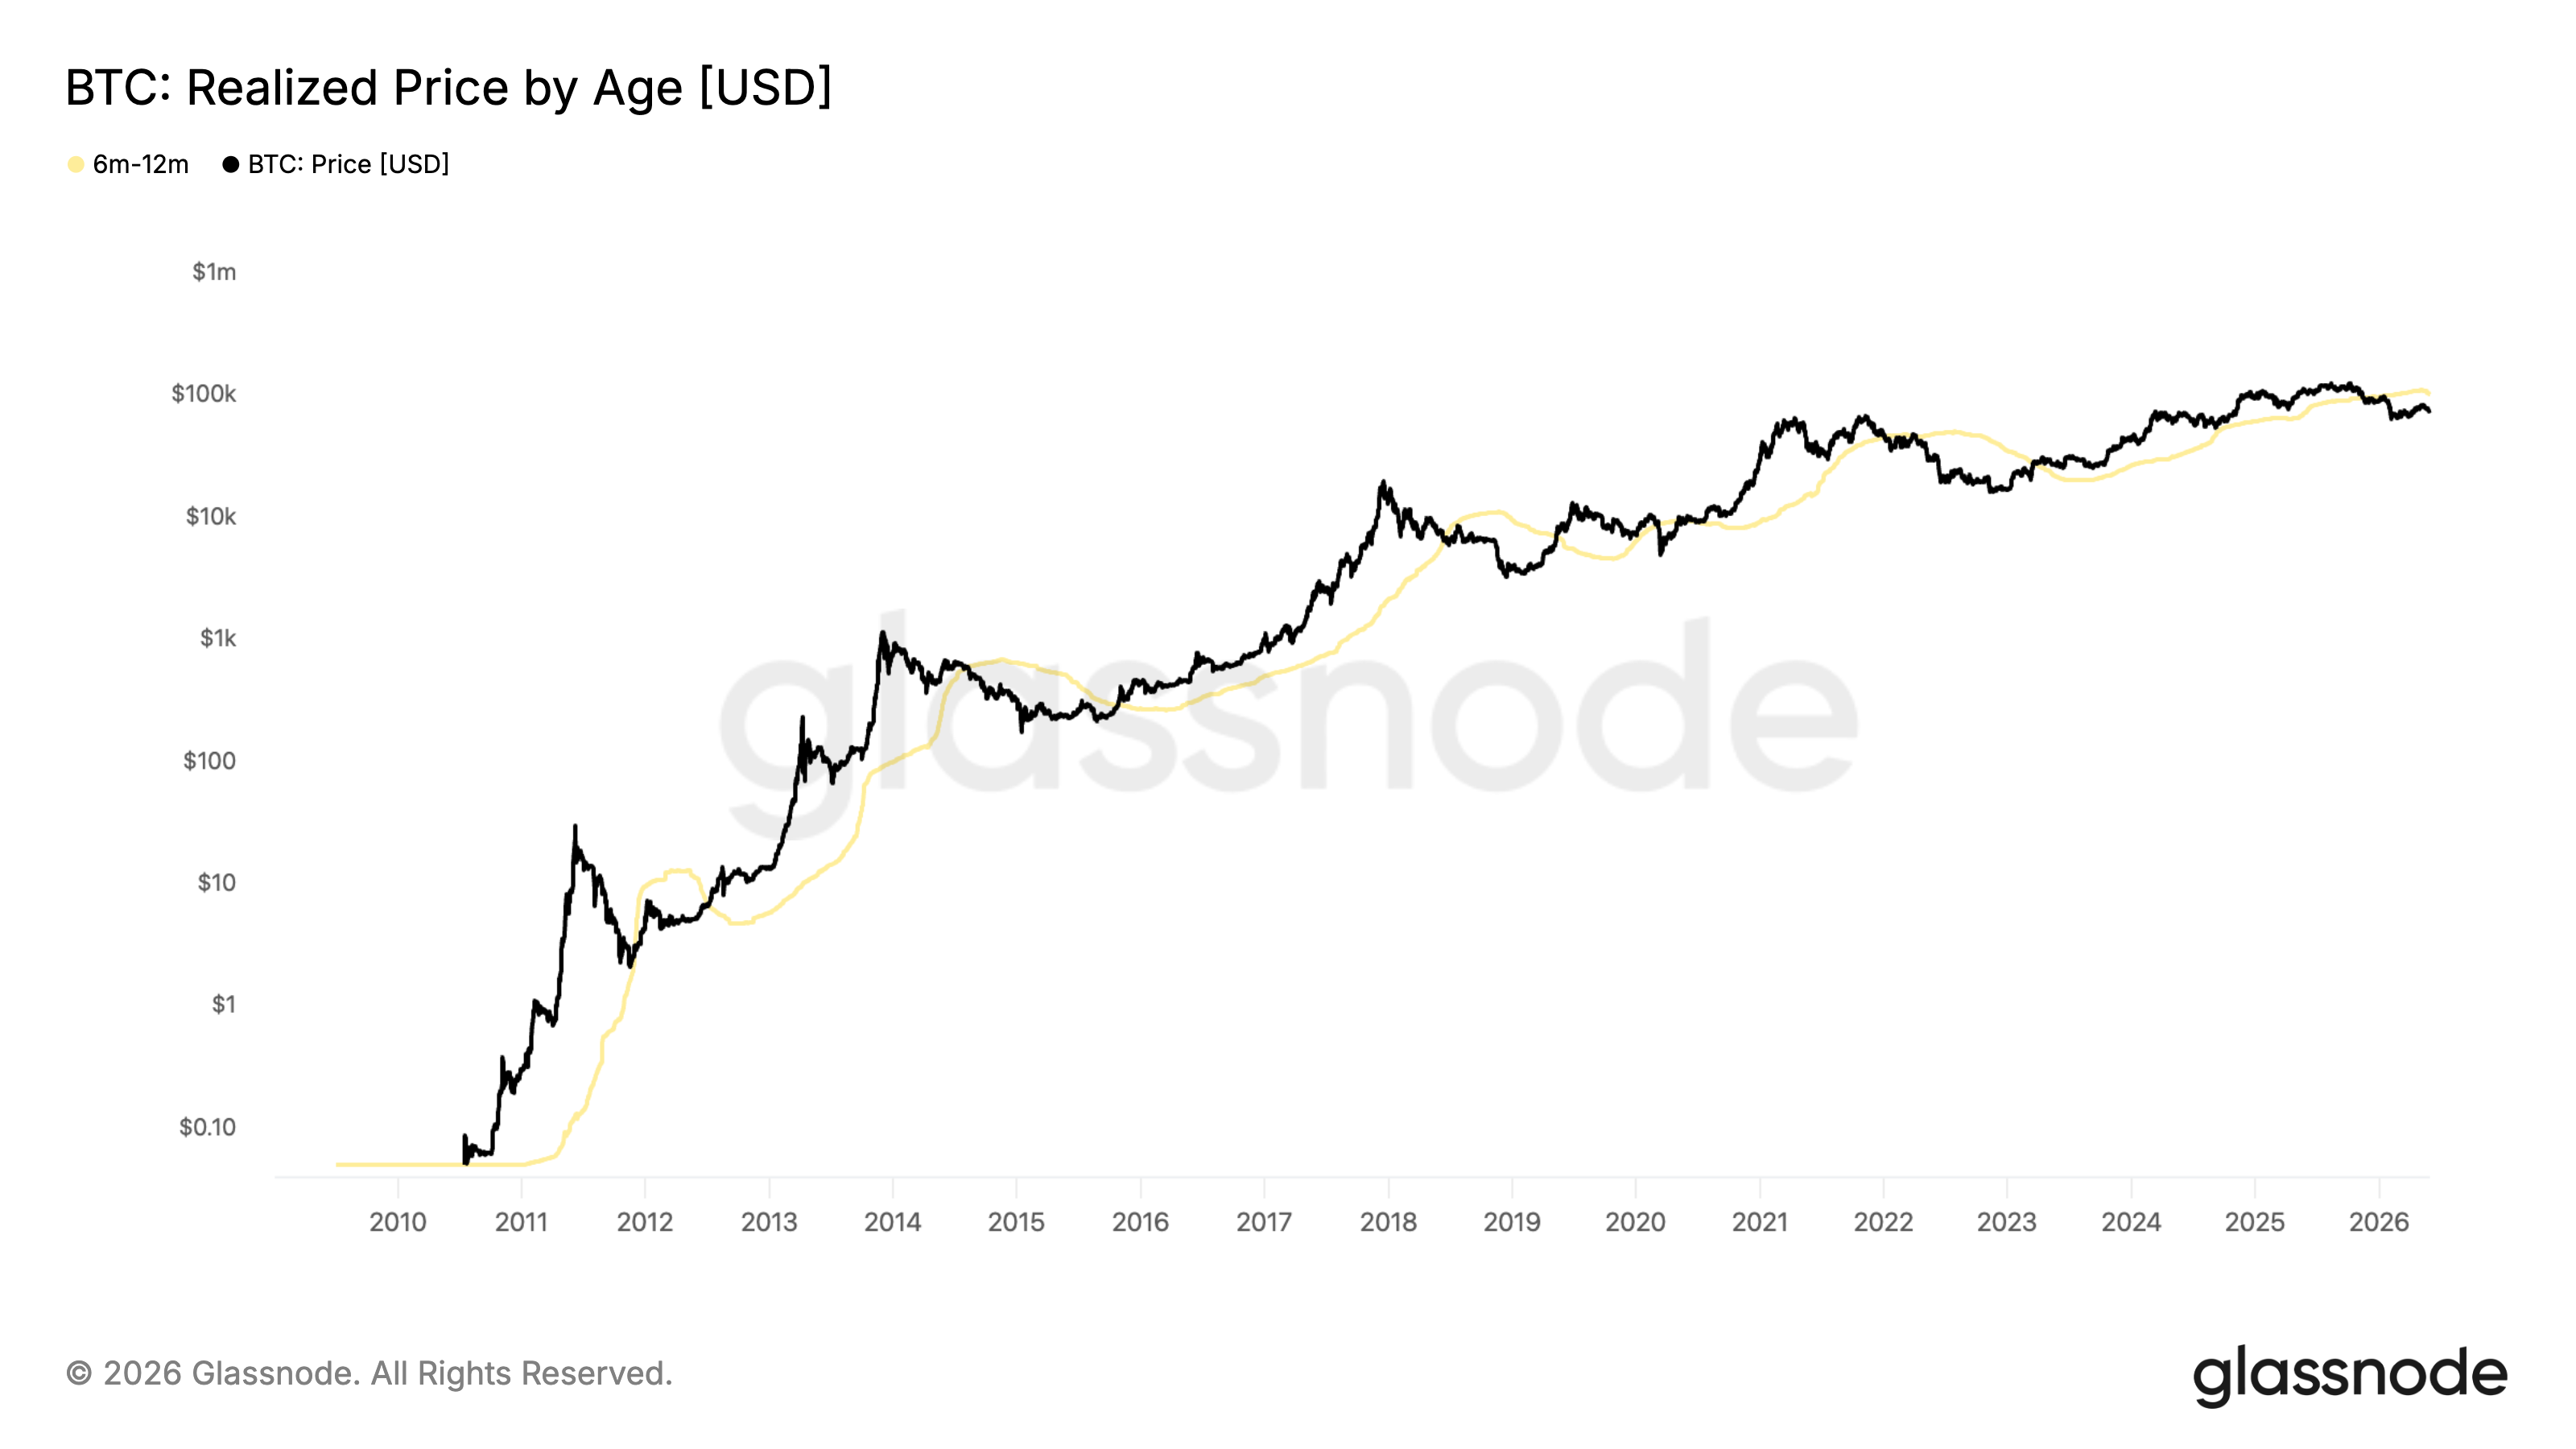
BTC’s 3m-6m cohort realized price vs. price. Source: Glassnode
From Bitcoin’s current level near $74,000, that would imply upside targets of roughly $75,700 in one month, $90,200 in three months, and $101,100 in six months.
Related: Bitcoin doesn’t need a fresh narrative to reclaim $100K: Analyst
The signal has been more reliable over longer time frames. Bitcoin delivered positive returns in only 54.2% of cases after one month, but that hit rate rose to 66.7% after three months and 79.2% after six months.
Bitcoin bear flag can still spoil upside sentiment
Bitcoin’s rebound is also occurring near the lower boundary of a bear flag, keeping the technical outlook cautious.
The pattern has developed after Bitcoin’s sharp decline from its 2026 highs at around $98,000, with the price now stabilizing near the flag’s rising support trend line.
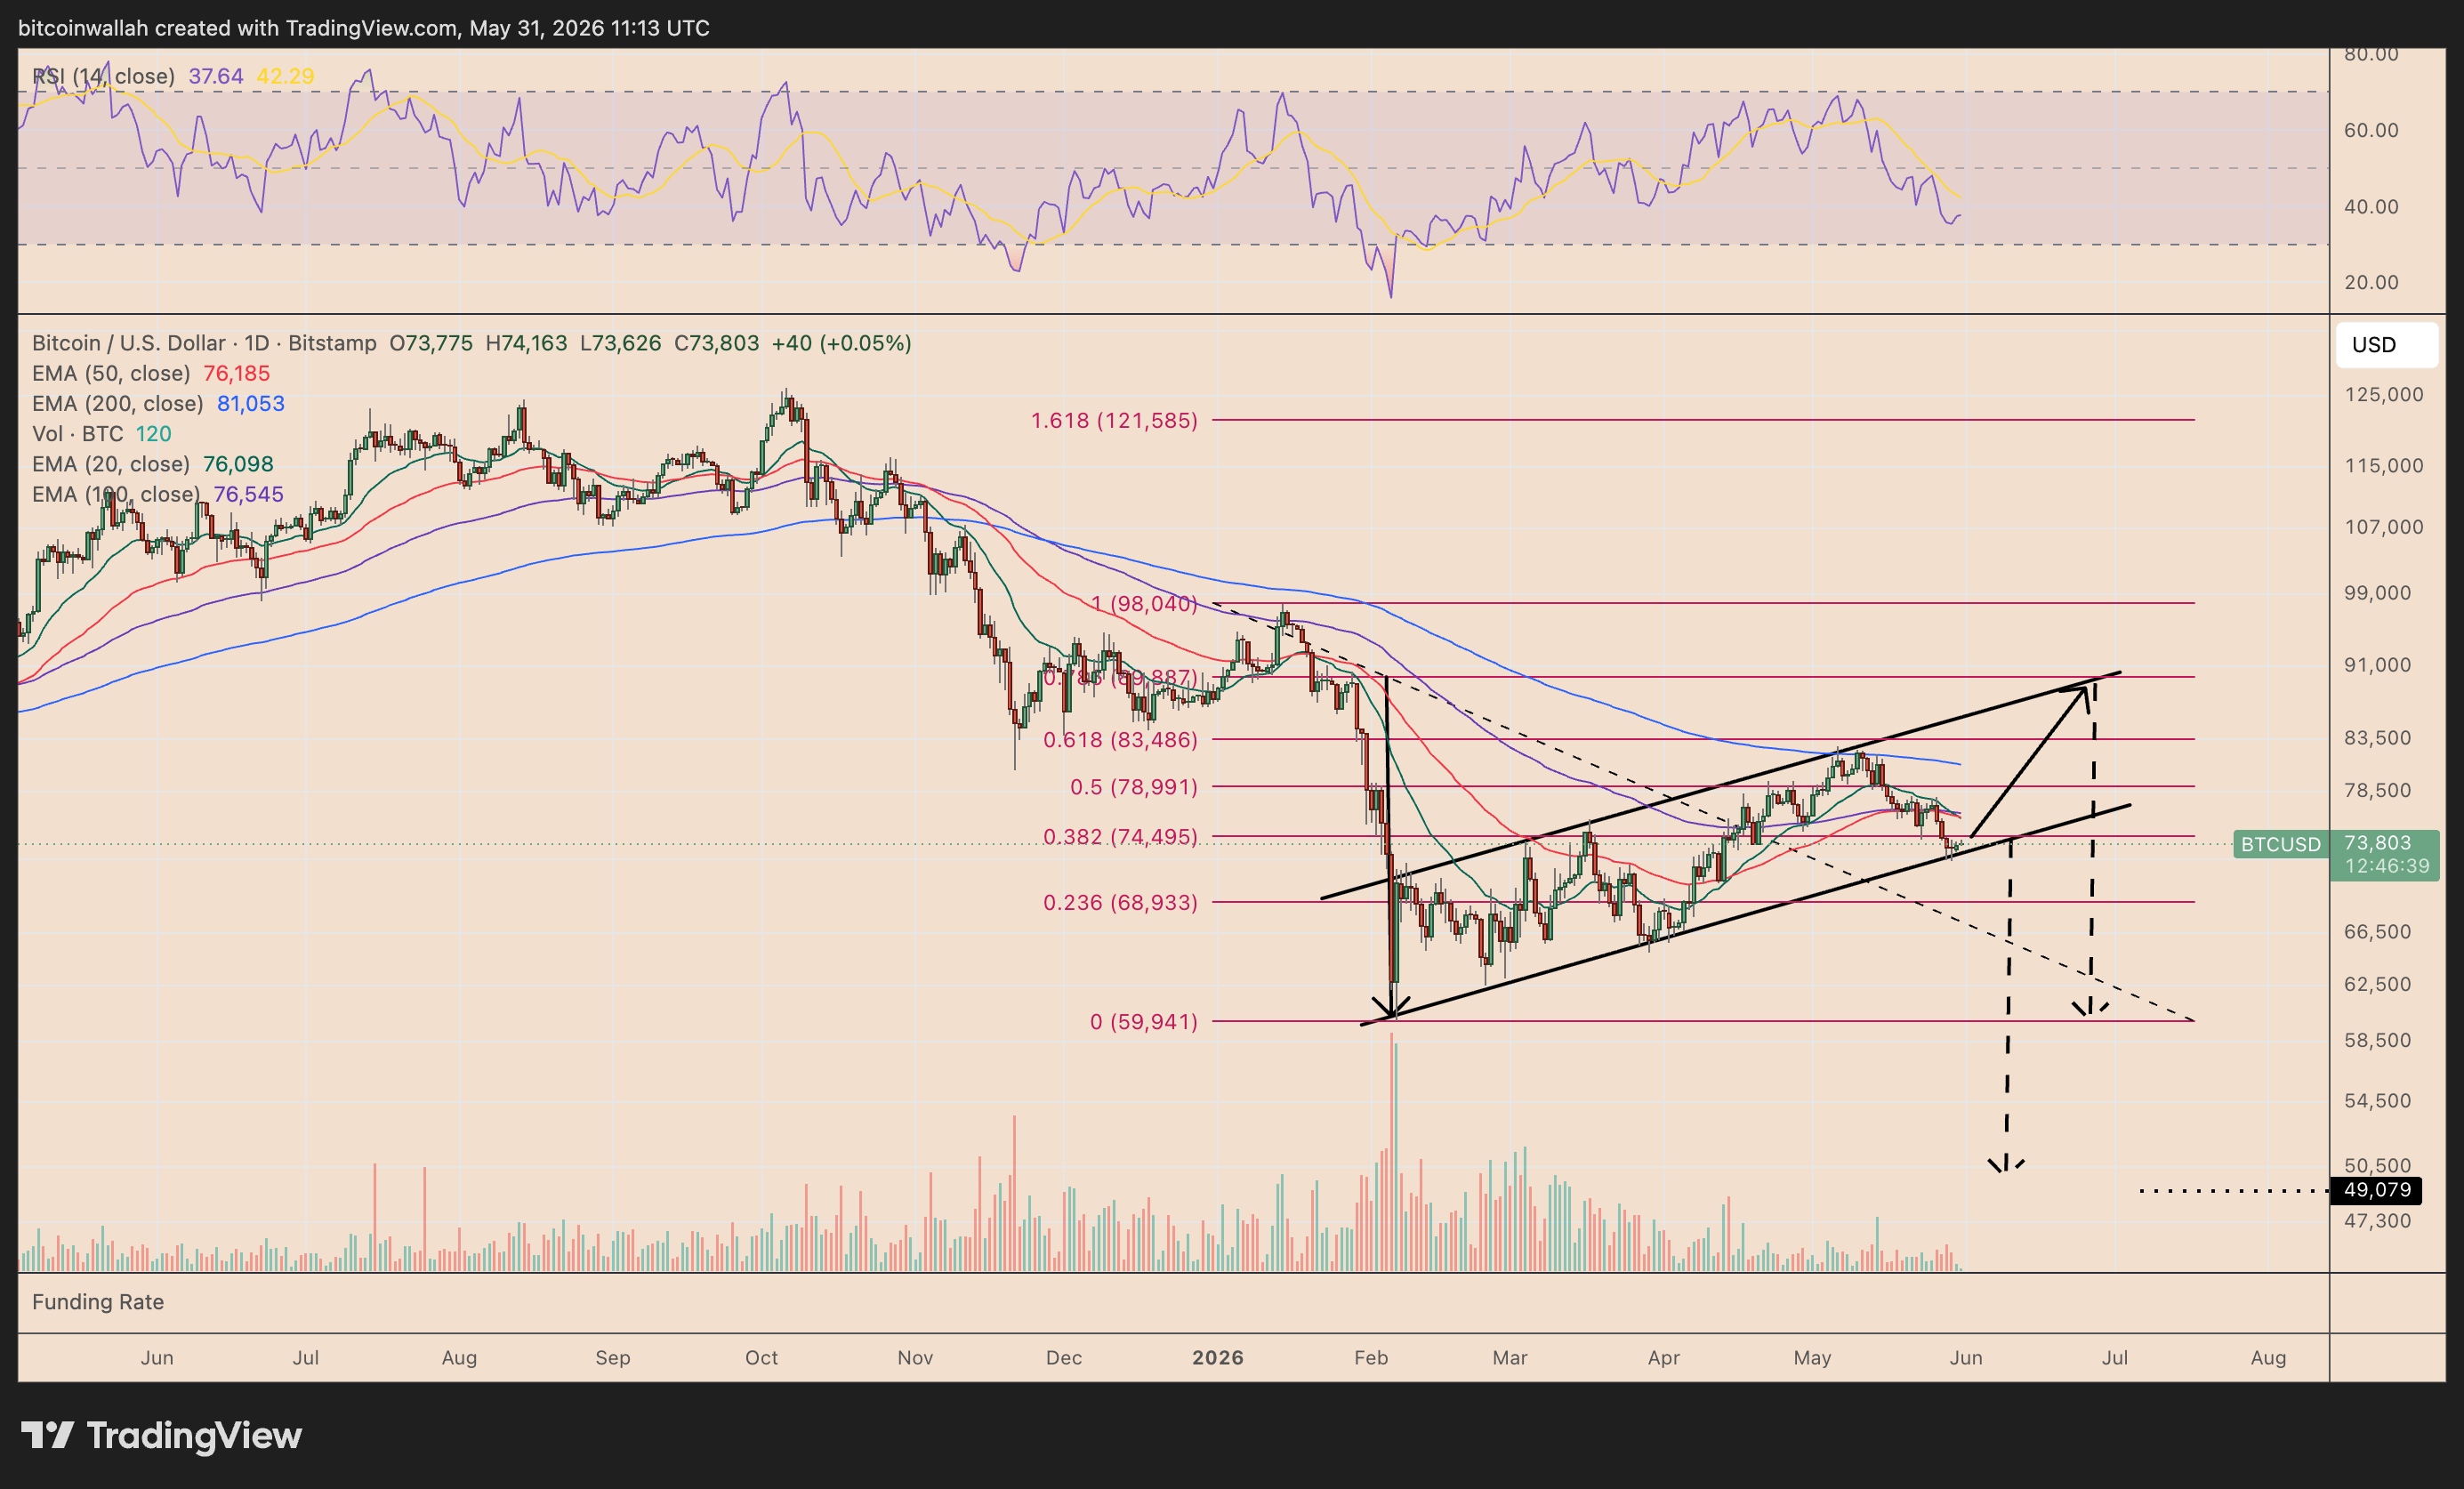
BTC/USD daily chart. Source: TradingView
A rebound from this area could push BTC toward the flag’s upper boundary near $90,000, a zone that also sits close to the 0.786 Fibonacci retracement level and the three-to-six-month holder cost basis.
That makes $90,000 the key upside target in the coming months if bulls can defend the current support area.
Conversely, a daily close below the lower trend line would risk confirming a breakdown, opening the door to a deeper decline toward the $50,000–$60,000 range, depending on the exact breakdown point.
In that scenario, the recent bounce from holder cost-basis support would look more like a relief move inside a broader downtrend than the start of a sustained recovery.
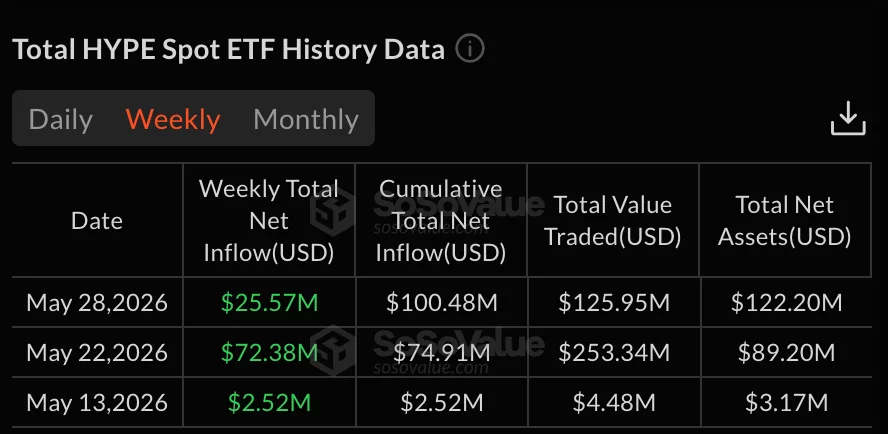
Hyperliquid’s HYPE token hit a new all-time high near $70 on May 31, extending one of the strongest large-cap crypto rallies of the month.
Summary
- HYPE hit $69.97 for the first time as monthly gains topped 67% in latest data.
- ETF products drew $100.48 million in May inflows, adding institutional demand to Hyperliquid’s rally now.
- MACD remains bullish, but traders are watching $62.50 support after the sharp breakout move.
HYPE reaches record high near $70
HYPE reached $69.97 for the first time in its history before easing slightly toward the $67 to $68 range. The token remained up more than 67% over the past month, while its seven-day gain stayed above 8%.
The latest price data showed HYPE holding the number 11 market rank, with a market capitalization above $15 billion. Its fully diluted valuation stood above $65 billion, based on a maximum supply of 1 billion tokens.
The 24-hour trading range stayed between $66.35 and $69.94, showing that HYPE remained close to record levels even after a small pullback. The token’s all-time low was $3.81 on Nov. 29, 2024.
The move also drew attention after social media accounts said HYPE had briefly overtaken BNB in 24-hour volume. However, available price data showed HYPE volume near $1.1 billion, while BNB volume was still listed above $3.5 billion during the same check.
ETF inflows add demand to the rally
ETF demand remains one of the main themes behind HYPE’s move. According to SoSoValue data, the latest HYPE spot ETF data showed three straight positive weekly inflows in May.
Inflows began at $2.52 million on May 13, rose to $72.38 million by May 22, then slowed to $25.57 million by May 28. That left cumulative net inflows at $100.48 million by the end of the month.
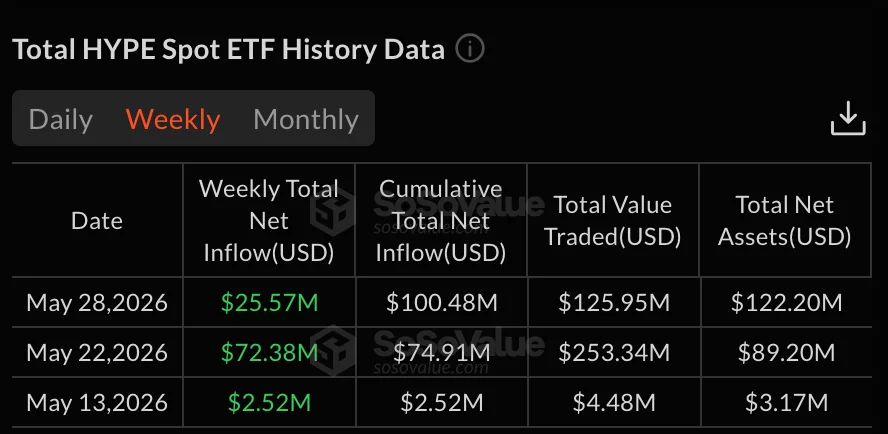
Total net assets also rose from $3.17 million on May 13 to $122.20 million by May 28. Total value traded reached $383.77 million across the month, with the strongest activity coming during the week ending May 22.
As previously reported, HYPE-linked ETF products crossed $100 million in cumulative inflows within their first 10 trading sessions. The demand was led by products tied to Hyperliquid’s native HYPE token.
Bitwise has also tied part of its ETF model to token demand. Earlier reports noted that Bitwise plans to use 10% of BHYP management fees to buy and hold HYPE on its balance sheet.
Buybacks remain central to Hyperliquid’s market story
Hyperliquid’s token model has also helped drive attention. The platform uses a large share of trading fees to buy back HYPE, linking token demand to exchange activity.
As crypto.news reported, Hyperliquid’s protocol revenue was running near $1.3 billion in annualized fees by mid-2026. The same report said buybacks are funded by trading fees from real platform activity, not by new token issuance or external capital.
Crypto commentators also pointed to this model after HYPE’s record move. That Martini Guy said HYPE had reached a record high of about $70 and claimed the platform generates up to $1 billion in annual fees with a small team.
Ash Crypto made a similar point, saying HYPE had added about $11 billion in market cap in 2026. He also linked the rally to fee buybacks, ETF inflows and new attention around regulated perpetual futures.
Those claims reflect market commentary and should be treated as views from traders, not official guidance. The verified data still shows that HYPE has seen sharp price growth, strong ETF inflows and rising attention from regulated investment products.
Technical indicators still favor bulls
The chart remains bullish despite the small red candle after the record high. HYPE recently broke above the $40 to $45 consolidation area and pushed into the $67 to $70 range.
The moving averages support the uptrend. The 9-day moving average sits near $62.52, while the 21-day moving average is near $53.51. The shorter average remains well above the longer one, showing that short-term momentum remains stronger.
As long as HYPE holds above the 9-day moving average, the breakout structure remains intact. A pullback toward $62.50 would mark the first key support area. A deeper drop could bring the $53.50 zone into focus.
The MACD also remains positive. The MACD line stands at 6.112, above the signal line at 4.890, while the histogram sits at 1.222. This shows that upward momentum is still active.
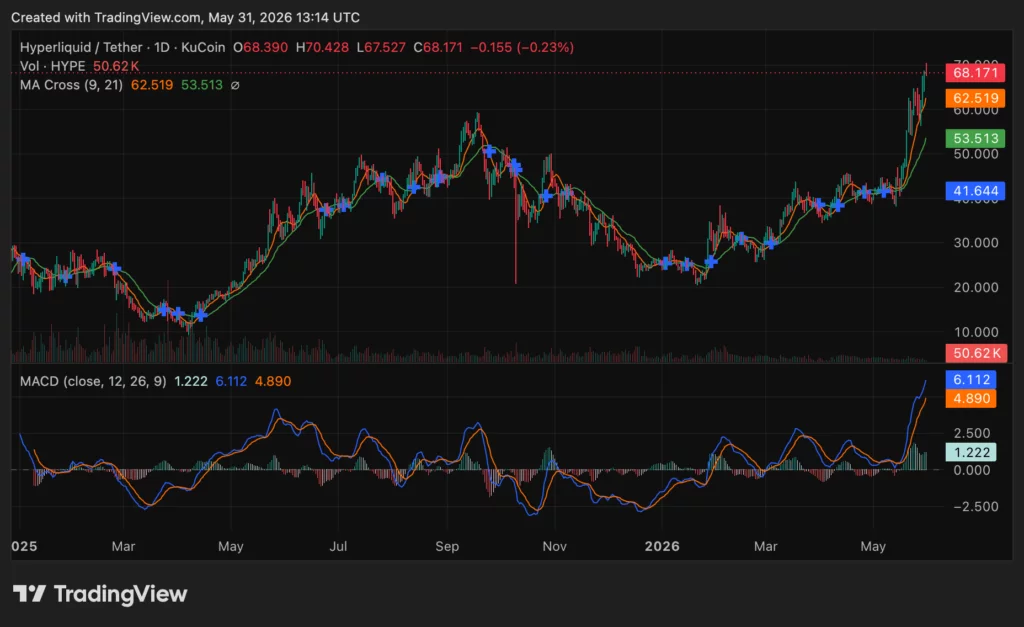
However, the move has been steep. Traders may watch for weaker histogram bars as an early sign that momentum is cooling. A short consolidation would not break the trend by itself, but a daily close below $62.50 would weaken the setup.
The next upside area sits near $80. Earlier reports already framed $80 as a possible target if ETF inflows, buybacks and trading activity keep supporting the token.
Disclosure: This article does not represent investment advice. The content and materials featured on this page are for educational purposes only.
Crypto World
Argentine Prosecutors Arrest 24, Seize Over $8M in USDT in 'Fake Coins' Crypto-Fraud Sweep


Argentina's Buenos Aires Public Prosecutor's Office said it arrested 24 people and seized more than 8 million USDT in a nationwide sweep it called "Fake Coins," one of the largest crypto-enforcement actions in the province's history. The 90 simultaneous raids, executed by the Argentine Federal… Read the full story at The Defiant
Crypto World
5 Must-Watch Stocks for the Coming Week: Nvidia (NVDA), Dell (DELL), CrowdStrike (CRWD), Rocket Lab (RKLB), and Palantir (PLTR)

Key Takeaways
- Nvidia (NVDA) continues dominating the AI semiconductor space with accelerating Blackwell chip demand
- Dell Technologies (DELL) posted exceptional results driven by massive AI server order volumes and upgraded forecasts
- CrowdStrike (CRWD) capitalizes on expanding market for AI-enhanced cybersecurity solutions
- Rocket Lab (RKLB) diversifies operations across launches, satellite production, defense contracts, and space systems
- Palantir (PLTR) gains traction with its AI Platform implementation, despite divided analyst sentiment on pricing
As markets prepare for the week ahead, these five equities are commanding the greatest investor focus, each backed by compelling catalysts and sector momentum.
Nvidia (NVDA)
Nvidia continues commanding attention as the dominant force in artificial intelligence semiconductor technology. The chipmaker has maintained impressive momentum as hyperscalers and corporate buyers demonstrate persistent appetite for AI computing capacity.
Market participants are particularly focused on the company’s Blackwell architecture, positioned to fuel the subsequent cycle of AI infrastructure investment. Analysts across Wall Street have consistently elevated their price projections, with widespread consensus that AI-related capital expenditure remains in nascent phases.
Boasting 51 buy recommendations from analysts, zero sell ratings, and sustained cloud infrastructure spending from major providers, Nvidia maintains its position atop investor radars entering the new trading week.
Dell Technologies (DELL)
Dell emerged as one of the market’s strongest performers following quarterly results that substantially exceeded Wall Street expectations. The technology infrastructure provider disclosed billions in fresh AI server bookings while elevating future outlook projections.
This announcement propelled shares significantly upward and validated perspectives that corporate AI hardware investment remains robust. Dell increasingly receives recognition as among the most direct AI infrastructure beneficiaries beyond Nvidia itself.
Analysts are monitoring Dell’s order pipeline with particular intensity. Sustained backlog strength would indicate AI hardware requirements will persist at elevated levels through multiple upcoming quarters.
CrowdStrike (CRWD)
CrowdStrike ranks among the cybersecurity sector’s premier equities currently. The platform provider has captured gains from escalating enterprise demand for artificial intelligence-integrated security capabilities as organizations confront increasingly sophisticated threat landscapes.
Investors await upcoming earnings releases and forward guidance updates, especially given cybersecurity’s position among the most rapidly expanding enterprise technology investment categories. CrowdStrike’s subscription-based revenue structure and robust profitability margins have established it as a growth investor preference.
The security software company commands 39 buy ratings from analysts alongside merely five hold recommendations, with zero sell designations.
Rocket Lab (RKLB)
Rocket Lab has attracted heightened investor scrutiny as operations extend beyond traditional launch services. The aerospace company currently maintains active engagement across satellite production, defense sector contracts, and broader space infrastructure initiatives.
The critical development under investor observation involves Neutron, a heavier-lift launch system potentially unlocking expanded commercial and governmental market opportunities. The wider aerospace sector has experienced recent turbulence stemming from apprehensions regarding schedule delays.
Rocket Lab holds eight buy ratings against four hold designations. Numerous investors regard the company among the more compelling long-term commercial space enterprises given its varied revenue streams.
Palantir (PLTR)
Palantir has emerged as a leading AI software equity throughout the previous twelve months. The company’s Artificial Intelligence Platform, designated AIP, has achieved adoption among government agencies and commercial enterprises seeking to embed AI capabilities into operational workflows.
Investors increasingly categorize Palantir as a significant enterprise AI software provider beyond its traditional defense industry positioning. The equity has generated substantial returns, though analyst perspectives remain fragmented.
Eleven analysts maintain buy ratings, while four have designated sell recommendations. This division mirrors continuing discourse regarding whether current valuation levels adequately incorporate projected expansion trajectories.
TLDR:
- Phantom generated $20.6M in cumulative revenue, capturing 31.8% of total top-10 builder earnings.
- Based processed more volume than Phantom at $44B but earned less due to its lower 0.025% fee rate.
- MetaMask ranked fourth despite charging 0.1%, the highest builder fee among all top 10 builders.
- Mass averaged $1,337 revenue per user, the highest among all top 10 Hyperliquid builders tracked.
Phantom has emerged as the leading builder on Hyperliquid’s builder program, earning over $20.6 million in cumulative revenue.
CoinGecko data shows the wallet accounts for 31.8% of total revenue among the top 10 builders. Based ranked second with $15.1 million, while MetaMask placed fourth despite charging the highest builder fee of 0.1%.
Together, these platforms reflect how distribution channels are reshaping decentralized derivatives trading.
Phantom and Based Dominate the Builder Leaderboard
Phantom’s $20,630,022 in cumulative revenue places it well ahead of its nearest competitor. The wallet processed $39.4 billion in total volume and served 137,496 users since joining the program.
Its 0.05% builder fee generated an average of $150 in revenue per user. That user base is more than three times larger than Based’s 42,579 users.
Based ranked second with $15,056,894 in total revenue despite handling more volume than Phantom. It processed $44 billion compared to Phantom’s $39.4 billion across the same period.
However, Based charges only 0.025%, which is half of Phantom’s fee rate. That lower rate explains the revenue gap despite the higher volume.
Together, Phantom and Based account for 54.8% of all top-10 builder revenue combined. PVP ranked third with $7,946,185, having operated since June 2024.
Its early entry into the program gave it a cumulative advantage over newer participants. PVP’s 676 days of activity is the longest among the top 10 builders.
MetaMask ranked fourth with $6,510,547 in revenue from 43,761 users. It charges 0.1%, which is the highest builder fee in the top 10.
Despite this, users continued trading through the familiar MetaMask interface. The platform processed $7.46 billion in total volume during the tracked period.
Fee Strategy Separates High-Value Builders From High-Volume Ones
Insilico ranked fifth with $3,306,853 in revenue from only 2,962 users. Its average revenue per user reached $1,116, more than double the top 10 average of $437.
The platform charges just 0.01% but attracts algorithmic and high-frequency traders. Those traders move significantly larger positions per account than retail participants.
Axiom ranked seventh and processed $22.1 billion in volume, one of the highest in the group. Yet it earned only $2,270,689 due to its 0.01% builder fee.
Its average revenue per user stood at just $68. The low fee attracted volume but compressed overall earnings considerably.
Mass ranked tenth with $1,381,482 in revenue from 1,033 users. Its average of $1,337 per user is the highest among all top 10 builders.
The platform charges a 0.055% fee and serves a small but high-value audience. Dreamcash, ranked ninth, generated $1,695,465 despite charging a 0% builder fee.
Crypto World
Trace Mayer says bitcoin’s (BTC) falling volatility signals institutional maturity, not weakness


Bitcoin’s trademark volatility was for years treated as both its greatest feature and its biggest flaw. Recently, that roller coaster has quieted into something resembling a smooth ride, with volatility collapsing to roughly 35 from a high of 120 in 2021. While critics view this dampening as a sign that the asset is losing its edge, longtime bitcoin investor and Mayer Multiple creator Trace Mayer argues they are drawing entirely the wrong conclusion.
Mayer suggested that bitcoin’s declining volatility isn’t a sign of weakness, but rather a direct reflection of its growing economic substance in an interview with CoinDesk.
“Gary Gensler said he was going to ‘tame bitcoin,’” Mayer said, pointing to regulatory efforts to corral the digital asset. “And we’ve seen the volatility come down.”
Rather than viewing this “taming” as a defeat, Mayer sees it as confirmation of bitcoin’s massive institutional adoption. The market has simply become too big to move as erratically as it once did. “The barbell is getting heavier,” Mayer noted, using a vivid analogy for the market’s liquidity. “It’s not a 50-pound weight anymore. It’s a 2,500-pound weight.”
This heavy structural shift is being driven by the sophisticated mechanics of the options market, specifically call-selling, according to Mayer. As institutions and digital asset companies increasingly sell covered calls against their bitcoin holdings to generate upfront premium income, they inadvertently create a dampening effect on price swings.
Because these entities essentially agree to sell their bitcoin at a predetermined price in the future, market makers on the other side of those trades are forced to actively hedge their positions. When the price of bitcoin ticks upward, these market makers sell the asset to balance their risk, effectively creating a natural, structural ceiling on price spikes. The result is a more mature, predictable asset—one that is growing up right in front of the market’s eyes.
“When you’re able to come in and sell call volatility into the market, the market makers are going to have to do negative delta,” Mayer said. “That negative call wall is like adding weight on the barbell. The price doesn’t necessarily go up, but the total economic substance of that asset has increased.”
The Mayer Multiple
Mayer created the Mayer Multiple ratio eight years ago that divides bitcoin’s current price by its 200-day moving average, a long-term trend line that smooths out short-term noise. A reading above 1 means bitcoin is trading above its long-term average, below 1 means it’s trading beneath it. Historically, readings above 2.4 have coincided with market tops, while readings below 0.8 have signalled attractive entry points.
Bitcoin is currently just below its long-term trend at 0.94. Mayer notes that crucially the standard deviation bands the statistical range within which price typically moves have compressed significantly as more trading history accumulates.
On a five-year lookback, one standard deviation above the mean sits around 1.3, two standard deviations at 1.6, and three at 2.13. Compare that to earlier periods drawing on data back to 2011, where price regularly reached far more extreme multiples.
In other words, the instrument is maturing in the same way any asset does as it attracts deeper, more disciplined capital.
Mayer started selling physically-settled bitcoin call and put options as far back as 2017 on LedgerX, one of the first federally regulated crypto derivatives exchanges.
Today that market has expanded dramatically from leveraged ETFs like BITX, to Strategy’s (MSTR) equity, to bitcoin appearing on corporate balance sheets like SpaceX’s reported 18,712 BTC holding.
Mayer argues lower volatility is positive for bitcoin because it reflects the asset graduating from a speculative instrument into something that investment committees, family offices, and corporations can actually underwrite. “In order to get that buy-in, you kind of have to have something that’s really boring, like gold,” he said. “Gold is so boring — and that’s what we need.”
He pointed to attendance at conferences as a tangible signal of that maturation. His blog was running in 2008 before Bitcoin existed, and he regularly presented at major gold conferences that drew 2,000-3,000 attendees. “We had tens of thousands at conferences this year and much more last year. It’s a real industry. It’s a real reserve asset.”
Mayer acknowledges risks to bitcoin, such as weakening network security should BTC’s price not appreciate enough to keep enough miners in business. Quantum is another potential longer-term threat, should quantum computers become sufficiently powerful to crack Bitcoin’s cryptographic keys. Mayer acknowledged the concern but noted that Bitcoin’s standing bounty for finding a catastrophic exploit has so far gone unclaimed, and pointed to the backwards compatibility of proof-of-work as a structural resilience.
Despite the risks, Mayer remains firmly in the bitcoin-over-gold camp for the next 15 years. “With gold, higher prices bring more supply. That’s not the case with Bitcoin and we don’t know what technologies might pose a threat to gold’s dominance. We could have asteroid mining. AI robots scouring the oceans. But we know Bitcoin is going to be 21 million.”
XRP Ledger Activity Soars in Q1 Despite XRP Price Slump: Messari

IPL Final toss verdict: Does choosing to bowl first really work? What history says after RCB’s big call | Cricket News

How to watch Ruud vs Fonseca: Free Streams for French Open 2026 fourth round


-

 Business7 days ago
NYT Strands Answers May 24 2026 Revealed for Puzzle No. 812 Theme Summer Essentials
-

 NewsBeat4 days ago
Israel says it has killed new Hamas military leader in Gaza City airstrikes
-

 Tech4 days ago
NASA taps Blue Origin to deliver lunar rovers for Moon Base initiative
-

 Politics6 days ago
Bridgerton Season 5: Cast, Release Date And Everything We Know So Far
-

 News Videos4 days ago
XRP *JUST* SUCCEEDED!!!! CLARITY ACT EXPOSED!!! (SHE EXPOSED IT)
-

 Sports5 days ago
2026 NBA Finals schedule, odds: Knicks await Thunder or Spurs after winning East
-
Crypto World5 days ago
Micron Crosses $1 Trillion Market Cap as AI Demand Reshapes Memory Sector
-

 Business5 days ago
Selena Gomez Reportedly Upset Over Benny Blanco’s Comments on Her ‘Terrible’ Diet
-
Crypto World7 days ago
Brian Armstrong Outlines Crypto Vision for the Future Financial System
-

 News Videos2 days ago
This is BROKEN! INSANE 5x MONEY CAR WASH WEEK! The NEW GTA Online UPDATE Today! (GTA5 New Update)
-

 Business6 days ago
BTS Sells Out Four Las Vegas Shows at Allegiant Stadium for ARIRANG World Tour
-
 Tech5 days ago
China assigns ID codes to 28,000+ humanoid robots
-
 NewsBeat6 days ago
Hottest May day ever as London hits 34.8C in 2C leap from previous records
-

 Tech6 days ago
Microsoft’s quiet Claude Code retreat and the real cost of enterprise AI
-

 Tech2 days ago
Waymo dominates autonomous vehicle registrations as Tesla trails behind
-

 Business6 days ago
Nikkei 225 Surges Past 65,000 for First Time as Iran Peace Hopes Fuel Record Rally
-
Tech4 days ago
The Samsung pay deal is the moment Korean unions changed register
-

 Tech6 days ago
Westone Audio and Etymotic Acquired by Fidelity Collective in Major IEM Market Move
-
 Entertainment6 days ago
‘Breaking Bad’ Star’s Easy-to-Binge 6-Part Crime Series Spin-Off Is Finally Heading to Free Streaming
-

 NewsBeat6 days ago
Crowds find riverside shade in York as temperatures soar
You must be logged in to post a comment Login