
Crypto World
Bitcoin slides toward $70,000 as on-chain data flags bear market and traders bet Fed holds in April: Asia Morning Briefing
Good Morning, Asia. Here’s what’s making news in the markets:
Welcome to Asia Morning Briefing, a daily summary of top stories during U.S. hours and an overview of market moves and analysis. For a detailed overview of U.S. markets, see CoinDesk’s Crypto Daybook Americas.
Bitcoin is entering the Asian trading day with on-chain data flashing full bear-market signals, as prices hover in the mid-$70,000s and global equity markets continue to search for direction.
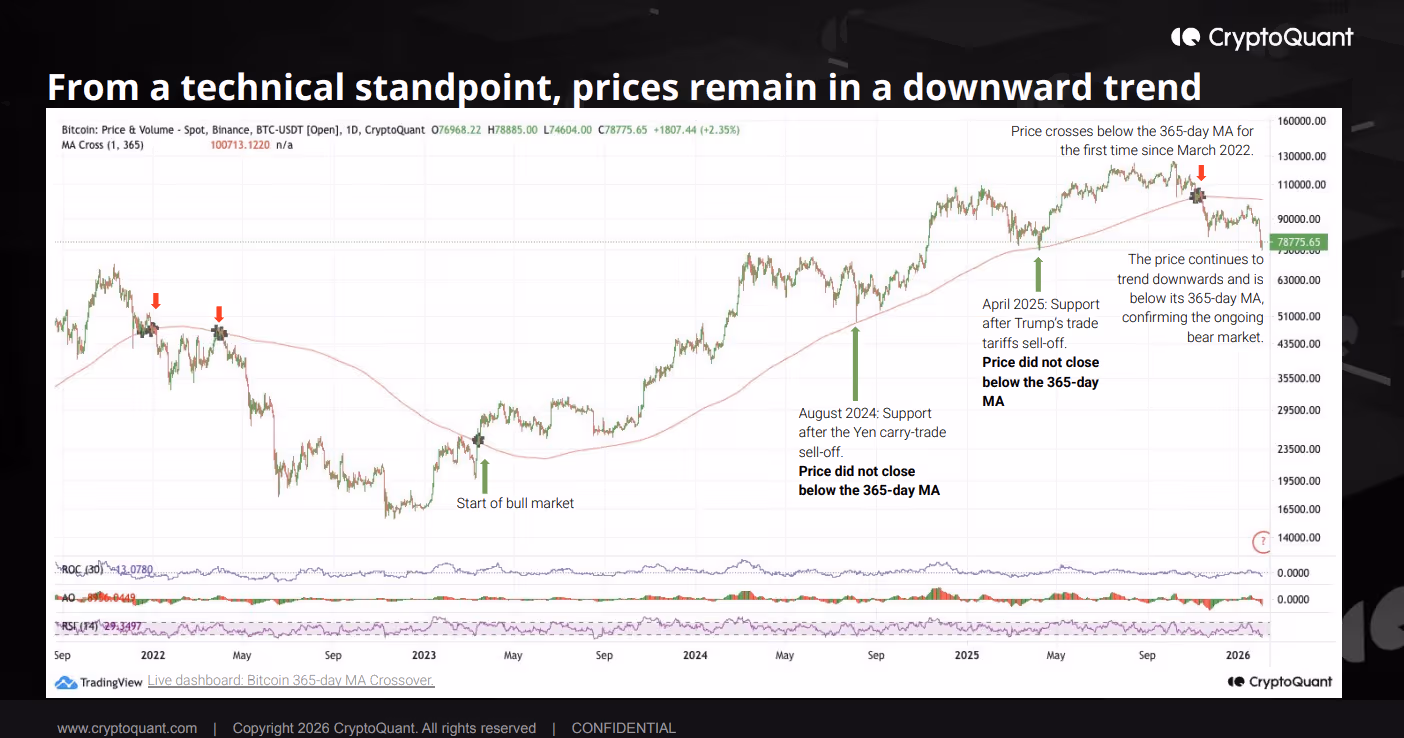
CryptoQuant’s latest weekly report frames the weakness as structural rather than cyclical, with its Bull Score Index sitting at zero while bitcoin trades far below its October peak. The report argues the market is no longer digesting gains but operating with a thinner buyer base and tightening liquidity.


Glassnode data reinforces that picture, pointing to weak spot volumes and a demand vacuum where selling pressure is not being met with sustained absorption. In effect, the issue is less panic than participation.
Institutional flows underline the shift. U.S. spot bitcoin ETFs, which were net accumulators at this time last year, have flipped into net sellers, creating a year over year demand gap measured in tens of thousands of bitcoin.
At the same time, the Coinbase premium has remained negative since October, signaling that U.S. investors are not meaningfully stepping in despite lower prices. Historically, sustained bull phases have coincided with strong U.S. spot demand. That engine is currently idling.
Liquidity conditions are also tightening beneath the surface. Stablecoin expansion, which typically fuels risk appetite and trading activity, has stalled, with USDT market cap growth turning negative for the first time since 2023.

Longer-term apparent demand growth has likewise collapsed from last year’s highs, suggesting this is not merely leverage being flushed but participation itself fading. Technically, bitcoin remains below its 365-day moving average, with on-chain valuation bands clustering major support in the $70,000 to $60,000 corridor.
Overlaying this is a macro backdrop where bitcoin is increasingly behaving like high-beta software rather than digital gold. Prediction markets show traders still leaning heavily toward no change at the Federal Reserve’s April meeting, with only modest expectations for a June rate cut. That hesitancy limits the prospect of near term liquidity relief.
The policy narrative is further complicated by politics. President Donald Trump recently spoke to the press about his Fed nominee Kevin Warsh and said during an interview with NBC News a Fed chair who wanted to raise rates “would not have gotten the job,” a remark that tempers earlier optimism about central bank independence.
For Asia, the result is a market defined less by shock than by absence, where bounces remain possible, but conviction remains thin.
Market Movement
BTC: Bitcoin drifted lower into the mid $70,000s after briefly testing support, with rebounds fading quickly as spot demand remained thin and tech stocks stayed under pressure.
ETH: Ether hovered just above the low $2,000s, struggling to build momentum as broader risk sentiment softened and flows remained muted across major exchanges.
Gold: Gold rebounded toward the $5,000 to $5,100 range, extending a volatile recovery driven by safe-haven buying after U.S.–Iran tensions flared and softer private payroll data offset mixed economic signals while traders reassessed the Fed outlook under Trump’s new chair pick.
Nikkei 225: Japan’s Nikkei 225 edged lower by roughly 0.3% as chip and tech heavyweights tracked Wall Street’s sell-off, though broader Japanese equities remained relatively resilient compared with regional peers.
Elsewhere in Crypto:


XRP spot ETFs recorded $17.11 million in net inflows on April 15, their largest single-day intake in nearly 11 weeks, as four consecutive days of positive flows pushed combined assets under management above $1.25 billion.
Summary
- XRP spot ETFs drew $17.11 million on April 15, the strongest single-day inflow since February 3, 2026, bringing a four-day total to $38.86 million.
- Combined US-listed XRP ETF assets under management crossed $1.25 billion as the token rallied 6% to $1.42 on Thursday, reclaiming fourth place by market cap.
- Analysts say the CLARITY Act roundtable and Ripple’s new tokenized bond pilot with Kyobo Life are adding regulatory and utility tailwinds behind the inflow surge.
XRP (XRP) spot ETFs logged their largest single-day inflow in nearly 11 weeks on April 15, with $17.11 million flowing into US-listed products, per SoSoValue data. The figure marks the strongest daily intake since February 3, 2026, and extends an inflow streak to four consecutive sessions for the first time since March.
Over those four days, US-listed XRP ETFs drew a combined $38.86 million, pushing total net assets to over $1.25 billion. XRP itself rose 6% to $1.42 on Thursday, outperforming every other token in the top 10 by market cap.
The timing aligns with a broader improvement in crypto market sentiment driven by US-Iran ceasefire diplomacy and easing macro risk. XRP specifically has been benefiting from additional catalysts beyond the macro backdrop.
The SEC’s CLARITY Act roundtable, which kicked off in Washington today, is being closely watched by the XRP community as it could clarify the regulatory treatment of digital assets used in payments, an area where XRP has direct exposure. The prospect of legislative progress has brought institutional buyers back to the ETF market.
Ripple’s announcement on April 14 of a tokenized government bond pilot with South Korea’s Kyobo Life Insurance also reinforced XRP’s real-world settlement utility, adding a fundamental narrative alongside the technical inflow momentum. XRP ETFs posted a record $119.6 million across global products the week ending April 11, driven largely by European buyers, before Wednesday’s US-led single-day surge reset the domestic record.
What Analysts Are Watching
XRP remains roughly 23% below its January 2026 high despite Thursday’s rally. Analysts say the $1.60 level, which aligned with XRP’s March 17 high, is the first meaningful resistance test. A sustained hold above $1.40 is needed to avoid a false breakout reading on the chart.
The four-day inflow streak is constructive because XRP’s exchange supply has dropped to multi-year lows, meaning ETF accumulation is absorbing tokens from an already thin exchange order book. When ETF demand meets low exchange supply, price elasticity tends to increase on the upside.
XRP price has rallied 6% to $1.42 with its market cap moving back above $87 billion, with further upside contingent on clarity from today’s SEC roundtable and continued ceasefire progress reducing the macro headwinds that have kept risk assets pressured since February.

Blockstream CEO Adam Back said Thursday that a future post-quantum migration of Bitcoin could help clarify how many coins linked to Satoshi Nakamoto remain accessible, because any owner wanting to protect vulnerable holdings would need to move them to a new address format.
Speaking at Paris Blockchain Week, Back said such a migration would likely give users ample time to move funds and argued that coins left unmoved after that process could reasonably be treated as lost.
“This migration to post-quantum address format may tell us how many of those coins [Satoshi] still has,” said Back, adding that the pseudonymous creator has an estimated 500,000 to 1 million Bitcoin (BTC).
Satoshi’s Bitcoin stash has ignited heated debate among Bitcoin holders concerned by the quantum computing threat. On Wednesday, Jameson Lopp and five co-authors published a Bitcoin Improvement Proposal aimed at restricting the future movement of coins held in quantum-vulnerable address formats, including older coins whose public keys have already been exposed.

Blockchain data platform Arkham estimates that Nakamoto-linked wallets hold 1.09 million Bitcoin, currently valued at $81.6 billion.
Related: Bernstein says Bitcoin market already priced in quantum risk
Back sees long runway on quantum
Back said Bitcoin developers and holders still have substantial time to prepare, arguing that a quantum breakthrough capable of threatening Bitcoin signatures is at least 20 years away.
He argued that today’s quantum computers are “less powerful than a $5 calculator” and that some of their issues become more pressing as these systems scale, such as their energy consumption.
Back said that runway should give developers and users ample time to develop a post-quantum path and migrate to a new quantum-resistant standard underpinned by hash-based signatures.

In December 2025, Back’s Blockstream Research released a paper proposing a hash-based signature scheme that offers a “promising path for securing Bitcoin in a post-quantum world,” as a quantum-safe replacement for the ECDSA and Schnorr signatures. Under the proposal, security would rely solely on hash function assumptions, similar to the ones currently used in Bitcoin’s network design.
The Elliptic Curve Digital Signature Algorithm (ECDSA) uses elliptic-curve cryptography to verify the authenticity and integrity of a message. Schnorr signatures are another signature scheme praised for enhancing privacy and reducing data size, due to their ability to combine multiple signatures into one.
Magazine: Bitcoin vs. the quantum computer threat — Timeline and solutions (2025–2035)
Circle Internet Group faces a class-action in a Massachusetts federal court over claims it failed to intervene as attackers siphoned funds during the Drift Protocol exploit. The lawsuit, filed by Drift investor Joshua McCollum on behalf of more than 100 claimants, contends Circle’s Cross-Chain Transfer Protocol (CCTP) allowed approximately $230 million worth of USDC to be moved from Solana to Ethereum over several hours on April 1 without timely action.
The plaintiffs allege that Circle’s inaction caused or substantially contributed to the losses and seek damages to be determined at trial. The case underscores ongoing questions about whether crypto firms that maintain control over user funds can or should intervene in real time to curb theft or misuse, and how that potential responsibility should be calibrated against regulatory constraints and legal authority.
Key takeaways
- The lawsuit alleges Circle had the technical capacity to freeze compromised funds, pointing to a prior action where Circle froze 16 USDC wallets in connection with a sealed civil case.
- The Drift attack leveraged Circle’s cross-chain facilities to move roughly $230 million in USDC from Solana to Ethereum over several hours, with the suit asserting Circle did not act to halt the transfers.
- Analysts at Elliptic have linked the exploit to DPRK-state–backed actors, noting the movement of funds through the network during U.S. business hours and subsequent attempts to obfuscate the trail via privacy tools.
- Circumstances surrounding the incident have reignited debate about the liability of DeFi and infrastructure providers when user funds are stolen, including arguments that freezing assets without a court order may create perverse incentives or political considerations for future action.
- Circle did not immediately respond to requests for comment, while industry observers and investors weigh the legal and policy implications for future risk management and user protection.
What the suit alleges and why it matters
The court filing, lodged in a Massachusetts district court, asserts that Circle “permitted this criminal use of its technology and services” and that timely intervention could have substantially reduced, if not prevented, the losses. The action frames Circle as potentially aiding and abetting conversion and as negligent in supervising the use of its own cross-chain tooling. The allegations hinge on the argument that Circle had, or should have had, the ability to freeze funds or intervene in the flows that enabled the theft, even if regulators and legal authorities did not immediately grant a freezing order.
As part of the filing, McCollum’s legal team notes that Circle froze 16 USDC wallets in connection with a separate sealed civil matter about a week before the Drift incident—an occurrence they say demonstrates Circle’s capacity to intervene in real time when needed. The docket referenced in the court filing is publicly accessible, and the plaintiffs point to that prior action as evidence of proportional capacity to halt similar transfers.
The broader question the case raises is whether firms that sit at the center of crypto rails bear a responsibility to act when wrongdoing is detected or suspected. In many cases, executives acknowledge practical constraints, including the lack of explicit legal authorization during fast-moving exploits. The Massachusetts suit seeks to compel accountability and damages, but it also spotlights a broader, unresolved tension between rule-of-law principles and the operational realities of decentralized finance ecosystems.
The Drift exploit, the mechanics, and the alleged response gap
The Drift Protocol incident involved a sequence of transfers that moved a large tranche of USDC across networks via Circle’s CCTP. The complaint alleges that attackers succeeded in moving about $230 million worth of USDC from Solana to Ethereum without timely intervention from Circle, enabling proceeds to be wired into a different chain against the users’ interests.
According to the plaintiffs, Circle’s tools were capable of halting or reversing suspicious activity, and the failure to intervene allowed the attackers to drain liquidity from one ecosystem into another. The suit frames Circle’s inaction as a failure to protect user funds, arguing that the consequences extended beyond the individuals directly affected to the broader ecosystem—potentially dampening confidence in cross-chain tooling and in platforms that retain de facto control over user tokens during such crises.
Commentary from the plaintiffs’ counsel emphasizes that the losses might have been less severe had Circle exercised timely control, raising questions about the threshold of permissible intervention for centralized crypto services in edge cases of theft or misappropriation. Circle’s response to the suit has not yet materialized in public commentary, and the company did not immediately respond to Cointelegraph’s request for comment.
Tracing the funds: laundering routes and attribution
Elliptic researchers have flagged the Drift exploitation as being consistent with DPRK-linked activity. In a post-creach analysis, the firm noted that more than a hundred transactions related to the assault occurred during U.S. working hours, a detail seen as relevant to attribution efforts and to understanding the operational tempo of the attackers. Elliptic’s assessment also describes how the proceeds were converted into Ether (ETH) and routed through privacy-oriented channels, including the Tornado Cash protocol, in an attempt to obfuscate the trail.
While attribution in crypto forensics remains complex and often contested, the Elliptic findings contribute to a broader narrative about the transnational and cross-chain nature of such exploits. The Drift incident has become part of a larger discourse on how sanctions-enforcement and tracing capabilities intersect with the practical realities of on-chain finance, and how firms that provide bridging and custody solutions fit into that equation.
“Whether Circle got it right comes down to how much you weigh rule-of-law principles vs concrete harm. Reasonable people disagree.”
Industry observers note that the Drift case sits at a crossroad: it tests the boundaries of what action is considered appropriate when funds are believed to have been stolen, and what legal authorities would be required to justify a freeze or rollback in a permissionless network context. The case also intersects with ongoing debates about the liability for DeFi developers and infrastructure providers when episodes of misuse occur on the rails they maintain.
Liability, intervention, and the investment view
In the wake of the lawsuit, the debate over liability intensified among investors and researchers. Lorenzo Valente, the director of research for digital assets at ARK Invest, argued that Circle’s decision to abstain from freezing funds in the absence of a legal order represents a defensible stance in strict adherence to rule-of-law principles. He contended that freezing assets without a court directive could invite arbitrary discretion and undermine established legal standards, framing the case as part of a bigger constitutional risk debate for crypto rails that operate across borders and jurisdictions.
Valente’s position reflects a broader sentiment in some investor and academic circles: that the legal architecture surrounding crypto infrastructure is still catching up to the pace and sophistication of on-chain activity. The case also underscores a key strategic tradeoff for users and builders: the tension between technical capability to intervene and the legitimate need for careful, legally grounded action that does not set dangerous precedents for arbitrary asset freezes.
As the legal process unfolds, observers will watch for how the court interprets the responsibilities of crypto infrastructure providers and whether any settlement or court ruling could redefine the standard for future incidents. The Drift lawsuit is not the only lens on this issue, but it is among the most high-profile, given the scale of funds involved and Circle’s central role in bridging assets across chains.
What readers should watch next
The case is still early in its trajectory, and the court has yet to determine the appropriate remedies or establish a clear framework for liability in similar contexts. Key questions to watch include whether a court will require or authorize asset freezes in future incidents, how damages will be calculated, and what this could mean for cross-chain infrastructure providers and custody services.
Regulators and lawmakers, too, will likely scrutinize the evolving balance between proactive risk management and the prescriptive limits of authority over private-led, permissionless networks. For investors and users, the underlying takeaway is that accountability mechanisms for crypto rails are still taking shape—and how those mechanisms emerge could influence risk models, product design, and regulatory engagement in coming quarters.
As Circle and the Drift investors navigate these questions, market participants will be watching for any legal milestones, potential settlements, or policy clarifications that could tilt how similar incidents are managed in the future. The evolution of this case could help define whether asset freezes become a common tool in crisis management or remain extraordinary measures bound by formal due process.
Bitcoin (BTC) struggles to reclaim price highs above $76,000, but analysts say that the uptrend may continue if key conditions are met.
Bitcoin’s 8% climb over the last three days saw it reclaim key levels, including the 50-day exponential moving average (EMA) at $71,000.
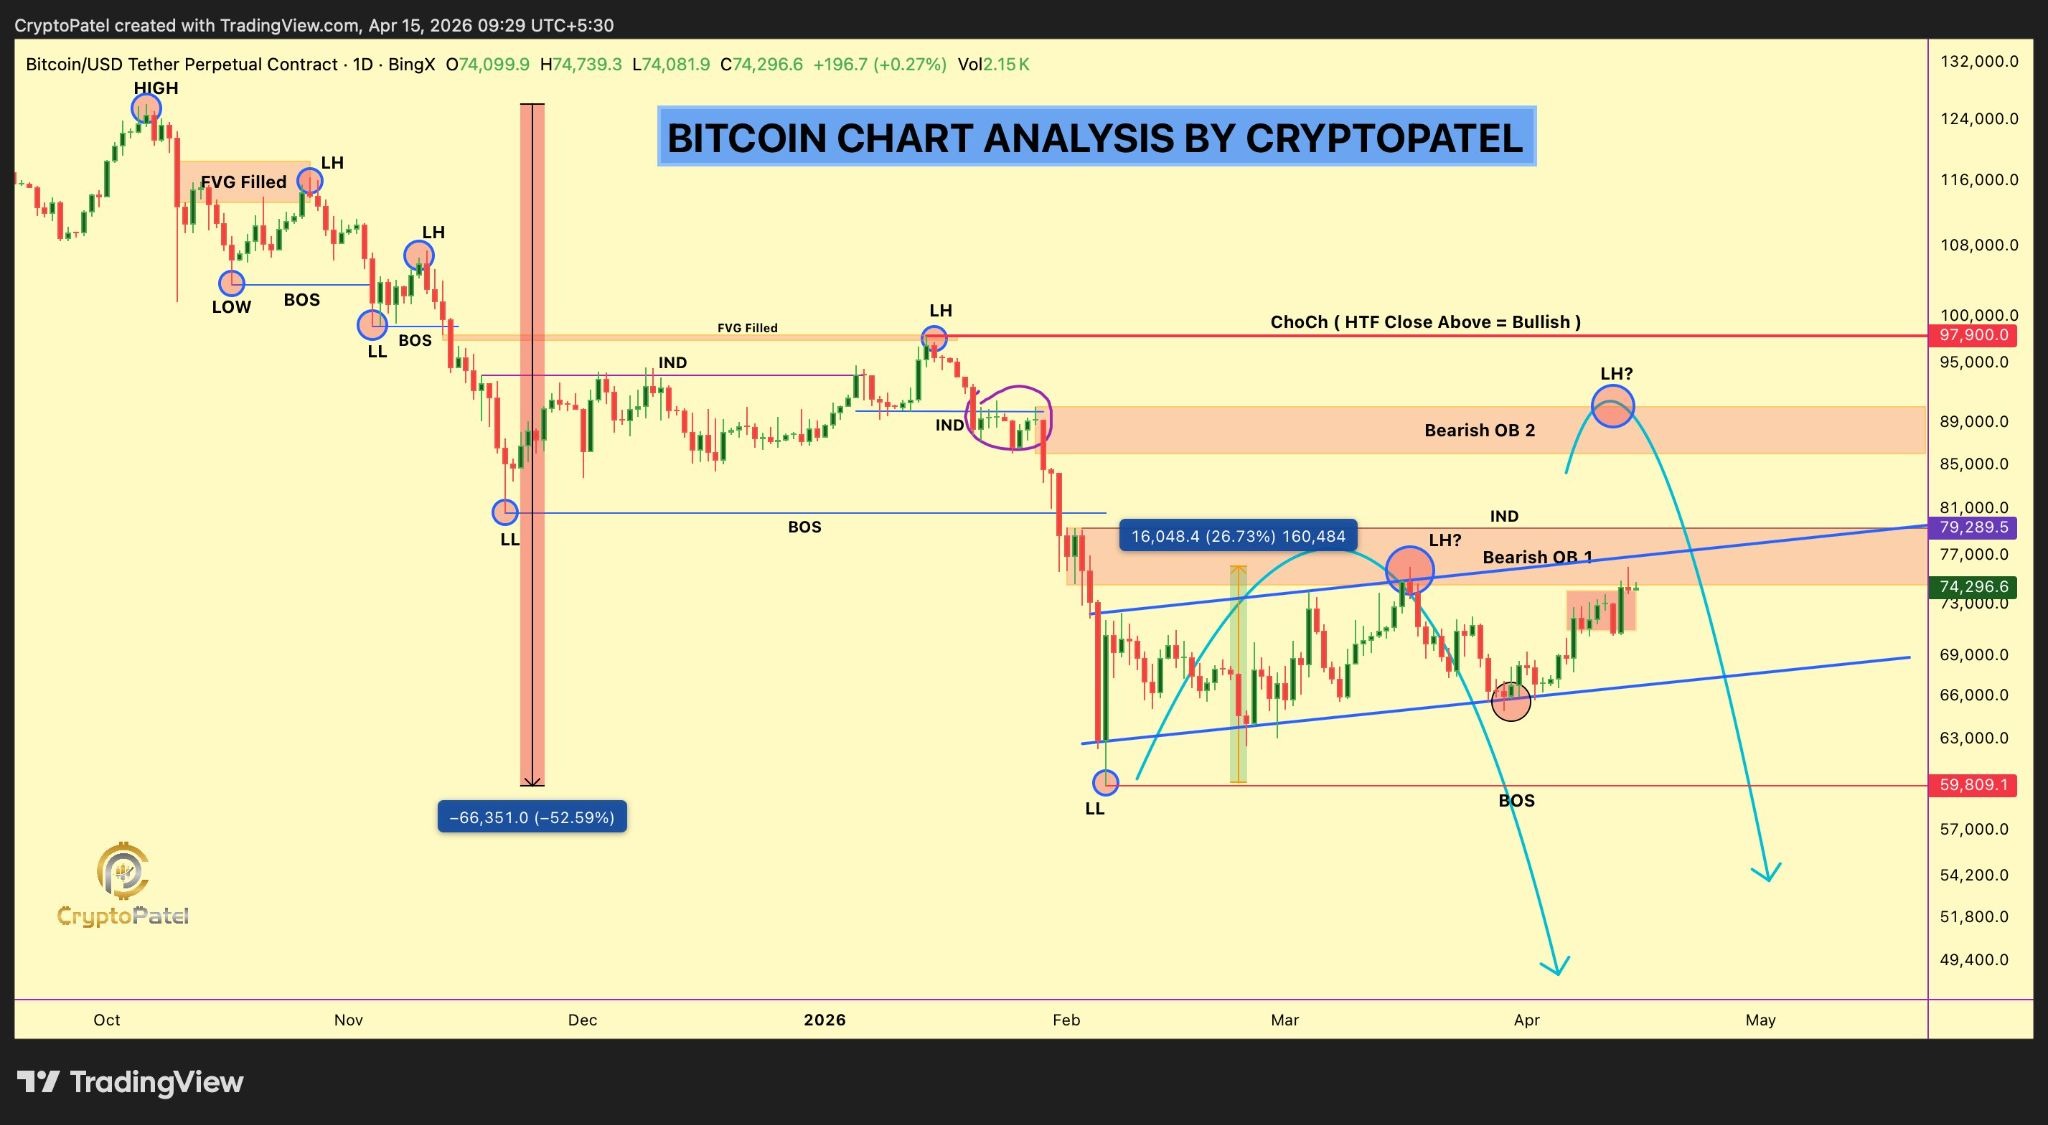
“$76K is the level that decides everything,” analyst Crypto Patel said in a Wednesday post on X, adding:
“We need a proper HTF candle close above this zone to trust the move.”
Related: Bitcoin falls to lower support as analysts say markets are ignoring key Iran issue
The analyst further explained that a high-time frame close above $76,000 would open the path toward the $84,000-$96,000 zone, where investors acquired more than 2 million BTC over the last six months, according to Glassnode’s cost basis distribution heatmap.

Echoing this view, trading resource Material Indicators said that “there are multiple levels of technical resistance stacked” between the spot price and a “bonafide $BTC bull market breakout.”
These include the yearly open at $87,500 and the 50-week moving average at $97,000, which must be reclaimed to confirm that the “$BTC bull market has returned,” Material Indicators said in a follow-up post.

The trading resource further pointed out that the relative strength index must close and hold above the 41 level in the weekly time frame.
Previous occurrences in 2023, 2020 and 2019 have led to 660%, 1,600% and 316% BTC price rallies, respectively.
“Obviously, we are not there yet,” Materials indicators said in a video posted on X, adding:
“Those are the macro things that need to happen to say a validated bull market is on.”
For analyst Rekt Capital, the BTC/USD pair needs to achieve a weekly close above $72,800 to “confirm a breakout.”

As Cointelegraph reported, the bulls must decisively break above the $76,000-$80,000 range to confirm a trend change.
Optimism needs to return to the BTC market
The bull score index, a measure of Bitcoin’s overall market health that combines fundamental and technical metrics, indicates a significant improvement in market conditions following BTC’s latest move to $76,000.
The metric increased to 40 on April 15, the highest since late October 2025. This reading remains within neutral territory, reflecting a gradual recovery after a period of relatively weak momentum.
While the bull score index improvement to 40 “reflects relative stability in the market,” it must rise to an area of “strong optimism (above 60), which typically indicates strong bullish conditions,” CryptoQuant analyst Arab Chain said in a Quicktake post, adding:
“If the indicator continues to improve gradually, it may signal a potential return of upward momentum, especially if higher levels are reclaimed in the coming period.”

Meanwhile, demand for spot Bitcoin ETFs remains intermittent, with these investment products recording alternating inflows and outflows after every few days.
Although the $451 million in net inflows recorded on Tuesday pointed to a return in demand from US investors, persistent positive flows are required to propel BTC price higher.

As Cointelegraph reported, onchain activity is showing “bull market behavior,” with Bitcoin’s daily transaction count reaching 17-month highs, further reinforcing BTC’s upside potential.
This article is produced in accordance with Cointelegraph’s Editorial Policy and is intended for informational purposes only. It does not constitute investment advice or recommendations. All investments and trades carry risk; readers are encouraged to conduct independent research before making any decisions. Cointelegraph makes no guarantees regarding the accuracy or completeness of the information presented, including forward-looking statements, and will not be liable for any loss or damage arising from reliance on this content.


France has logged 41 crypto-linked kidnappings in 2026, prompting Interior Ministry plans for tougher measures after the country became Europe’s hotspot for “wrench attacks.”
Summary
- France’s Interior Ministry will roll out new measures to protect crypto holders after 41 kidnappings so far in 2026.
- Officials say France now accounts for about 40% of Europe’s crypto “ransom attacks,” after a 75% global jump in 2025.
- A new prevention platform has drawn thousands of sign‑ups as authorities move to treat crypto crime as a physical security threat.
French Interior Ministry representative Jean‑Didier Berger says France will introduce new measures “in the coming weeks” to deal with a wave of crypto‑linked kidnappings that has made the country an epicenter of what police now call “wrench attacks.” Speaking at Paris Blockchain Week, Berger said authorities have already launched a prevention platform aimed at digital asset holders and attracted thousands of registrations, framing the next step as a tighter, more coordinated law‑enforcement response.
So far in 2026, officials have counted 41 kidnapping cases tied to cryptocurrency in France, an average of roughly one every 2.5 days, according to figures cited by Berger and local media. In 2025, global incidents of such ransom attacks rose 75% year‑on‑year, with France the worst‑hit country worldwide and accounting for about 40% of all cases recorded in Europe.
Berger said he is working with Interior Minister Laurent Nuñez on a “more stringent response plan” that will be deployed shortly, following internal warnings that the threat has evolved from insider disputes to systematic targeting of wealthy individuals and their families. A January memo from France’s organized crime agency SIRASCO, reported by Le Parisien, described roughly 40 crypto kidnappings and hostage‑takings between mid‑2023 and end‑2025, mostly in urban areas around Paris.
Recent cases underline the escalation. In April, GIGN commandos rescued a mother and 10‑year‑old son held for about 20 hours as kidnappers tried to extort “several hundreds of thousands” of euros from the father, a crypto entrepreneur. Earlier this year, a magistrate linked to a Lyon‑based crypto executive and her elderly mother were held for 30 hours in a ransom plot before six suspects were arrested, including a minor.
Industry and security researchers say self‑custody has become a physical risk factor in France’s crypto scene, pushing some executives toward bodyguards and home security checks. TRM Labs and CertiK data cited by outlets such as Forbes show France logged 19 of 72 verified wrench attacks globally in a recent period, more than twice the tally in the United States, with at least 30 documented cases since 2017 and over 20 in 2025 alone.
For a government that has marketed Paris as a crypto and fintech hub under clear rules and MiCA‑aligned licensing, the surge in kidnappings now threatens to become a reputational and capital‑flight problem. As one CryptoSlate report put it, France is “where crypto wealth looks hardest to hold safely in public,” a perception Berger and Nuñez will now have to fight through prevention, rapid‑response policing and closer cooperation with an industry suddenly focused as much on physical safety as on private keys.


Summary
- Blockstream CEO Adam Back backs “optional” quantum-resistant upgrades and rejects freezing quantum‑vulnerable wallets.
- His stance clashes with BIP‑361, a three‑phase plan that would eventually invalidate legacy signatures and freeze unmigrated coins, including Satoshi’s stash.
- The debate highlights how Bitcoin must balance intergenerational security against hard limits on property rights and censorship resistance.
Bitcoin’s (BTC) long‑running debate over the quantum computing threat has flared again after Blockstream CEO Adam Back used Paris Blockchain Week to argue for optional, opt‑in upgrades instead of forcibly freezing old wallets. “Preparation is much safer than hasty responses in a crisis,” Back said, insisting that the network should build quantum‑resistant paths now while preserving user choice and property rights.
Back described today’s quantum computers as “essentially lab experiments” and noted he has followed the field for more than 25 years, during which progress has been “incremental,” but warned that Bitcoin cannot afford to wait until a real‑world break occurs. He also pushed back on calls to lock down coins by protocol fiat, arguing that the Bitcoin community has shown it can coordinate under pressure and that “bugs have been identified and fixed within hours” in past emergencies.
Back’s comments directly contrast with BIP‑361, “Post‑Quantum Migration and Legacy Signature Sunset,” a proposal from Jameson Lopp and five co‑authors that would gradually phase out quantum‑vulnerable outputs and ultimately freeze unmigrated coins. The draft, which builds on BIP‑360’s soft‑fork framework, introduces a quantum‑resistant output type and targets early formats such as pay‑to‑public‑key (P2PK) addresses that expose public keys on‑chain.
Estimates cited by CoinMarketCap and other publications say roughly 1.7 million BTC — about 34% of total supply, including Satoshi Nakamoto’s early holdings valued around $70–$80 billion at current prices — still sit in quantum‑exposed address types. Under BIP‑361’s three‑phase schedule, Phase A would begin three years after activation and ban new payments to legacy addresses, while still allowing spending from them.
Five years after activation, Phase B would go further by rendering old ECDSA and Schnorr signatures invalid, meaning any coins that had not been migrated to quantum‑resistant outputs would be effectively frozen on the network. Lopp and co‑authors frame this as necessary to prevent “intergenerational theft” by a future quantum adversary and to avoid a scenario where an attacker can seize dormant wallets and crash trust in Bitcoin’s fixed‑supply narrative.
Back and other critics counter that deliberately freezing coins crosses a red line for decentralization and censorship resistance, amounting to protocol‑level expropriation even if done in the name of security. They argue that Bitcoin has historically relied on social consensus and voluntary upgrades, and that the community should instead focus on offering robust quantum‑safe options, education and incentives so users migrate out of genuine self‑interest rather than under threat of losing control over their funds.
In previous crypto.news coverage of protocol‑level governance battles and hard‑fork debates, similar tensions have surfaced between risk‑mitigation schemes and the movement’s founding principles, from block‑size wars to taproot activation. The quantum fight, now centered on BIP‑361 and Back’s rival vision of optional defenses, is shaping up as the next major test of how far Bitcoiners are willing to go to “save” the network without breaking what made it attractive in the first place.
Crypto World
BlockDAG goes live on BingX as $0.000000726 window tightens while BTC and DOT signal shifting market trends

Disclosure: This article does not represent investment advice. The content and materials featured on this page are for educational purposes only.
Bitcoin Cash and Polkadot show mixed trends, driving interest in early-stage projects like BlockDAG amid shifting market sentiment.
Summary
- Bitcoin Cash and Polkadot stay range-bound as traders shift focus to early-stage plays like BlockDAG.
- Market uncertainty around Bitcoin Cash and Polkadot drives attention to BlockDAG ahead of listings.
- BlockDAG gains traction as its entry window narrows, with BingX listing boosting visibility and momentum.
Price action across major crypto names is starting to feel uneven again as traders reassess Bitcoin Cash price prediction and where range-bound assets may move next.
Bitcoin Cash continues to react within broader cycle bands where upside attempts often fade into consolidation rather than sustained trends. Interest around Polkadot is also shaped by its interoperability model, keeping Polkadot price prediction tied closely to how quickly cross-chain demand actually materializes.

That uncertainty is pushing attention toward earlier positioning opportunities. The question of what crypto to buy now is becoming more frequent as liquidity searches for asymmetric setups. BlockDAG (BDAG) is drawing focus with its $0.000000726 entry window tightening ahead of its BingX listing. Exchange expansion and staged rollout plans are building momentum around a phase that is still open, but narrowing fast.
Bitcoin Cash $350–$700 range drives cyclical movement
Bitcoin Cash price prediction is often based on long-term market behavior rather than rapid structural change. Bitcoin Cash has historically traded within broad zones that reflect its cycle-driven nature. Recent ranges have generally stayed between about $350 and $500. Stronger market phases have pushed it toward $600 to $700 before cooling back into consolidation.
The Bitcoin Cash price prediction outlook is shaped by liquidity conditions and overall crypto sentiment. Trading activity tends to slow during risk-off periods and expand when market demand increases. Price movement is also influenced by transaction usage trends and broader Bitcoin-related cycles. Market participants often watch these ranges to understand whether the asset is stabilizing or preparing for another directional move within its established structure over time.
Polkadot price prediction signals low range stability
Polkadot price prediction is largely shaped by how its interoperability framework evolves under real network usage. Polkadot has recently shown price movement clustered in lower single-digit ranges, generally fluctuating between about $1.10 and $1.80 in current market conditions. These levels reflect ongoing consolidation after broader cycle declines rather than directional expansion.
The Polkadot price prediction outlook depends on parachain activity, validator participation, and cross-chain demand across connected networks. Price behavior often remains compressed during periods of lower ecosystem activity. Movement tends to expand when network usage increases or when broader crypto liquidity improves.
Forecast models for 2026 continue to place expectations within similar low-range structures, suggesting gradual shifts rather than sharp breakouts under current conditions. Market direction remains closely linked to adoption pace and overall sentiment across interoperability-focused assets in the sector.
BlockDAG $0.000000726 window tightens as BingX listing goes live
BlockDAG is entering a decisive phase where attention is tightening around its current pricing window and upcoming exchange expansion. The $0.000000726 level is being positioned as a final fixed entry zone before broader market pricing takes over. This stage is increasingly defined by timing rather than speculation, as participants assess how quickly access may shift once listings expand further.
The live BingX listing marks the first major catalyst in this sequence, with additional Tier 1 exchange integrations expected to follow in quick succession. Each new listing adds visibility and reduces friction for entry, which naturally compresses the available accumulation window. That compression is becoming the central focus for those tracking momentum shifts across early-stage assets.
BlockDAG is also being discussed through the lens of asymmetric upside potential, with projections referencing a 195x scenario tied to early positioning. This framing is driving heightened attention around allocation timing rather than long-term waiting strategies. The narrative is no longer about discovery. It is about how much of the remaining supply is accessible before broader demand discovery begins.
The phrase what crypto to buy now is increasingly being shaped by this environment, where early access windows are narrowing while exchange coverage expands. BlockDAG sits directly in that intersection, where timing and availability are beginning to separate early participants from later entrants.

As additional exchanges go live and ecosystem phases progress through late April and beyond, the current pricing structure continues to tighten. Once supply transitions fully into open market conditions, price discovery is expected to shift rapidly.
In summary
The market outlook remains divided as traders reassess Bitcoin Cash price prediction and its continued reliance on cyclical range behavior. Bitcoin Cash continues to reflect liquidity-driven movement within broader market conditions. At the same time, Polkadot price prediction highlights ongoing uncertainty around interoperability adoption and network activity. Polkadot remains influenced by ecosystem participation and overall sentiment shifts.
BlockDAG is increasingly dominating attention as its $0.000000726 entry window tightens ahead of expanding exchange listings. The new BingX launch signals the beginning of wider Tier 1 exposure, with more listings expected to follow soon. Supply remains fixed while access continues to narrow, intensifying focus on early positioning. In this environment, what crypto to buy now becomes a timing question, and BlockDAG’s accelerating listing cycle and shrinking entry window continue to define urgency as market access moves toward open trading conditions.
For more information, visit the presale website, official website, Telegram, and Discord.
Disclosure: This content is provided by a third party. Neither crypto.news nor the author of this article endorses any product mentioned on this page. Users should conduct their own research before taking any action related to the company.
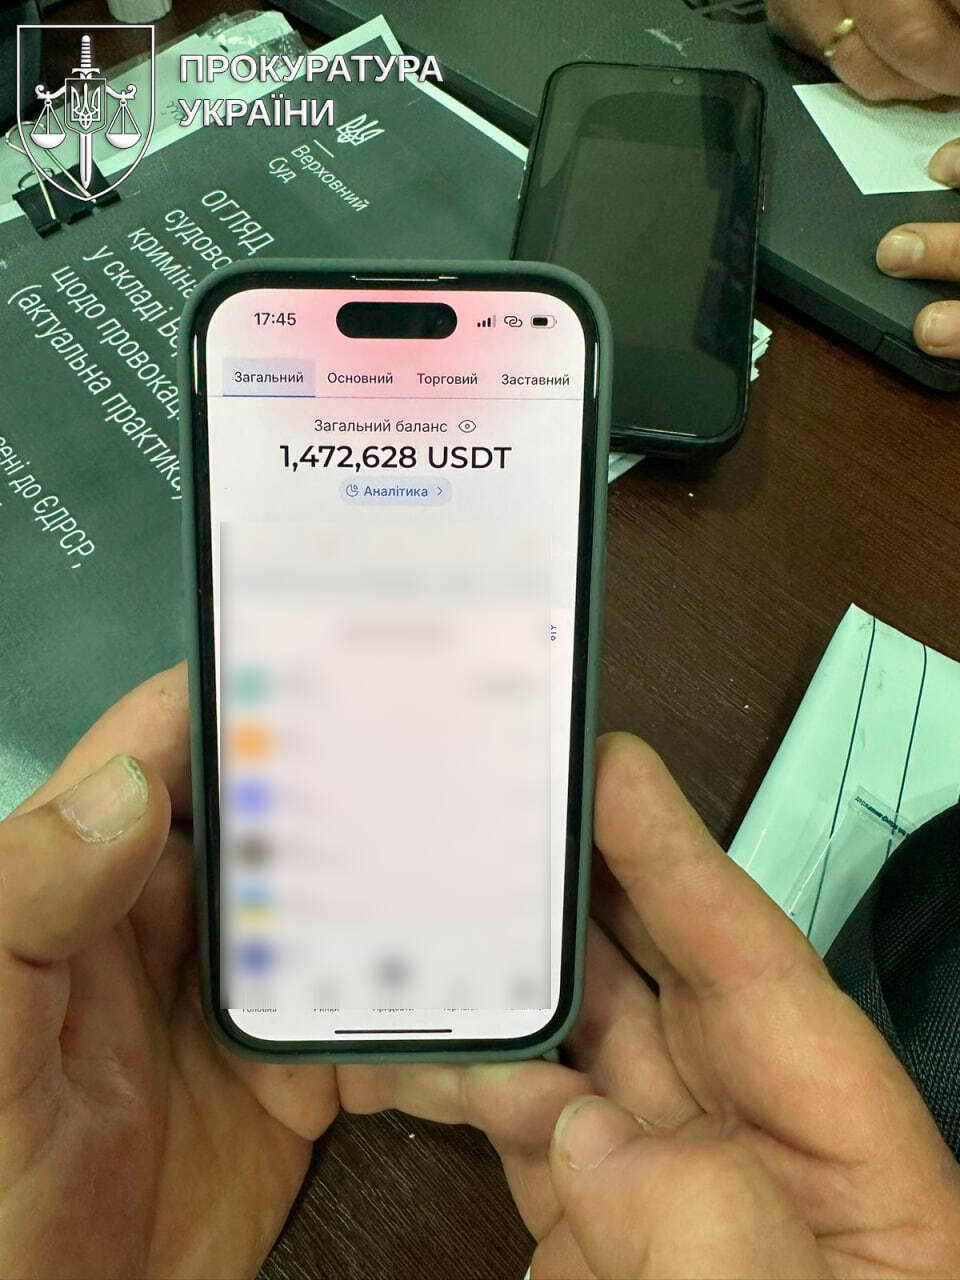
Ukrainian authorities have arrested a member of an international cybercrime network wanted by the FBI over allegations of fraud and money laundering tied to losses exceeding $100 million across the United States and Europe.
The suspect was arrested in the Transcarpathia region during a joint operation involving the National Police of Ukraine and other internal security units, Ukraine police said on Thursday. Officials said the man had been wanted internationally for some time and was eventually found in Uzhhorod, where he was living under a fake identity using forged documents.
“He issued fictitious documents about his own death and continued to live in Ukraine as a “new” person, using false documents,” prosecutors said, adding that he laundered illicit proceeds through property acquisitions, often using relatives as intermediaries to disguise ownership and financial flows.
The suspect was part of a wider cyber syndicate that deployed malicious software to harvest personal data and corporate records, later using that information to extort victims by demanding payments in exchange for silence or the return of stolen material, per the announcement. The scheme targeted individuals and institutions in both the US and Europe.
Related: Paying Iran in crypto could put shippers at sanctions risk: Chainalysis
Ukraine seizes $3 million in crypto
During the investigation, authorities seized assets worth approximately $11 million, including cash, real estate, vehicles and cryptocurrency valued at around $3 million.

Officials also flagged discrepancies between declared income and assets held by the suspect associates, pointing to tens of millions of Ukrainian hryvnias in unexplained wealth accumulation. Investigators say the financial trail helped reconstruct parts of the laundering network and confirm the scale of the operation. They also identified two additional accomplices linked to the laundering operation.
The suspect faces charges under Ukrainian criminal code provisions covering document forgery and money laundering. His alleged accomplices have also been charged and remain in custody.
Related: Ukraine blocks Polymarket, classifies prediction markets as gambling
Ukraine uncovers more hacker groups
Earlier this year, Ukraine, the United States and Germany uncovered another transnational hacking group responsible for blocking the systems of at least 11 American corporations and demanding ransom payments in cryptocurrency. Prosecutor General Ruslan Kravchenko said the attacks caused an estimated $1.5 million in damage, with the group consisting of more than 20 members, including seven based in Ukraine.
Authorities carried out searches at the homes of two Ukrainian suspects, seizing computers, phones, cash and documents. One suspect was also linked to the spread of BlackBasta malware.
Magazine: Bitcoin’s ‘biggest bull catalyst’ would be Saylor’s liquidation — Santiment founder


South Korean tech company Naver and Upbit operator Dunamu said in a corrected filing that their planned share swap includes forming an initial public offering (IPO) committee for Naver Financial within one year of closing, outlining a path toward a future listing.
The disclosure, outlined in the corrected filing on Wednesday, said the companies would pursue a listing within five years, with a possible two-year extension. Naver said it plans to secure voting rights in Naver Financial so the fintech unit remains a consolidated subsidiary after the deal.
The filing suggests the deal goes beyond a simple ownership change, outlining a structure that could eventually bring Upbit’s parent under a listed fintech group. The move indicates Naver and Dunamu are positioning any future South Korea listing at the fintech-parent level rather than through a standalone listing of Upbit’s parent.
However, Dunamu said no specific decisions have been made on whether to proceed with the IPO or on its timing or structure. It added that the deal remains subject to regulatory approvals that could still delay or derail the transaction.
Naver Financial’s plans to acquire Dunamu were first reported in September 2025 by local outlets including Yonhap and Chosun, which said the company was preparing a share swap to bring the Upbit operator under its umbrella. Naver later confirmed the transaction in a November regulatory filing, outlining a roughly $10.3 billion all-stock deal.
Investor agreement sets IPO framework, control terms
The filing said Naver, Dunamu and related parties entered into an investor agreement tied to the share swap, under which they agreed to use their “best efforts” to pursue a future listing of Naver Financial after the transaction closes.
The agreement forms the basis for post-deal restructuring, including preparations for a potential IPO.
Related: South Korea orders crypto exchanges to verify holdings every 5 minutes
The filing described the listing plan as conditional, noting that key elements, including timing, structure and execution, will depend on market conditions and regulatory developments. It added that more detailed plans would be disclosed if and when formal decisions are made.
The updated disclosure follows a roughly three-month delay to the Naver and Dunamu share swap deal timeline.
It also comes as Dunamu reported weaker operating performance in 2025, with revenue falling about 10% year-on-year to 1.56 trillion won ($1.2 billion) and operating profit dropping 26.7% to 869.3 billion won, which the company attributed to reduced crypto trading volumes during a broader market slowdown.
Magazine: Singapore isn’t a ‘crypto hub’ — it’s something better: StraitsX CEO

TLDR:
- Tether will contribute up to $127.5M, including a $100M revenue-linked credit line, to fund Drift’s recovery pool.
- Drift Protocol will issue a transferable recovery token to affected users, separate from the DRIFT governance token.
- After relaunch, Drift will settle transactions in USDT instead of USDC, aligning with Tether’s direct involvement.
- The $147.5M recovery package targets full coverage of $295M in outstanding user losses from the April 1 exploit.
Drift Protocol has secured a $147.5 million recovery package following an exploit that occurred on April 1. Tether will contribute up to $127.5 million, while additional partners will provide $20 million.
The funds will go toward covering $295 million in outstanding user losses. A dedicated recovery pool will be established using exchange revenue and committed support funds. The relaunch will also shift settlement from USDC to USDT.
Tether Leads Major Funding Effort to Address User Losses
Tether’s commitment forms the backbone of Drift Protocol’s recovery plan. The stablecoin issuer will provide a $100 million revenue-linked credit line as part of its contribution. Ecosystem grants and loans for market makers are also included in the package.
The recovery pool will draw from most of Drift’s exchange revenue going forward. Combined with the committed funds from Tether and partners, the pool targets full coverage of the $295 million owed to users. This structured approach ensures a steady flow of resources into the recovery effort.
Tether will also provide market-making support through designated market makers after the relaunch. This move ties the stablecoin issuer more closely to Drift’s ongoing operations. It also reflects a broader interest in stabilizing the protocol for long-term use.
Partners beyond Tether have pledged an additional $20 million to strengthen the package. This collective backing shows coordinated support from across the ecosystem. Together, the contributors form a unified front to restore user confidence in the protocol.
Recovery Token and Settlement Shift Mark Structural Changes for Drift
Drift will issue a dedicated recovery token to users affected by the April 1 exploit. This token is separate from the existing DRIFT governance token and carries a distinct function. It represents a direct claim on the recovery pool established through the funding package.
The recovery token is transferable, giving affected users flexibility in how they manage their claims. Users can hold or trade the token depending on their preference. This design allows market participants to price and move recovery claims as needed.
After relaunch, Drift will settle transactions in USDT instead of USDC. The switch aligns with Tether’s involvement and removes reliance on a competing stablecoin. It also streamlines operations by using the currency backed by the primary funder.
The structural shift to USDT settlement, paired with the recovery token issuance, reshapes how Drift will function going forward. These changes reflect decisions made in direct response to the exploit. They also establish a clearer operational framework as the protocol prepares to resume services.


DoorDash rolls out new ad tools to help restaurants target high-value customers

XRP Spot ETF Hits 11-Week Inflow Record

Lena Dunham Wants Fans To Take Her Adam Driver Comments ‘In Context’


-

 Politics6 days ago
US brings back mandatory military draft registration
-
 Sports6 days ago
Man United discover Nico Schlotterbeck transfer fee as defender reaches Dortmund agreement
-

 Fashion6 days ago
Weekend Open Thread: Veronica Beard
-

 Politics7 days ago
Malcolm In The Middle OG Turned Down ‘Buckets Of Money’ To Appear In Reboot
-

 Politics5 days ago
World Cup exit makes Italy enter crisis mode
-

 Business6 days ago
Tesla Model Y Tops China Auto Sales in March 2026 With 39,827 Registrations, Beating Cheaper EVs and Gas Cars
-

 Crypto World3 days ago
The SEC Conditionalises DeFi Platforms to Be Avoided for Broker Registration
-

 Crypto World3 days ago
SEC Signals Exemption for Crypto Interfaces From Broker Registration
-

 News Videos2 days ago
Secure crypto trading starts with an FIU-registered
-
 NewsBeat4 days ago
Pep Guardiola and Gary Neville agree over Arsenal title problem that benefits Man City
-

 Business5 days ago
Ireland Fuel Protests Enter Day 5 as Blockades Spark Shortages and Government Prepares Support Package
-

 Business7 days ago
OpenAI Halts Stargate UK Data Centre Project Over Energy Costs and Copyright Row
-

 Crypto World6 days ago
Federal judge blocks Arizona from bringing criminal charges against Kalshi
-

 Politics7 days ago
LBC Presenter Mocks Trump Over Iran War Failures
-

 NewsBeat3 days ago
Trump and Pope Leo: Behind their disagreement over Iran war
-

 Crypto World3 days ago
SEC Proposes Certain Crypto Interfaces Don’t Need to Register as Brokers
-
 NewsBeat5 days ago
JD Vance announces ‘no agreement’ with Iran over nuclear weapons fear
-

 Business6 days ago
IMF retains floor for precautionary balances at SDR 20 billion
-

 Business6 days ago
Former Liverpool CEO eviscerates FIFA for World Cup ticket pricing
-
Crypto World4 days ago
Sei Network Enters Quiet Reset Phase as On-Chain Metrics Signal a Slowdown in 2026
You must be logged in to post a comment Login