
Crypto World
Meta Stock Dips Amid Senate Proposal to Tackle Scam Ads Online

TLDR
- Meta stock dropped 1.7% following the introduction of the Senate’s SCAM Act, which targets scam ads on social media platforms.
- The SCAM Act proposes stricter regulations, requiring Meta to verify advertisers and giving enforcement power to the FTC and state attorneys general.
- Meta is facing increased scrutiny from both U.S. regulators and international challenges, particularly from India’s Supreme Court regarding WhatsApp data.
- Despite embracing artificial intelligence, Meta’s reliance on ad revenue remains crucial, and stricter regulations could hinder its growth.
- The tech sector as a whole is grappling with fears that AI tools may erode profit margins, impacting major players like Meta.
Meta Platforms’ stock dropped 1.7% to $679.86 on Wednesday morning, marking another volatile session for the parent company of Facebook and Instagram. The decline followed news of a proposed bipartisan Senate bill, aiming to curb scam ads online. The bill, called the Safeguarding Consumers from Advertising Misconduct Act (SCAM Act), has raised concerns among investors, adding to the growing uncertainty surrounding Meta’s future.
New Senate Bill Raises Concerns for Meta’s Ad Business
The SCAM Act targets deceptive advertising practices and would impose stricter regulations on social media platforms. If passed, the bill would force platforms like Meta to verify advertisers, which could lead to increased screening costs and potential delays in onboarding new advertisers. The bill also grants enforcement powers to the Federal Trade Commission (FTC) and state attorneys general, placing further pressure on the advertising ecosystem.
Investors are closely monitoring the situation, with many worried about the impact on Meta’s core revenue stream advertising. While the company has embraced artificial intelligence in its efforts to diversify its business model, ad sales still play a crucial role in its financial performance. The bill’s focus on tightening the regulatory framework for online ads has raised concerns that it could slow Meta’s ad revenue growth.
Meta Stock Faces Broader Market Pressures
Meta’s stock is also facing broader market pressures, which have affected the technology sector as a whole. The rise of artificial intelligence has led to fears of increased competition and shrinking profit margins for established tech companies. The S&P 500 and Nasdaq both experienced significant declines this week, partly driven by concerns about AI’s impact on the industry.
Meta is grappling with these challenges at a time when the company is ramping up its spending on AI. Last week, Meta raised its capital expenditure forecast for 2026 to between $115 billion and $135 billion. CEO Mark Zuckerberg described 2026 as a pivotal year for the company as it seeks to invest heavily in “personal superintelligence.”
Despite these ambitious plans, Meta faces mounting risks from stricter regulations in both the U.S. and abroad. On Tuesday, India’s Supreme Court signaled that it might reinstate a ban on WhatsApp sharing user data with other Meta companies. India is Meta’s largest market by user count, and any further restrictions on its operations there could severely impact the company’s prospects.
Traders are left wondering how much of this proposed legislation will become law, and what the timeline might look like. Bills like the SCAM Act often undergo revisions before they are passed, with potential delays affecting near-term investor sentiment. Meanwhile, ongoing court battles, particularly in India, add to the uncertainty surrounding Meta’s future.


TLDR:
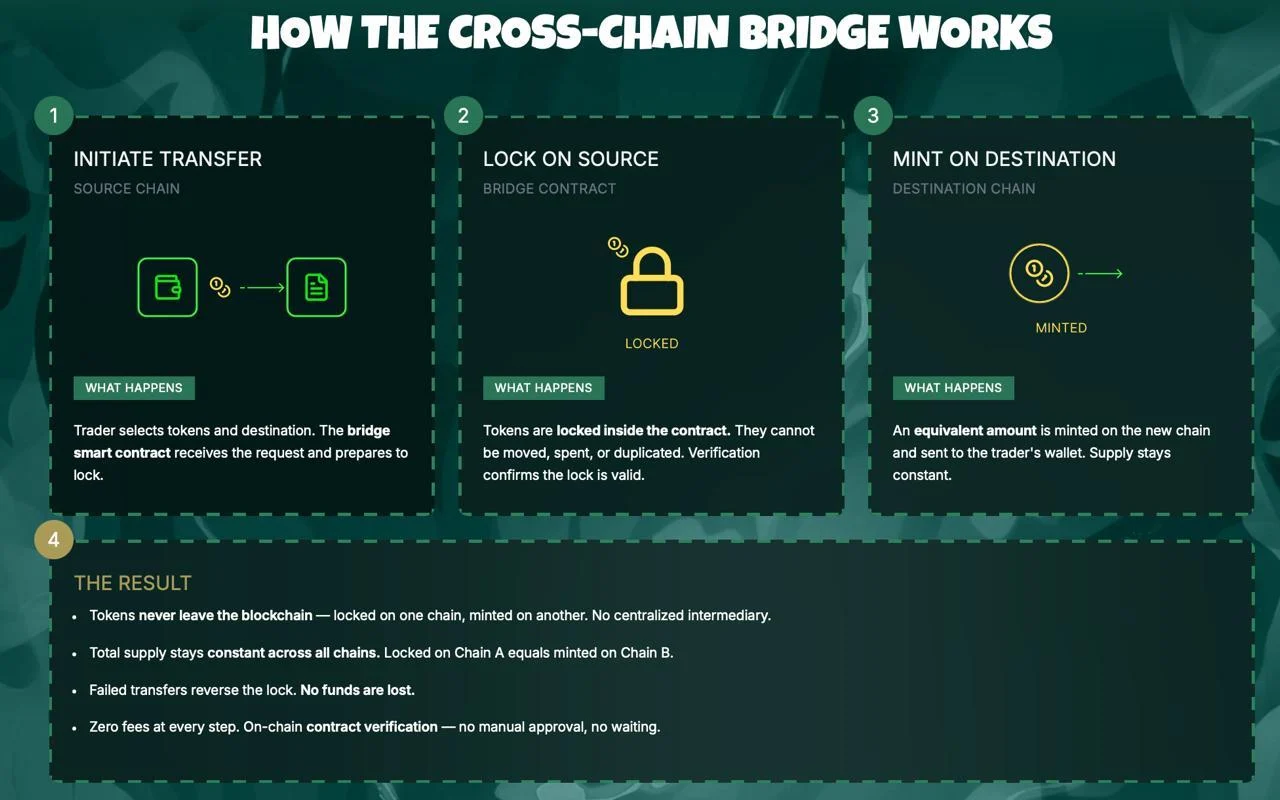
- MegaETH processes over 100,000 TPS with sub-10ms block times, settling all activity directly on Ethereum mainnet.
- iTRY, a Turkish Lira stablecoin backed by money market funds, launches with a real-time 45% APY yield loop strategy.
- Kumbaya XYZ holds $51M of MegaETH’s $89M TVL, with USDM capturing 74% of the network’s $84M stablecoin market cap.
- 53% of $MEGA token supply unlocks only after hard KPIs are met, with USDM revenue funding active protocol buybacks now.
MegaETH ($MEGA) is gaining attention as the first real-time Ethereum Layer 2 in history. The network delivers sub-10-millisecond block times and over 100,000 transactions per second.
All activity settles directly on Ethereum. The protocol currently holds approximately $89 million in total value locked.
With 2.26 million transactions in 24 hours and zero artificial incentives, MegaETH is building momentum. The network positions itself as a high-throughput onchain settlement layer for real applications.
iTRY Launch and Live DeFi Protocols Drive Activity on MegaETH
One of the most anticipated developments is the launch of iTRY, a Turkish Lira stablecoin. As noted by researcher Nick Research on X, iTRY is backed by money market funds and offers around 45% APY.
The yield strategy works through a real-time loop: lock iTRY, mint wiTRY, borrow USDm, and compound yield. This carry loop removes traditional lock-up barriers for yield seekers.
The broader stablecoin market on MegaETH is already well-established. USDM, issued through Ethena, captures over 74% of the $84 million stablecoin market cap on the network.
Kumbaya XYZ contributes $51 million of the $89 million total TVL on its own. That concentration shows real capital deployment rather than distributed incentive farming.
Bluechip DeFi protocols went live on the network from day one. Aave V3, GMX, and World Markets launched alongside a Chainlink Scale integration.
That integration provides access to nearly $14 billion in flagship assets, including wstETH and LBTC. This confirms that major DeFi infrastructure views MegaETH as production-ready.
Perpetuals trading activity is rising sharply on the network as well. Weekly perps volume climbed 900% to reach $45 million over seven days.
The sequencer operates at cost, which keeps transaction fees among the lowest in crypto. These factors together are drawing active traders to the platform.
$MEGA Tokenomics Link Supply Unlocks to Hard Performance Milestones
The $MEGA token structure stands out for its milestone-based unlock mechanism. There are no points programs, no emissions, and no manufactured TVL incentives in the design.
Instead, 53% of total supply unlocks only after the network hits hard KPIs. Token release is directly tied to real, measurable growth.
Foundation revenue from USDM activity flows into direct $MEGA buybacks, which are already active. This buyback mechanism provides consistent demand without depending on market speculation.
Protocol revenue-backed buybacks at this stage of development remain uncommon. It adds a self-sustaining element to the overall token economy.
The token generation event remains tied to milestones rather than a fixed calendar date. This approach shifts builder incentives toward long-term throughput growth.
The network currently runs at 10 gigagas per second, supporting complex smart contracts at scale. That throughput level makes MegaETH suitable for applications requiring fast, reliable execution.
The MegaMafia ecosystem is expanding into DeFi, gaming, and culture. Brix recently secured $5.5 million from Turkish institutional investors ahead of the iTRY launch. Active addresses reached 3,230 in 24 hours, reflecting genuine user engagement on the network.

TLDR:
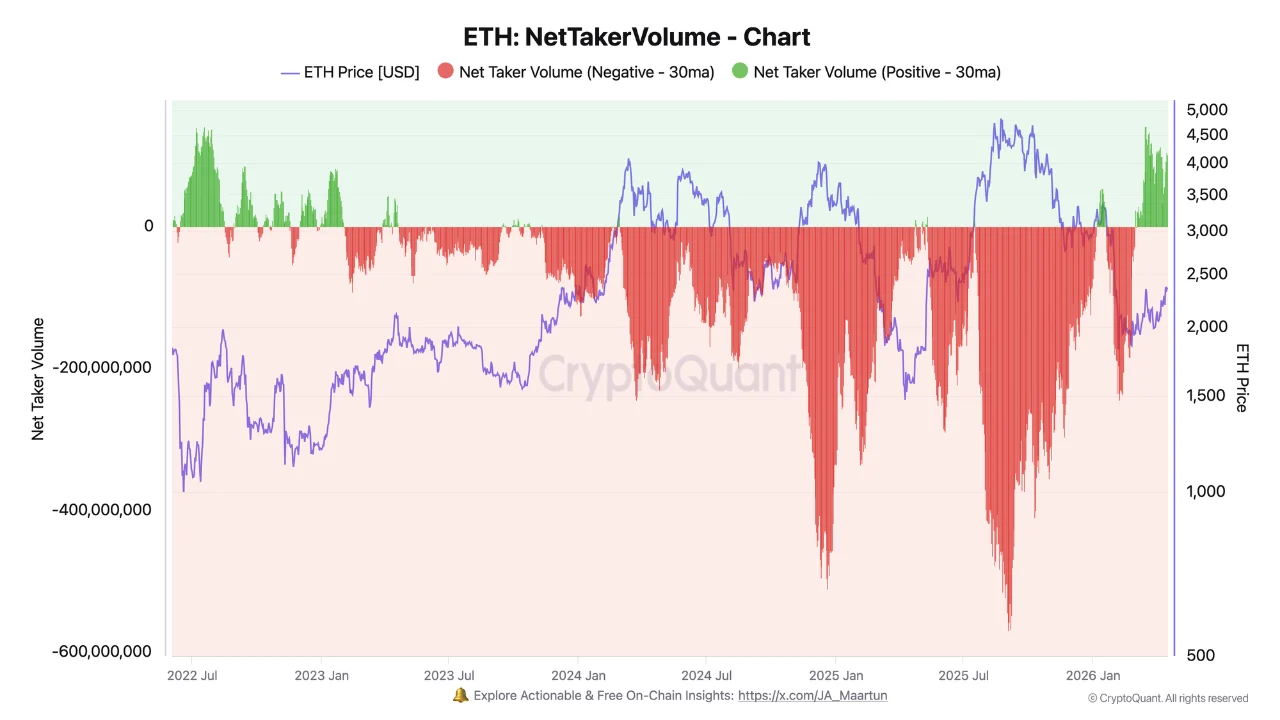
- ETH net taker volume turned positive at +$102M, snapping months of consistent sell-side dominance.
- Sell pressure peaked at -$568M when Ethereum set its all-time high just below $5,000 this cycle.
- Comparable buying pressure was last recorded in 2022 when ETH traded near the $1,000 price level.
- Since March, buy-side volumes have steadily grown, pointing to a possible shift in market positioning.
ETH derivatives sentiment has undergone a notable change in recent weeks. After prolonged and consistent selling pressure throughout this market cycle, buy-side volumes are finally gaining ground.
Data from derivatives exchanges shows that net taker volume has turned positive, recording +$102 million in a single day.
This marks a clear departure from the heavy sell-side dominance seen at previous ETH price peaks. Analysts are now watching whether this shift holds and supports a broader recovery for Ethereum.
Heavy Sell Pressure Shaped ETH Derivatives Throughout This Cycle
For most of this cycle, Ethereum has faced unusual and persistent selling pressure in derivatives markets. Net taker volume, which tracks the difference between buy and sell market orders on derivatives exchanges, remained almost consistently negative. This pattern became particularly visible during key price events in late 2024.
When ETH attempted to break above $4,000 in December 2024, net taker volume fell sharply to -$511 million. The sell pressure became even more extreme when Ethereum later reached an all-time high just below $5,000. At that point, sell-side dominance hit a cycle high of -$568 million in net taker volume.

Source: Cryptoquant
On-chain analyst Darkfost drew attention to this persistent trend in a recent post on Cryptoquant. The data showed that buyers repeatedly failed to absorb supply at key price levels throughout this cycle.
Sellers consistently overpowered buying activity, pushing net taker volume deep into negative territory during each rally.
That ongoing imbalance prevented Ethereum from sustaining breakouts, even during brief moments of upside price action.
Buy-Side Volume Climbs to Levels Not Seen Since the 2022 Bear Market
Since March, the dynamic in ETH derivatives markets has changed considerably. This change followed months of negative readings that characterized Ethereum’s derivatives activity.
Buy-side volumes have taken control, with net taker volume recording +$102 million in a single day. The last time Ethereum recorded comparable buying pressure was back in the 2022 bear market.
At that time, ETH was trading near the $1,000 area when similar buy-side activity appeared in the market. Market observers note this comparison carries weight given the scale of the current buying activity.
The return of strong buying interest at current price points to a change in how derivatives traders are positioned.
Darkfost noted in the post: “Since March, buy-side volumes have finally taken control, with +$102 million recorded today.”
The analyst added that buyers absorbing supply and chasing upside could signal the early stages of a recovery for Ethereum. The data stands in sharp contrast to the aggressive sell-side behavior that defined much of this cycle.
Traditional finance giants Charles Schwab and Citadel Securities are both considering entering prediction markets, with each separately weighing up how they wish to get involved in the fast-growing sector.
“I think at some point we likely will have prediction markets,” Rick Wurster, the CEO of the banking and investing titan Schwab, told investors during a call on Thursday.
He added that prediction markets weren’t “of tremendous interest” when he recently asked a group of Schwab clients about them, but it was an area the company would “take a hard look at, and it would be quite straightforward for us to offer.”

Prediction markets such as the popular Kalshi and Polymarket have exploded in use over the past few months, with both platforms seeing a record combined total monthly trading volume of $23.6 billion in March, according to Token Terminal.
However, Kalshi, Polymarket and other prediction market platforms have also caught the ire of some US state regulators, who have accused them in court of offering unlicensed sports betting.
Some federal lawmakers have also vowed to crack down on prediction markets, claiming the platforms weren’t doing enough to stamp out insider trading.
Wurster said Schwab’s potential offering would steer away from allowing bets on areas such as sports, politics and pop culture as it looks to position itself as a partner for building long-term wealth.
“Prediction markets that are not aligned to that are not something that we want to pursue,” he said. “If you look at the stats on the success of gamblers, they’re not strong, and people generally lose money.”
Citadel “keeping an eye” on prediction markets
Meanwhile, Citadel Securities president Jim Esposito said at a Semafor conference in Washington, DC, on Thursday that the company is “absolutely keeping an eye on developments” in prediction markets.

“We’re not there yet, there’s not that much liquidity,” he added, but said that the market is likely to “ramp and scale,” and it was “certainly possible” that the market-making firm would potentially look to get involved.
Related: Democrats question CFTC chair on insider trading in prediction markets
Esposito said Citadel was “not looking at sports at the moment at all, I don’t see us entering that market,” but did signal an interest in some event contracts.
He added that Citadel could see its retail and institutional clients use some event contracts as a hedge for risks to their investments, such as contracts for elections, which have been known to move markets.
“That’s going to be some of the biggest risks to investors’ portfolios that they’re going to have to grapple with,” Esposito said. “Having a clean and distinct way to hedge certain risks, I think there’s a good use case and industrial logic to it.”
Magazine: Should users be allowed to bet on war and death in prediction markets?
Crypto World
Tokenized Treasuries Cross $13.74B as Institutions Shift Focus From Issuance to Utility
TLDR:
- Tokenized U.S. Treasuries have reached $13.74B onchain, marking a shift from proof of concept to real utility.
- Standard Chartered and OKX launched a collateral mirroring programme using tokenized money market funds for trading.
- BounceBit’s Prime platform connects regulated custody with onchain execution through off-exchange settlement flows.
- Circle acquired Hashnote to position USYC as yield-bearing collateral within its expanding digital asset platform.
Tokenized U.S. Treasuries have reached $13.74 billion in onchain value, according to RWA.xyz. This milestone marks a turning point for digital asset markets.
The category has moved past proving tokenization is feasible. Now, the focus shifts toward making those assets functional within real financial infrastructure.
Major institutions are already responding to that shift with concrete programmes and integrations.
From Passive Holdings to Active Collateral Use
The first phase of tokenization centered on bringing familiar assets onto blockchain networks. That work is largely done. The next phase is about putting those assets to work once they are onchain.
Faster-moving collateral, productive capital deployment, and treasury-backed assets that serve active roles are now the priorities.
Franklin Templeton captured this thinking directly in its framing of tokenized money market funds. The firm noted that tokenization creates new utility and use cases, not simply a digital version of an existing instrument.
Its Franklin OnChain U.S. Government Money Fund invests at least 99.5% of assets in U.S. government securities, cash, and related repos.
Standard Chartered and OKX announced a collateral mirroring programme with Franklin Templeton. The programme allows institutional clients to use crypto and tokenized money market funds as off-exchange collateral for live trading. That development moves the market clearly beyond passive holding toward active capital markets use.
BlackRock’s BUIDL and Ondo’s USDY have also helped define the institutional profile of tokenized Treasuries onchain.
Together, these products combine recognizable underlying assets, short-duration government yield, and compatibility with digital asset workflows.
Those three qualities make tokenized Treasuries one of the most relevant real-world asset categories for crypto-native markets today.
Infrastructure Built Around Capital Efficiency
BounceBit has positioned its RWA stack around the idea that tokenized cash equivalents should not stop at issuance. The platform integrated Ondo’s USDY as its first tokenized RWA.
It later expanded to source tokenized cash equivalents from Franklin Templeton’s Benji and BlackRock’s BUIDL through Securitize.
BounceBit’s Prime platform connects regulated custody with onchain execution. Client assets are custodied at Standard Chartered and mirrored to trading venues through an off-exchange settlement flow. That structure allows capital to remain controlled while being deployed more efficiently across strategies.
The platform targets yield above the risk-free rate through structured strategies built on tokenized cash equivalents and market-neutral trading.
Rather than passive exposure, Prime is designed to turn tokenized collateral into a working part of institutional treasury and trading operations.
Circle’s acquisition of Hashnote brought USYC into Circle’s platform, with Circle positioning it as yield-bearing collateral for digital asset markets.
That move, alongside the growth of BUIDL and Benji integrations, shows a consistent direction. Stablecoins built the base layer for onchain dollars. Tokenized Treasuries are now building the next layer for onchain yield-bearing capital.

In the latest bond news, Henry Paulson, who steered the U.S. financial system through the 2008 collapse as Treasury Secretary, is warning that the $35 trillion U.S. debt load could trigger a Treasury bond market crash, and calling for an emergency “break-glass” contingency plan to be ready before it hits.
The transmission channel to crypto is direct: a disorderly bond sell-off tightens dollar liquidity fast, and tight dollar liquidity historically punishes risk assets before any safe-haven Bitcoin narrative has time to develop.
30-year Treasury yields have already crossed 5%, a threshold last breached in October 2023 during the inflation-driven spike and essentially unseen before that since the pre-Great Recession era. That’s not a warning sign in isolation. It’s a warning sign with Paulson’s voice behind it.
Key Takeaways:
- Who warned: Henry Paulson, U.S. Treasury Secretary 2006–2009 and architect of the 2008 TARP bailout, issued the alert.
- What he said: Paulson described a potential Treasury demand collapse as having “vicious” effects – likening the timing to hitting “the wall” unpredictably due to the “law of economic gravity.”
- What he wants: An emergency “break-glass” or “emergency brake” debt plan ready on the shelf before a crisis materializes.
- Bond market context: 30-year Treasury yields crossed 5% recently; U.S. debt has grown from $10 trillion in 2008 to over $35 trillion by 2025.
- April 2025 precedent: Treasury yields surged sharply amid Trump tariff escalation, defying safe-haven expectations and coinciding with equity sell-offs – a preview of correlated risk-off pressure.
- Crypto transmission channels: Dollar liquidity tightening, risk-off rotation away from speculative assets, and potential cascading liquidations in leveraged crypto positions.
- Pushback: Treasury Secretary Scott Bessent dismissed comparable warnings from JPMorgan CEO Jamie Dimon on June 1, 2025, calling his track record on such predictions poor.
- Watch: 10-year Treasury yield level relative to 4.8% resistance, upcoming Fed communications, and BTC’s correlation to the DXY during any yield spike.
Discover: The best crypto to diversify your portfolio with
Bond News: How a Bond Market Shock Actually Reaches Crypto, and Which Assets Get Hit First
The question isn’t whether Paulson is right about Treasury market fragility. It’s whether crypto trades as a safe haven or a risk asset when it is proven right, and history gives a clear answer, at least in the short run.
A disorderly Treasury sell-off forces dollar liquidity higher as investors dump bonds and demand cash. That dynamic hits leveraged positions first. Crypto markets, where open interest across derivatives venues has been climbing sharply, carry exactly that leverage profile, elevated exposure that becomes a liability the moment dollar funding costs spike.
The April 2025 episode clearly illustrated the mechanism. When Treasury yields surged amid tariff-escalation fears, crypto did not decouple toward safety. It sold alongside equities, in defiance of the digital-gold narrative. Correlation to risk assets held. That’s the bear case in one data point.

Paulson’s specific concern, that demand for Treasuries could collapse suddenly and without obvious warning, governed by what he calls the “law of economic gravity”, implies a non-linear shock rather than a gradual yield drift.
Non-linear shocks are what liquidation cascades are built from. A 10-year yield breaking decisively above 5% with accelerating momentum would be the confirmation threshold worth watching.
Bitcoin Safe Haven or Risk-Off Casualty: What the Bond Stress Means for Crypto Prices
The idea sounds clean. If bonds start losing credibility, capital has to go somewhere, and Bitcoin, with its fixed supply and non-sovereign nature, becomes an obvious alternative, which is why big players keep that thesis in the background.
But the timing is where people get caught.
In a real bond market shock, the first move is not rotation; it is panic, and in that phase, everything gets sold, including Bitcoin, just like what happened in March 2020 when BTC dropped hard before turning higher.

Ethereum and major altcoins are currently at technical inflection points, making them particularly vulnerable to a macro liquidity shock, which could be the deciding factor. ETH does not carry the same hard-money narrative as BTC and would likely underperform in a genuine risk-off episode driven by sovereign debt stress.
Jamie Dimon’s parallel warning, that investor demands for higher Treasury yields could spike mortgage rates independently of Fed policy, reinforces Paulson’s thesis from a different angle. Bessent’s public dismissal of Dimon on June 1 suggests official Washington is not in crisis mode. But bond markets are already pricing something the Treasury Secretary isn’t fully acknowledging.
Discover: The best pre-launch token sales
The post Former Treasury Chief Warns Bond Market Crash Could Hit Crypto Outlook appeared first on Cryptonews.

A California federal judge has cleared Caitlyn Jenner of a class-action push stemming from her JENNER memecoin, ruling that the token does not meet the basic securities requirements under U.S. law. In a Thursday order, U.S. District Judge Stanley Blumenfeld Jr. said the plaintiffs failed to plausibly plead that JENNER tokens were investment contracts because the venture did not pool investor money or use funds to develop a related product or technology.
Defendants stated that “the $JENNER token is a memecoin on the Ethereum blockchain intended solely for entertainment purposes,” and that its value would increase because Jenner would use her fame and influence to promote it, increasing demand. Promotion alone, however, does not establish a common enterprise absent pooling or a structure linking investor fortunes.
The case traces back to November 2024, when a group of JENNER memecoin buyers filed suit against Jenner and her late manager, Sophia Hutchins, alleging an unregistered securities offering and that investors lost thousands as the token’s price collapsed. The plaintiffs claimed that Jenner’s campaign-promised activities and fee mechanics would drive a return for investors. In May 2025, Blumenfeld had already tossed the suit for failure to state a claim, and an amended complaint was filed later that month, led by Lee Greenfield, a UK citizen who said he had invested more than $40,000.
In the amended filing, plaintiffs argued that investors pooled their assets as Jenner promised that once the token reached a market value of $50 million, a 3% transaction fee would fund token buybacks, marketing, donations to a political campaign, and a separate token representing ownership in Jenner’s Olympic gold medal. Blumenfeld pointed out that the amended complaint heavily focused on donations to Donald Trump’s campaign but did not clearly explain how such donations would deliver a financial return to investors. He also noted that the plan to distribute fractional ownership in the gold medal was announced after most purchases and was never executed.
The judge declined to give the class another chance to amend the complaint and indicated that claims tied to contracts and common-law fraud under California law would be more appropriate in state court. The decision leaves the securities-related claims resolved in federal court, while signaling that related state-law claims may proceed separately on different grounds.
JENNER first surfaced on the Solana blockchain via the memecoin creatorPump.fun in May 2024. The project quickly found itself embroiled in controversy after Jenner and other celebrities behind memecoin launches claimed they were allegedly scammed by Sahil Arora, a figure linked to the project’s early promotion efforts. Jenner subsequently relaunched JENNER on Ethereum, a move that investors said diluted the value of the original Solana token, which had peaked at nearly $7.5 million in June 2024 before retreating sharply.
The court’s ruling highlights a central challenge in memecoin litigation: promotional activity alone does not automatically create a securities partnership or an investment contract unless funds are pooled and a plausible path to investor returns can be demonstrated. The decision does not provide a broad endorsement of memecoins as safe investments, but it narrows the legal route for investors who relied primarily on celebrity promotion to claim securities violations.
For investors and builders in the memecoin ecosystem, the ruling reinforces the importance of transparent token mechanics and verifiable fundraising structures. It also underscores that, even in high-profile celebrity launches, the line between entertainment-focused tokens and regulated securities remains a contested frontier—one that regulators continue to scrutinize, particularly as new token categories emerge and promotional campaigns accelerate.
Key takeaways
- The court dismissed the federal securities claims against Caitlyn Jenner in the JENNER memecoin case, ruling the token did not plausibly constitute an investment contract because funds were not pooled and no related product or technology was developed with investor money.
- The decision preserves the possibility that related California-law claims could proceed in state court, though the federal securities case is resolved on the merits for now.
- The amended complaint failed to convincingly connect promised uses of a 3% fee and public donations to tangible financial returns for investors, according to the judge’s order.
- JENNER originated on Solana in May 2024, later migrated to Ethereum after controversies and claims of misrepresentation, with the token peaking at about $7.5 million in mid-2024 before collapsing.
- The ruling underscores that promotional activity alone is insufficient to show a common enterprise or an investment contract; structure and fund flows matter significantly in securities analyses of memecoins.
Context and implications for the memecoin landscape
The ruling arrives at a time of heightened regulatory attention toward memecoins and celebrity-led token launches. While it narrows the scope for investors to pursue federal securities claims in similar cases, it does not absolve promoters from potential liability on other legal grounds. The case illustrates that courts will closely examine whether investor money was actually pooled and whether a credible pathway exists for investors to obtain a financial return, beyond hype and promotional activity.
Looking ahead, observers will watch whether California state courts continue to pursue related contract or fraud theories and how parties might frame future campaigns to balance promotional potential with clear, investor-centric tokenomics. As the ecosystem evolves, the balance between creative branding and legally compliant fundraising remains a central concern for issuers, platforms, and legal counsel navigating a rapidly shifting regulatory environment.
Readers should monitor developments around memecoin regulation, enforcement actions, and any new guidance from U.S. authorities as they analyze cases where celebrity-led launches intersect with traditional securities law principles. The outcome in this case serves as a notable data point in the broader discourse on what constitutes a security in the fast-moving world of blockchain-enabled hype tokens.

US media personality and former Olympian Caitlyn Jenner has escaped a class-action lawsuit after a federal judge ruled her memecoin was not a security under US law.
California federal judge Stanley Blumenfeld Jr. wrote in an order on Thursday that the lawsuit failed to plausibly plead that Caitlyn Jenner (JENNER) tokens were investment contracts, as they didn’t pool investor money or use funds to develop “any related product or technology.”
“Defendants stated that ‘[t]he $JENNER token is a memecoin on the Ethereum blockchain intended solely for entertainment purposes,’ and that its value would increase because Jenner would use her fame and influence to promote it, increasing demand,” the order said.
“Promotion alone, however, does not establish a common enterprise absent pooling or a structure linking investor fortunes,” it added.
A group of JENNER memecoin buyers first sued Jenner and her late manager, Sophia Hutchins, in November 2024, claiming they lost thousands of dollars as the token’s price collapsed and that JENNER was an unregistered securities offering.

Blumenfeld tossed the suit in May 2025 for failure to state a claim, and the group filed an amended complaint later that same month, led by Lee Greenfield, a UK citizen who claimed he lost more than $40,000 investing in JENNER.
The amended complaint had argued that investors had pooled their assets as Jenner promised that once the token reached a market value of $50 million, a 3% transaction fee would fund token buybacks, marketing, donations to Donald Trump’s presidential campaign and a token for ownership in Jenner’s Olympic gold medal.
Blumenfeld wrote that the amended complaint heavily focused on planned donations to Trump, but didn’t explain how investors believed that doing so would provide a financial return to them.
“Nor is it clear that the alleged plan to distribute fractionalized ownership interests in Jenner’s gold medal has any bearing on Greenfield’s claim, since the plan was not announced until August 2024—after the last of his purchases—and was never executed,” he added.
Related: TRUMP whales load up as Mar-a-Lago luncheon approaches
Blumenfeld denied allowing the class group another chance to amend the lawsuit and added that claims regarding contracts and common law fraud under California law were best sent to state court.
JENNER was first launched on the Solana blockchain via the memecoin creator Pump.fun in May 2024. It was soon embroiled in controversy after Jenner and other memecoin launching celebrities claimed they were scammed by Sahil Arora, a claimed collaborator on the tokens.
Jenner relaunched the token on Ethereum, which investors claimed diminished the value of the original Solana token. The token has since essentially lost all of its value after hitting a peak value of nearly $7.5 million in June 2024.
Magazine: Memecoins: Betrayal of crypto’s ideals… or its true purpose?
Crypto World
Solana Price Prediction: SOL Is a Legacy Trap at $79 While AlphaPepe AI DEX Generates Real Traction for Early 1,000x Gains
Solana trades at $79, down 31% year to date and 73% from its January 2025 high of $293. DEX volume collapsed 62% in three weeks. Active traders fell from 4.4 million to 400,000. Meme coin trading crashed 81%. A whale unlocked 1.82 million SOL worth $163 million in a single transaction. The network has never been healthier. Record TPS, Alpenglow upgrade momentum, SEC commodity classification. None of it has moved the price. SOL at $79 with a $47 billion market cap needs $79,000 per token for 1,000x. That is the legacy trap. While SOL grinds against it, AlphaPepe is generating real traction at $0.01494 with $890,000 raised, a live AI DEX, and 1,000x math that requires $15 billion, not $33 trillion.
Why the Solana Price Prediction Is Trapped
The meme economy that powered SOL’s 2024 rally has broken. New token launches on Pump.fun dropped 80% since January. The TRUMP token wiped $2 billion across 800,000 wallets. Stablecoin transfers fell 80%. The four million traders who left took the revenue model with them.
Standard Chartered revised its target from $310 to $250. Resistance between $95 and $105 has rejected every rally. Even the $250 bull case is a 3.2x requiring ETF inflows, a Fed pivot, and a DEX volume recovery with no current momentum behind it. The Solana price prediction is a macro story wearing a network price tag. The macro is not cooperating.
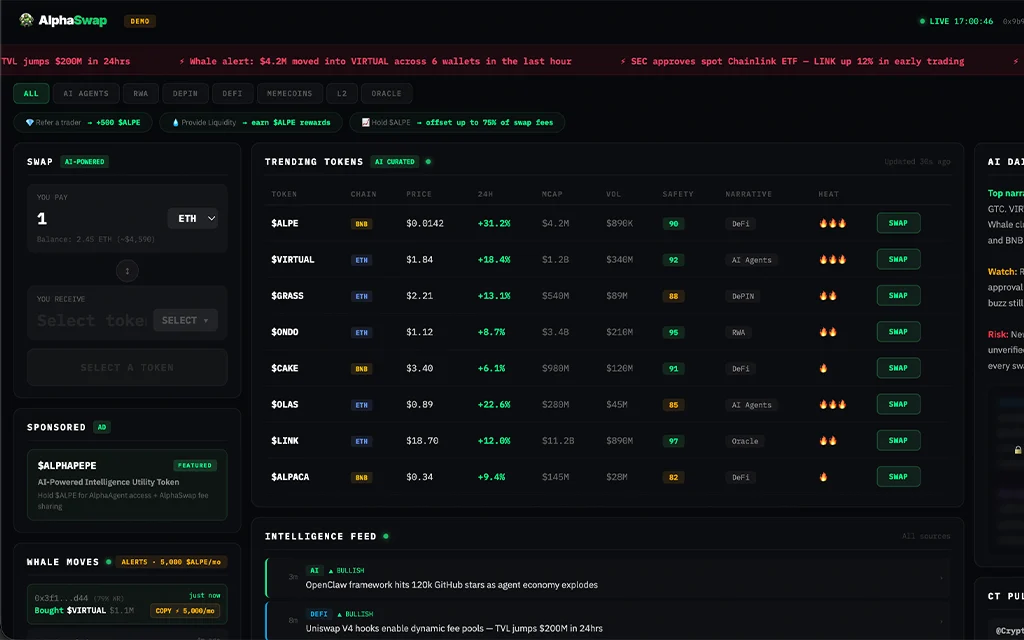
AlphaPepe AI DEX Generates the Traction SOL Cannot Convert
AlphaSwap is doing what Solana’s collapsed DEX economy stopped doing. The AlphaPepe cross-chain AI DEX screens contracts for exploit patterns before users interact, surfaces whale movements across chains, and collects fee revenue today. Not from meme speculation. From infrastructure utility in a category growing at 22.3% annually toward $120 billion.
The developer proved their engineering across 500 million Shibarium mainnet transactions. A 10/10 BlockSAFU audit verified the contract. Supply fixed at 1 billion. Instant delivery. Zero vesting. Stakers earning 85% APR. Q2 DEX launch approaching. Tier 1 CEX follows.
Over $890,000 from 7,700 wallets. 100 new addresses daily. Stage 13 at $0.01494 with the price climbing every few days and jumping when stages fill. A $2,000 entry secures 133,869 tokens. At $1.50 that reaches $200,803. At $3.50 it crosses $468,541. Buyers at $2,000 or above can apply code ALPHA50 for a 50% bonus. SOL needs $47 billion in new capital for a 2x. AlphaPepe needs Q2 for 1,000x.
The Legacy Trap Has a Floor. The Presale Has a Deadline.
SOL will recover when macro turns. The network deserves a higher price. But the Solana price prediction at $79 is capped by a market cap that makes exponential returns impossible. AlphaPepe at $0.01494 with $890,000 raised and a live AI DEX is not capped by anything except the listing date. Stage 13 is filling.
Click To Visit AlphaPepe Official Website To Enter The Presale
FAQs
Why is SOL a legacy trap at $79?
SOL’s $47 billion market cap needs $79,000 per token for 1,000x. DEX volume collapsed 62%, active traders dropped from 4.4 million to 400,000, and the price is down 31% YTD despite record network performance.
How does AlphaPepe generate real traction?
AlphaSwap is a live AI DEX collecting fee revenue with contract screening and whale tracking. Over $890,000 raised across 7,700 wallets at $0.01494.
Is the AlphaPepe presale still open?
Stage 13 at $0.01494 with over $890,000 raised and 7,700 holders. Instant delivery, no vesting, Q2 DEX launch approaching.
Disclaimer: This is a Press Release provided by a third party who is responsible for the content. Please conduct your own research before taking any action based on the content.
Comparing market value SUI Avalanche Pepeto right now reveals something massive. $9.17 million flowed into a presale while AVAX and SUI jump on CME futures news and a South Korean payments deal per CoinGecko. Sui Foundation just confirmed sponsorship of the Hong Kong Web3 Festival on April 20-23.
The wallets that got rich from crypto did one thing: they bought before the crowd noticed. AVAX trades at $9.67 and SUI at $1, but Pepeto already has the exchange built, the listing locked, and 100x written into the math between presale and listing day.
Sui (SUI) trades at $1 with a $4.2 billion cap. Avalanche (AVAX) sits at $9.67 with $4.17 billion. CME Group locks in AVAX and SUI futures on May 4 pending CFTC approval, while Ava Labs signed an MOU with South Korean payment giant NHN KCP on April 14 to build a payments-optimized L1 using Avalanche infrastructure.
The math sits in plain view: two Layer 1s pricing in months of slow institutional buildup, against a presale at six zeros that packs that wait into one event.
Comparing Market Value SUI Avalanche Pepeto Side-By-Side
Pepeto: The Ground Floor That SUI And Avalanche Cannot Reset
SUI and AVAX earned their seats at $4.2 billion and $4.17 billion. But tokens already trading on every exchange rarely deliver the biggest wins. Those land on coins still hidden in presale. Pepeto pulled in $9.17 million because the tools are built and the Binance listing is locked. Tokens already move between Ethereum, BNB Chain, and Solana on the bridge for free.
Trading on PepetoSwap costs zero. Not Uniswap’s 0.3%, flat zero. The full bag stays intact from entry to exit. While listing day pulls closer, 182% APY rewards stack tokens into every wallet daily, which means the supply that reaches the market on day one shrinks while demand lands against a thinner float.
Why Smart Money Fills The Presale While Layer 1s Consolidate
The valuation gap puts the case on the table. The presale market cap looks tiny next to either coin, and that gap is the entire opportunity. The engineer who built Pepe and watched it touch $11 billion built every tool here. SolidProof signed off before any wallet entered. At $0.0000001865 you are buying ahead of the chart even existing.
The moment trading opens, that price is gone. Every BNB winner and every OKB holder shares one story: they bought when nobody was looking. Pepeto is that story right now, and the only thing between the wallets that win and the ones that regret is whether you move while the door is still cracked open.
Sui (SUI) Price At $1.00 As Hong Kong Web3 Festival And CME Futures Build Bullish Pressure
Sui (SUI) trades at $1.00 per CoinMarketCap with a $4.2 billion cap, holding the $0.80 to $1.0 range that flagged a breakout last week. Sui Foundation locked in sponsorship of the Hong Kong Web3 Festival on April 20-23, and CME futures activate May 4. Sui Stack (S2) rolls out this year with free stablecoin transfers.
Changelly targets $1.25 for May, about 23% from here. Support at $0.95, resistance at $1.10. The strongest near-term call lands short of what a presale paired with one listing event delivers.
Avalanche (AVAX) Price At $9.67 As NHN KCP Deal And Spot ETF Filings Build Demand
Avalanche (AVAX) holds $9.67 per CoinMarketCap with $4.17 billion in market cap and the spot AVAX ETF (VAVX) live since January with staking baked in. NHN KCP signed the payments L1 MOU on April 14, RWA TVL on Avalanche doubled to $2.1 billion since April 2025, and 80+ subnet chains run on the network.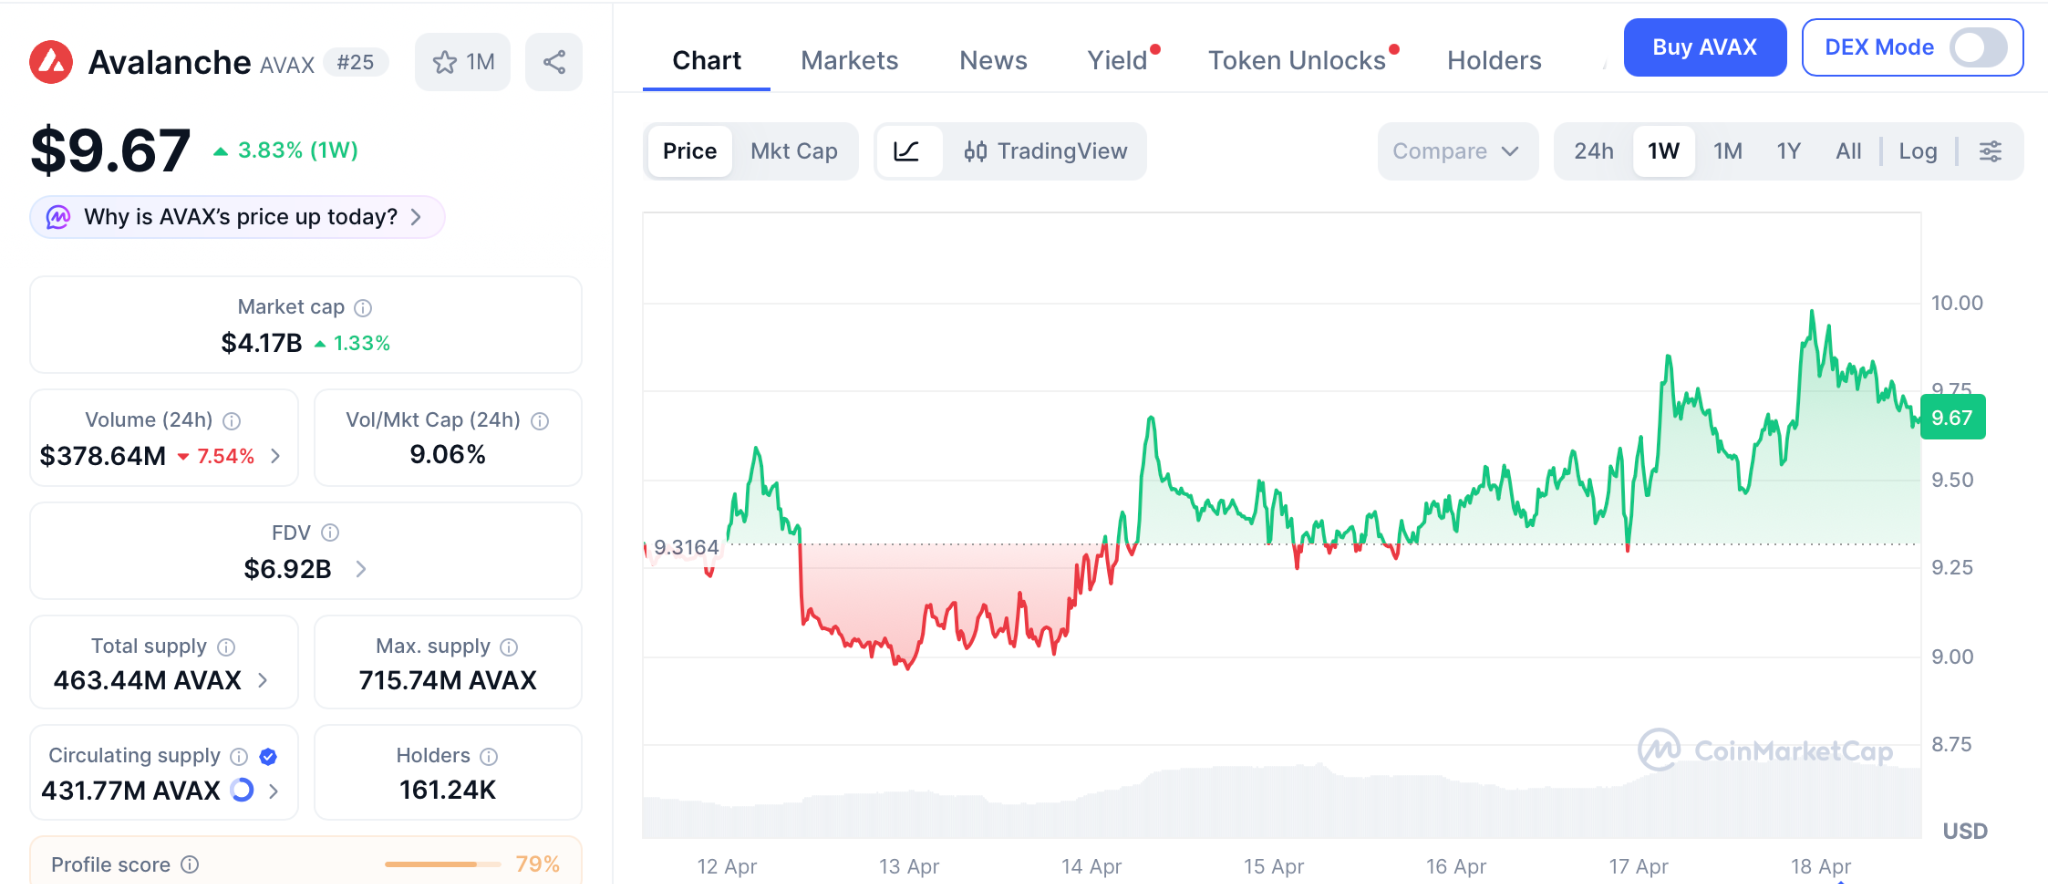
Support at $9.65, resistance at $13. Marzell Crypto flagged $34 once the trendline cracks, a 230% move on an unknown timeline. The presale floor moves on listing day.
Closing Thoughts
Comparing market value SUI Avalanche Pepeto makes the call straightforward. SUI at $4.2 billion and AVAX at $4.17 billion give you safer plays with single-digit upside on a multi-month view. Pepeto gives you a working exchange, a confirmed listing, and a presale price that neither of them will ever see again.
Every BNB winner bought when the name was still unknown, and the Pepe cofounder cracked that exact window again on the Pepeto presale entry. Six months down the road you either hold the position that changed everything, or you replay this entry in your head for the rest of the year while the numbers sit in plain view.
Click To Visit Pepeto Website To Enter The Presale

FAQs
How does comparing market value SUI Avalanche Pepeto help investors?
The comparison reveals the upside gap. SUI at $4.2B and AVAX at $4.17B cap near 23% to 230% over months, while Pepeto targets 100x from one Binance listing event.
Is Sui (SUI) a stronger buy than Pepeto right now?
No, Pepeto at presale pricing prints listing returns SUI cannot match at $4.2 billion. Sui (SUI) trades at $1 with CME futures launching May 4, capping near-term upside under 25%.
Disclaimer: This is a Press Release provided by a third party who is responsible for the content. Please conduct your own research before taking any action based on the content.
TLDR:
- An attacker drained 116,500 rsETH worth $292M from Kelp DAO’s LayerZero-powered bridge in one attack.
- Stolen rsETH was deposited on Aave, Compound, and Euler as collateral to borrow ETH, creating bad debt.
- Kelp DAO paused rsETH contracts on Ethereum mainnet and multiple L2s while coordinating with security experts.
- Over $600M was stolen from more than 10 DeFi protocols in two weeks, with AI accelerating hacker capabilities.
Kelp DAO suffered a major security breach involving its LayerZero-powered rsETH cross-chain bridge. The attacker drained 116,500 rsETH tokens worth approximately $292 million from the protocol.
The stolen assets were then used as collateral on major lending platforms to borrow ETH. Kelp DAO paused rsETH contracts across the Ethereum mainnet and several Layer 2 networks amid the crisis.
Security experts from multiple organizations quickly joined the investigation as it got underway.
How the Kelp DAO rsETH Bridge Exploit Unfolded
The attacker targeted the LayerZero bridge within Kelp DAO’s cross-chain system. Some 116,500 rsETH tokens were drained during the attack.
The stolen funds were transferred to lending platforms including Aave, Compound, and Euler. There, the attacker used rsETH as collateral to borrow ETH, creating bad debt across those protocols.
Kelp DAO confirmed the breach through its official X account that day. The protocol stated it had identified suspicious cross-chain activity involving rsETH.
Contracts were paused across mainnet and several Layer 2 networks accordingly. The team coordinated with LayerZero, Unichain, auditors, and security experts on root cause analysis.
Aave and several protocols froze or paused rsETH-related markets in response. This step aimed to limit further losses across affected platforms.
The AAVE token fell to $99.60 amid reports of growing bad debt from the exploit. Activity in impacted markets slowed as users closely tracked the situation.
Kelp DAO advised users to rely solely on its official handle for accurate updates. No attacker was publicly identified while investigations remained active.
Multiple security firms assisted Kelp DAO’s internal team throughout the analysis process. The full breach scope had not been confirmed at the time of reporting.
$600 Million Stolen From DeFi Protocols in Two Weeks
The Kelp DAO breach came amid a broader wave of DeFi attacks in April 2026. Over $600 million was stolen from more than 10 protocols in two weeks.
Analyst Jeremy noted that AI is helping hackers execute attacks more efficiently. He identified the Kelp DAO incident as the year’s biggest DeFi hack.
Drift Protocol also lost $285 million to North Korean hackers using AI-powered social engineering. Those hackers spent months building insider trust before striking.
Once positioned, the full attack unfolded in just 12 minutes. Rhea Finance separately lost $18 million through fake token pools that misled its oracle into approving withdrawals.
Further incidents targeted Grinex, Hyperbridge, Aethir, Dango, and Silo Finance. Grinex, a sanctioned Russian exchange, lost $15 million before suspending all operations.
An attacker on Hyperbridge minted one billion fake bridged DOT tokens notionally worth over $1 billion. However, thin liquidity meant only around $237,000 was actually extracted.
CoW Swap and Zerion were also hit in the same two-week stretch. CoW Swap’s frontend was hijacked through a DNS attack that led users to a phishing page.
Zerion suffered credential theft through North Korean social engineering. The pattern across all these attacks reflects an expanding threat to the broader DeFi sector.
Kim Kardashian’s ‘Seven-Figure Consequence’ Warning To Ray J
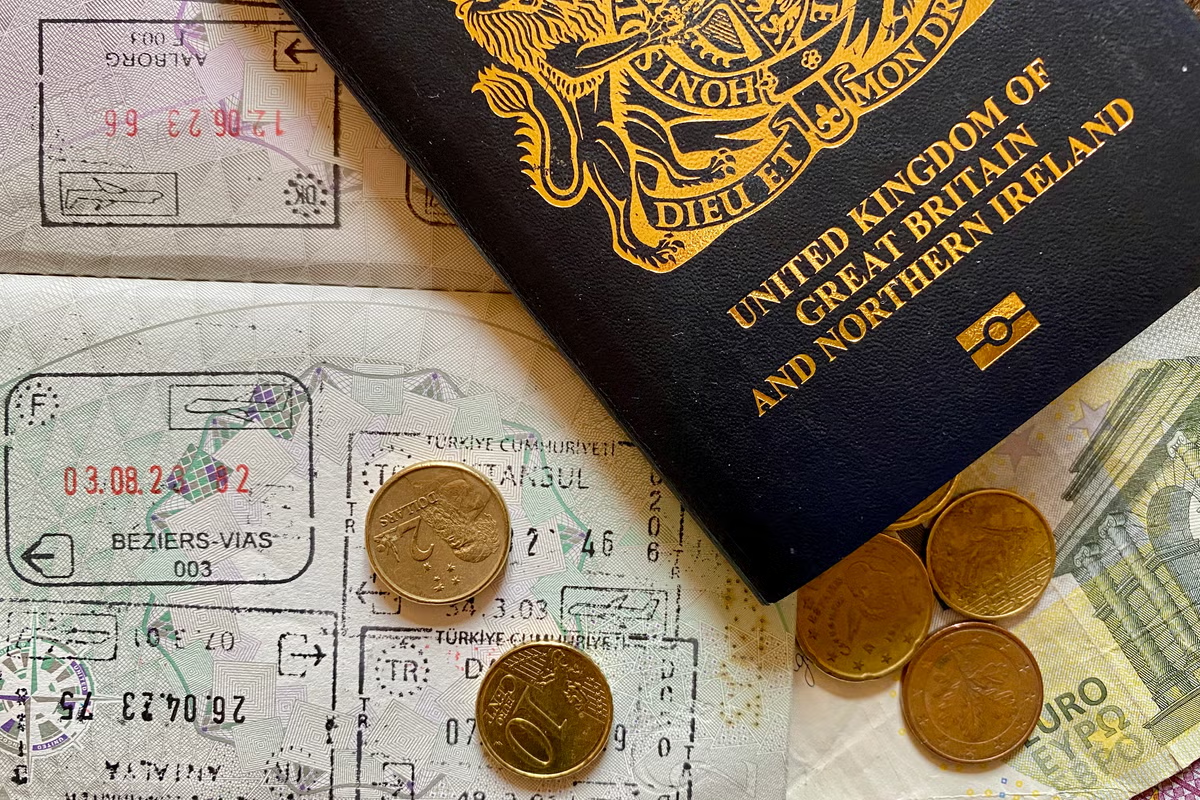
What does the EU’s new entry-exit system mean for British travellers?
Market Trading Guide: Buy Shipping Corporation and Power Grid on Monday for short-term gains of up to 29%


-
 NewsBeat6 days ago
Pep Guardiola and Gary Neville agree over Arsenal title problem that benefits Man City
-

 Crypto World6 days ago
The SEC Conditionalises DeFi Platforms to Be Avoided for Broker Registration
-

 Politics7 days ago
World Cup exit makes Italy enter crisis mode
-

 Fashion2 days ago
Weekend Open Thread: Theodora Dress
-

 Crypto World5 days ago
SEC Signals Exemption for Crypto Interfaces From Broker Registration
-

 News Videos4 days ago
Secure crypto trading starts with an FIU-registered
-

 Sports2 days ago
NWFL Suspends Two Players Over Post-Match Clash in Ado-Ekiti
-

 Crypto World5 days ago
SEC Proposes Certain Crypto Interfaces Don’t Need to Register as Brokers
-

 NewsBeat5 days ago
Trump and Pope Leo: Behind their disagreement over Iran war
-
 NewsBeat7 days ago
JD Vance announces ‘no agreement’ with Iran over nuclear weapons fear
-

 Politics1 day ago
Palestine barred from entering Canada for FIFA Congress
-

 Crypto World1 day ago
Russia Pushes Bill to Criminalize Unregistered Crypto Services
-

 Sports6 days ago
NWFL opens Pathway for new Clubs ahead of 2026 Season
-
Sports7 days ago
Dexter Lawrence, Stefon Diggs, Trading for De’Von Achane
-

 Crypto World6 days ago
Trump whales load up ahead of Mar-a-Lago luncheon.
-
 Business2 days ago
Creo Medical agree sale of its manufacturing operation
-
Business6 days ago
Kering slides after Morgan Stanley downgrade, Gucci woes loom
-
Crypto World6 days ago
Sei Network Enters Quiet Reset Phase as On-Chain Metrics Signal a Slowdown in 2026
-

 Tech6 days ago
Google adds E2E encryption to Gmail for iOS and Android enterprise users
-

 Tech6 days ago
Apple glasses won’t go brand shopping like Meta did with Ray-Ban and Oakley
You must be logged in to post a comment Login