
Crypto World
BitMine Faces $7B Unrealized Loss as Ethereum Slides Below $2,100


BitMine Immersion Technologies, the Ethereum-treasury company led by Fundstrat’s Tom Lee, is facing intensifying pressure after a sharp drop in ether prices pushed the firm deep into unrealized losses. As of Feb. 5, Ethereum fell to a local low of $2,092, leaving BitMine’s holdings of roughly 4.285 million ETH with a paper loss exceeding $7 billion, -45% on its holdings.
The company pivoted from Bitcoin mining to an aggressive “Ethereum-first” treasury strategy last summer, accumulating ETH at an estimated average cost between $3,800 and $3,900. With ETH now trading more than 50% below its August 2025 all-time high of $4,946, BitMine’s once $8.4 billion portfolio is significantly underwater, placing it at the center of one of crypto’s largest single-asset corporate bets.
BitMine and Strategy Both Under Water as Bear Market Deepens
The market reaction has been swift. BMNR shares have fallen alongside ETH, reviving comparisons with Michael Saylor’s Bitcoin-focused firm, Strategy (MSTR). However, both companies are now under pressure. Strategy is currently sitting on an unrealized loss of roughly $2.70 billion on its Bitcoin holdings, based on an average purchase price of $76,052 and a current BTC price near $70,500. MSTR shares are down about 9% in the past eight hours, erasing roughly $3.7 billion in market value.
While BitMine’s losses are larger in absolute terms, analysts note that both firms highlight the risks of concentrated treasury strategies tied to volatile crypto assets.
Tom Lee Stays Bullish Despite Drawdown
Despite the “eye-watering” figures, Tom Lee remains publicly undeterred. Earlier this week, Lee described the drawdown as “a feature, not a bug,” arguing that Ethereum’s long-term fundamentals remain intact. He pointed to record daily transactions of around 2.5 million and rising active addresses as evidence that network usage is diverging from price action.
Lee attributed recent weakness to a post-October deleveraging cycle and capital rotation into precious metals. BitMine has continued to double down, recently adding another 41,000 ETH to its balance sheet, even as the Ethereum-treasury narrative faces its most severe stress test to date.
The post BitMine Faces $7B Unrealized Loss as Ethereum Slides Below $2,100 appeared first on Cryptonews.


Bitcoin changed hands near $73,996 during Monday’s Asian trading session, down 2.5% over the past 24 hours. The decline tracked a weekend escalation in the Gulf, where US forces boarded an Iranian vessel Sunday.
Risk assets broadly weakened as Wednesday’s ceasefire deadline loomed, with fresh military friction eroding hopes for de-escalation.
Ship Seizure Raises War Escalation Fears
The US destroyer USS Spruance disabled the engine room of the Iranian-flagged cargo ship Touska after six hours of unheeded stop orders. Tehran’s joint military command labeled the boarding unlawful and pledged a direct response against US naval assets. Sunday’s capture was the first since Washington began enforcing its port blockade one week ago.
Crude futures jumped on the incident, as traders priced in a longer chokehold on Gulf shipping lanes. About one-fifth of the world’s seaborne oil normally transits the strait, which has been mostly idle. Iran’s Supreme National Security Council stated that traffic controls would stay in place until hostilities conclude.
A US team led by Vice President JD Vance is due in Islamabad on Monday for renewed negotiations. Special envoys Steve Witkoff and Jared Kushner will reportedly return for round two after last weekend’s marathon session. Tehran’s state broadcasters cast doubt on whether Monday’s sit-down would proceed, citing fresh grievances with Washington.
The US president also warned of strikes on Iran’s entire power grid and bridge network if terms are refused. Despite Sunday’s slide, Bitcoin remains 4.3% higher over the past seven days, keeping the weekly uptrend intact.
Traders Eye Wednesday Truce Expiry
Daily action swung between $73,886 and $76,165, with the sharpest pressure arriving early Monday in Asia. Total market value held around $1.48 trillion while turnover hovered near $62 billion during the same window.
Market focus shifts to Wednesday’s truce deadline, a pivot point that could sharpen the tone across risk assets. If diplomacy stalls, additional US operations appear likely, potentially extending the pressure on digital assets and equities.
The post Bitcoin Slips Below $74K as US Navy Strikes on Iranian Ship appeared first on BeInCrypto.

TLDR:
- ETH moved between $2,200 and $2,500 as liquidation zones triggered sharp price reversals
- Heavy leverage clusters near $2,200 and $2,480 continue shaping short-term ETH volatility patterns
- The failed breakout near $2,450 led to renewed downside pressure toward lower liquidity support zones
- Despite price weakness, Ethereum recorded over 200M transactions, showing strong network activity
Ethereum traded within a volatile range as liquidity clusters shaped short-term price action. Recent data showed weakening momentum after a failed breakout, while on-chain activity reached record levels despite a challenging first-quarter performance.
Liquidation Clusters Drive Short-Term Price Movement
Ethereum’s recent structure reflects a liquidity-driven market rather than a sustained directional trend. Price initially climbed from the $2,200 zone toward $2,380 before entering a tight consolidation phase.
A brief breakout near $2,450 followed, but momentum faded quickly, leading to a controlled decline toward the $2,300 range.
A market update shared by Ted Pillows pointed to heavy liquidation clusters influencing price behavior. The tweet noted that Ethereum appeared weak, with long liquidation zones concentrated near $2,200.
It also identified short-side liquidity between $2,450 and $2,480 as a potential final upward move before rejection.
The heatmap data showed bright zones where leveraged positions were concentrated. These levels often attract price movements as the market seeks to trigger liquidations.
Strong resistance formed between $2,480 and $2,520, where the price faced immediate rejection. Meanwhile, support zones between $2,280 and $2,320 acted as a near-term magnet.
As the price moved lower, long positions began to unwind. This shift aligned with the broader pattern of liquidity sweeps between key levels.
The range between $2,300 and $2,450 remained active, with repeated moves targeting both sides of the market.
Strong Network Activity Contrasts Price Weakness
While price action remained under pressure, Ethereum’s network activity expanded sharply. The network recorded over 200 million transactions during the first quarter of 2026.
This marked one of the highest usage periods despite the asset’s 32 percent decline during the same timeframe.
At the same time, ecosystem developments continued to build. Ethereum Name Service integrated with PayPal, enabling users to send funds using simplified name-based addresses. This update aimed to improve accessibility for mainstream users interacting with blockchain systems.
Security and decentralized finance infrastructure have also advanced. Safe introduced a beta version of its wallet designed to act as a pre-execution security layer. In parallel, Silo Finance launched its V3 upgrade, focusing on improved lending safety within decentralized markets.
Looking ahead, price scenarios remain tied to key liquidity levels. A hold above $2,280 could allow a move back toward $2,400 and higher resistance zones. However, a breakdown below this level may lead to a sweep toward $2,200, where deeper liquidity sits.
Market conditions continue to show a balance between technical pressure and underlying network growth. As a result, price action remains sensitive to leveraged positioning, while broader adoption trends develop in the background.

TLDR:
- Changpeng Zhao confirmed he does not know Satoshi Nakamoto’s identity during a recent interview discussion.
- CZ stated he would not reveal Satoshi’s identity even if known, maintaining a consistent long-term stance.
- He explained that anonymity helps Bitcoin avoid central authority and maintain its decentralized structure.
- CZ noted that Satoshi’s absence allows Bitcoin to operate without influence from a single individual.
Changpeng Zhao addressed long-standing curiosity about Bitcoin’s creator during an April 9, 2026, interview. Speaking on the TBPN Channel, he stated he does not know the identity of Satoshi Nakamoto and would not reveal it if known.
CZ Maintains Distance From Satoshi Identity Debate
Changpeng Zhao, founder of Binance, addressed one of crypto’s oldest questions during the interview. He confirmed he does not know Satoshi Nakamoto’s real identity. He also made clear he would not disclose such details even if he had access.
A widely shared post captured his remarks during the interview session. In the clip, CZ reiterated his position calmly and without hesitation.
The statement quickly circulated across crypto communities, drawing attention to his consistent stance on the topic.
He explained that curiosity about Bitcoin’s creator exists across the industry. However, he stressed that uncovering the identity could create unnecessary risks. According to CZ, anonymity has played a key role in Bitcoin’s growth and resilience.
He further noted that Bitcoin operates without reliance on a central figure. This structure, he said, has helped maintain trust in the network. As a result, he sees no reason to pursue the identity question actively.
Anonymity Seen as Core to Bitcoin’s Structure
CZ emphasized that Bitcoin’s decentralized nature remains closely tied to its anonymous origins. He explained that a known founder could attract unwanted attention or influence. That scenario could shift how the network is perceived and governed.
He pointed out that Satoshi Nakamoto’s absence removes any central authority figure. This absence, in turn, allows Bitcoin to function without leadership pressure. It also prevents decisions from being tied to one individual’s influence.
During the discussion, CZ made it clear that he does not intend to investigate further. He described the search for Satoshi’s identity as unnecessary for Bitcoin’s continued operation. Instead, he focused on the system’s design and independence.
He added that Bitcoin’s strength lies in its open and distributed framework. Without a visible founder, the network avoids personality-driven narratives. This structure supports its position as a decentralized financial system.
CZ’s comments align with a broader view held by many in the crypto space. The unknown identity of Satoshi Nakamoto remains one of Bitcoin’s defining characteristics. For CZ, preserving that mystery remains aligned with maintaining the network’s original structure.

BlackRock pulled $505 million into its iShares Bitcoin Trust across two April sessions, the biggest haul since early March. That scale of buying in a slow macro window says real money is already positioning before retail even opens a chart. Against that backdrop, Pepeto is drawing attention on the meme coin exchange layer of the market.
The presale has crossed $9.2 million raised and the token keeps landing on watchlists alongside the latest Bitcoin price news for 2026.
Morgan Stanley launched MSBT this April and delivered the strongest first day for any of its ETFs on record, according to Bitcoin Magazine. Across the same window, BlackRock’s IBIT pulled $505 million in two sessions, per Crypto Briefing.
The combination puts bank distribution firmly behind Bitcoin, and fresh capital is rotating into early entries as the overflow spreads. Money flowing this steady during a quiet macro window reads like slow motion buying by the biggest wallets on the board.
Two Names Worth Watching This April: Pepeto and Bitcoin
Pepeto Could Mirror Bitcoin’s Early Run Ahead of the Binance Listing
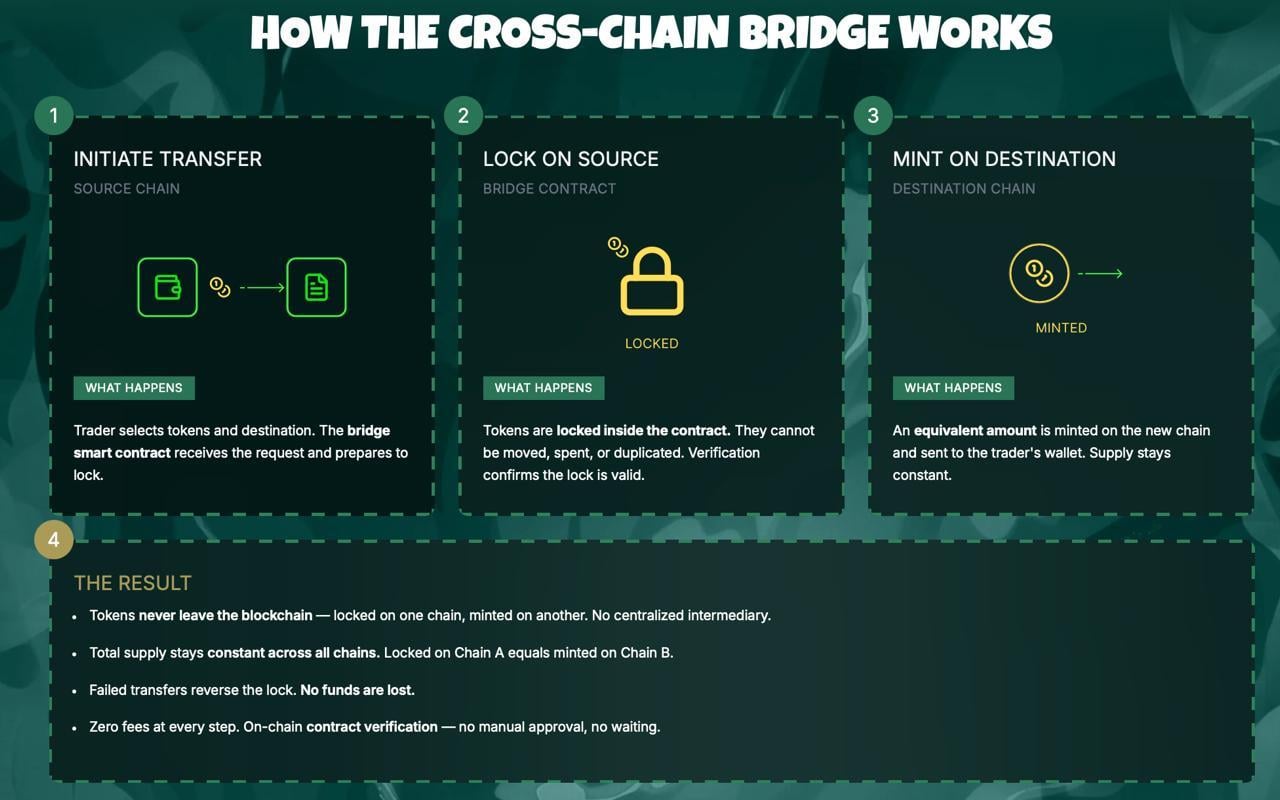
Right now, serious money in crypto is moving toward projects that already ship working products. BlackRock’s IBIT flow this week backs the same pattern, that capital rewards platforms actually building rather than publishing pitch decks. While big exchanges focus on expanding market infrastructure, Pepeto targets the meme coin trading layer with a zero fee exchange and a cross chain bridge live today.
The Pepeto presale has pulled more than $9.2 million and the token sits at $0.000000186 ahead of the Binance listing. A built in risk scorer checks every contract wallets interact with against known attack patterns, helping new buyers avoid the scams that emptied bags during the last meme cycle.
Auditors at SolidProof cleared every piece of the contract stack, a Binance alum drives the engineering side, and the founder who put the original Pepe into the market is at the head of this operation. That team previously drove a token with no working utility up to an $11 billion valuation, and this round a functional exchange is attached before the listing even prints.
Experienced buyers know the biggest returns come from entering before the broader wave shows up. Early buyers in Bitcoin captured that dynamic long before mainstream headlines caught on, and many investors are paying the same attention to Pepeto now. A 150x move matches what Pepe proved once, only this time a live exchange, clean audit, and Binance listing sit in the queue. The people who move during fear own the supply the late crowd pays up for.
BTC Price Prediction: Bitcoin Tests $75.143 With $80K in Range
Bitcoin broke through $75.143 this week according to CoinMarketCap as the Iran tension eased and oil rolled over, and technicals now point at $80,000 as the next zone, per Intellectia analysis. BlackRock IBIT ended Q1 with $54 billion in assets and captured roughly $8.4 billion in net inflows for the quarter.
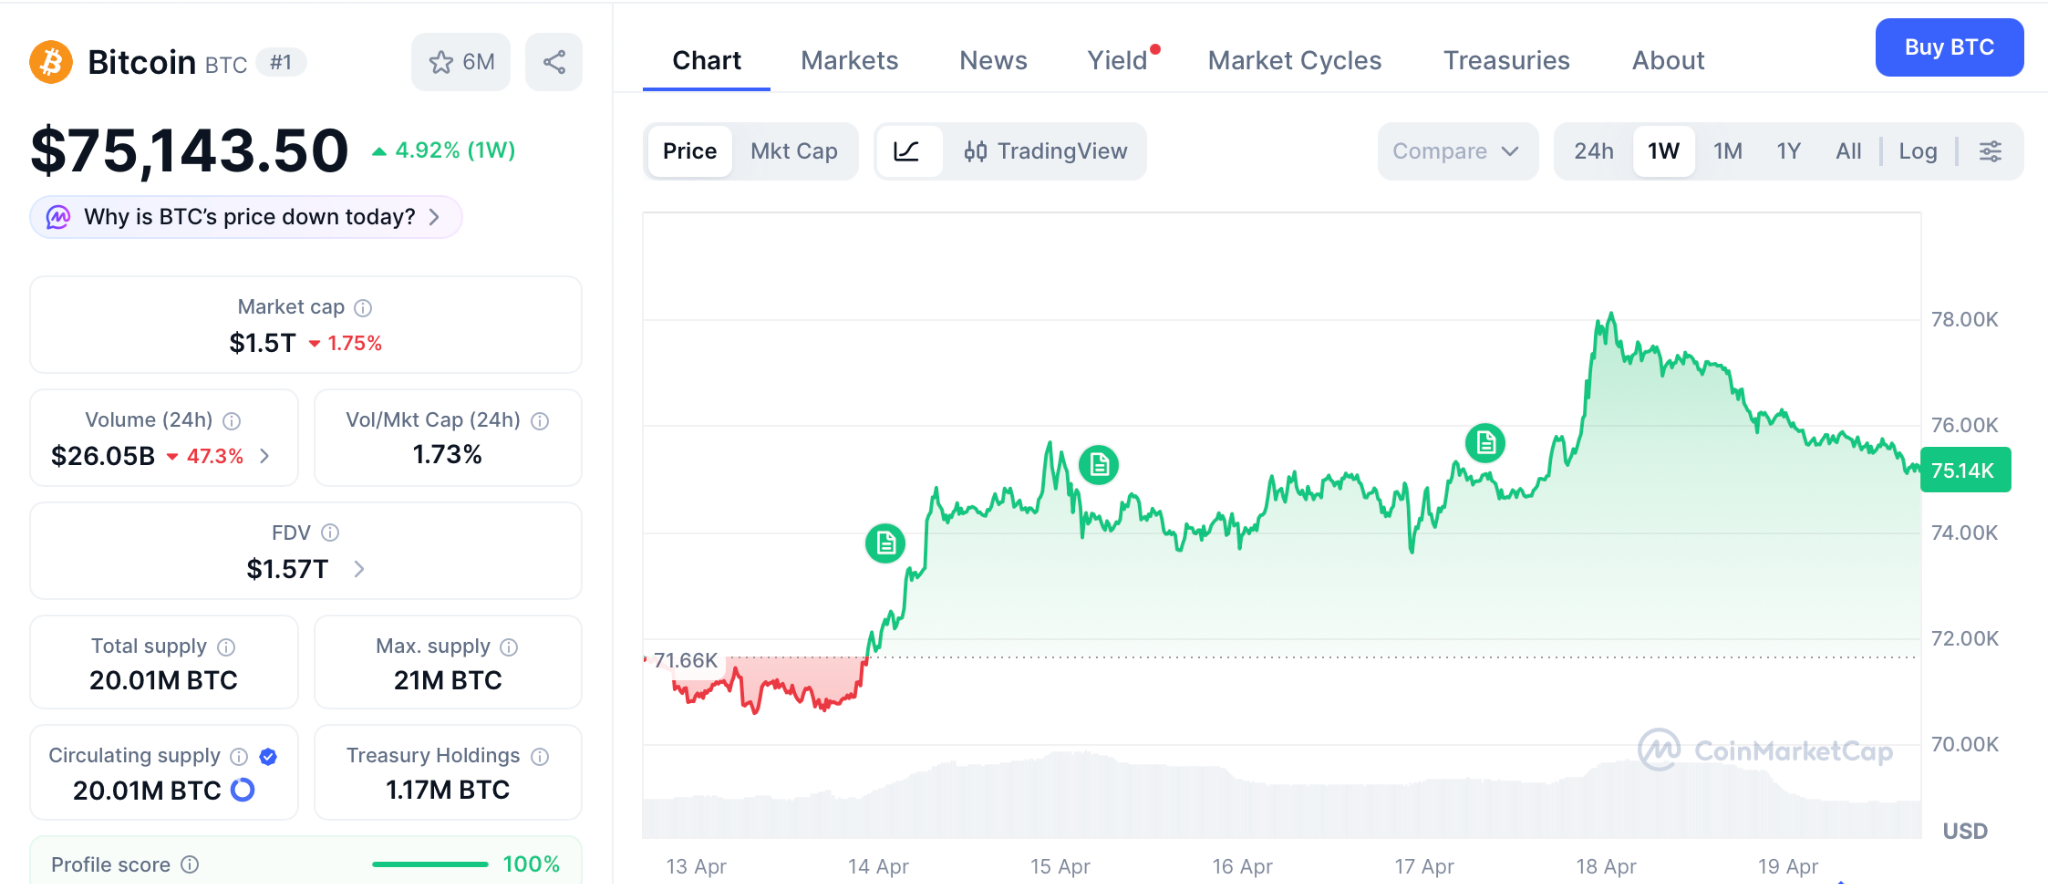
Wallets holding 10,000 to 100,000 BTC have been quietly adding, and ETF holdings now sit near $96 billion across the category. A break above $78,000 opens a path to $80,000 and eventually the $97,000 prior cycle peak.
Failure at $75,143 keeps the range tight between $70,000 and $78,000 while the Fed decision weights. Either way, Bitcoin’s next 2x takes months, which is the same window a 150x presale can close in days.
Conclusion
Retail watches the latest Bitcoin price news hoping for a quick 10% off ETFs, and BlackRock’s $505 million IBIT buy gave them reason to stare. But the setup that produced every early buyer story in crypto looks nothing like a large cap grinding from $75K to $80K.
It looks like an entry today on a token with a working exchange, a clean audit, and the same founder who took Pepe from nothing to $11 billion with zero products.
The same setup minted early SHIB and Pepe millionaires in the last run, and wallets buying Pepeto through the Pepeto official website today walk out of the Binance listing holding the same returns.
Click To Visit Pepeto Website To Enter The Presale

FAQs
Why is institutional activity important for the latest Bitcoin price news?
BlackRock IBIT pulled $505 million this week while Morgan Stanley’s MSBT posted its best ETF debut, keeping structural demand under the Bitcoin price news cycle.
How does the Binance listing affect the Pepeto path from here?
The listing opens Pepeto trading to the biggest exchange audience in the world, and the current entry price at the Pepeto official website closes the moment it prints.
What signals are traders watching for the next Bitcoin move?
Traders track ETF flows, whale wallets, and the $80,000 resistance, which together shape whether BTC breaks out or ranges through the Fed window.
Disclaimer: This is a Press Release provided by a third party who is responsible for the content. Please conduct your own research before taking any action based on the content.

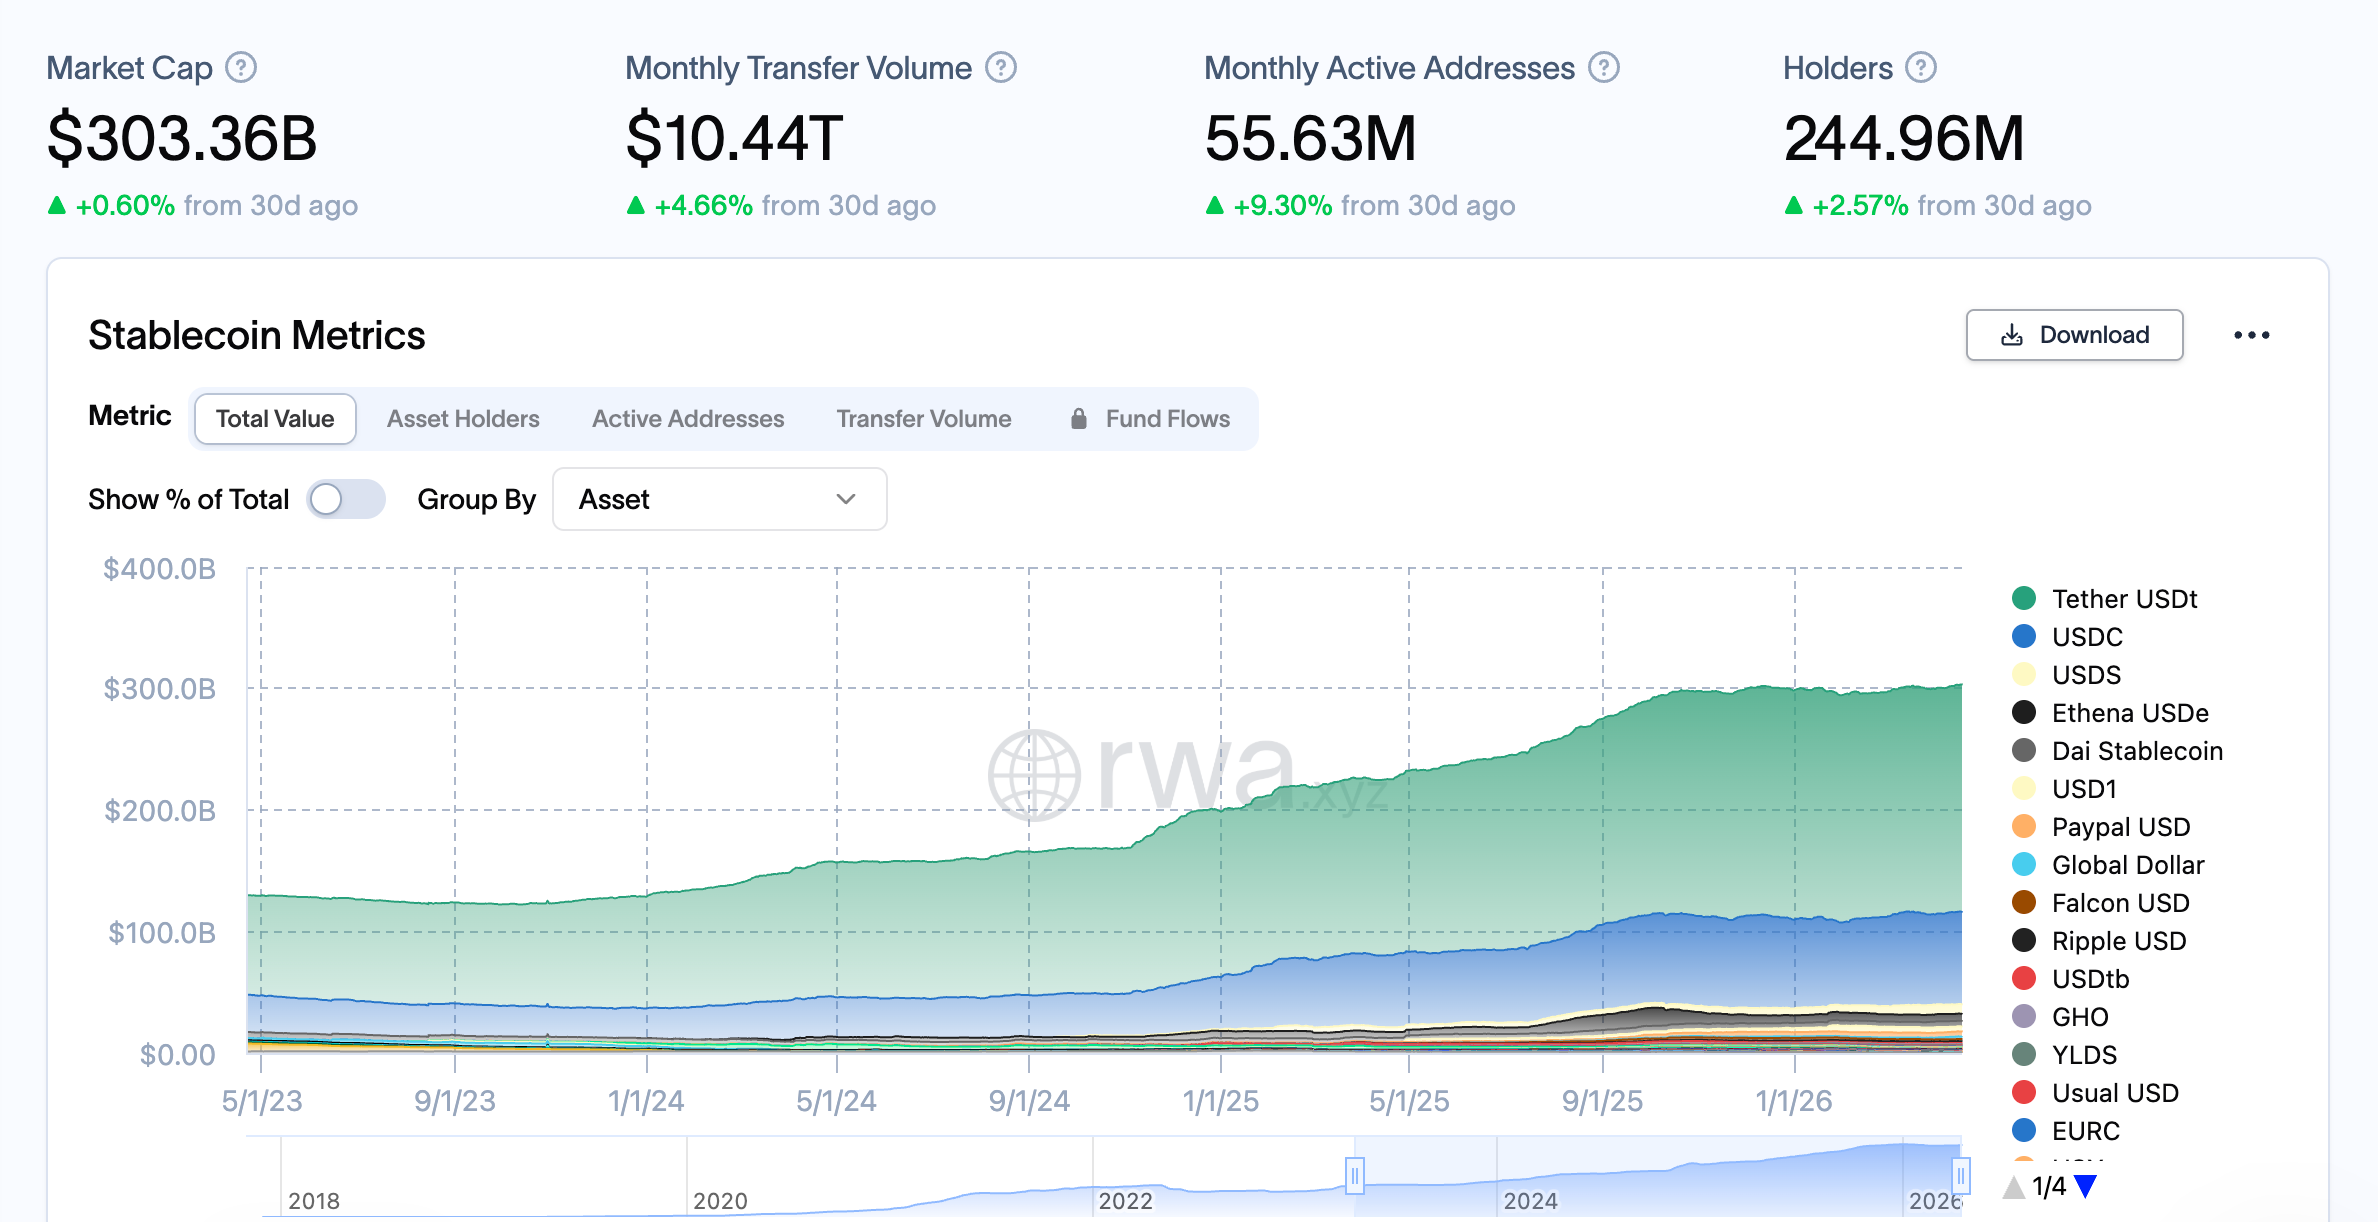
The banking sector’s exposure to stablecoins remains modest for now, but analysts say the landscape could tilt as the sector of stablecoins and tokenized real-world assets (RWAs) swells in market size. While adoption is still evolving, the on-chain payments and cross-border use cases are broadening, potentially reshaping how traditional banks compete with a new class of digital assets.
According to Abhi Srivastava, associate vice president of Moody’s Investors Service Digital Economy Group, the stablecoin market capitalization exceeded $300 billion by the end of last year. Cointelegraph’s coverage highlights that figure as a marker of rapid growth, even as everyday usage lags behind headline numbers. (Source: Cointelegraph)
Srivastava noted that the role of stablecoins in payments, cross-border commerce, and on-chain finance is expanding, even as today’s U.S. payment rails remain fast, low-cost, and trusted. He argues that near-term disruption risk to banks appears limited, particularly given policy constraints that currently bar yield-bearing stablecoins from paying yields—meaning they are unlikely to replace traditional deposits domestically in the near term.
Nonetheless, the report suggests that sustained growth in stablecoins and tokenized RWAs could exert pressure on banks over time, potentially driving deposit outflows and constraining lending capacity as more financial assets migrate onto the blockchain or into tokenized forms.
The policy debate around stablecoins has become a focal point for crypto executives and bankers alike, especially as concerns grow that yield-bearing stablecoins could erode traditional banking market share. This tension is playing out in broader regulatory discussions in Washington, where the CLARITY Act—officially the Digital Asset Market Clarity Act of 2025—seeks to deliver a formal taxonomy and regulatory oversight for crypto markets. Source: Cointelegraph.
CLARITY Act stalled, as banks push back on yield-bearing stablecoins
The CLARITY Act aims to establish a comprehensive framework for digital assets, including asset taxonomy and regulatory jurisdiction. It has stalled in Congress after a coalition of crypto companies, led by Coinbase, publicly opposed earlier drafts, citing concerns over open-source software protections and a prohibition on yield-bearing stablecoins. The clash underscores a broader negotiation between the crypto industry and the banking lobby over how far regulators should go in defining and controlling digital-asset activities.
Lawmakers and the White House have pursued negotiations to bridge the gap, but concrete compromises remain elusive. Earlier this month, North Carolina Senator Thom Tillis signaled plans to release an updated draft proposal that could address concerns from both sides; Politico reports the plan exists, though no public draft has been released at this time. Source: Politico.
Analysts warn that a failure to pass a clear regulatory framework could invite renewed or stricter regulatory crackdowns on the crypto sector in the years ahead. With the CLARITY Act at a critical juncture, market participants are watching not only its fate but also how lawmakers weigh stability, innovation, and consumer protection in a rapidly evolving ecosystem. For some observers, the risk is not only about a single bill failing to pass but about the signaling effect of regulatory gridlock on market development and institutional participation.
What to watch next for stablecoins and market structure
As the debate progresses, investors and builders should monitor how stablecoins evolve in payments and cross-border use, and how tokenized RWAs intersect with traditional banking services. The outcome of the CLARITY Act negotiations, along with any new proposals from lawmakers such as Tillis, will influence not just compliance requirements but the pace at which banks and fintechs collaborate or compete with on-chain financial instruments. The broader question remains: will a clear regulatory framework unlock wider institutional adoption of stablecoins, or will it slow the pace of innovation through tighter restrictions?
Readers should stay attuned to updates from Congress and major industry voices, as the balance between fostering innovation and ensuring financial stability will shape the trajectory of stablecoins, RWAs, and the crypto market’s interaction with traditional banking in 2025 and beyond.
What remains uncertain is how quickly a consensus will emerge on yield-bearing stablecoins and related products, and how any new framework will translate into practical rules for exchanges, issuers, and users. The coming weeks could offer critical signals about the sector’s path and the readiness of policymakers to align on a shared approach to digital assets.


New York has some of the most robust press protection laws in the country. These give defendants like the Wall Street Journal (WSJ) the right to challenge a lawsuit early and get it thrown out before it becomes costly and drawn out.
Though the move may seem counterintuitive, it could be entirely deliberate. Binance may be signalling that it welcomes scrutiny and has nothing to hide. The move appears designed to send a clear message to those who hold assets on its platform that the exchange will fight back even at the risk of what a full legal proceeding might expose.
Binance Takes the Wall Street Journal to Court
In February, the WSJ published an investigation claiming that Binance dismissed employees who had raised concerns about more than one billion in crypto transactions linked to sanctions against Iranian actors.
Two weeks later, Binance filed a defamation lawsuit against Dow Jones & Company, the publisher of the WSJ, in the Southern District of New York. The exchange claimed the newspaper had published at least 11 false statements in its February report.
The lawsuit was surprising. In general, defamation lawsuits are extremely difficult to prove. Given that this case involves a public figure like Binance and a respected newspaper like the WSJ, there’s a heightened standard of actual malice.
“For defamation to be shown, it can’t just be that parts of the story were false,” said Khurram Dara, an attorney and former policy advisor at Bain Capital Crypto and Coinbase, in a recent BeInCrypto podcast. “[The WSJ] had to have known at the time of publication that there was false information, or they would have had to have reckless disregard for the truth or falsity of the statement.”
On top of that, New York is one of the least forgiving jurisdictions in the country for this kind of legal action.
Why New York Was a Surprising Choice
New York State has one of the strongest legal provisions against SLAPP laws in the country.
The acronym, which stands for Strategic Lawsuit Against Public Participation, describes a situation in which a powerful entity files a lawsuit not because they genuinely expect to win in court, but because the lawsuit itself is the weapon.
The goal is to exhaust the other side financially and emotionally until they back down.
Anti-SLAPP laws were created specifically as a shield against this tactic. They give defendants, like the WSJ, the right to argue whether a lawsuit of that nature is frivolous. If the paper succeeds in such a scenario, Binance would have to cover all of the legal fees.
“I think it’s really interesting that [Binance] picked New York. I would have picked someplace that didn’t have such robust anti-slap laws,” said Amanda Wick, Head of Americas at VerifyVASP, who previously spent over a decade as an attorney at the US Department of Justice.
She also noted that the exchange’s lawsuit against the WSJ isn’t the first time Binance has used SLAPP tactics.
“[Binance] did tend to go after publications to try to silence them and to shut down unfavorable news stories,” Wick said, adding, “I’m not aware of any other crypto exchanges who have sued the press even when they had enforcement actions.”
In November 2020, Binance filed an almost identical defamation lawsuit against Forbes in New Jersey, only to voluntarily dismiss it three months later without ever going to trial. Notably, New Jersey had no press-protection laws at the time, making it a far more favorable jurisdiction for Binance than the one it chose later.
Yet, given that that’s not the case in New York, if the case does go forward, it could be bad news for Binance.
How Discovery Could Backfire on Binance
In the unlikely scenario that a judge allows the case against the WSJ to proceed, the lawsuit would enter the discovery phase. This stage would involve both parties handing over relevant documents, communications, and records.
For Binance, this would mean giving up internal compliance reports, emails between investigators and management, transaction records, and any communications that speak to what the exchange knew about the Iran-linked flows and when it knew it.
The risk is compounded by the fact that Binance is not operating as a normal company. As part of its 2023 criminal settlement, it agreed to operate under two independent government monitors whose job is to verify that the exchange is genuinely overhauling its compliance program.
“If there’s evidence that… these investigators escalated this and they were ignored, or worse, if they were fired in response while there are two monitorships, that’s going to be really problematic,” Wick said.
Dara, who formerly ran as a Republican candidate for New York Attorney General, argued that winning in court may not be Binance’s primary objective in bringing the case.
The Real Motive Behind the Lawsuit
Binance holds assets for over 300 million users. According to Dara, the reputational damage of a journalistic investigation could present an existential business risk to the exchange.
Unlike traditional finance, crypto operates around the clock across a global, natively online ecosystem where information travels at extraordinary speed and bad headlines can trigger platform flight almost instantly.
He drew a direct parallel to the collapse of Silicon Valley Bank, where a single announcement about a capital shortfall spread through social media so rapidly that customers withdrew $42 billion in a single day.
From that lens, the lawsuit is less a legal maneuver and more a public signal.
As Dara put it: “a bad headline in this space can be very damaging… it would be certainly very damaging for them to see a lot of flight from their platform.”
By filing in the toughest possible jurisdiction, Binance may be signaling that it welcomes scrutiny and has nothing to hide.
The move sends a clear message to those who hold assets on its platform that Binance will fight back even at the risk of what a full legal proceeding might expose.
The post Binance Is Suing a Newspaper in the One Place It Probably Shouldn’t appeared first on BeInCrypto.
Crypto World
Mysterious Crypto PAC Receives Massive Contributions From US Commerce Secretary’s Old Firm


The Fellowship political action committee (PAC), crypto’s newest lobbying player, recently unveiled in its first fundraising disclosure that it received $10 million dollars in contributions from Cantor Fitzgerald.
The news came days after the group publicly endorsed candidates in six separate races ahead of the November midterm elections.
The Tether Ties Fueling Fellowship PAC
The latest disclosure raised eyebrows, given Cantor Fitzgerald’s close connection with Howard Lutnick, the current US Secretary of Commerce. Before assuming office, Lutnick handed off leadership of his financial services firm to his sons.
The contribution also solidified the Fellowship PAC’s close links to tether. Earlier this month, BeInCrypto reported that the committee appointed Jesse Spiro as its Chairman. Spiro is also the Vice President of Regulatory Affairs at Tether US.
Tether and Cantor Fitzgerald also have a tight relationship, as Cantor holds an ownership interest in Tether and is responsible for safeguarding a significant share of its reserve assets.
In addition to the contribution from Cantor Fitzgerald, Fellowship also received $1 million from the US-based institutional crypto platform, Anchorage Digital.
The disclosure marked the PAC’s first real move after seven months of silence since its formation in September. It arrived alongside a wave of endorsements that Fellowship rolled out on social media across six key races ahead of the midterms.
PAC Targets Key Republican Primary Races
On its X account, Fellowship unveiled a list of endorsed candidates, all of them Republicans.
The endorsements spanned congressional, senatorial, and gubernatorial races across Louisiana, South Carolina, Georgia, Kentucky, and Nebraska.
Among those backed were Alan Wilson, the South Carolina governor candidate, and Pete Ricketts, the incumbent seeking to hold his Nebraska Senate seat.
The PAC also threw its support behind Mike Collins for Georgia Senate, Nate Morris for Kentucky Senate, and two Louisiana candidates: Julia Letlow for Senate and Blake Miguez for House District 5.
According to crypto industry researcher Molly White, the Fellowship PAC directed $850,000 toward Nate Morris’ primary challenge against Andy Barr in the Kentucky Senate Republican race and $350,000 toward incumbent Nebraska Senator Pete Ricketts’ re-election bid.
White also flagged that Fellowship PAC funneled $4.5 million to NXUM Group— $3 million for issue advocacy advertising and $1.5 million for the production of ads backing the three campaigns.
NXUM was co-founded by Bo Hines, the former director of Trump’s crypto advisory council, who is now CEO of Tether US.
The post Mysterious Crypto PAC Receives Massive Contributions From US Commerce Secretary’s Old Firm appeared first on BeInCrypto.


A roughly $292 million exploit over the weekend has rattled the crypto industry, exposing vulnerabilities in decentralized finance (DeFi) infrastructure and raising concerns about knock-on effects across lending protocols.
While investigations are still ongoing, early analysis suggests the attack centered on Kelp’s rsETH token — a yield-bearing version of ether (ETH) — and the mechanism used to move assets between blockchains.
The attacker appears to have manipulated that system to create large amounts of tokens without proper backing, then quickly used them as collateral to borrow and drain real assets from lending markets, mostly from Aave , the largest decentralized crypto lender.
The incident is the latest blow to DeFi, happening only a couple weeks after the $285 million exploit of Solana-based protocol Drift, further denting investor trust in the nearly $90 billion crypto sector.
How the attack worked
At a high level, the exploit targeted a LayerZero bridge component — a piece of infrastructure that enables assets to move across different blockchains, Charles Guillemet, CTO of hardware wallet maker Ledger, told CoinDesk in a note.
Bridges typically work by locking assets on one chain and minting equivalent tokens on another. That process depends on a trusted entity — often called an oracle or validator — to confirm deposits.
In this case, Kelp effectively acted as that verifier. According to Guillemet, the system relied on a single-signer setup, meaning just one entity could approve any transactions.
“It seems the attacker was able to sign a message … allowing him to mint large amount of rsETH,” he said. He added that it remains unclear how that access was obtained.
Michael Egorov, founder of Curve Finance, pointed to the same weakness in the system’s configuration.
“Things can happen when you trust one single party — whoever that would be.”
That setup allowed the attacker to effectively create unbacked tokens, even though no corresponding assets were locked on the source chain.
Once minted, the tokens were quickly deployed. The attacker “immediately deposited them in lending protocols mostly Aave to borrow real ETH against,” Guillemet explained.
That maneuver shifted the problem from a single exploit into a broader market issue. DeFi lending platforms are now left holding collateral that may be difficult to unwind, while valuable and liquid assets are already drained.
“Aave was left with rsETH which cannot be really sold and maxborrowed [sic] ETH, so no one can withdraw ETH,” Curve’s Egorov said.
As a result, Aave and other lending protocols may be sitting on hundreds of millions of dollars in questionable collateral and bad debt, he warned, raising concerns of a potential “bank run” dynamic as users rush to withdraw funds.
Aave saw about a $6 billion drop in assets on the protocol as users yanked their assets following the incident. The token associated with the protocol was down about 15% over the past 24 hours’ trading.
What we still don’t know
Key questions remain around how the validator was compromised. The system relied on LayerZero’s official node, raising uncertainty over whether it was hacked, misconfigured or misled.
“Was it hacked? Was it fooled? We don’t know,” Egorov said.
The attacker’s identity is also unknown, though Guillemet said the scale of the attack suggests a sophisticated actor.
“Clearly not some script kiddies,” he said.
Big blow for trust in DeFi
Beyond the immediate losses, the exploit the episode serves as another reminder that as DeFi grows more interconnected, failures in one layer can quickly cascade across the system.
Egorov argued that non-isolated lending models, where assets share risk across pools, amplify the impact of such events.
He also pointed to shortcomings in how new assets are onboarded to lending platforms, saying configurations like Kelp’s 1-of-1 verifier setup should have been flagged earlier.
However, Egorov said there’s a silver lining. “Crypto is a harsh environment which no bank would have survived — yet we are working with that,” he said. “I think DeFi will learn from this incident and become stronger than before.”
Still, even as incidents like this lead to protocol upgrades and redesigns, they also chip away investor confidence in the broader DeFi sector.
“All in all, the trust into DeFi protocols is eroded by this kind of event,” Guillemet said.
“And 2026 will most likely be the worst year in terms of hacks, again,” he added.
Read more: ‘DeFi is dead’: crypto community scrambles after this year’s biggest hack exposes contagion risks
The impact of stablecoins on the banking sector appears “limited” at the current phase of the adoption cycle, but banks could face increasing competition and an erosion of market share as the stablecoin sector and tokenized real-world assets (RWAs) grow in market capitalization.
“So far, the use of stablecoins remains limited, but their market capitalization exceeded $300 billion at the end of last year,” Abhi Srivastava, associate vice president of Moody’s Investors Service Digital Economy Group, told Cointelegraph.

The role of stablecoins in payments, cross-border commerce and onchain finance is “expanding,” despite their currently limited role, Srivastava said, adding that existing payment systems in the US are already “fast, low-cost and trusted.” He said:
“For the banking sector, at this stage, disruption risk appears limited. In the near term, US rules that prohibit stablecoins from paying yield mean they are unlikely to replace traditional deposits at scale domestically.”
However, over time, growing adoption of stablecoins and tokenized RWAs, traditional or physical financial assets represented on a blockchain by a token, could place “pressure” on the banking sector, leading to deposit outflows and reduced lending capacity, he said.
Stablecoin regulatory policy has become a hot-button issue among crypto industry executives and those in the banking sector, with fears that yield-bearing stablecoins could erode banking market share proving to be a stumbling block for the CLARITY crypto market structure bill in Congress.
Related: Stablecoins behave like FX markets as liquidity splits: Eco CEO
CLARITY Act stalled, as banks fight yield-bearing stablecoins
The Digital Asset Market Clarity Act of 2025, also known as the CLARITY Act, is a comprehensive crypto market regulatory framework that establishes an asset taxonomy, regulatory jurisdiction and oversight over the crypto markets.

It is now stalled in Congress after a group of crypto industry companies, led by cryptocurrency exchange Coinbase, publicly stated opposition to earlier drafts of the bill.
A lack of legal protections for open-source software developers and a prohibition on yield-bearing stablecoins were among some of the most contentious issues cited by crypto industry opponents of the legislation.
Several attempts have been made by US lawmakers and the White House to negotiate a bill acceptable to both the crypto industry and the bank lobby.
Earlier this month, North Carolina Senator Thom Tillis said he plans to release an updated draft bill proposal that would be acceptable to both sides; however, the bill has reportedly received pushback, according to Politico, and has yet to be publicly released.
However, other crypto industry executives and market analysts have warned that if the CLARITY Act fails to pass, it could open the crypto industry up to future regulatory crackdowns by hostile lawmakers and officials.
Magazine: Stablecoins will see explosive growth in 2025 as world embraces asset class
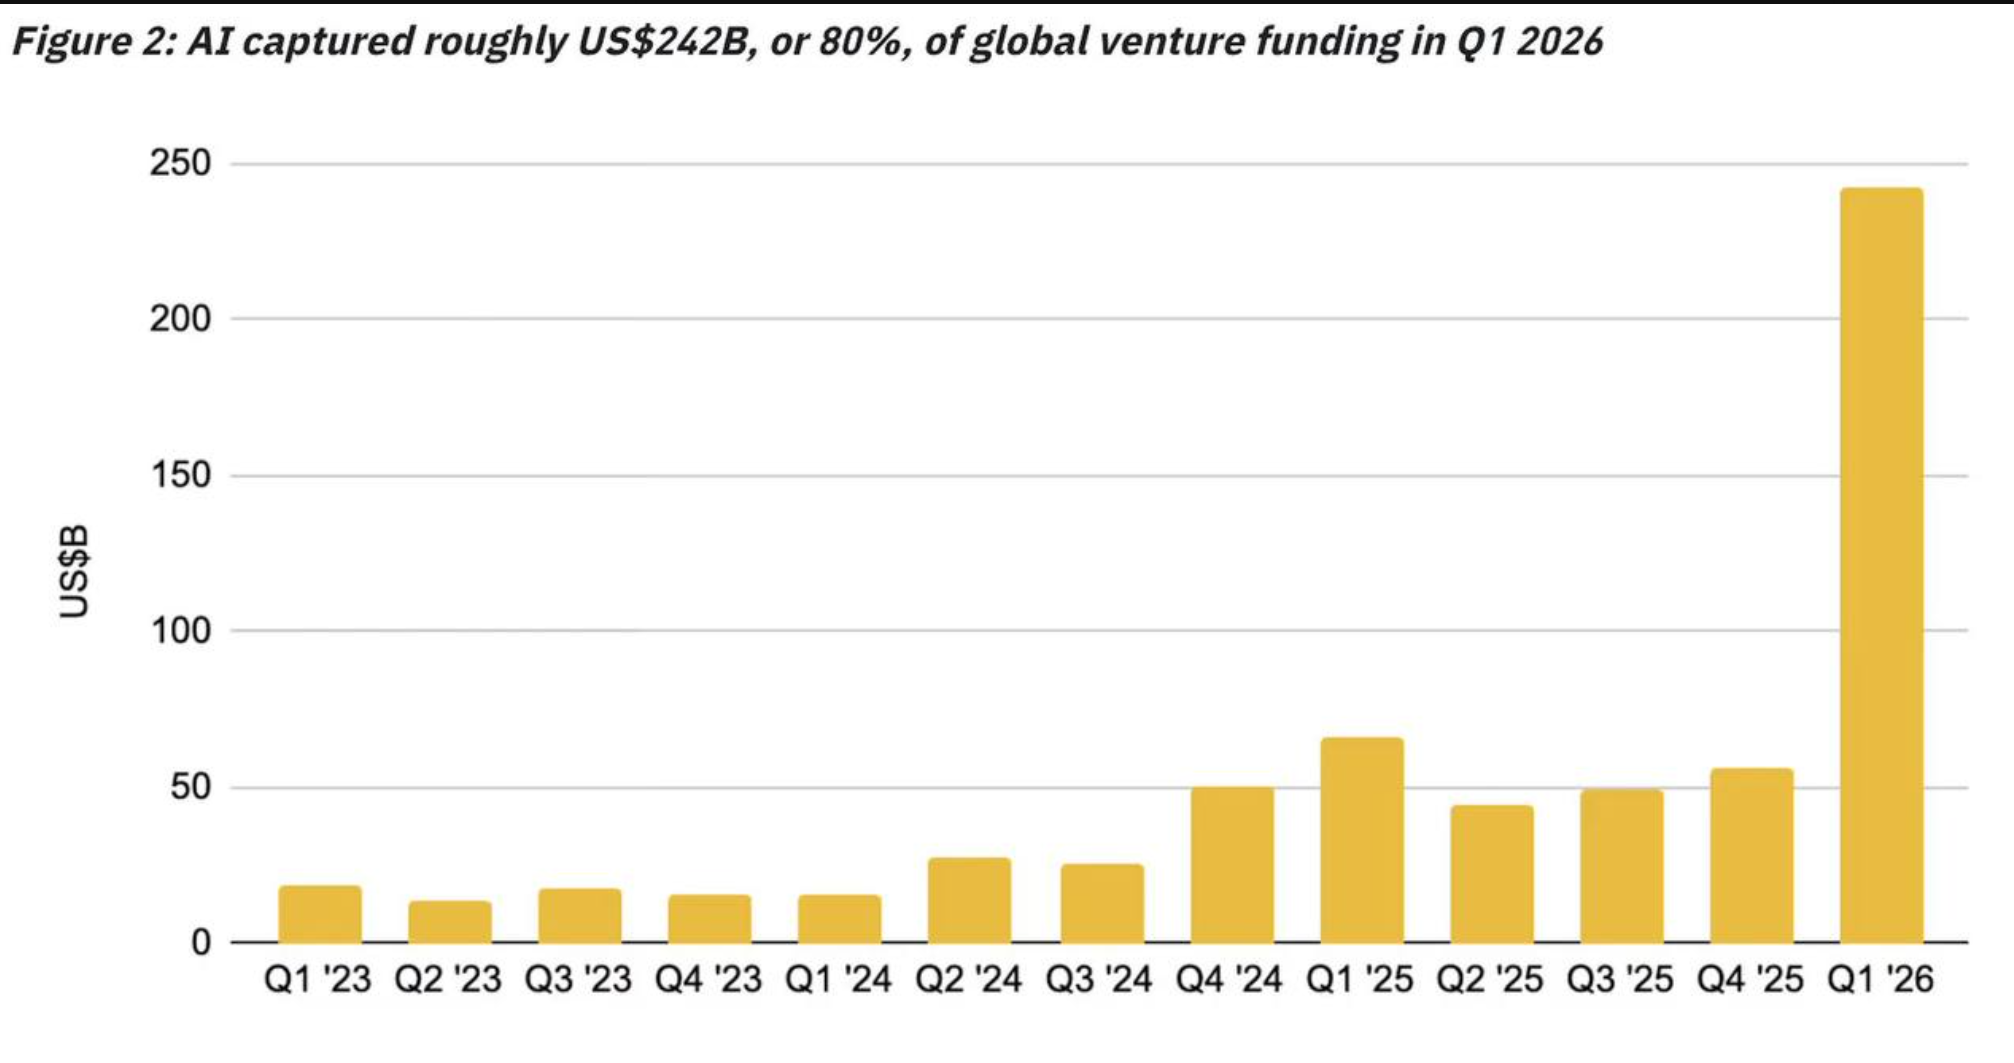
Artificial intelligence captured roughly $242 billion in venture capital funding during Q1 2026, accounting for 80% of all global startup investment in the quarter.
The figures mark a record quarter as total global venture investment reached approximately $300 billion across some 6,000 funded companies.
Mega-Rounds Drive AI Funding Surge
Four deals accounted for 65% of all global venture capital. OpenAI raised $122 billion, Anthropic secured $30 billion, xAI closed $20 billion, and Waymo brought in $16 billion. AI funding in Q1 alone exceeded all of 2025 combined.

However, the capital flood is hitting physical limits. A Bloomberg report found that roughly half of US AI data centers planned for 2026 have been delayed or cancelled.
Transformer shortages, grid strain, and supply chain bottlenecks are limiting the buildout. Only about one-third of the projected 12 GW of new capacity is under active construction.
AI Agents Enter the Workplace
Meanwhile, Coinbase CEO Brian Armstrong revealed the exchange is testing AI agents that operate alongside human employees in Slack and email.
Armstrong suggested Coinbase could eventually have more AI agents than human staff, reflecting a broader corporate shift toward autonomous systems.
The workplace transformation has also reignited political debate. Elon Musk proposed “universal HIGH INCOME” via federal government checks, arguing AI productivity would offset inflation. Andrew Yang echoed the call, urging faster action on AI-funded universal income.
Senator Bernie Sanders pushed back from a different angle, warning that AI firms plan to spend $300 million on 2026 midterm elections.
Sanders called on Democrats to resist industry pressure and confront what he called “the AI Oligarchs.”
The tension between record capital inflows and infrastructure bottlenecks suggests AI’s growth trajectory may face near-term friction even as its economic influence accelerates.
The post AI Absorbs $242 Billion in Q1 Venture Funding, Exceeding All of 2025 Combined appeared first on BeInCrypto.

Pep Guardiola concerned by fresh Man City injury after Arsenal win

Audma’s ELISA Technology Enables Speaker Like Soundstage from Any Headphones: AXPONA 2026
Adam Thomas says he was left ‘broken’ by David Haye on I’m A Celebrity South Africa


-

 Crypto World6 days ago
The SEC Conditionalises DeFi Platforms to Be Avoided for Broker Registration
-

 Fashion2 days ago
Weekend Open Thread: Theodora Dress
-

 Crypto World6 days ago
SEC Signals Exemption for Crypto Interfaces From Broker Registration
-

 NewsBeat6 days ago
Trump and Pope Leo: Behind their disagreement over Iran war
-

 News Videos5 days ago
Secure crypto trading starts with an FIU-registered
-

 Sports3 days ago
NWFL Suspends Two Players Over Post-Match Clash in Ado-Ekiti
-

 Crypto World6 days ago
SEC Proposes Certain Crypto Interfaces Don’t Need to Register as Brokers
-

 Business10 hours ago
Powerball Result April 18, 2026: No Jackpot Winner in Powerball Draw: $75 Million Rolls Over
-

 Politics2 days ago
Palestine barred from entering Canada for FIFA Congress
-

 Crypto World2 days ago
Russia Pushes Bill to Criminalize Unregistered Crypto Services
-

 Sports7 days ago
NWFL opens Pathway for new Clubs ahead of 2026 Season
-
 Business3 days ago
Creo Medical agree sale of its manufacturing operation
-
 Entertainment6 days ago
Brand New Day’ Footage Reveals the Devastating Impact of ‘Now Way Home’
-

 Politics14 hours ago
Zack Polanski demands ‘council homes not luxury flats for foreign investors’
-

 Crypto World7 days ago
Trump whales load up ahead of Mar-a-Lago luncheon.
-
Business7 days ago
Kering slides after Morgan Stanley downgrade, Gucci woes loom
-

 Tech7 days ago
Google adds E2E encryption to Gmail for iOS and Android enterprise users
-

 Tech7 days ago
Apple glasses won’t go brand shopping like Meta did with Ray-Ban and Oakley
-
Entertainment7 days ago
How Euphoria Season 3 Premiere Paid Tribute to Eric Dane After Death
-
 Entertainment6 days ago
Karol G’s ‘Ultra Raunchy’ Coachella Set Gave ‘Satanic Vibes’
You must be logged in to post a comment Login