
Crypto World
Hedera (HBAR) risks dropping to February lows if $0.08 gives way


- Hedera (HBAR) price is hovering near a fragile $0.08 support cluster.
- Losing $0.08 could open a move toward $0.07842 or lower.
- Upside only improves if the $0.0942 resistance is reclaimed.
Hedera’s price has been drifting lower again, and the latest price action is starting to circle a level that traders are watching very closely.
At around $0.0856, the token is down about 1.5% over the past 24 hours, with intraday trading ranging between $0.0846 and $0.0875.
On the surface, it looks like a normal pullback in a weak market.
But underneath, the structure is tightening around a critical zone that could decide whether the next move is stable consolidation or a deeper slide toward February’s lows near $0.072.

Notably, the broader trend hasn’t been friendly to altcoins in general.
Over the past week, Hedera has lost more than 6%, and the monthly decline is now above 12%.
Even longer-term momentum remains negative, with the asset still significantly lower compared to where it traded a year ago.
What makes the current situation more sensitive is that this weakness is happening without any strong internal catalyst.
There has been no major ecosystem shock or technical breakdown tied to the project itself.
Instead, the pressure is coming from a wider rotation out of altcoins and into safer assets, leaving tokens like HBAR more exposed to downside moves.
Pressure builds around a fragile support zone
Right now, the most important area on the chart sits just below the current price.
Short-term support has been forming around $0.0838, while another closely watched structural level sits at $0.08067.
These two zones are effectively acting as a support cluster. If they hold, price action could continue to move sideways as traders wait for new catalysts.
But the problem is that this cluster has already been tested indirectly through repeated dips and weak bounces.
Each retest weakens confidence. If selling pressure increases again, there is very little structural support until lower levels come into play.
Below this region, historical price data points to a more significant breakdown zone near $0.0703.
That would represent a much deeper correction, but markets rarely move in straight lines.
Before that level becomes relevant, traders are focused on a nearer and more psychologically important target: the February low at approximately $0.07270.
If price loses the $0.08 region decisively, the path toward that February floor opens quickly.
In thin or sentiment-driven markets, these levels tend to act like magnets.
Upside potential is still there, but it needs confirmation
Despite the current pressure, the structure is not entirely broken. There is still a clear resistance ladder above the market that could come into play if sentiment shifts.
The first key level sits at $0.0942. A move back above this zone would signal that buyers are regaining control in the short term.
Above that, the next resistance zones are located around $0.1051 and then $0.1174, marking progressively stronger recovery thresholds.
However, the market is not in a position where upside levels are immediately relevant.
Before any recovery attempt can take shape, the price needs to stabilise and reclaim lost ground. At the moment, that has not happened.
Instead, each rally attempt has been smaller than the previous one, which is often a sign of weakening demand.
HBAR price outlook
The near-term outlook now hinges on one simple condition: whether $0.08 holds or breaks.
If buyers defend this area again, Hedera could continue ranging between the mid-$0.08s and low-$0.09s while waiting for a stronger catalyst. In that case, price action would likely remain choppy but contained.
If $0.08 fails, however, the structure shifts quickly, and market projections place the next visible target as the February low at $0.07796, and below that, the broader support zone near $0.0727 comes into view.
The speed of any drop would depend on how quickly liquidity disappears below current levels.
But there is still one wildcard in the background: upcoming Hedera Hashgraph ecosystem developments and broader market sentiment shifts.
These events can temporarily interrupt bearish momentum, but so far, they have not been strong enough to reverse the current trend.


The platform’s new Earn feature lets its thousands of institutional clients deposit their stablecoin to DeFi’s top lending protocols directly on Fireblocks.
Enterprise crypto infrastructure firm Fireblocks has launched an on-chain lending product, Earn, giving its institutional clients direct access to two of DeFi’s largest lending protocols, per a press release shared with The Defiant.
Via Earn, the firm’s more than 2,400 institutional clients will be able earn yield on their stablecoin holdings via Morpho and Aave, directly from the Fireblocks platform. The feature is available across all of Fireblocks’ infra solutions, including its digital asset treasury solution, in the case the corporate treasury holds stablecoins.
Existing Fireblocks customers need to apply to get early access to the feature, per the release.
Aave is the dominant lending protocol in DeFi, with roughly $26.3 billion in total value locked (TVL) and around $18 billion in active loans. Aave commands about 50% of the DeFi lending market TVL, per DefiLlama data. Morpho is DeFi’s second-largest lending protocol by TVL, with approximately $7.6 billion in TVL, according to DefiLlama.
Fireblocks Earn will launch with a curated vault managed by Sentora, provided by Morpho. Both integrations operate within Fireblocks’ existing approval workflows, policy controls, and transaction signing infrastructure, the press release notes.
The product targets idle stablecoin balances sitting “between deployment cycles, settlement windows, and operational holds” across Fireblocks’ clients. The company says stablecoin transfer volume on its network totaled $6 trillion in 2025, a 300% increase year-over-year.
“For the first time, institutions can put those balances to work through onchain lending strategies curated by established institutional names, inside the same platform, under the same controls they already run,” said Fireblocks co-founder and CEO Michael Shaulov.
The integration deepens a long-running relationship between Fireblocks and Aave, dating back to Aave Arc, a permissioned version of the DeFi protocol targetting institutions, launched in 2022. As The Defiant reported at the time, at launch, Fireblocks served as sole approved whitelister for Arc, in part tasked with compliantly onboarding institutional players to the platform.
Morpho, meanwhile, has been expanding institutional partnerships, with Apollo Global Management committing to acquiring up to 9% of its token supply in a February agreement. Also recently, the Ethereum Foundation deployed more deposits to Morpho vaults, totaling nearly $19 million as of last month.
This article was written with the assistance of AI workflows. All our stories are curated, edited and fact-checked by a human.


- Fireblocks integrates Aave into its Earn feature, enabling institutional clients to earn yield on stablecoins.
- Aave founder Stani Kulechov highlights Aave’s resilience amid rising DeFi adoption.
- AAVE price analysis shows bullish positioning, with potential rally as adoption continues.
Aave’s role in decentralized finance has received a major boost as Fireblocks unveils a new platform set to bring stablecoin yield to institutional clients.
The enterprise platform’s new Earn feature now embeds Aave, enabling seamless yield generation on stablecoins for its vast institutional network.
The AAVE token is up more than 5% in the past 24 hours, with bulls testing $105 amid broader gains across the cryptocurrency market.
Why Aave and Fireblocks integration matters
As noted, the enterprise platform Fireblocks has integrated Aave into its new Earn feature.
The platform allows the over 2,400 institutions on Fireblocks to tap into DeFi via Aave-powered yield on their stablecoin balances.
Earn thus allows Fireblocks customers to deploy their idle capital to work, and its traction could add to Aave’s adoption.
The digital asset operations tied to the integration will bolster AAVE.
“Aave has demonstrated resilience, transparency, and security across multiple market cycles, driving increased institutional participation,” said Stani Kulechov, founder of Aave Labs.
“As institutions enter the space, access to deep, reliable liquidity becomes essential. With the Fireblocks Earn integration, institutions can now access Aave’s stablecoin liquidity directly within the familiar Fireblocks platform.”
This move builds on Fireblocks’ handling of over $10 trillion in digital asset transactions and $6 trillion in stablecoin volume last year, representing a 300% year-over-year surge.
Aave’s DeFi liquidity markets are available on Ethereum, Base, Arbitrum, and Optimism.
Aave is now available as the primary yield source for Fireblocks Earn, accessible to all Fireblocks users. https://t.co/7FQtILJttJ
— Stani (@StaniKulechov) April 15, 2026
AAVE price analysis
This integration bolsters Aave’s position as DeFi’s leading lending protocol.
Institutional capital via Fireblocks could drive sustained AAVE appreciation, enhancing liquidity depth and protocol utility.
AAVE’s price surged following the Fireblocks announcement on April 15, 2026, reflecting market enthusiasm for institutional inflows.
While the altcoin mirrored the performance of top coins, the news looks to have emboldened buyers.
The token traded around $105 after bearish pressure reemerged near $110, but the dip in daily volume suggests sellers do not hold the sway.
On the other hand, the technical picture shows bullish signals across key indicators.
The Relative Strength Index (RSI) hovers near 55 on the daily chart. Exiting neutral territory indicates a potential bullish momentum before overbought risks kick in above 70.
The MACD also reveals a histogram expansion amid a bullish crossover pattern.

On the upside, 50-day and 100-day exponential moving averages (EMAs) offer the immediate resistance areas at $106 and $124. A short-term bullish structure would see AAVE surge to $164.
However, downside risks include failure to hold $100, which could allow bears to target $89 and then $80 as primary support levels.


Crypto exchanges have become the primary venues where millions of people and businesses store and transfer digital money. According to industry data, the crypto market is currently seeing roughly $190–$192 billion in 24-hour trading volume. As exchanges expand into multi-asset venues, the security mechanism evolves beyond wallets into identity, permissions, pricing and settlement. Yet, despite growing pressure from regulators, their security is still failing.
In 2025, more than $3 billion in crypto assets were stolen, according to industry estimates. Moreover, several single incidents caused losses of over $1 billion each. Were these small or underfunded platforms? No.
The largest hacks happened at major global exchanges with ample capital and technology. So, a lack of resources allocated for protection wasn’t the issue — security, still treated as marketing, was.
Much of the industry keeps treating security as a performance rather than an operating discipline. Exchanges invest in what appears convincing on the surface: dashboards, reserve snapshots, protection funds, public statements. It looks reassuring, but it doesn’t prove how risk is managed day to day.
That’s why, unless security is designed to be enforced, not shown off, even the biggest platforms will stay fragile. And when stress hits, that fragility spills over to users immediately.
Performative Security is Dangerous
In fact, what’s happening is what I call “security theater.” It’s when an exchange focuses on looking safe, but not actually being safe. So the focus shifts to optics, such as headlines and polished statements, while the real governance remains weak.
I’ve seen how such a mindset takes hold. When a business is growing, it has to move fast and keep everything smooth for users. In such conditions, security controls are a friction. They slow down decisions by adding extra steps and triggering uncomfortable questions like “Who can approve this transfer?” And “what happens if the wrong person gets access?” That’s why many platforms prefer confidence on the surface over discipline inside.
And the big problem is that this false confidence doesn’t survive stress. In July 2024, India’s WazirX suffered a roughly $235 million hot valuable wallet breach and suspended withdrawals. In my view, that’s a useful reminder of how quickly “everything looks fine” can turn into users losing access to their funds.
And that’s the point. Security isn’t a page, a logo or a fund. It’s the daily rules that control how money moves, who has access and how cases are handled when something goes wrong.
What exchanges must prove to earn real trust
Genuine exchange security is a system that endures stress, and you can test that. From my experience, it has three core traits:
- it proves full backing of customer balances,
- it controls how money moves,
- and it responds fast in a crisis.
Proof-of-reserves is a start toward demonstrating the system can withstand stress. Simply put, it’s evidence that certain assets exist. Still, it says little about what the exchange owes you, what rules apply to your money if the exchange has troubles or whether the numbers are true when many users withdraw at once. That’s why transparency should be two-sided.
It should clearly show assets and liabilities, with an independent check. And the “proof” should be verifiable, for example, through cryptographic methods that allow users to confirm inclusion without exposing balances.
Then comes the part most “security pages” avoid — strict rules inside the company. No single person should be able to move customer funds, unusual activity should trigger reviews, and large transfers must require approval from at least two people. With these controls in place, one compromised account can’t cause a chain reaction across the platform.
Since exchanges are becoming multi-asset platforms, those rules need one more goal: keeping a permission mistake or pricing anomaly from spilling into cross-asset liquidations.
Quick incident response is the final test of real security. A serious exchange knows exactly what happens in the first hour, isolates the breach, pauses critical flows and communicates clearly. Delays and silence don’t buy time; they simply multiply damage.
Of course, these measures don’t cover every possible risk. Even so, they form the backbone of true exchange durability — the kind that prevents routine incidents from turning into systemic failures.
By 2026, ‘trust us’ costs too much
If exchanges want to keep their customers and attract serious, institutional capital, they have to stop acting like performers in a safety show. Reassuring words and polished pages may calm people in quiet moments, but they fail when a big crisis hits.
Big investors have already started treating security as basic counterparty risk. They want evidence of controls, separation of duties, independent assurance, and a response plan that works under pressure.
So, in 2026, a simple “trust us” on a homepage won’t be enough. Can one mistake drain the platform or does the system stop it? Can you prove that with enforced limits and approvals, instead of explanations after the fact? These are questions that everyday users and large investors alike are starting to ask.
After all, security is about building systems that mitigate damage, slow down bad decisions and hold up under stress. Exchanges that make that shift will keep trust. Those who don’t will keep learning the same lesson the hard way.
Bitcoin (BTC) has a target market that is “probably a lot bigger” than gold’s $30 trillion market cap, says a crypto industry executive.
Key points:
-
Bitcoin should continue to outperform during geopolitical crises, says Bitwise’s Matt Hougan.
-
Bitcoin’s “addressable market” could surpass gold’s near $40 trillion market cap.
-
A trader eyes a return to $90,000 for Bitcoin after a historic drawdown against gold.
Bitcoin “probably” beats gold target market
In an X article on Tuesday, Matt Hougan, chief investment officer of crypto asset manager Bitwise, saw geopolitical conflict fueling BTC price gains in future.
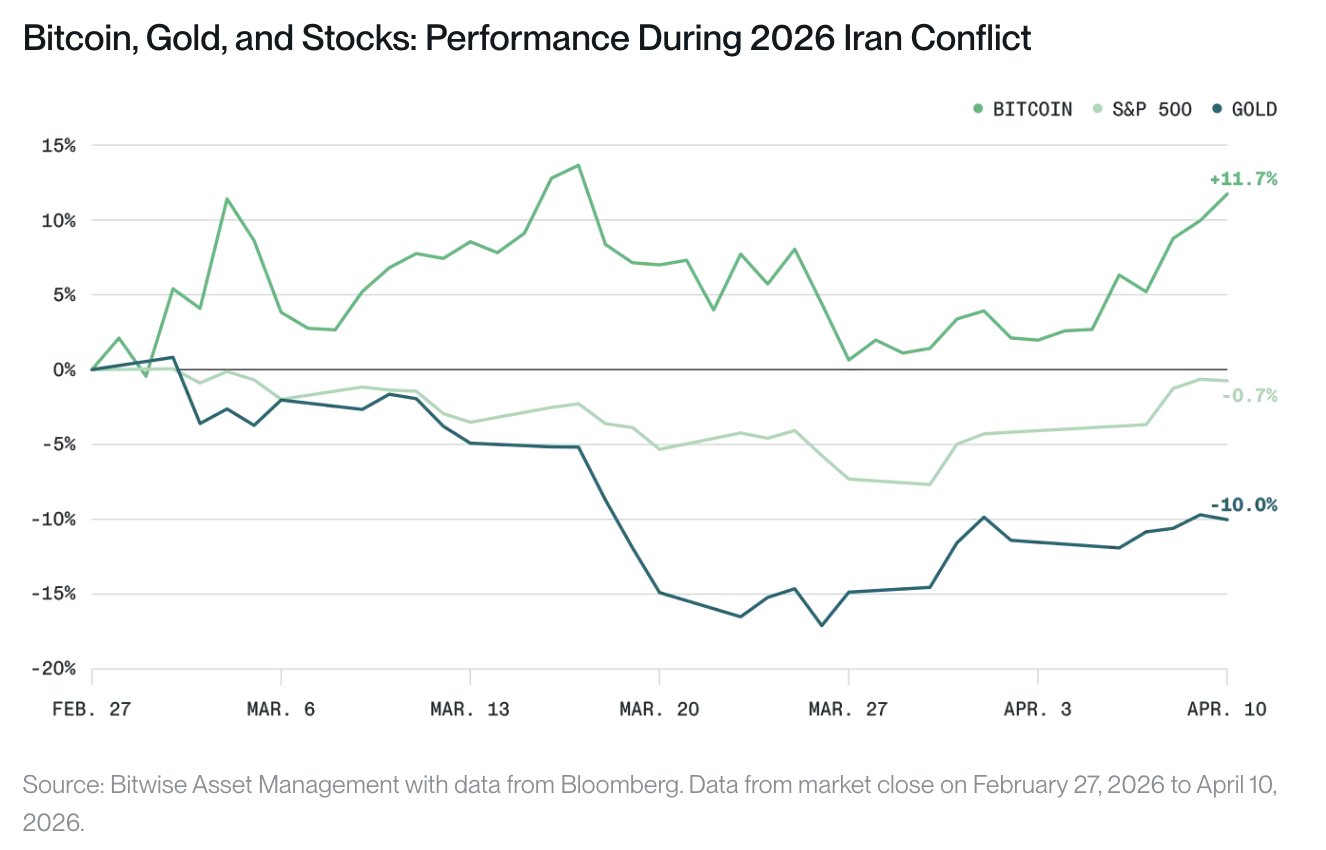
“Bitcoin has performed well since the start of the Iran conflict,” he noted.
“Since U.S. and Israeli airstrikes began on February 28, bitcoin is up 12% while the S&P 500 is down 1% and gold has fallen 10%.”

Bitcoin rallied to $76,000 this week, hitting two-month highs on a combination of US-Iran war relief and cooler US inflation numbers, per data from TradingView.
“This has caught many off guard. Bitcoin is a risk asset, and many assumed it would fall during a risk-off geopolitical shock,” Hougan commented.
“Pundits have grasped for explanations: Some have argued that geopolitics is irrelevant for bitcoin, while others have pointed out that war often leads to money printing, which tends to boost bitcoin in the long term. Both arguments are wrong.”

For Hougan, the nature of recent conflicts — notably Russia being shut out from the SWIFT network in 2022 — has bolstered Bitcoin’s status as an “apolitical alternative.”
“I mused at the time that the weaponization of SWIFT might one day open up space for bitcoin: If countries grew reluctant to deal in dollars, it stood to reason that they might prefer an apolitical alternative at some point,” he continued.
Now, with Iran under both financial sanctions and an oil blockade, collecting crypto tolls for transit through the Strait of Hormuz, that “weaponization” trend is strengthening.
“This framing tells you two important things about bitcoin’s future,” the post summarized.
“First, it tells you that bitcoin is likely to rise during future geopolitical conflicts -— particularly if they occur in regions trapped between the US and Chinese systems. And second, it tells you that bitcoin’s total addressable market is probably a lot bigger than the $38 trillion gold market alone.”
Bitcoin vs. gold sparks $90,000 BTC price target
In gold terms, Bitcoin is currently recovering from a trip to its lowest levels since mid-2023.
Related: Oil price surges 8% on Iran tensions: Five things to know in Bitcoin this week

The rebound has been slow, even as Hougan predicts the end of the current “crypto winter.” For some, however, the writing is on the wall when it comes to a meaningful bullish trend change.
In an X post of his own, crypto trader Michaël van de Poppe predicted that “mean reversion” for Bitcoin was just a matter of time.
“The recent correction of $BTC vs. Gold is the heaviest in the history of Bitcoin,” he noted.
“Comparing this to historical events, the average return after 12 months was 350-450% from this point. That means, from here an increase from $60,000 to $275,000. In 3 months time, it’s very likely that we’ll be trading at $87,500-90,000.”

Comparing behavior after other drawdowns, Van de Poppe said that the “moral of the story” was to “buy the dip” on BTC.
“This is the general moment every cycle that you’d want to get allocated into an asset,” he argued.
This article is produced in accordance with Cointelegraph’s Editorial Policy and is intended for informational purposes only. It does not constitute investment advice or recommendations. All investments and trades carry risk; readers are encouraged to conduct independent research before making any decisions. Cointelegraph makes no guarantees regarding the accuracy or completeness of the information presented, including forward-looking statements, and will not be liable for any loss or damage arising from reliance on this content.

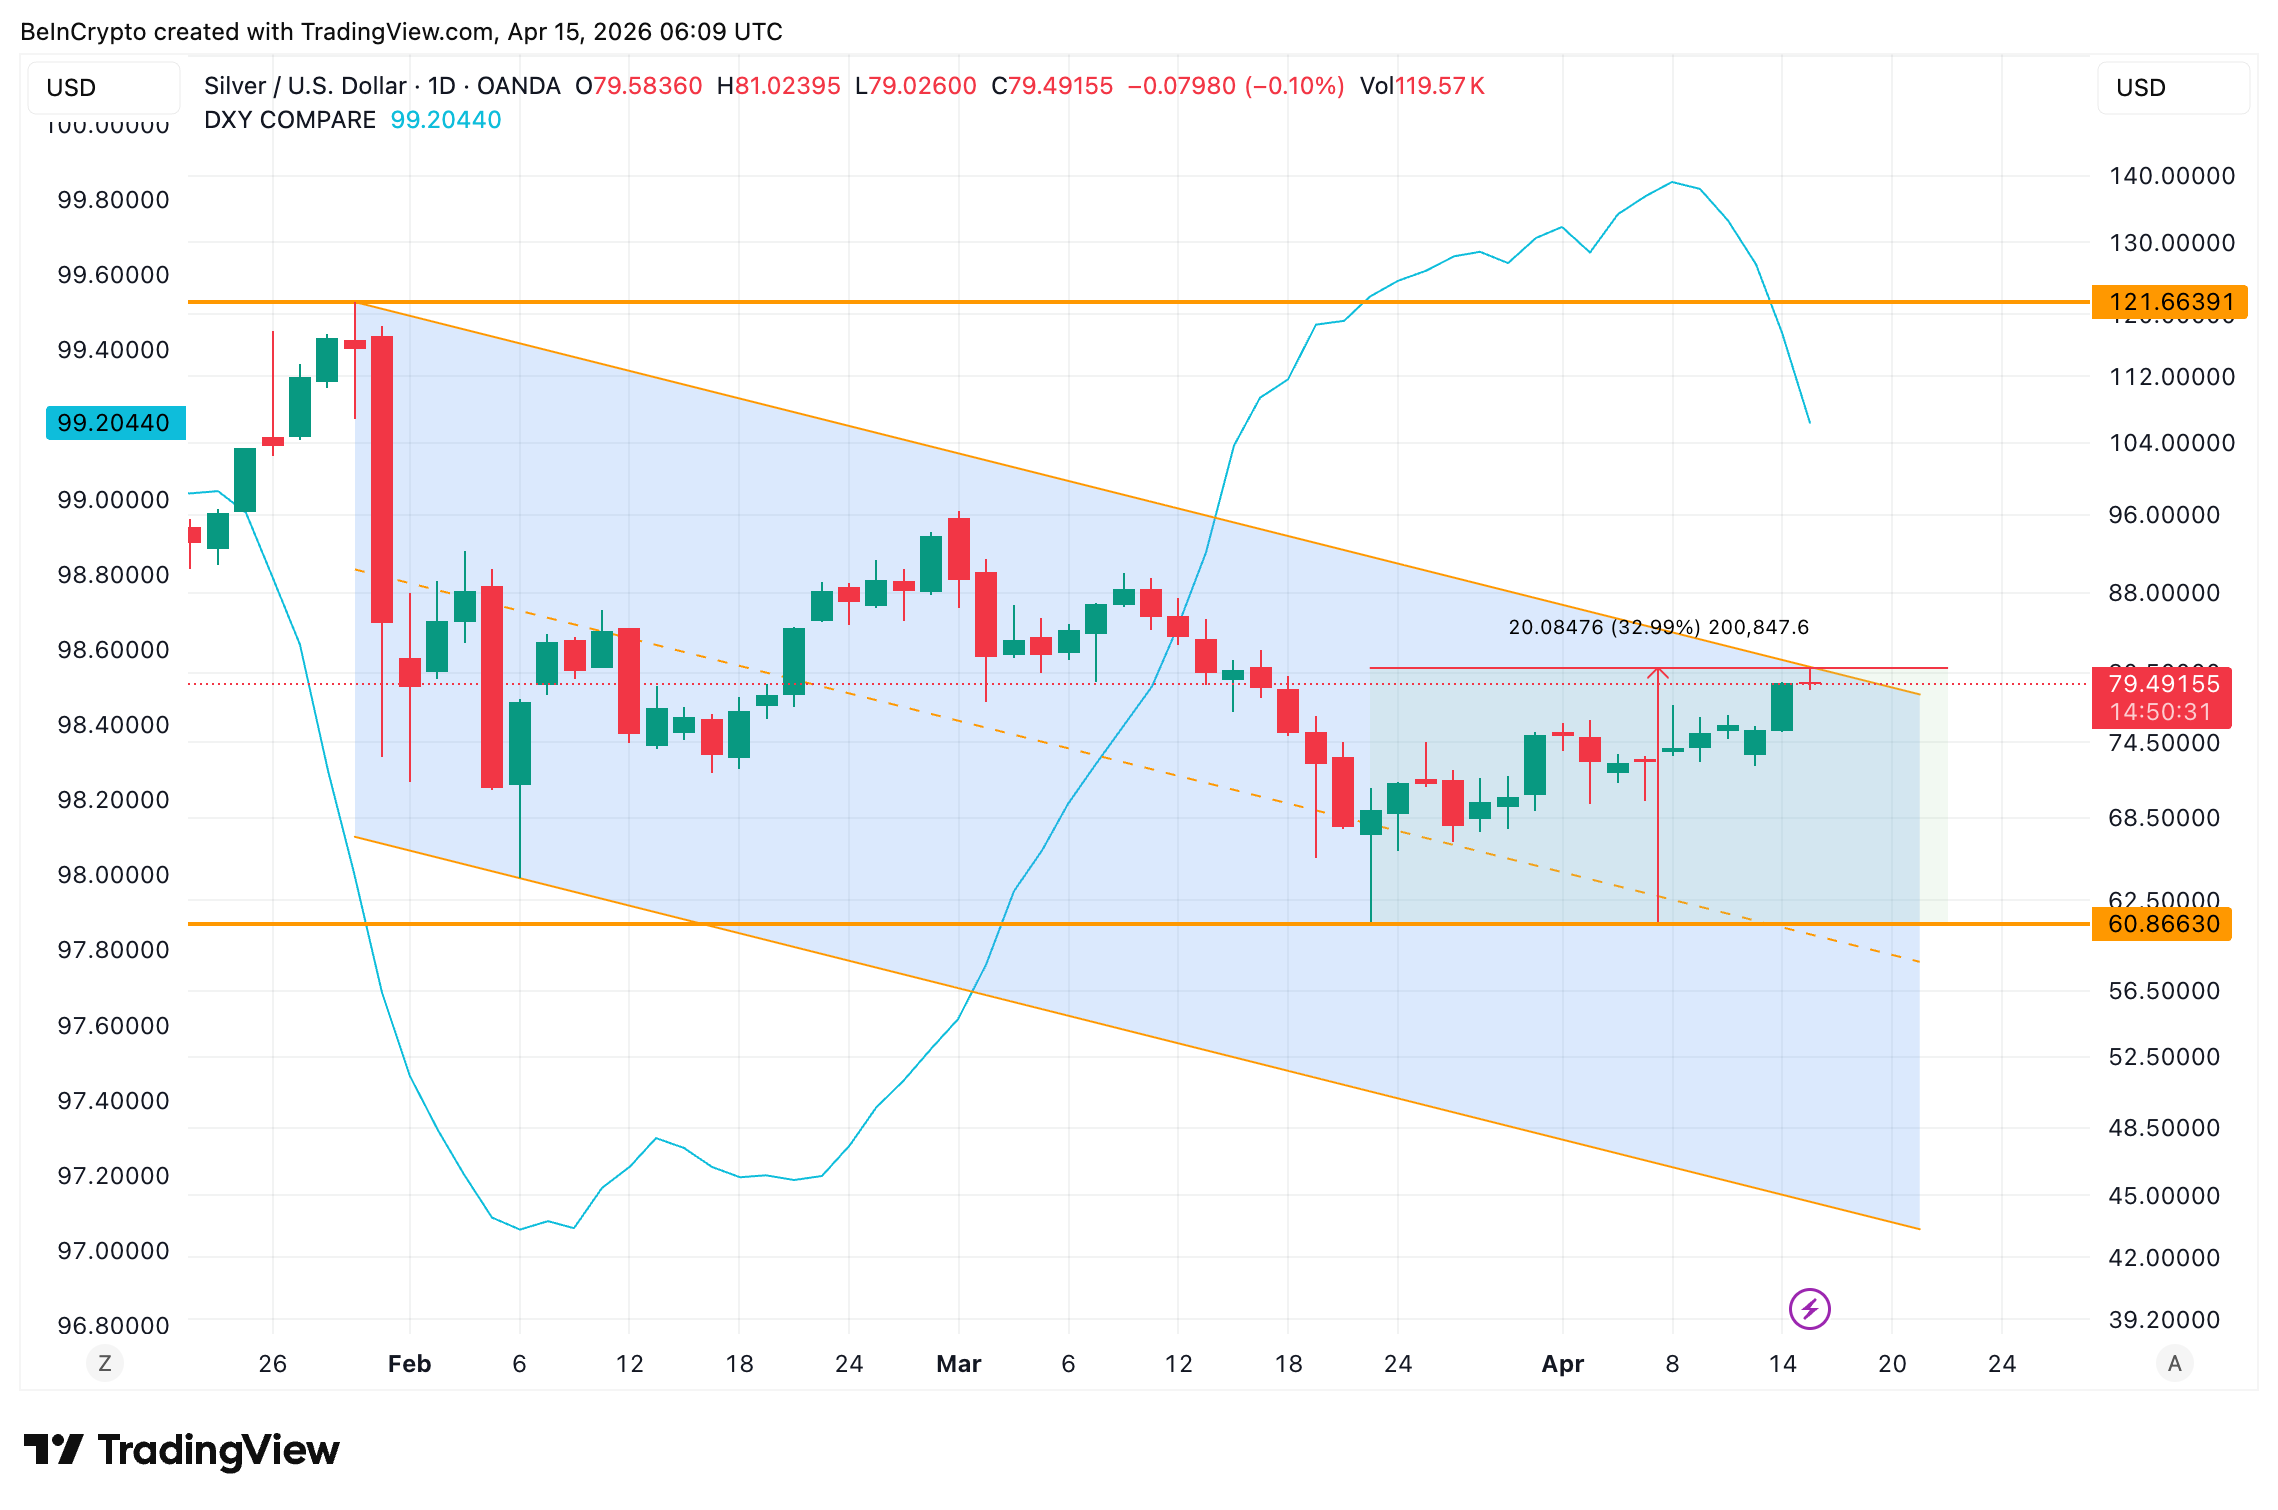
Silver (XAG/USD) price is up 7.2% over the past week, erasing nearly all of its monthly losses. The metal now trades near $79.50 after rallying 33% from its March 23 low.
The recovery aligns with a falling US Dollar Index (DXY) and improving ceasefire sentiment. However, silver remains trapped inside a bearish channel that has held since January 29. A breakout above that channel would shift the structure from recovery to trend reversal.
A Falling Dollar Fuels Silver’s Rally Inside a Bearish Channel
Silver price has traded inside a falling channel on the daily chart since January 29. The channel formed as the US Dollar Index (DXY) was climbing. DXY measures the dollar against a basket of major currencies.
The bottom of the channel was tested on March 23, when silver touched $60.86. At that point, DXY was peaking near 99.40. The inverse correlation played out clearly. As the dollar strengthened, silver weakened.
Since April 8, however, the relationship has reversed. DXY has been falling, now sitting near 99.20 (down over 2% month-on-month), and silver has climbed 33% from the March low (in over 3 weeks). Oil prices dropping below $100 after the US-Iran ceasefire have eased inflation expectations, reducing dollar demand. That dollar weakness is flowing directly into precious metals.
Want more insights like this? Sign up for Editor Harsh Notariya’s Daily Newsletter here.
Despite this, silver remains inside the bearish channel. The upper trendline sits close, and silver needs to break above it to confirm a structural shift. Whether that conviction exists beyond the dollar trade depends on two forward-looking signals.
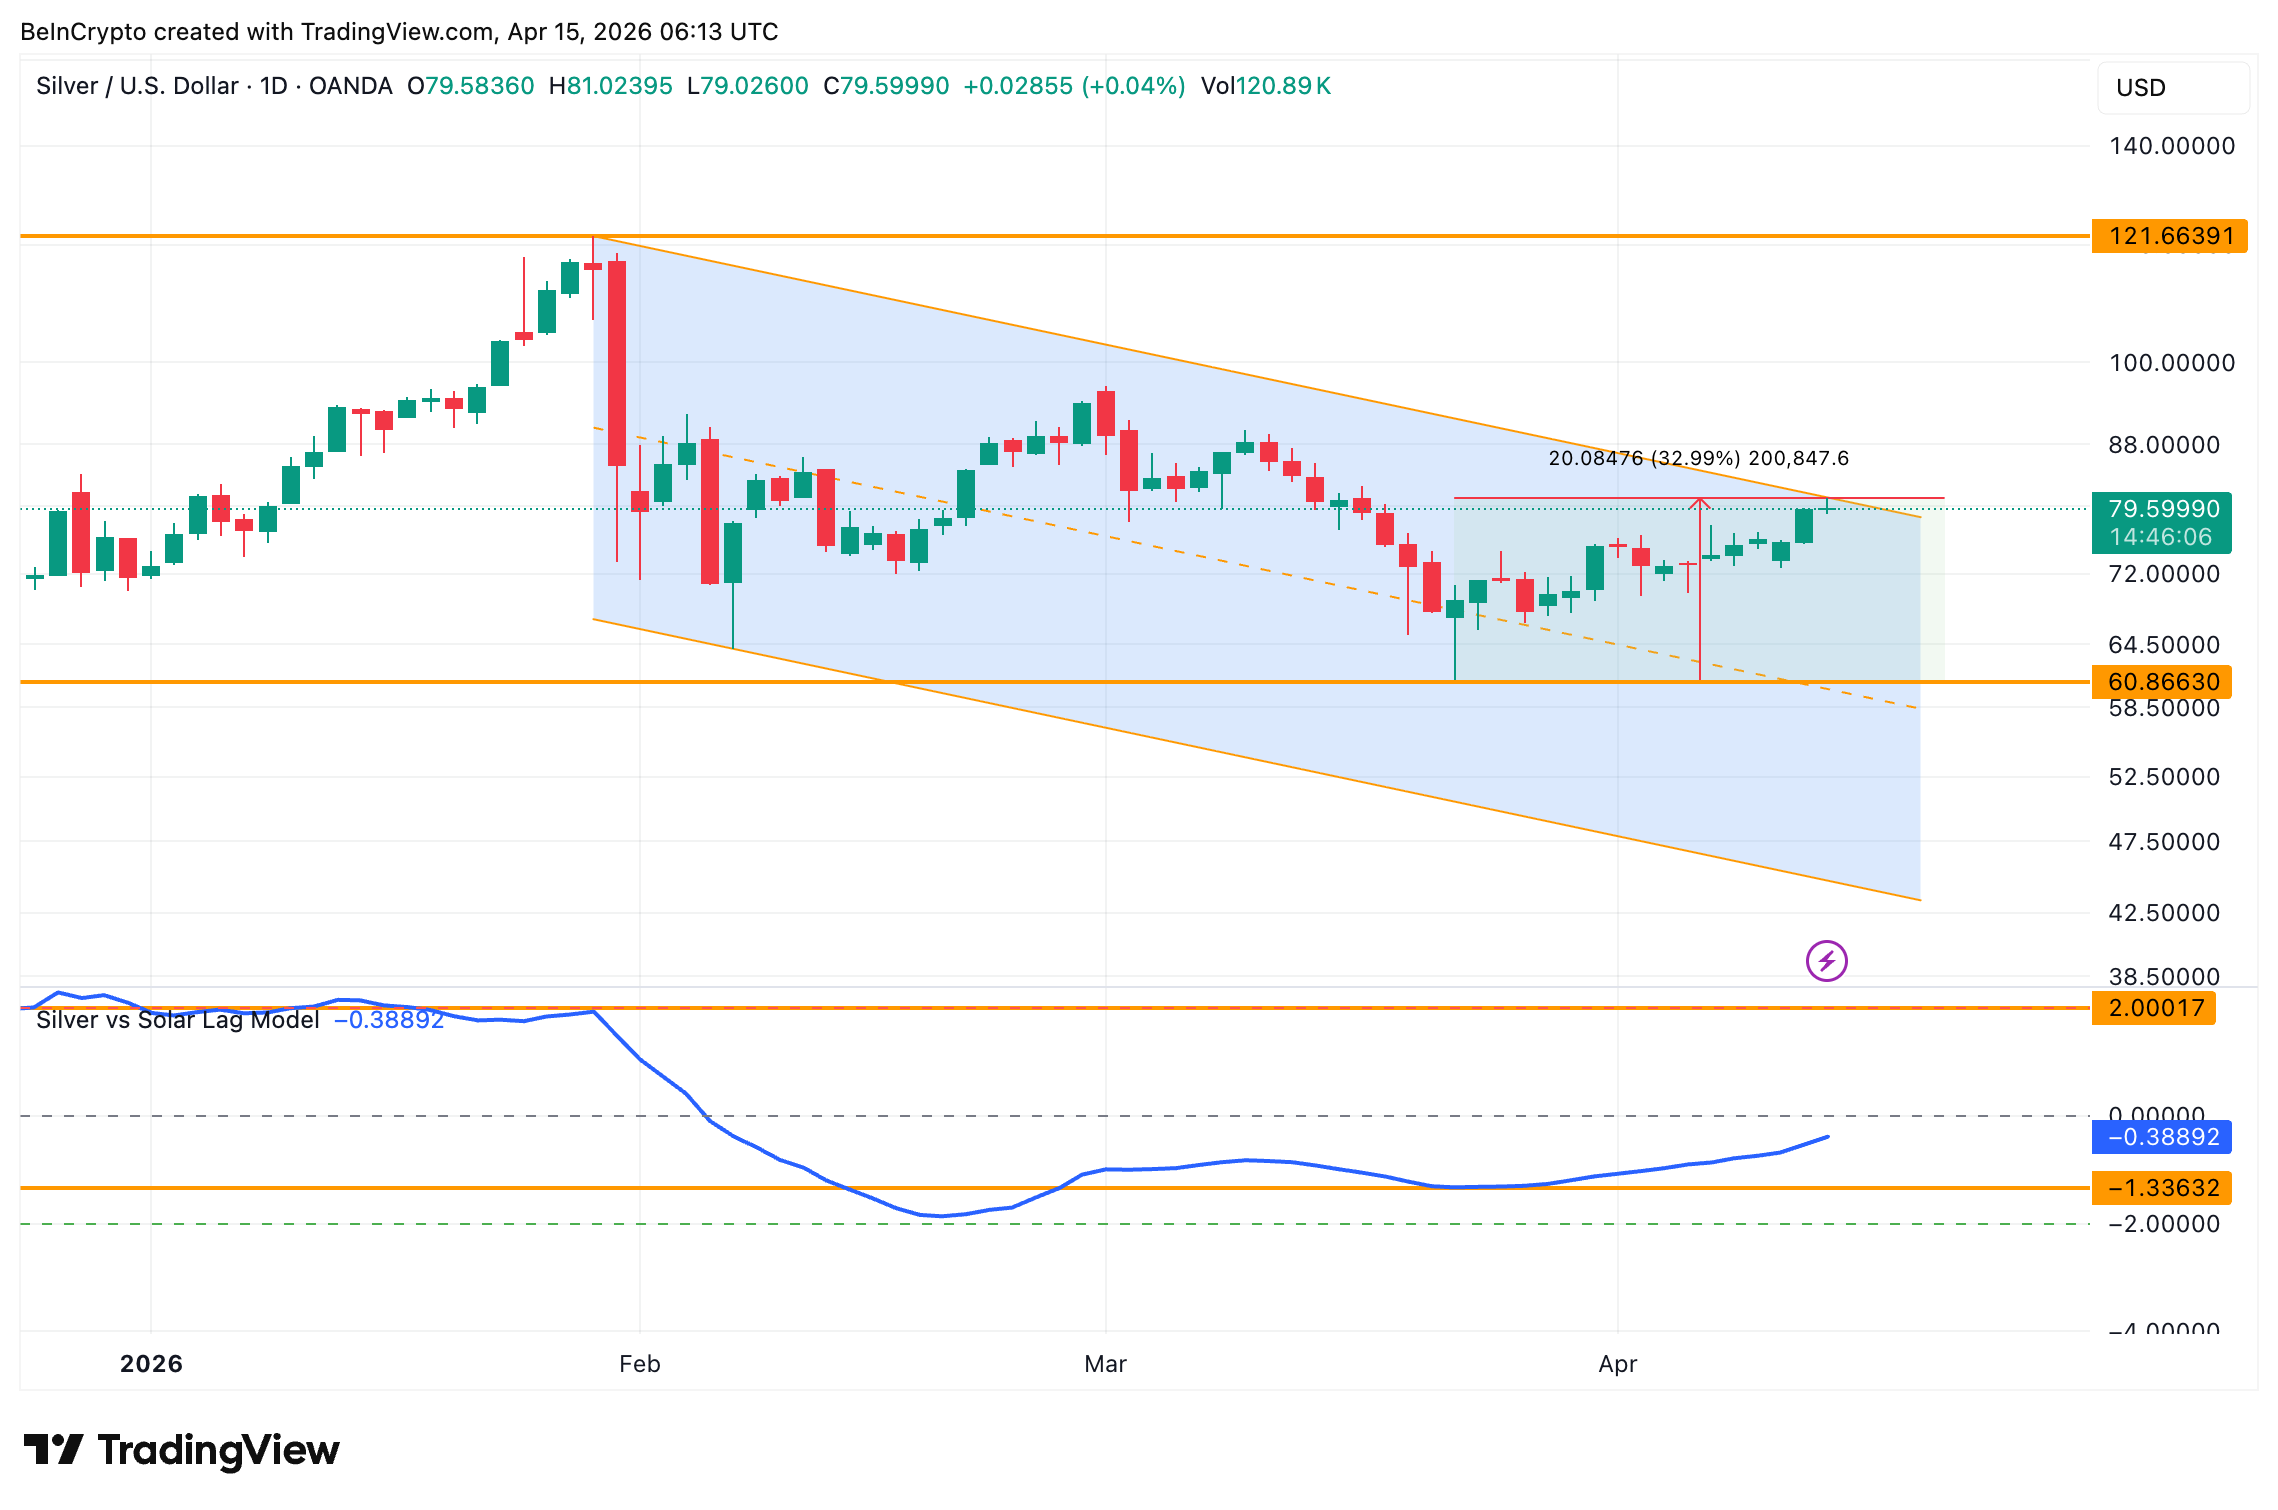
A Proprietary Model and SLV Options Data Align With the Rally
BeInCrypto’s Silver versus Solar Lag Model is a proprietary indicator. It measures the gap between silver’s price and lagged solar energy demand trends. The model currently reads -0.389, still below the zero line.
However, the direction matters. The model bottomed near negative 1.34 around the same time silver hit $60.86. Since then, it has been climbing steadily. The last time silver made a major peak, the model was reading near positive 2.0. A cross above zero would suggest silver is finally catching up to underlying industrial demand. That crossover has not happened yet, but the trend is moving in the right direction.
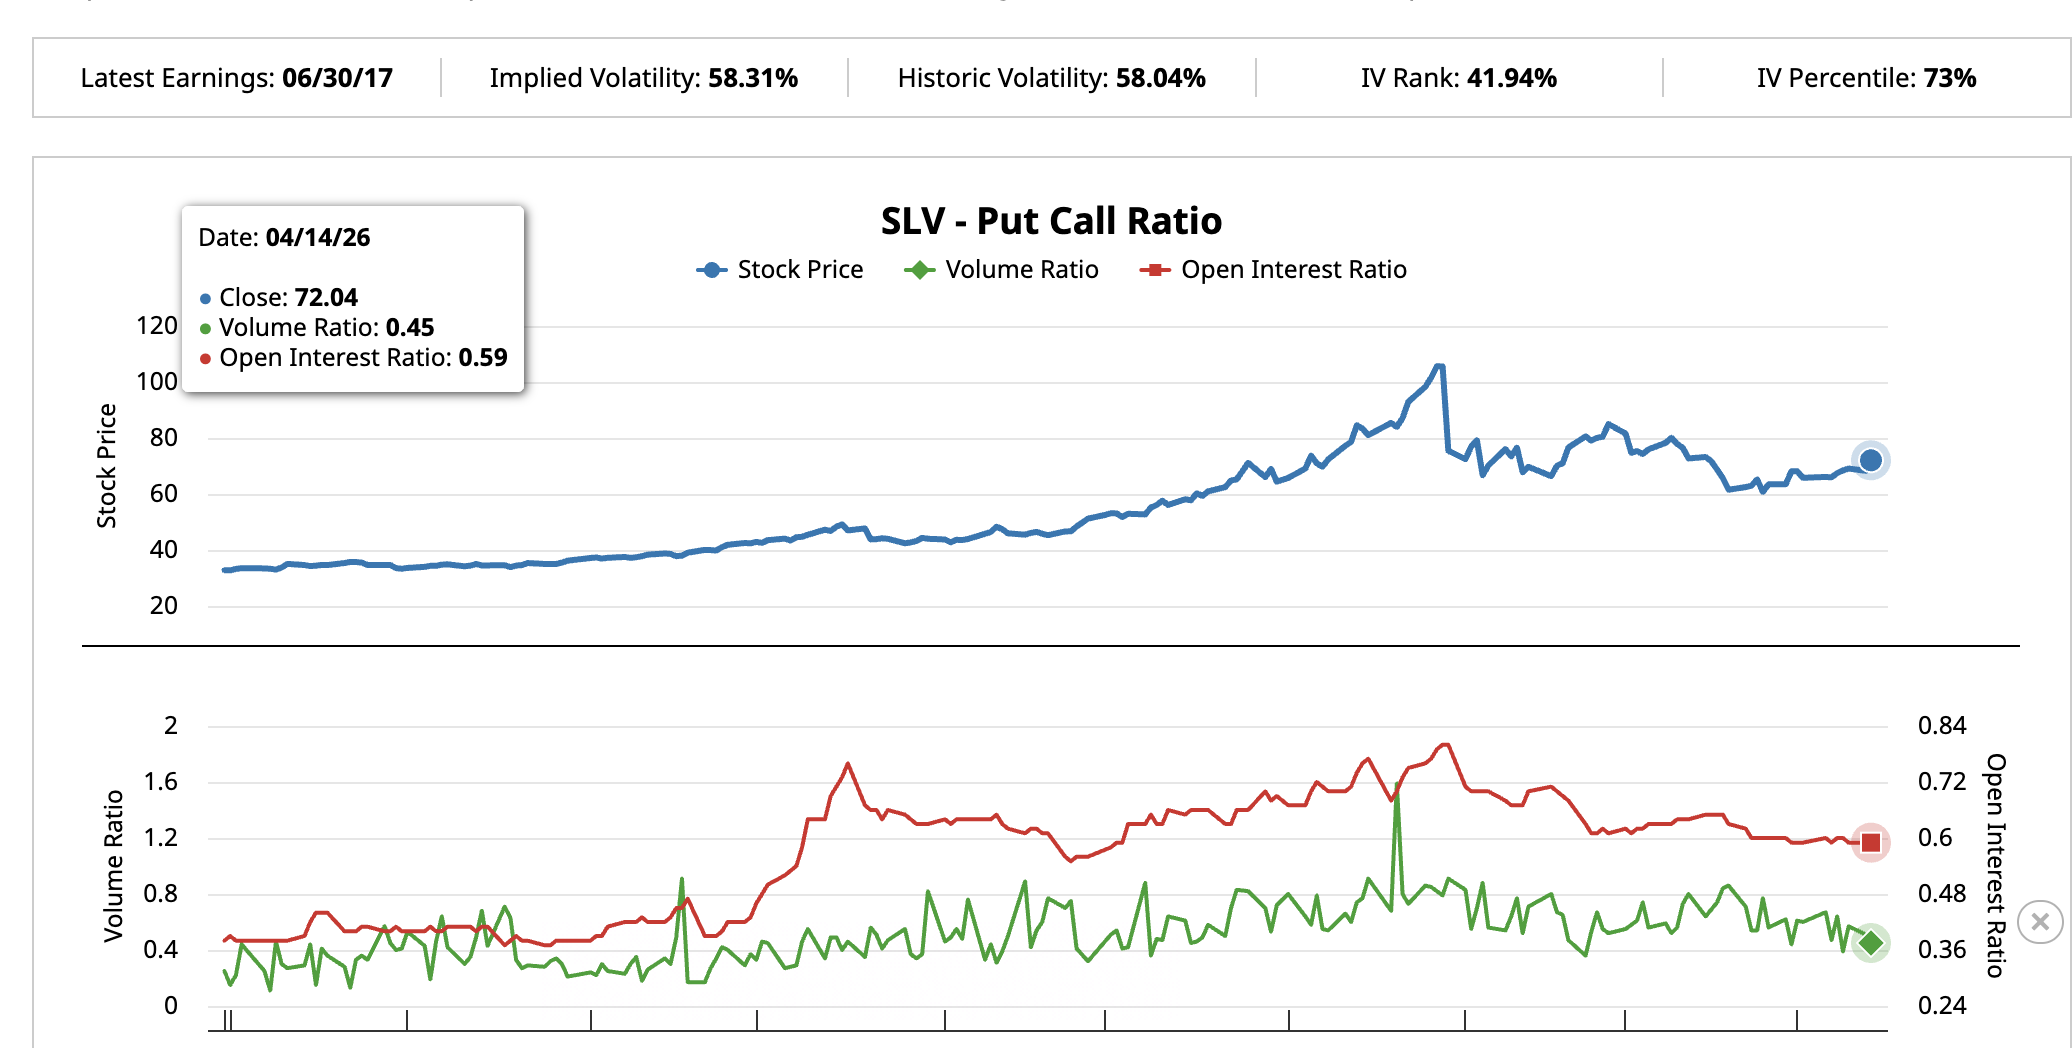
Meanwhile, options positioning on the iShares Silver Trust (SLV), the largest silver-backed ETF, confirms a shift in sentiment. On March 20, the SLV put-call open interest ratio stood at 0.63. This ratio compares bearish put bets against bullish call bets. The volume ratio was 0.86, reflecting roughly balanced positioning.
As of April 14, however, the open interest ratio has dropped to 0.59 and the volume ratio fell to 0.45. Both readings show that bearish bets are being unwound. Implied volatility sits at 58.31% with an IV Percentile of 73%. That means current volatility is elevated relative to the past year. Falling put-call ratios paired with high IV typically precede directional moves.
The DXY inverse correlation, the Solar Lag Model’s trajectory, and the SLV options shift all point in the same direction, improving bullish sentiment. However, the Silver price chart must confirm.
Silver Price Needs to Cross $84 to Shed Its Bearish Channel
The daily price chart maps the exact levels where silver must deliver. The upper trendline of the falling channel and a key technical level converge near $84.29. That level sits 6.46% above the current price.
A clean break above $84.29 would mean silver has exited the bearish channel for the first time since January 29. If the DXY continues falling and ceasefire talks hold, targets open at $91.46, $98.63, and even $108.67. The January 29 all-time high of $121.84 sits further above.
Yet a failure to break $84 would keep silver range-bound inside the channel. A drop below $75.42, the 0.236 Fibonacci, would meanwhile signal renewed dollar strength or a ceasefire breakdown. That could push silver price back toward $61.08.
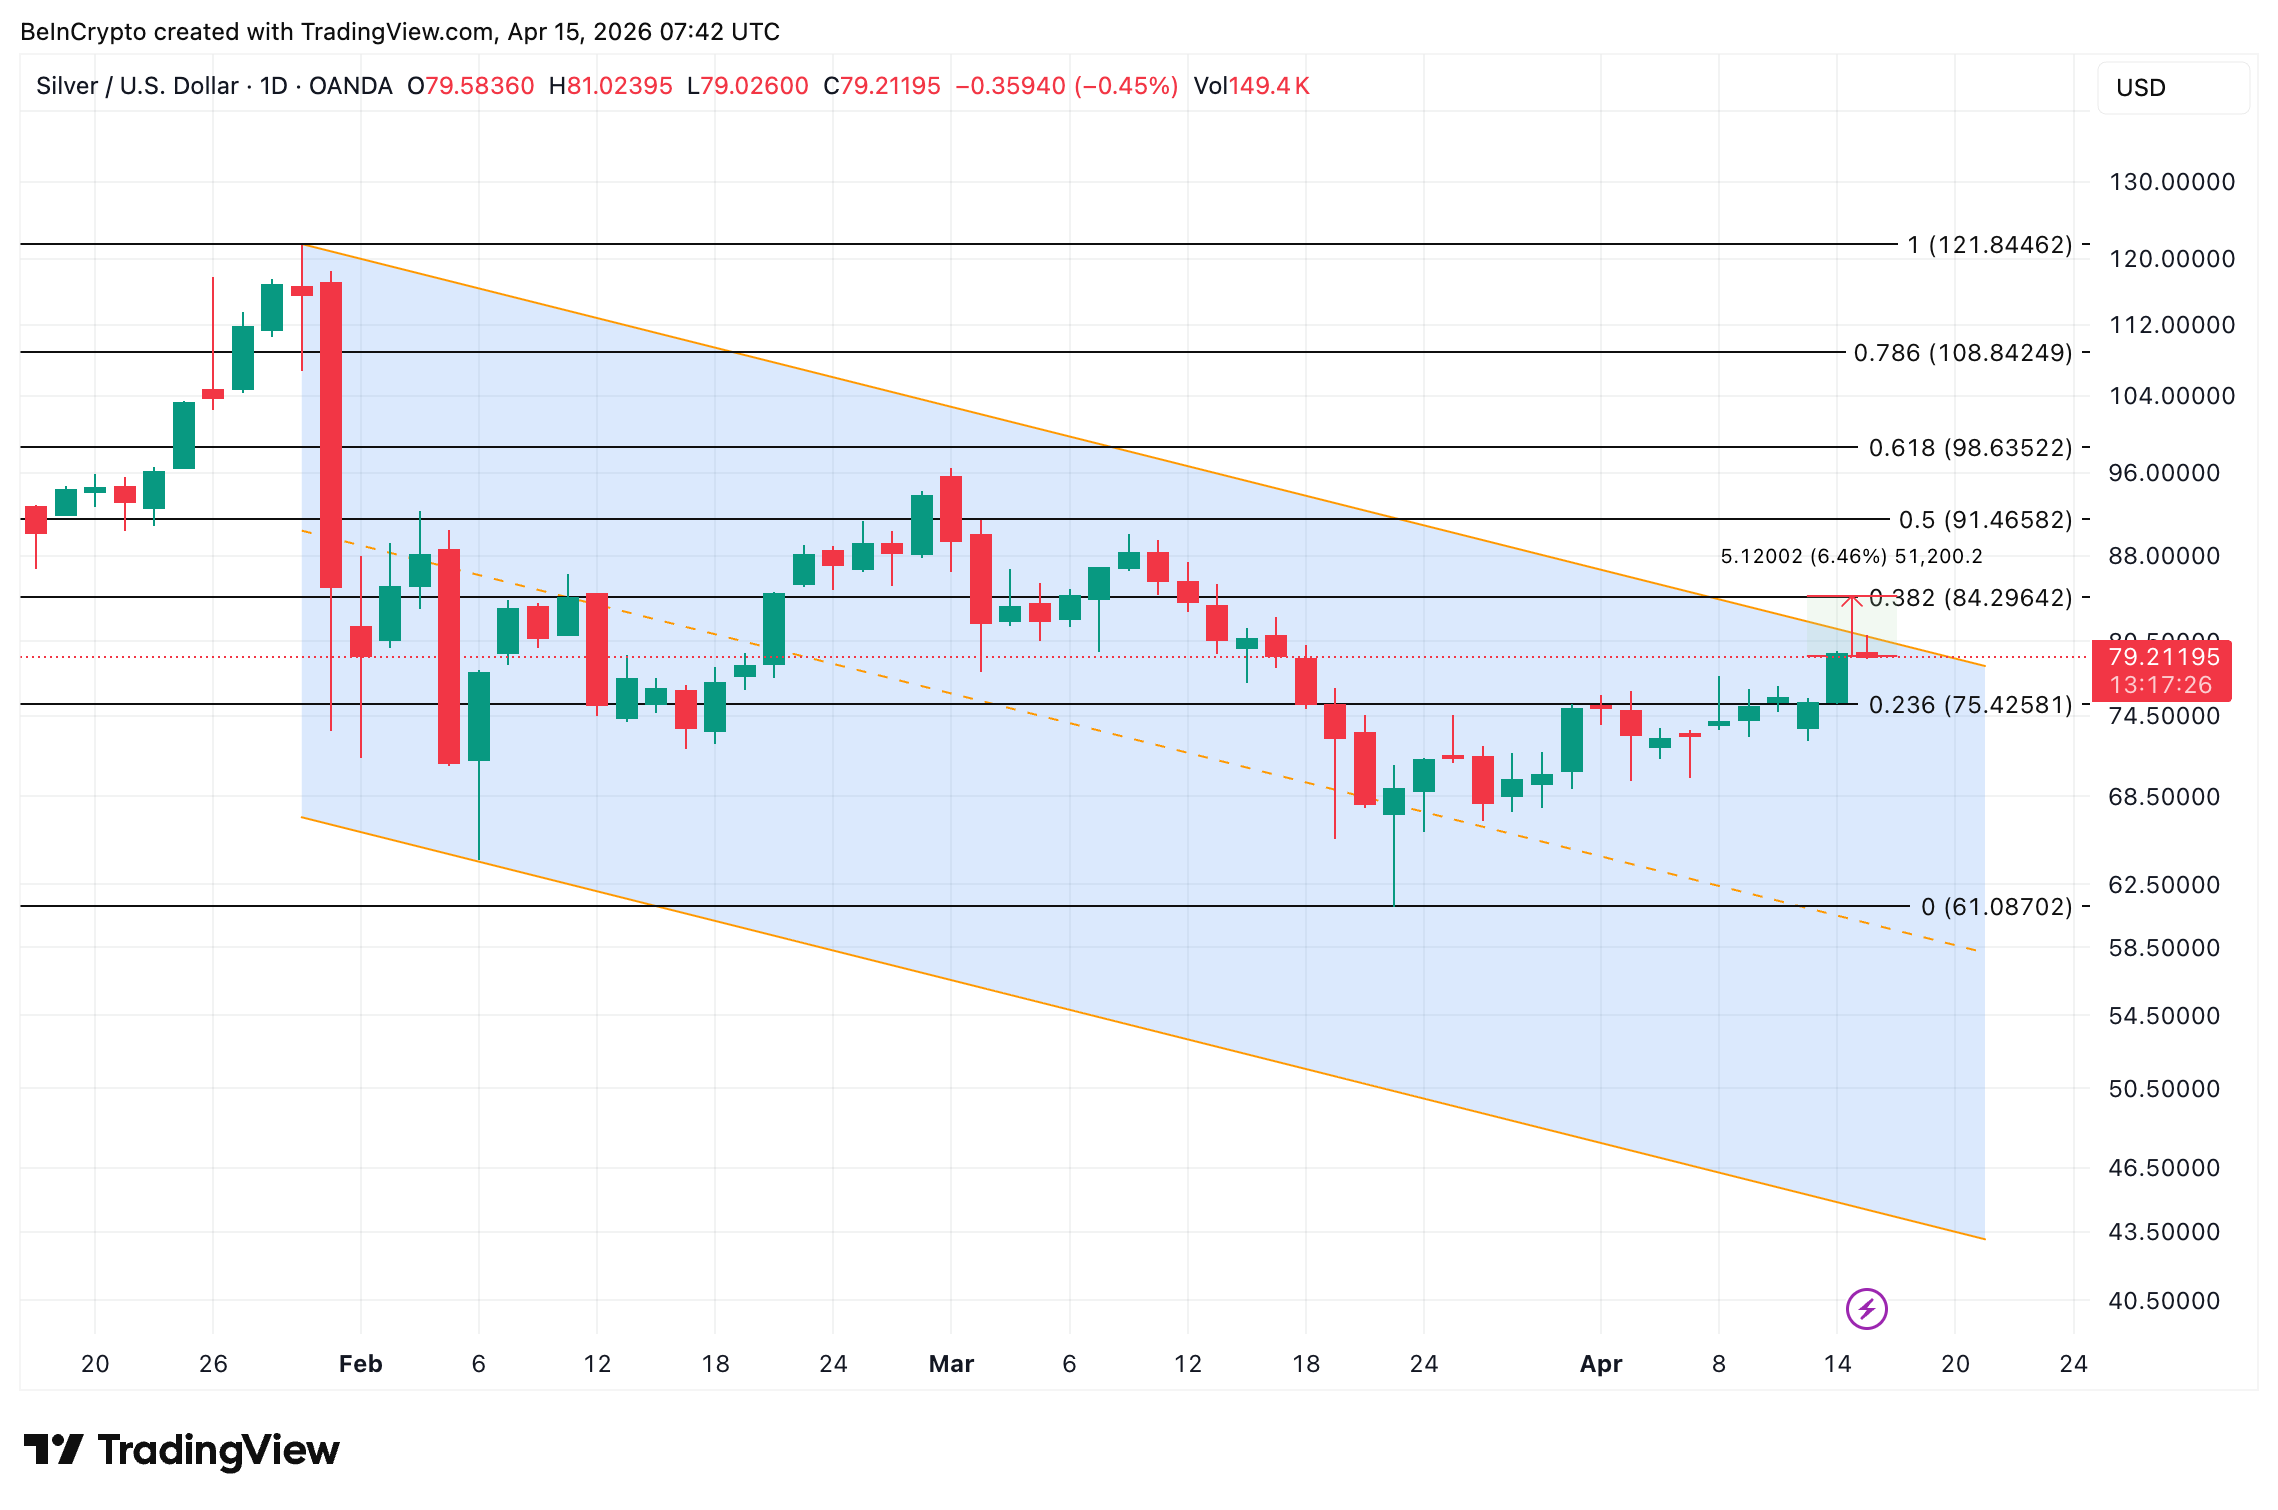
A daily close above $84 breaks the channel and opens a path toward $91 and even $108. A rejection keeps silver trapped and tests whether the 33% rally was a recovery or a dead cat bounce.
The post A Falling Dollar Handed Silver a 33% Rally, but One Level Now Decides Everything appeared first on BeInCrypto.
Tron, hate it or love it, is quietly generating real revenue. Tron coin, TRX, trades at the $0.32 price level, being the only coin in the top 10 crypto to post a daily gain, up 0.5% in the last 24 hours, with seven-day gains north of 2% even as the market bleeds, butchering bearish prediction.
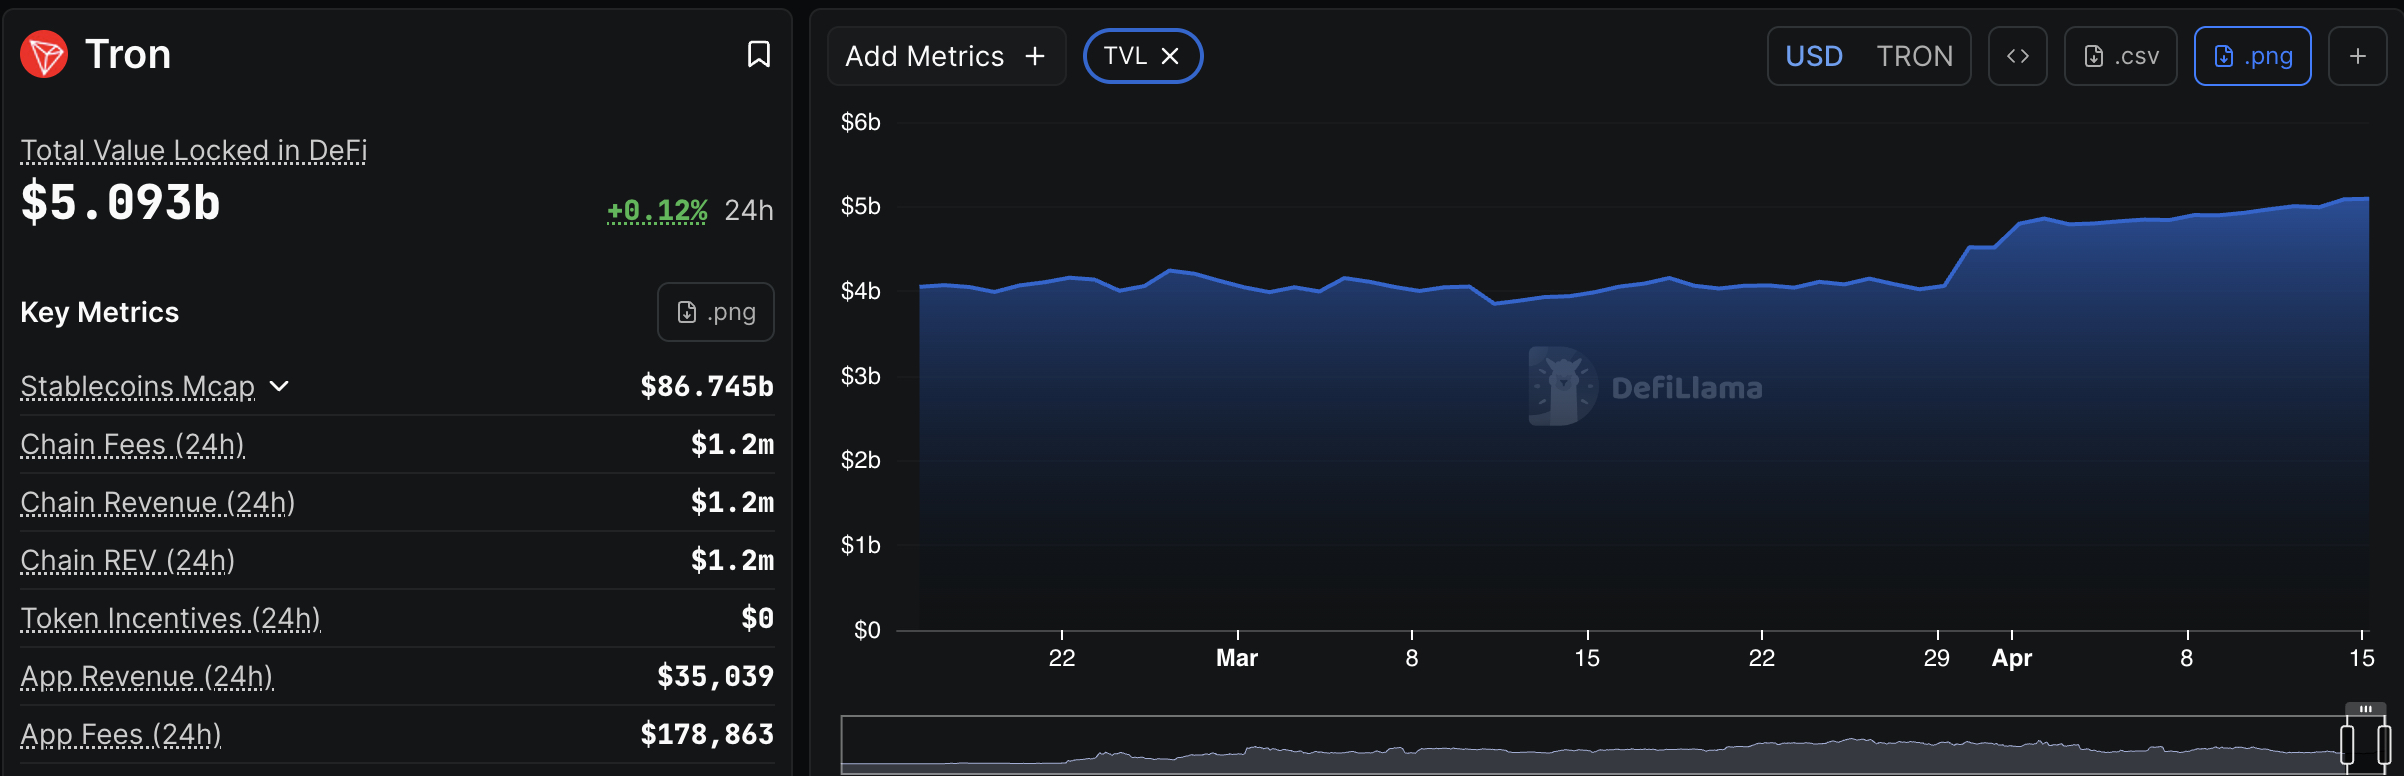
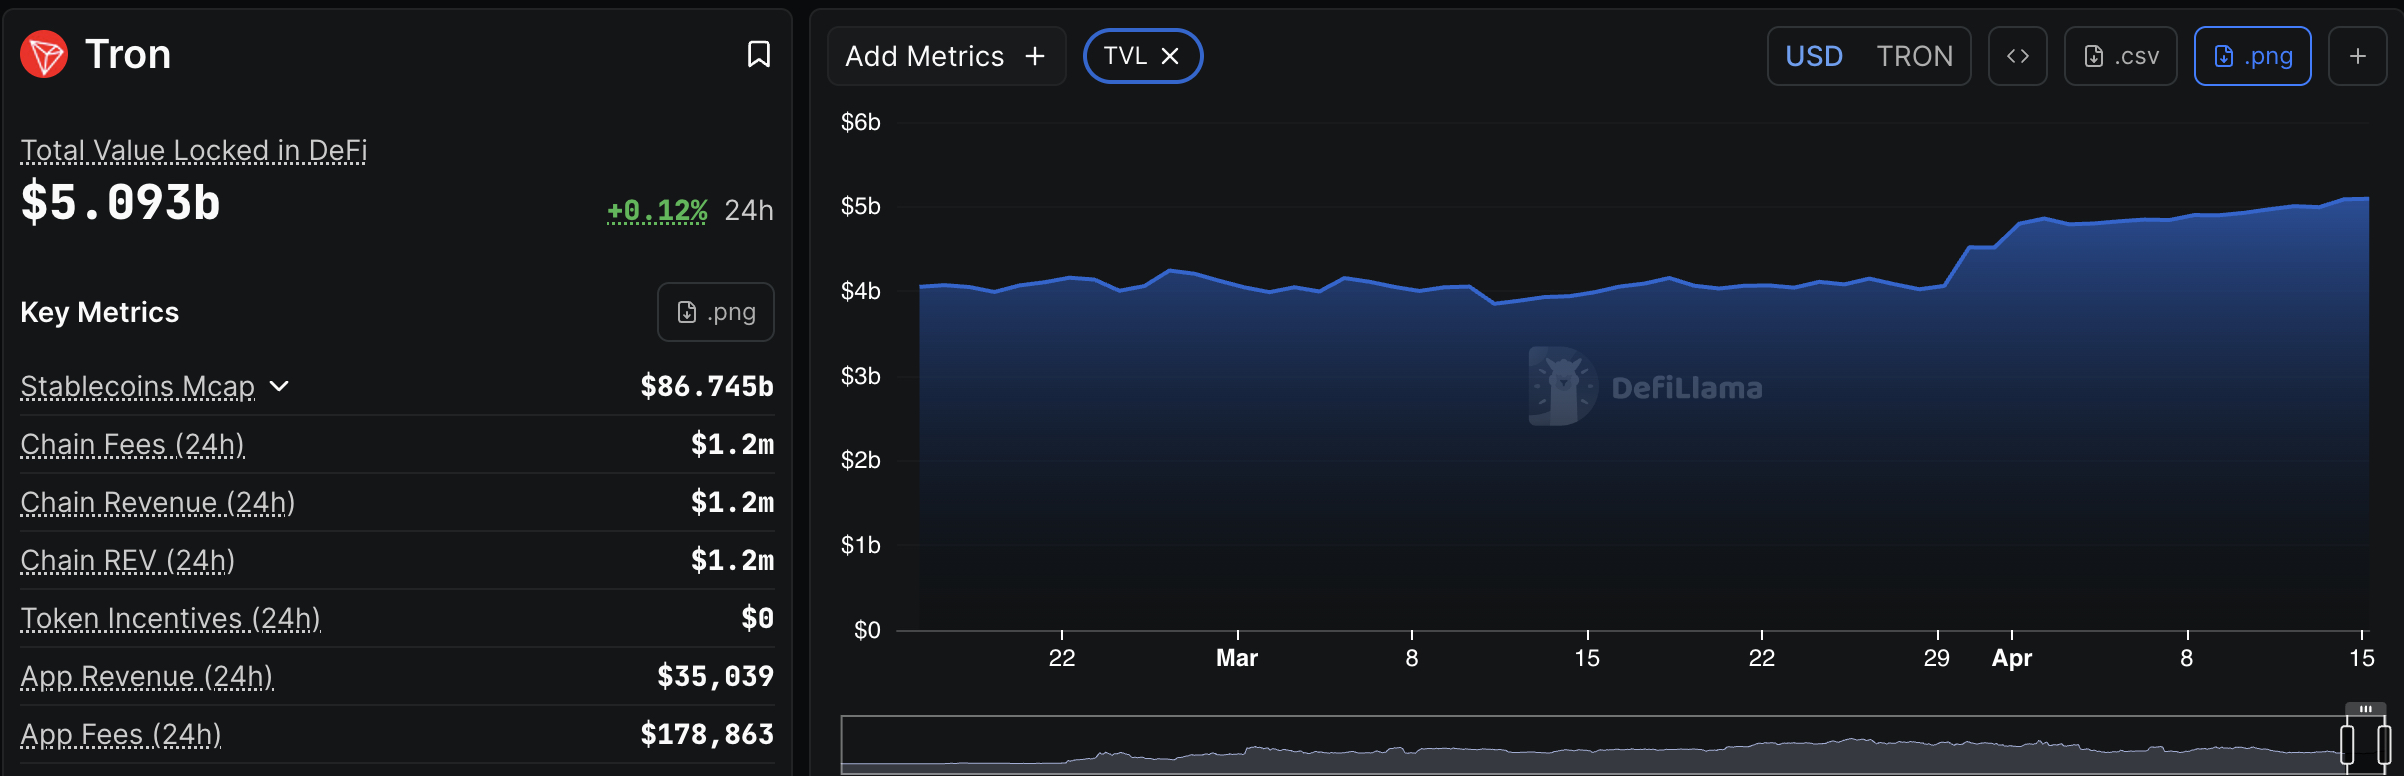
On-chain analytics platform Lookonchain confirmed Q1 2026 protocol revenue of $82.69 million for Tron, second only to Hyperliquid across all chains. TVL simultaneously reached $5 billion, reinforcing the network’s position as a top-tier capital destination.
The data landed via an X post from Lookonchain on April 15, cutting through a quarter defined by widespread contraction. Meanwhile, Tron completed a post-quantum security upgrade, a network-level development that has received far less attention.
Q1 2026 was brutal for crypto, with the total market cap falling by 20%, BTC sliding below $64K, and ETH dropping to $1,820 in the period. TRX held its range. It’s a divergence worth examining closely.
Discover: The best pre-launch token sales
Tron Price Prediction: $0.35 is to Break
TRX is consolidating near recent highs. The seven-day range of $0.31–$0.32 shows controlled price action, while the tighter 24-hour band of $0.3193–$0.3217 suggests buyers are defending the $0.32 level with conviction.
Tron’s market cap has expanded 33.8% since early 2025, supported by consistent token burns and a USDT supply on-chain now exceeding 81.2 billion, which is up by 41% since 2024, outpacing Ethereum and Solana in stablecoin settlement volume.
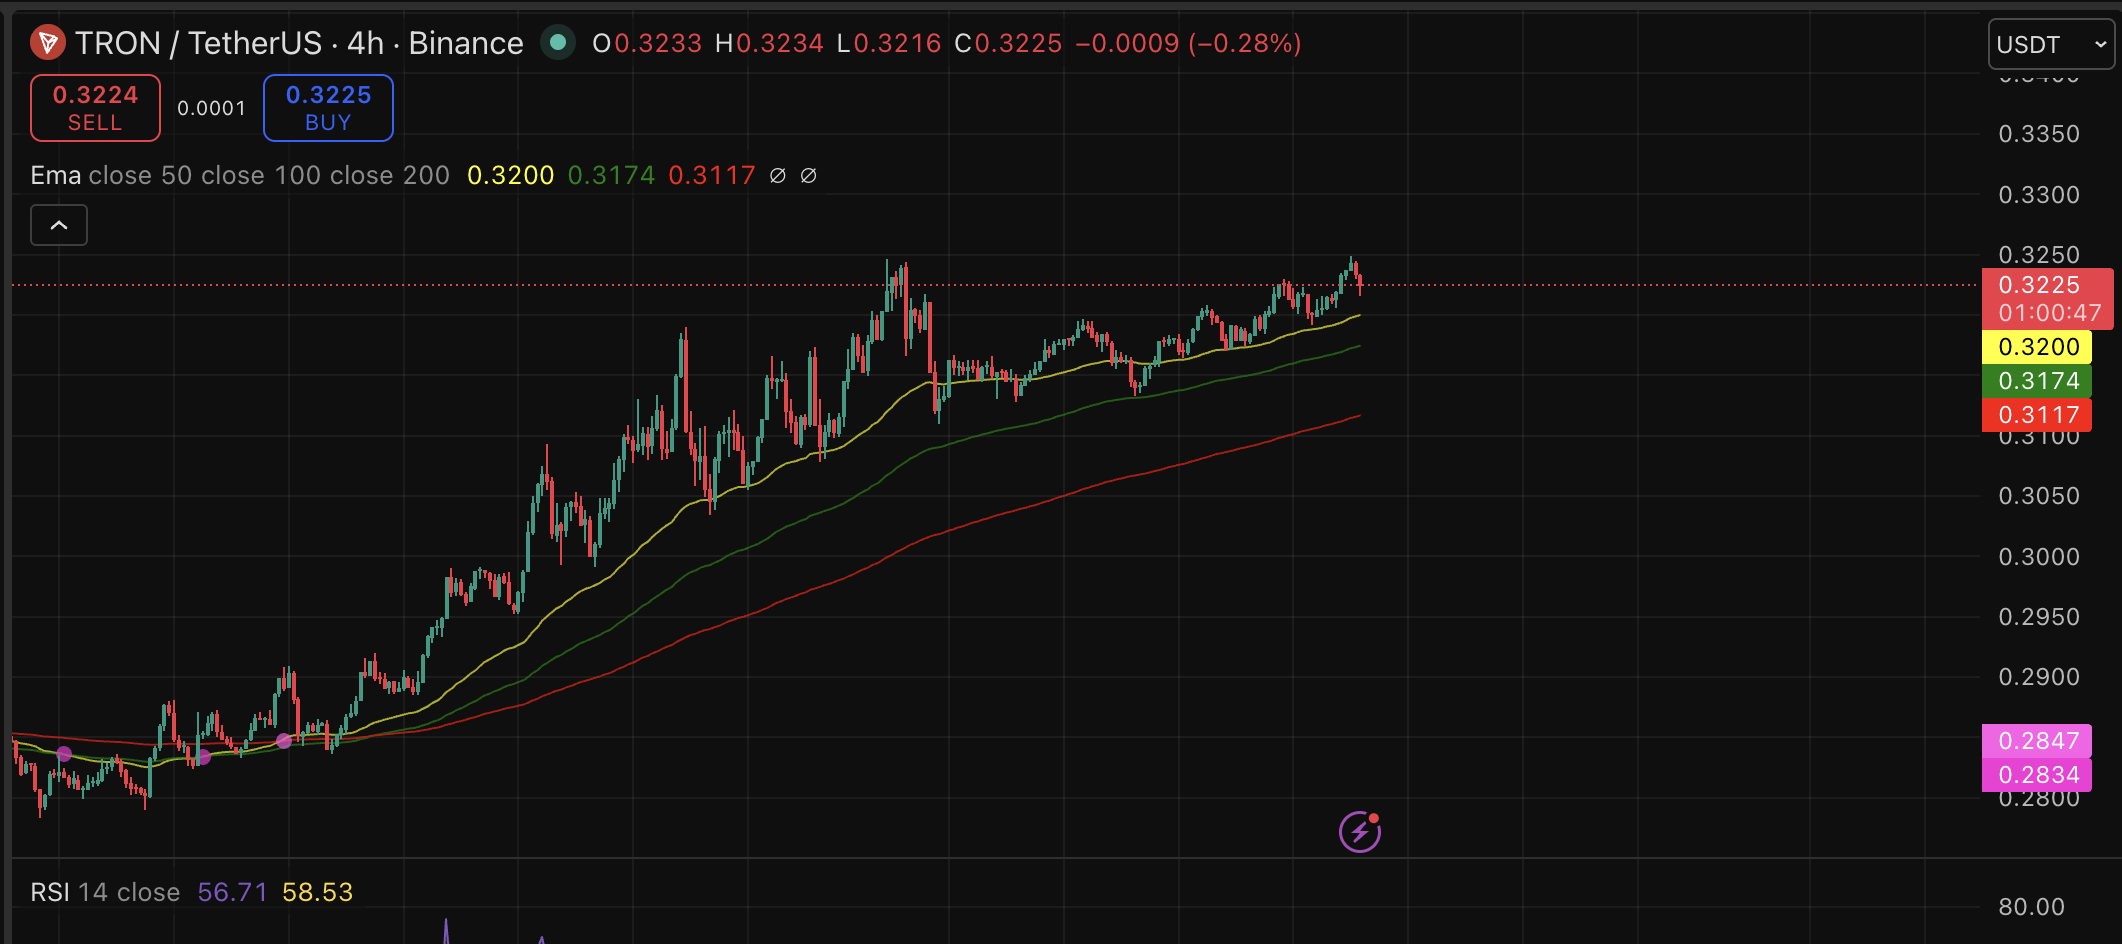
If Tron achieves a clean break above $0.32 resistance, sustained by continued stablecoin inflows and Q2 revenue momentum, it could target $0.35–$0.38. TVL stability above $5B would confirm. But a close below $0.31 flips the structure bearish and opens a retest of the $0.29 zone.
The revenue data fundamentally support the bull case.
Discover: The best crypto to diversify your portfolio with
Bitcoin Hyper to Follow TRX Bullish Momentum
TRX’s $5B TVL is genuinely impressive, yet at the current price point and an established market cap, the asymmetric upside is structurally limited compared to where TRX was in 2020 or 2021. Traders looking for that early-entry magnitude are already scanning for the next infrastructure play. That’s precisely the calculation driving attention toward Bitcoin Hyper.
Bitcoin Hyper ($HYPER) is positioning itself as the first Bitcoin Layer 2 with full Solana Virtual Machine integration, faster execution than Solana itself, with BTC-level security preserved through a Decentralized Canonical Bridge.
It addresses Bitcoin’s three core constraints: slow finality, high fees, and zero programmability. Hard numbers from the presale: current price stands at $0.0136, total raised is approaching $35 million, and staking is live with a high 36% APY for early participants.
Over $30 million raised suggests the market is taking the infrastructure thesis seriously. For traders who want exposure to Bitcoin’s next scaling narrative before price discovery, Bitcoin Hyper warrants research.
The post Tron Price Prediction: TRX With 2nd Biggest Crypto Revenue in Q1 Records $5B TVL appeared first on Cryptonews.
Bitcoin traded near $74,000 as U.S. markets opened, extending a cautious relief rally as investors weighed potential renewed ceasefire talks between the U.S. and Iran. The broader risk-on backdrop supported U.S. equities, with the S&P 500 approaching record territory, while oil prices cooled on bets that geopolitical tensions could ease.
Analysts cautioned that the move might be fragile. While geopolitical headlines offered relief, the underlying tensions—particularly Iran’s uranium enrichment program—remain unresolved. Market observers noted the absence of a clear macro shift, and options markets did not show unambiguous signals of a fresh Bitcoin breakout.
Key takeaways
- Bitcoin hovered in the mid-70,000s, with a recent test near 76,000 forming an “equal high” rather than a decisive breakout.
- Stocks climbed toward earlier highs, and WTI crude slipped, but the relief rally is viewed as temporary unless durable progress appears on Iran’s enrichment and broader macro risks.
- QCP Capital warned that the market is discounting the blockade’s impact but has not seen a lasting consolidation; enrichment remains the core sticking point.
- Traders described Bitcoin as “decision time,” with consolidation in place and the options market not fully confirming a clean breakout.
Geopolitics and markets feed crypto sentiment
On the geopolitical front, U.S. President Donald Trump claimed in Truth Social that China opted not to supply weapons to Iran, a development traders weighed as part of a broader diplomatic signal. The comments, alongside lingering tensions around the Strait of Hormuz, contributed to a mixed risk appetite as WTI crude traded below the $90 threshold and the precious metals and debt markets offered mixed directions.
Meanwhile, the S&P 500 reclaimed its yearly open level on Monday and rose to intraday highs near 6,988, closing in on fresh all-time levels. In notes on the stance of markets, QCP Capital emphasized that while equities rebounded and oil softened, the real test lies in the durability of the relief rally. In their Market Color update, the firm cautioned:
“Long-end yields barely budged, gold held its levels, and the bond market, which should be front-running an inflation relief trade more aggressively, did not follow through. When oil drops and the 10-year barely twitches, rates are telling you this is a reduction in headline risk, not a genuine resolution.”
Analysts stressed that Iran’s uranium enrichment remains the core sticking point. Reports indicate Iran continues with elevated enrichment levels, around 60%, far above U.S. demands to keep it below 20%. The gap suggests that headlines alone may not translate into a lasting accord unless Tehran signals meaningful concessions.
As the week unfolds, the market appears to price in relief from geopolitical frictions while maintaining vigilance over the longer-term risk this scenario still poses to energy prices, inflation expectations, and risk assets alike.
Bitcoin’s “decision time” on the charts
Bitcoin’s price action has drawn careful scrutiny from traders who argue that the latest move is more about consolidation than a fundamental breakout. The bounce above the March high of around $76,000 drew commentary from market observers who characterized it as an “equal high” rather than a sweep of previous tops. “Liquidity games still in play,” noted trader Jelle, who added that BTC “technically tagged those previous highs” but did not convincingly clear them, suggesting the move could reverse swiftly unless a clean breakout occurs.
“Liquidity games still in play. BTC technically tagged those previous highs — but I’m viewing this as an equal high rather than a sweep, barely went above it. Keep an eye out for a real sweep above there; that’ll likely catch a lot of traders off guard.”
Other voices urged caution. Daan Crypto Trades summarized that BTC/USD has touched the 76k level and is now in a consolidation phase with a slow, marginally higher trajectory since the start of April. QCP Capital echoed this sentiment, noting that while price action has been “grinding higher,” the options market has not confirmed a clean breakout and the broader regime remains unchanged: the Fed’s stance remains restrictive, and liquidity conditions stay tight. In their words:
“The broader regime has not changed. The Fed is still boxed in, sitting near zero net cuts for the year after the oil shock repriced the easing path, while liquidity conditions remain tight. This is a geopolitical relief rally, not a macro regime shift.”
What comes next for BTC and risk assets
With the macro environment still driven by geopolitical headlines and central-bank policy uncertainty, Bitcoin’s next move hinges on whether relief translates into durable momentum. The market appears to be pricing in a temporary easing of the energy-price premium, but the absence of a confirmed breakout implies that traders should brace for ongoing volatility unless there is credible progress on Iran’s nuclear talks that could alter the risk landscape.
For investors, the key signals to watch include a sustained upside beyond the 76,000 level with broad participation across volatility and derivative markets; a synchronized move across equities, bonds, and commodities; and any tangible progress in talks over Iran’s nuclear program that could alter risk appetite. Until those elements converge, the current rally may reflect tactical repositioning rather than a structural shift in the crypto market.
As geopolitical developments continue to evolve, readers should stay alert to policy cues and headline risk that can rapidly reframe risk tolerance for crypto plays.
In the near term, the market’s focus remains on whether a credible breakthrough is achieved on Iran-related tensions and how such a development would influence liquidity and risk assets, including Bitcoin.
Crypto World
Zoomex Launches ZoomexStocks: Trade Global Equities with USDT + Limited-Time Fee Rebate Campaign


Crypto trading platform Zoomex today officially announced the launch of ZoomexStocks, enabling users to trade global equity assets directly using USDT—without the need for a traditional brokerage account.
At launch, 12 major U.S. equity-related assets are available, covering leading tech stocks, core indices, and crypto-related equities, including Apple, Tesla, and NVIDIA. Users can start trading with as little as 5 USDT.
To celebrate the launch, Zoomex is introducing a limited-time trading fee rebate campaign, offering up to 100 USDT in rebates to further lower the barrier to entry.
Breaking Traditional Barriers: A Stock Trading Experience Designed for Crypto Users
ZoomexStocks introduces a new way to access equity markets—distinct from traditional brokerage systems—allowing users to manage both crypto and stock exposure within a single account:
• No brokerage account required — trade directly with an existing Zoomex account
• No fiat deposits needed — supports USDT / USDC trading
• Simplified workflow — no platform switching or cross-border transfers
This product is purpose-built for crypto-native users, enabling frictionless access to global markets.
Three Core Asset Categories
The initial launch includes three categories to support diverse trading strategies:
Tech Stocks
Apple (AAPLx), Tesla (TSLAx), Alphabet (GOOGLx), NVIDIA (NVDAx), Meta (METAx), Amazon (AMZNx)
Index Assets
Nasdaq (QQQx), S&P 500 (SPYx)
Crypto-Related Stocks
MicroStrategy (MSTRx), Robinhood (HOODx), Circle (CRCLx), Coinbase (COINx)
With a unified account, users can seamlessly manage cross-asset allocation and strategy execution within a single platform.
Transparent Pricing & Liquidity Design
ZoomexStocks uses a price-mirroring mechanism based on real market data, referencing major exchanges such as Nasdaq and NYSE:
• Real-time price synchronization to minimize deviation
• Profit and loss calculated based on price movements
• Buy and sell anytime for enhanced liquidity
Note: ZoomexStocks provides exposure to the price performance of underlying assets and does not represent direct ownership of equities.
24/7 Trading: Beyond Traditional Market Hours
Unlike traditional stock markets, ZoomexStocks supports 24/7 trading, allowing users to:
• Position ahead of weekends
• React instantly to macro or industry news
• Dynamically hedge between crypto and equity assets
This model offers greater flexibility and aligns with the always-on nature of crypto markets.
Limited-Time Trading Fee Rebate Campaign
To encourage users to explore the new product, Zoomex is launching a promotional campaign:
• 100% rebate on stock token trading fees during the campaign
• Maximum rebate per user: 100 USDT
• Total prize pool: 50,000 USDT
• Rewards distributed within 7 working days after the campaign ends
Users must register for the campaign to qualify – it is possible to join here.
A Zoomex product lead commented:
“ZoomexStocks is not about replicating traditional brokerages—it’s about offering crypto users a more intuitive way to access global assets.”
“By lowering barriers and simplifying the process, we aim to enable users to manage multi-asset portfolios within a single platform.”
For more information about Zoomex US stock-related assets, please visit
About ZOOMEX
Founded in 2021, Zoomex is a global cryptocurrency trading platform with over 3 million users across more than 35 countries and regions, offering 700+ trading pairs. Guided by its core values of “Simple × User-Friendly × Fast,” Zoomex is also committed to the principles of fairness, integrity, and transparency, delivering a high-performance, low-barrier, and trustworthy trading experience.
Powered by a high-performance matching engine and transparent asset and order displays, Zoomex ensures consistent trade execution and fully traceable results. This approach reduces information asymmetry and allows users to clearly understand their asset status and every trading outcome. While prioritizing speed and efficiency, the platform continues to optimize product structure and overall user experience with robust risk management in place.
As an official partner of the Haas F1 Team, Zoomex brings the same focus on speed, precision, and reliable rule execution from the racetrack to trading. In addition, Zoomex has established a global exclusive brand ambassador partnership with world-class goalkeeper Emiliano Martínez. His professionalism, discipline, and consistency further reinforce Zoomex’s commitment to fair trading and long-term user trust.
In terms of security and compliance, Zoomex holds regulatory licenses including Canada MSB, U.S. MSB, U.S. NFA, and Australia AUSTRAC, and has successfully passed security audits conducted by blockchain security firm Hacken. Operating within a compliant framework while offering flexible identity verification options and an open trading system, Zoomex is building a trading environment that is simpler, more transparent, more secure, and more accessible for users worldwide.
For more info: ZOOMEX Website | X | Telegram | Discord
The post Zoomex Launches ZoomexStocks: Trade Global Equities with USDT + Limited-Time Fee Rebate Campaign appeared first on BeInCrypto.

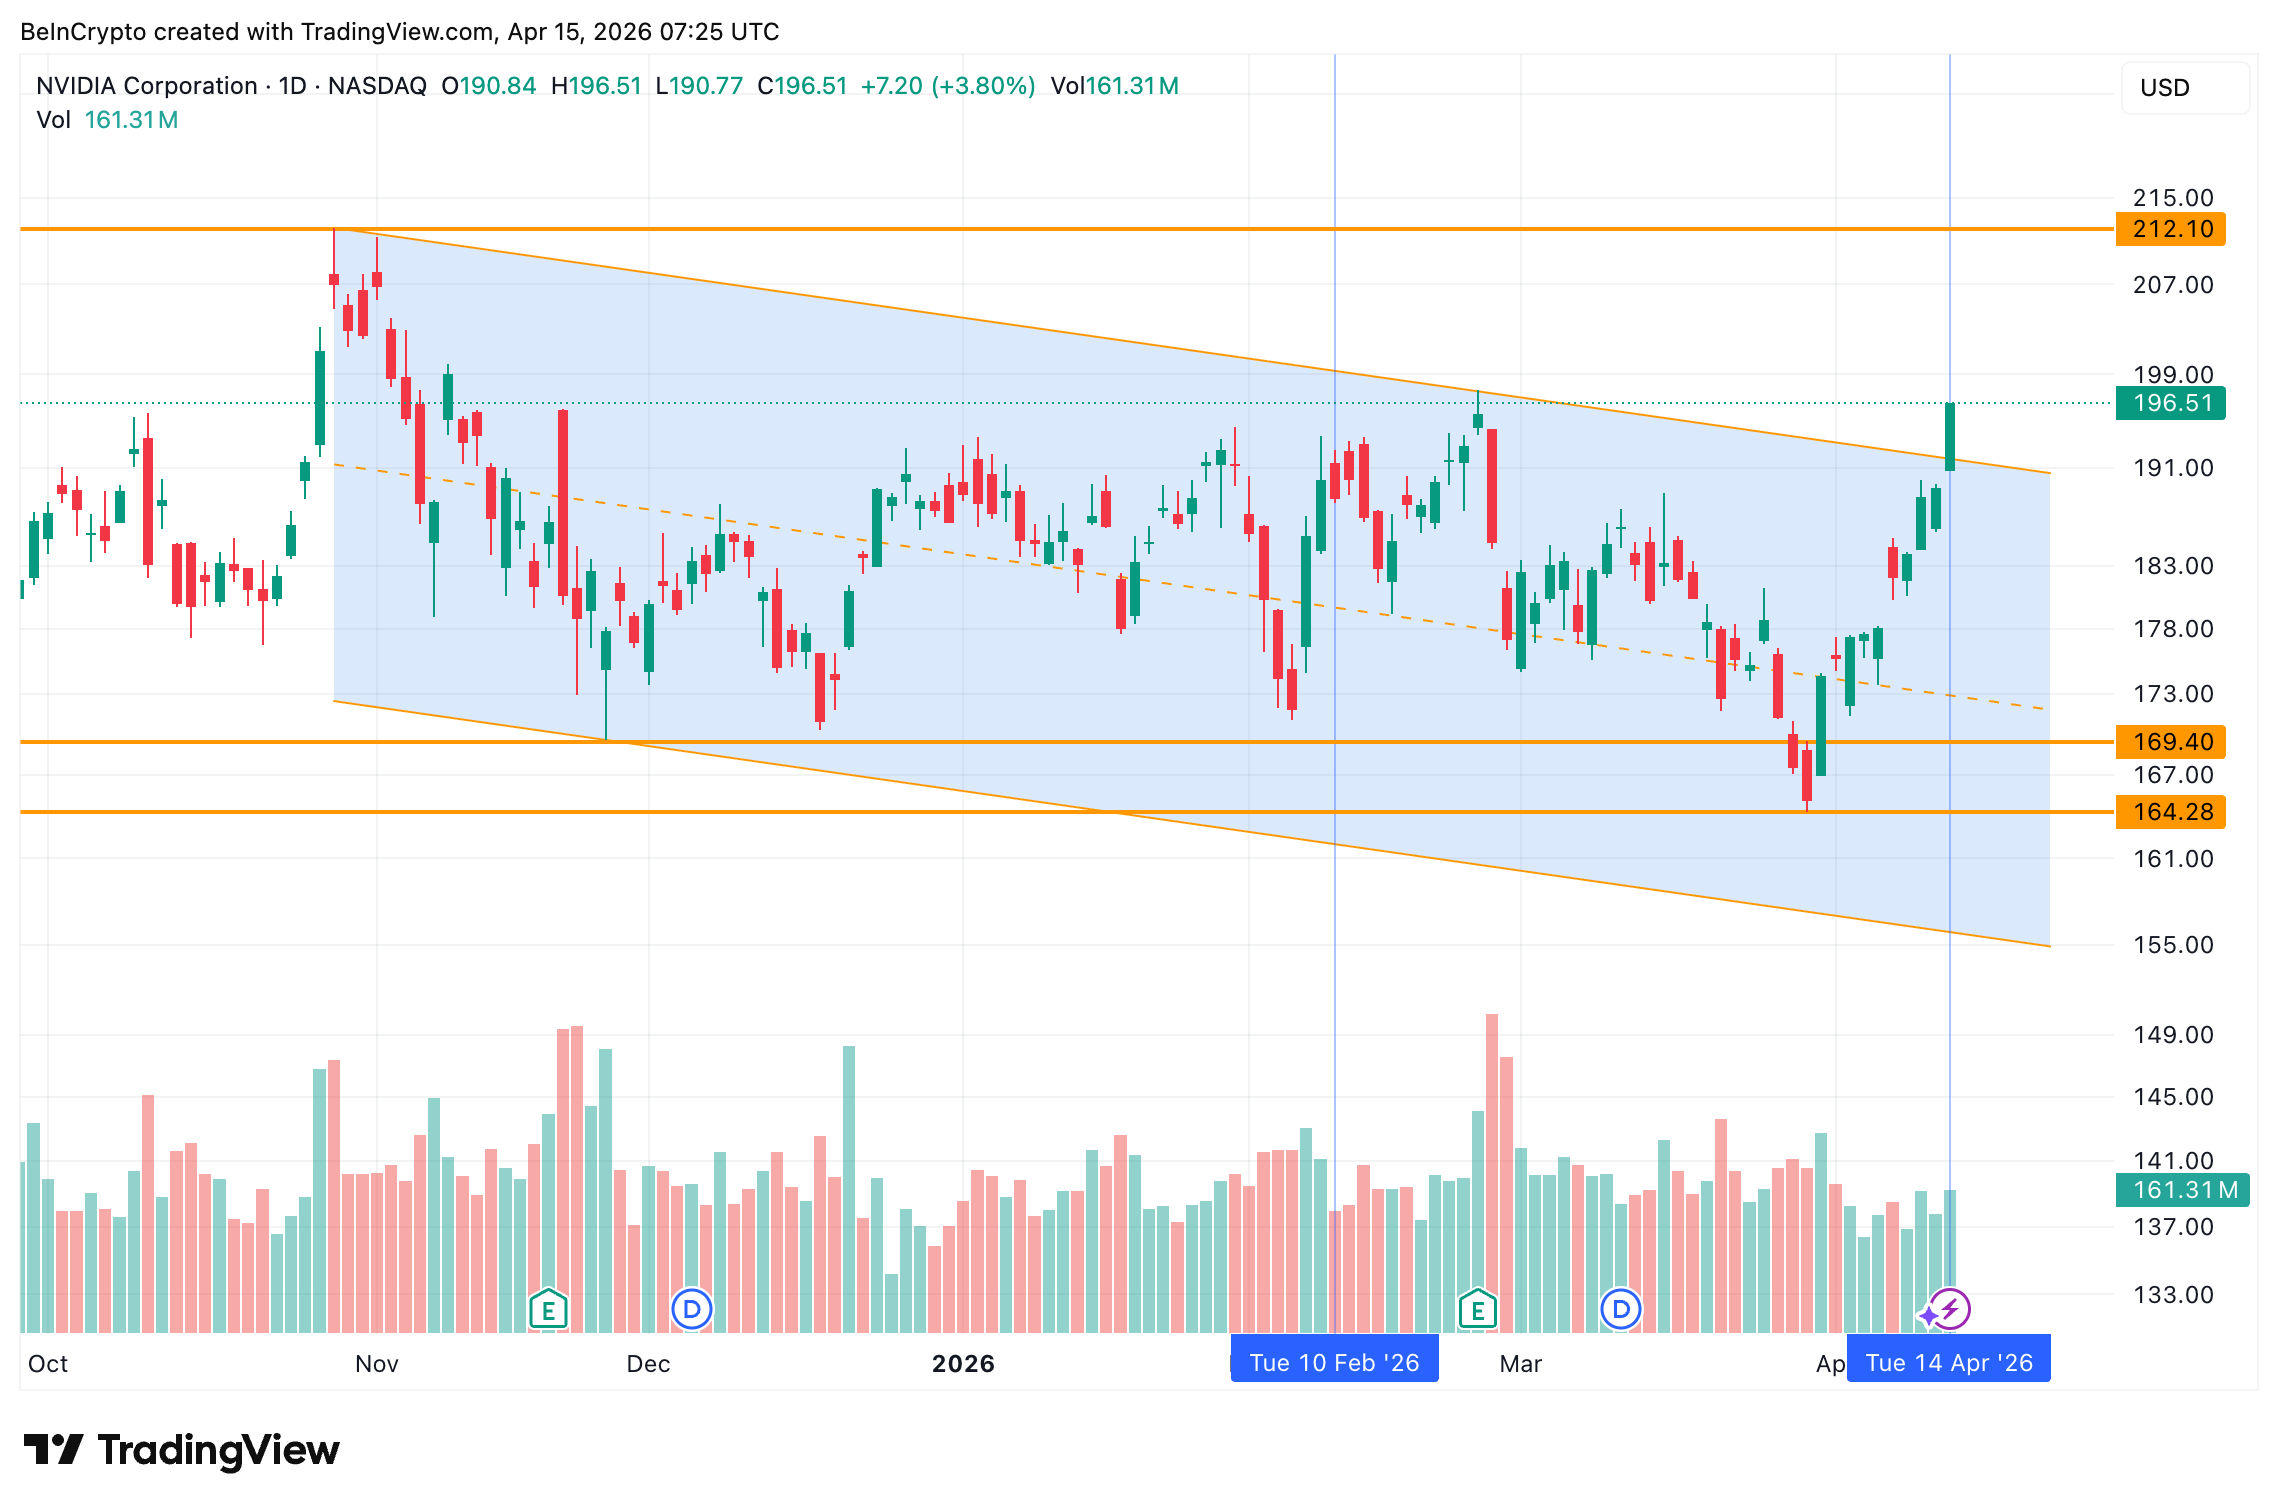
Nvidia (NVDA) stock price closed April 14 at $196.51, up 3.80%, marking a 4-day winning streak. The move broke NVDA out of a falling channel that had held since late October.
Yet a proprietary indicator reveals something the price chart alone does not show. The broader semiconductor sector has been gaining strength far faster than Nvidia itself. NVDA appears to have been carried to its breakout rather than leading it.
Channel Break With Volume as Three Green Bars Confirm the Push
Nvidia stock price has traded inside a falling channel on the daily chart since October 29, 2025. Every rally attempt over the past six months stalled at the channel’s upper trendline before reversing.
That changed on April 14. NVDA broke above the channel’s upper boundary with four consecutive green volume bars. Volume hit 161.31 million shares on the breakout candle. The rising sequence confirms that buying pressure built progressively rather than arriving in a single spike.
Want more insights like this? Sign up for Editor Harsh Notariya’s Daily Newsletter here.
The breakout is structurally significant. It marks the first clean exit from the bearish channel since NVDA peaked in late October. However, a channel breakout only tells half the story. The question is whether Nvidia earned this move on its own merits or was pushed through by a broader force. And can the breakout even hold?
The Chip Sector Outran Nvidia and Dragged It to a Breakout
BeInCrypto’s NVDA versus SOXX Relative Performance indicator is a proprietary tool. It normalizes both to a common baseline and tracks which is gaining faster in real time.
The VanEck Semiconductor ETF (SOXX), a fund that tracks the broader chip sector, currently reads on the normalized scale. NVDA sits lower. The gap has been widening since February 10. Between February 10 and April 14 another thing happened. SOXX trended higher while NVDA trended lower on the relative scale. Yet NVDA stock still broke out.
A similar gap-widening happened in late November as SOXX led NVDA. This eventually helped the Nvidia share price avoid a drop under $169.47.
The implication is clear. The sector was fueled by TSMC’s record earnings, CoreWeave’s AI deals, and soft PPI data.
That created enough upward force to lift even its underperformer through resistance.
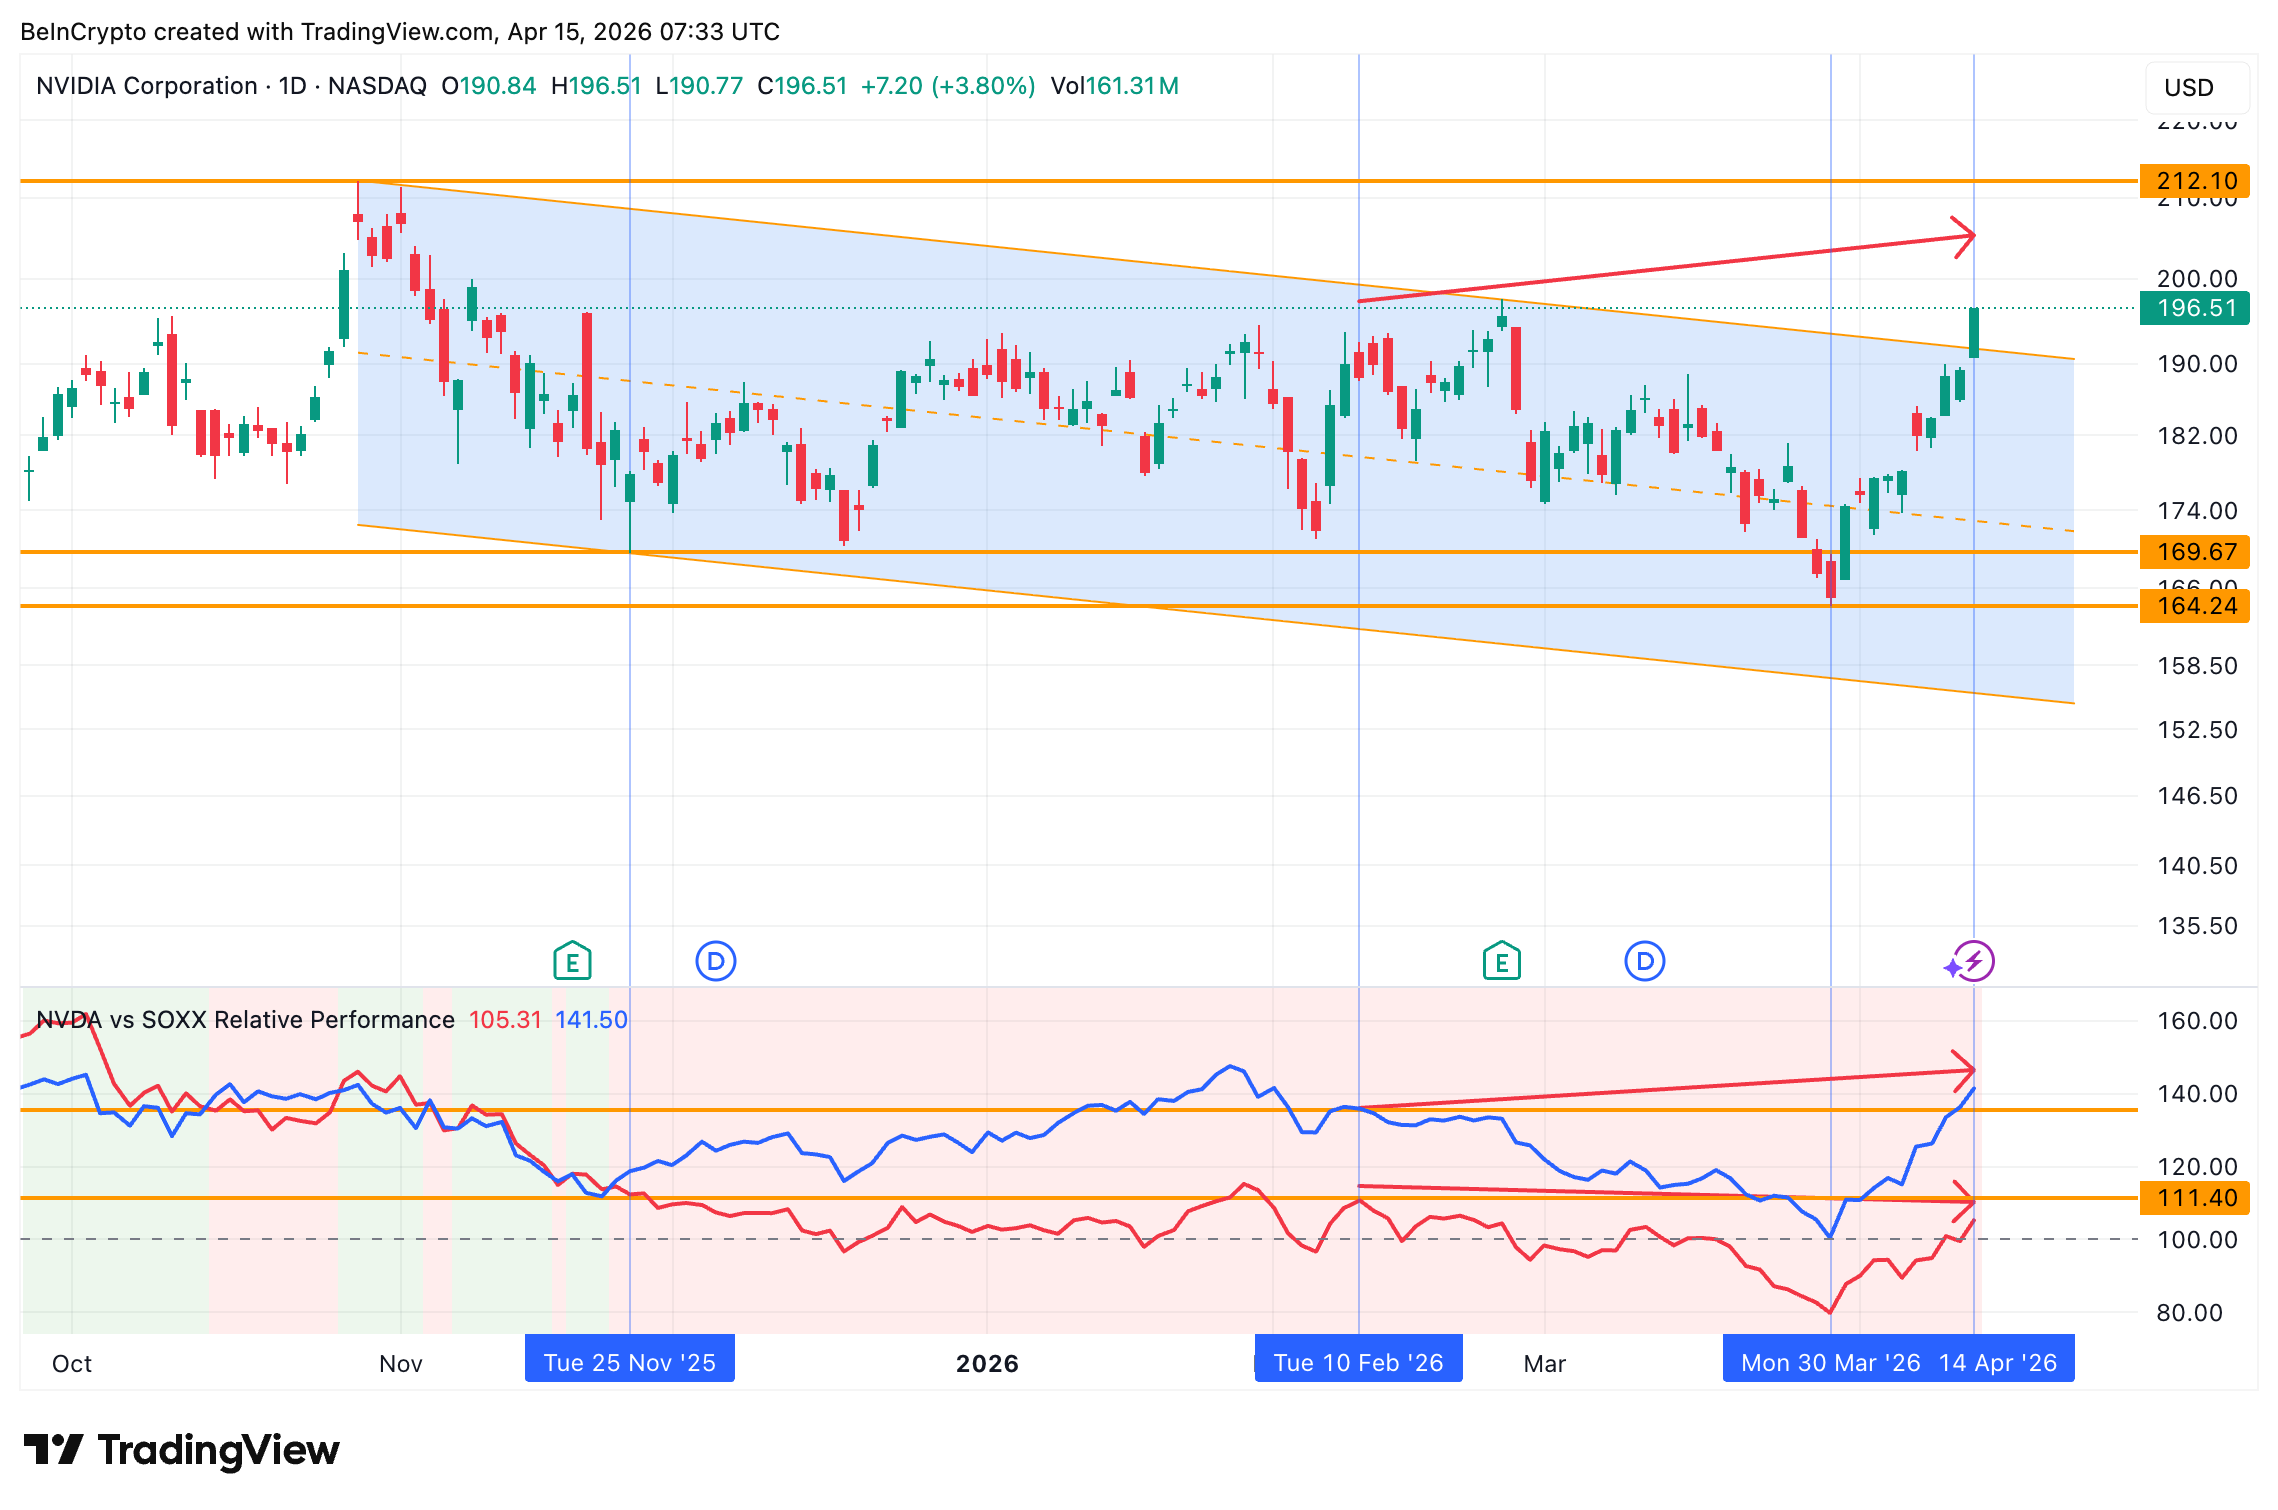
The year-to-date numbers confirm the gap. SOXX is up roughly 28% in 2026. NVDA has gained just 4%. The chip sector outpaced Nvidia by 24 percentage points.
Meanwhile, options positioning on NVDA reflects cautious optimism rather than outright conviction. On February 10, the put-call volume ratio, which compares bearish bets against bullish bets, stood at 0.69.
As of April 14, it has dropped to 0.41. Call activity is rising, but the open interest ratio held steady near 0.85. That means traders are adding new bullish bets without unwinding existing hedges. The positioning mirrors the SOXX story. Money is flowing in, but with protection still in place.
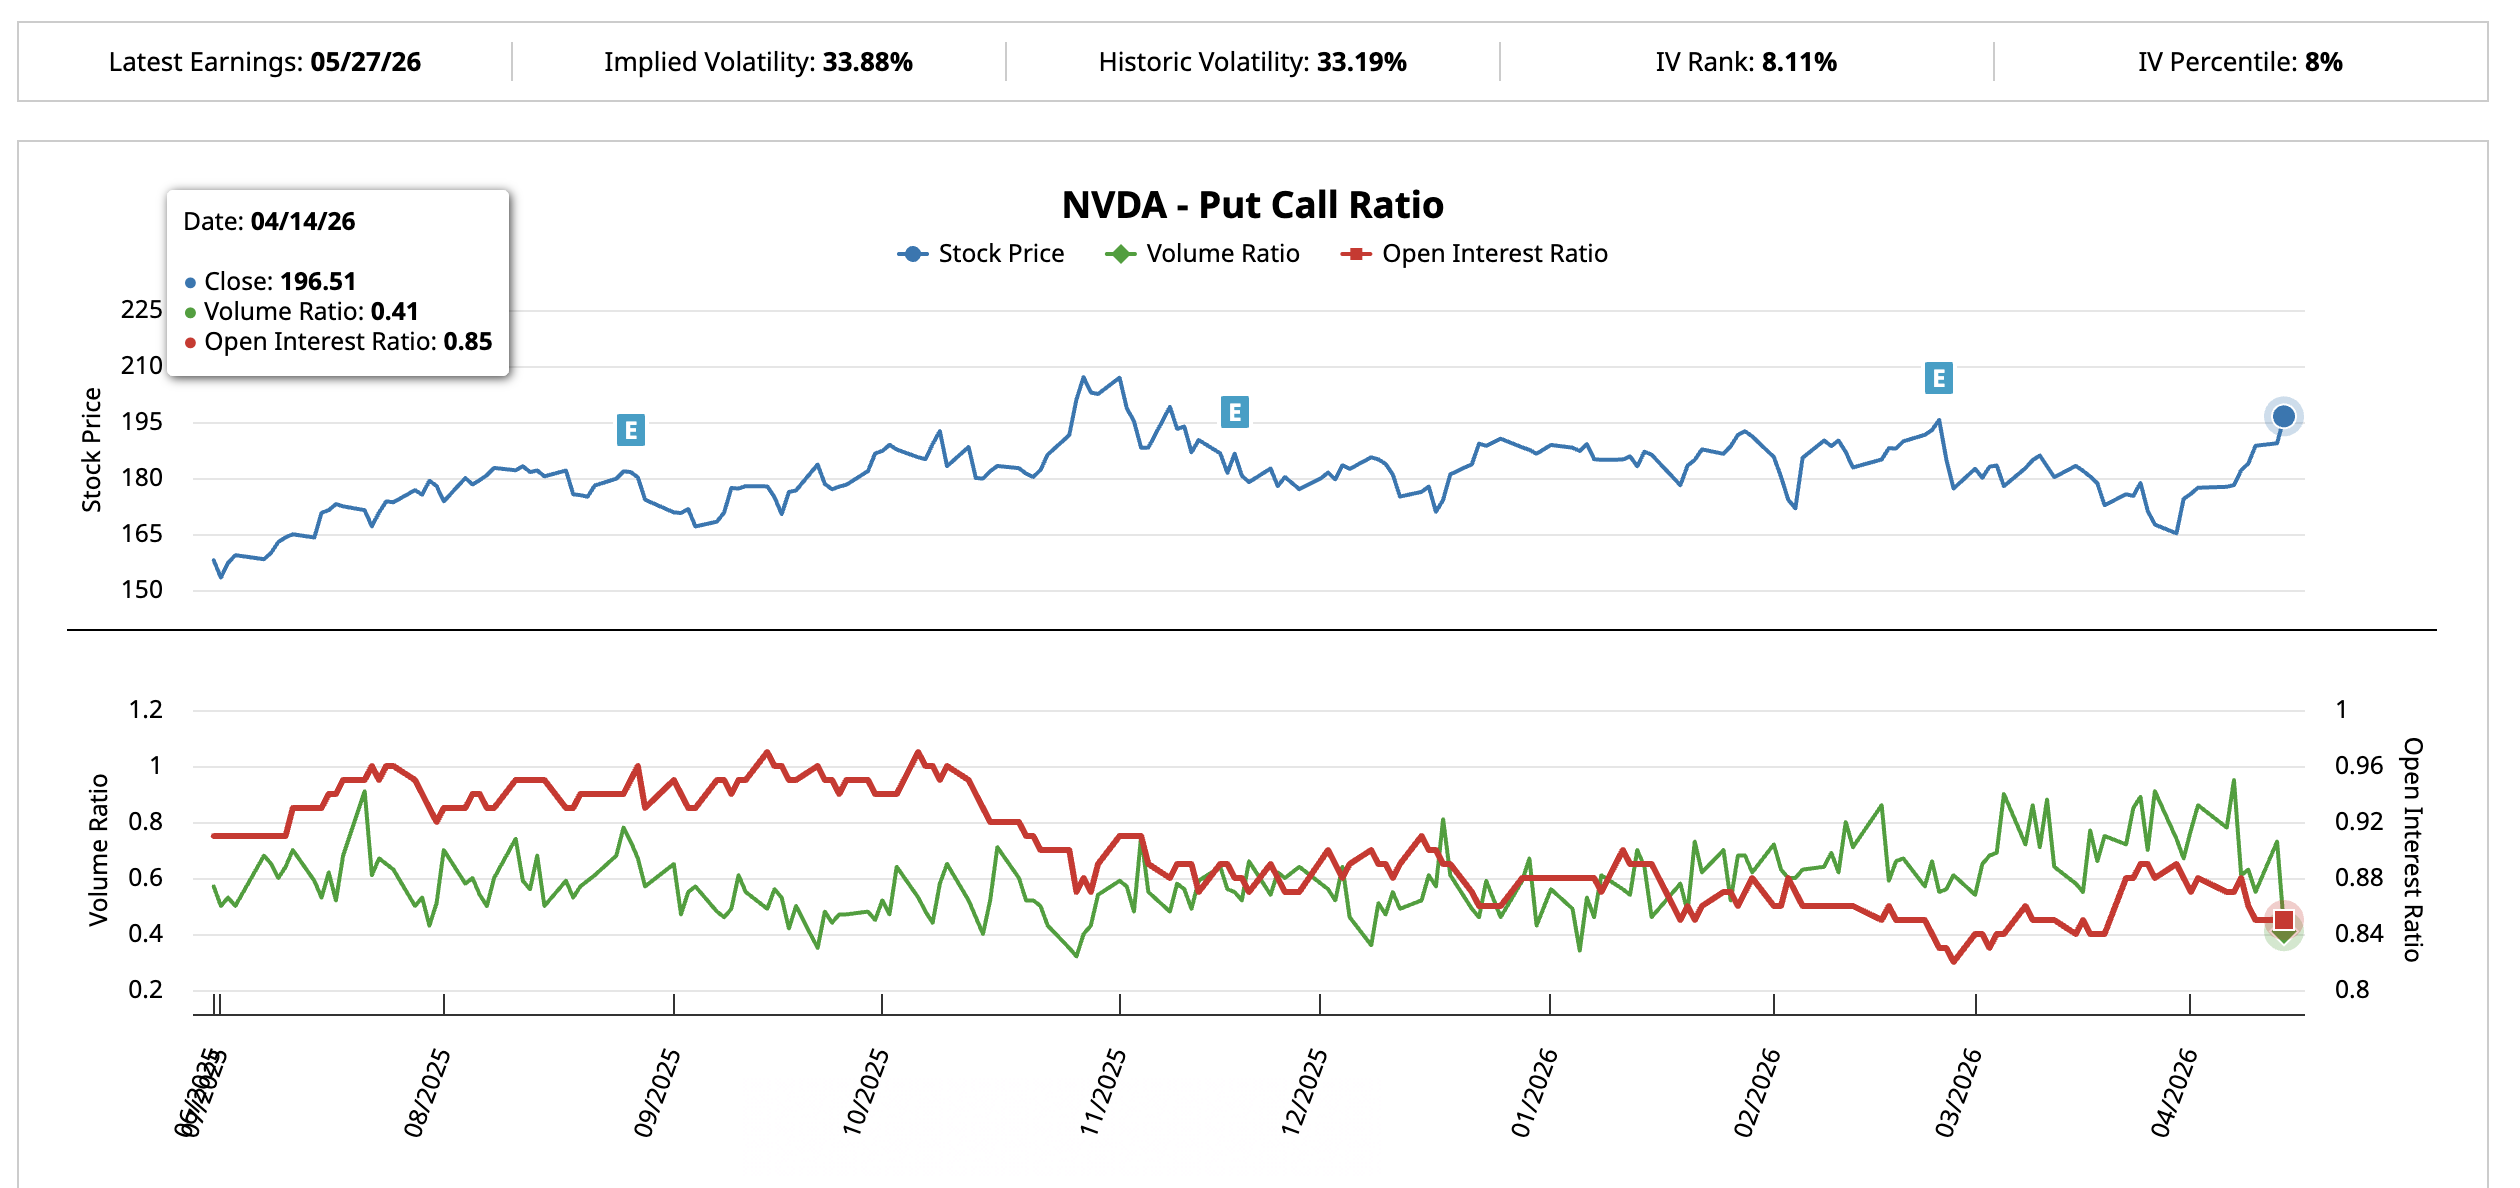
The sector tailwind and cautious options positioning both support the breakout. However, without NVDA closing the performance gap with SOXX, the rally risks being a passenger’s ride.
Nvidia Stock Price Levels That Decide If the Breakout Holds
The daily price chart maps where Nvidia stock price must deliver. NVDA has broken above $193.88, the 0.618 Fibonacci level. That zone was rejected earlier in 2026 and has been reclaimed until now.
Holding above $193.88 keeps the breakout intact. The next target sits at $201.92, the 0.786 Fibonacci, just 2.84% above the current price. That level also aligns with the psychological $200 mark. Beyond $200, $212.17 comes into focus, matching the October high.
Yet with NVDA lagging the sector by 24 points, conviction at higher prices depends on closing that gap. If SOXX stalls and NVDA keeps climbing, leadership shifts. If SOXX keeps rising while NVDA flatlines, however, the sector-driven lift fades.
Nvidia stock price support sits at $188.23, the 0.5 Fibonacci level. A loss of that exposes $182.58. However, the channel breakout only fully weakens below $164.28.
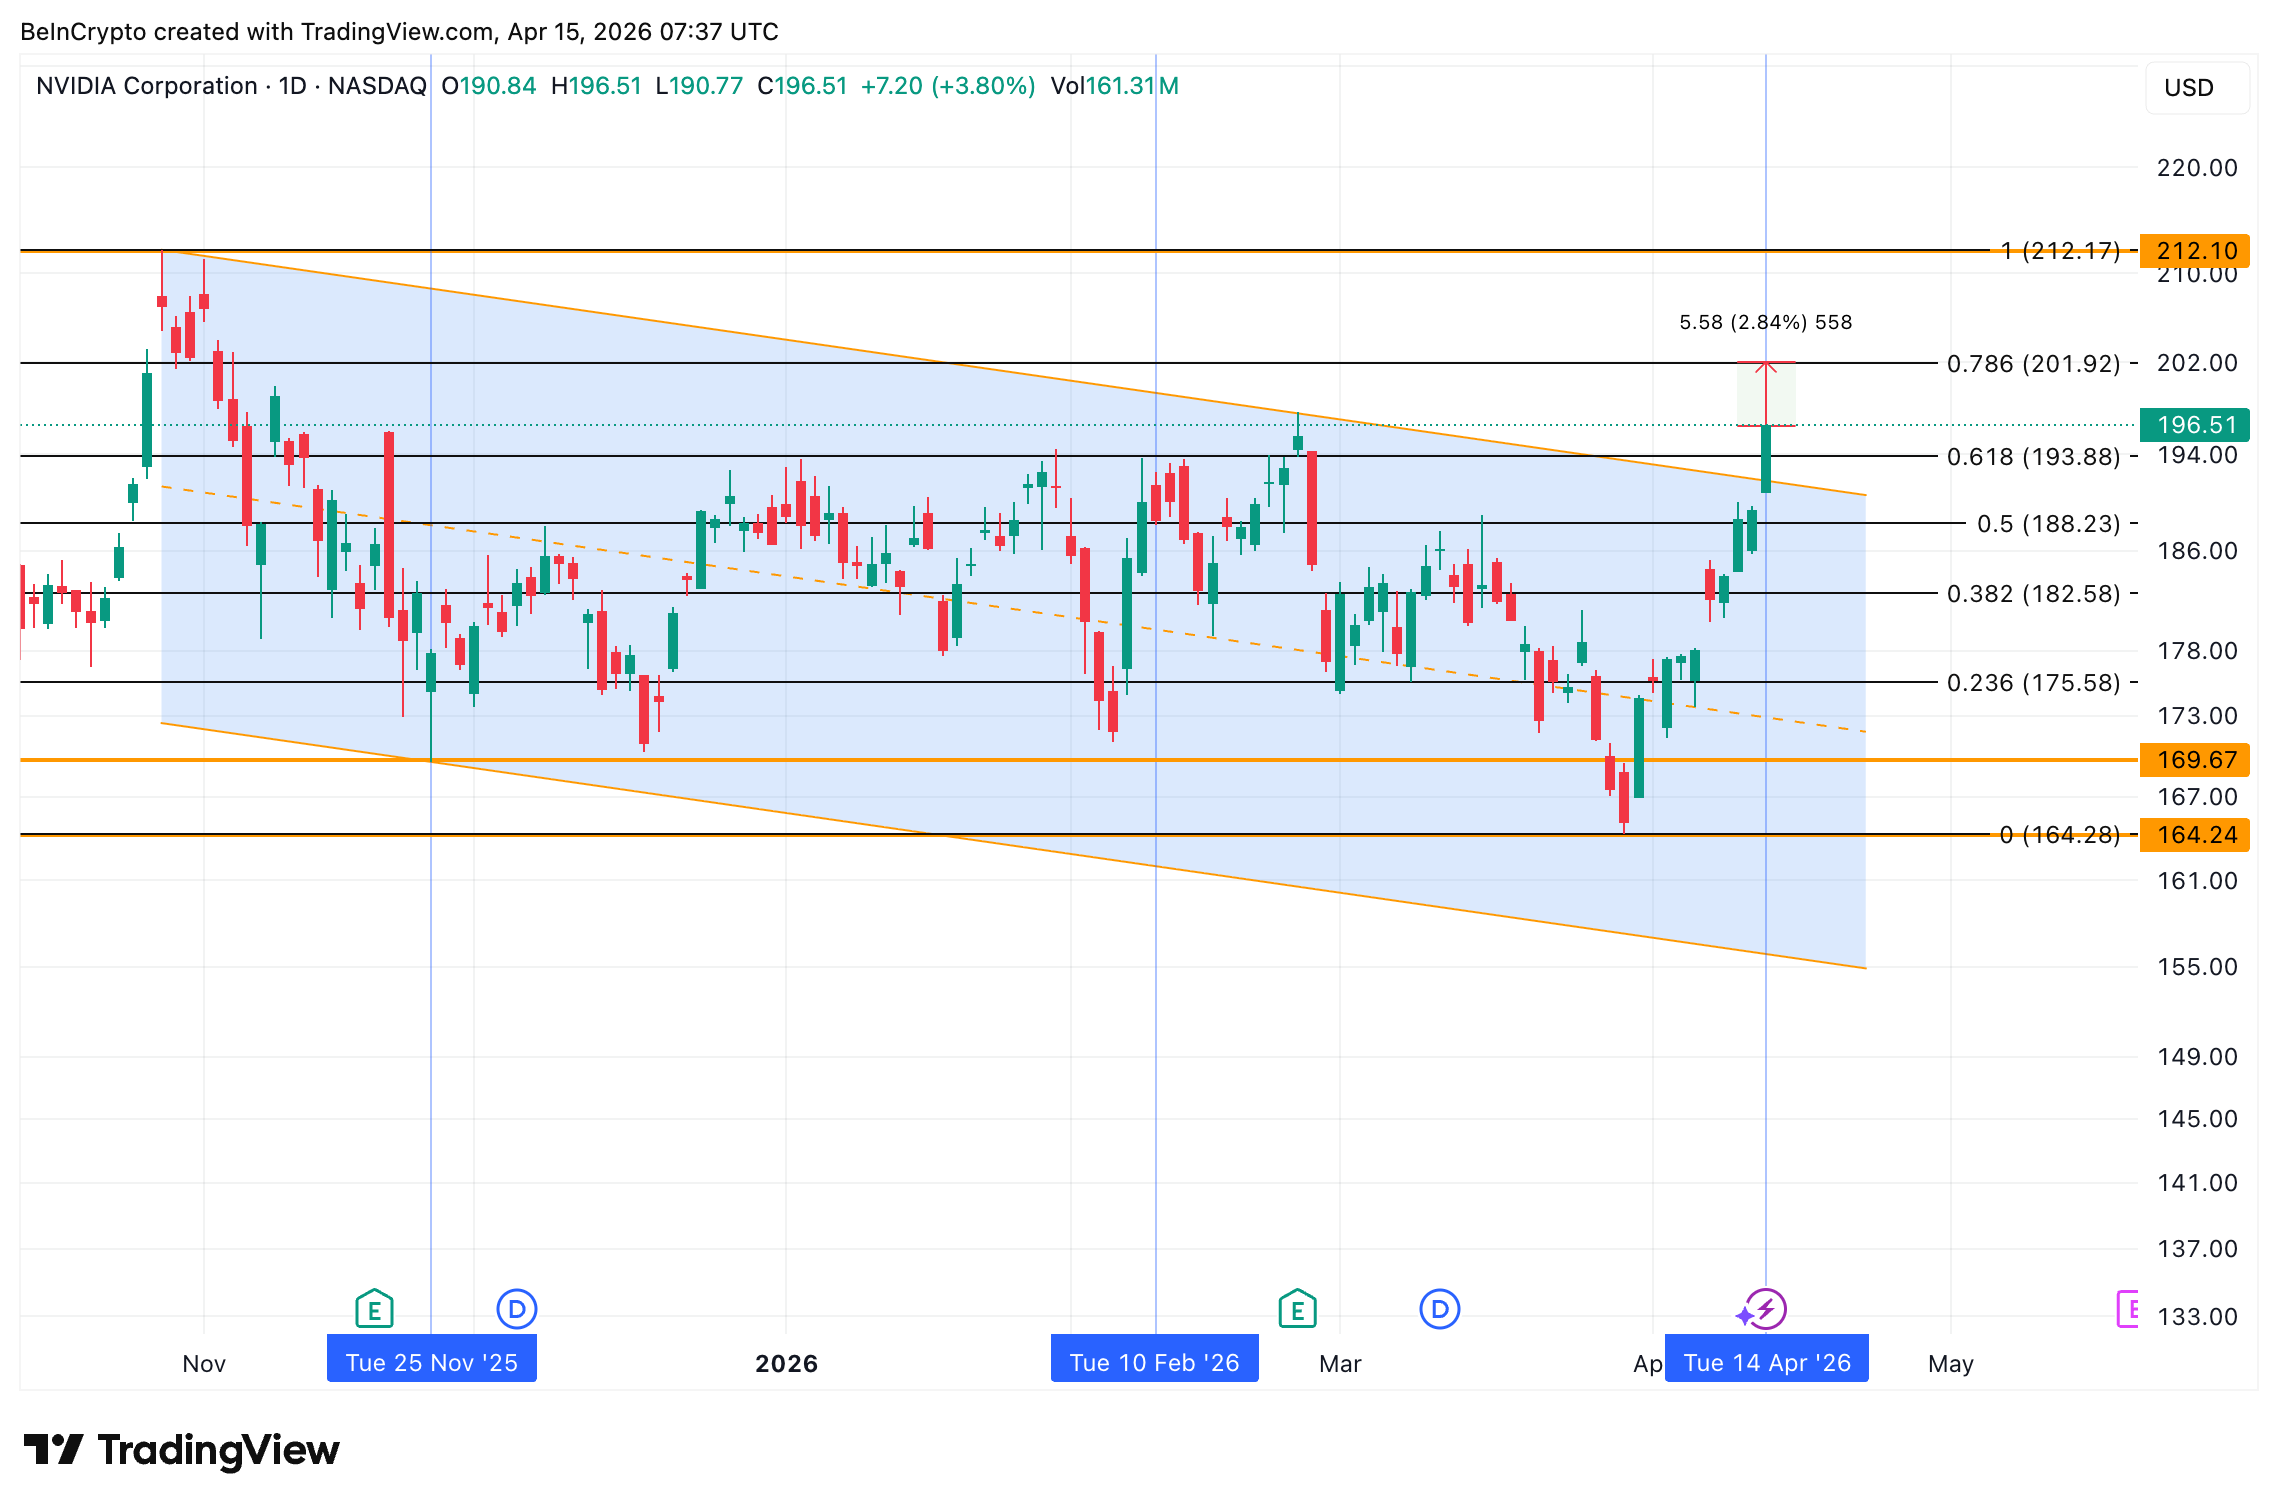
A daily close above $201.92 confirms the breakout has legs. A drop below $193.88 sends NVDA back into the range the chip sector spent six months pushing it out of.
The post Nvidia Rode the Chip Sector to a 6-Month Breakout: Can It Lead Now? appeared first on BeInCrypto.
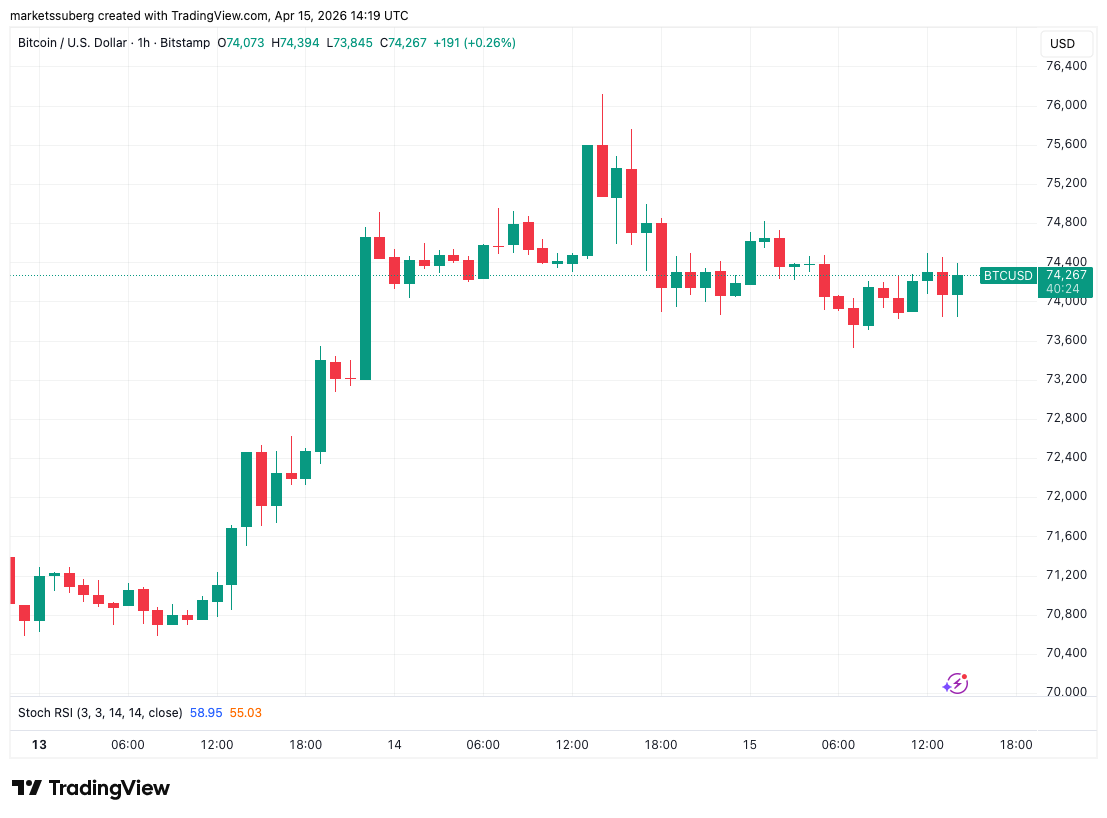
Bitcoin (BTC) circled $74,000 at Wednesday’s Wall Street open as US stocks edged higher on news that the US and Iran may be open to another round of ceasefire negotiations.
Key points:
-
Bitcoin consolidates as analysts warn that stocks may be too optimistic over geopolitical relief.
-
The S&P 500 approaches new all-time highs despite questions over Iran’s uranium enrichment.
-
Bitcoin traders note missing components to support a true trend change.
Iran conflict lacks “genuine resolution”
Data from TradingView showed declining BTC price volatility after a trip to two-month highs the day prior.

Stocks continued a recovery on the day as US President Donald Trump said that China had opted not to send weapons to Iran.
“China is very happy that I am permanently opening the Strait of Hormuz. I am doing it for them, also – And the World,” he wrote in a post on Truth Social.
“This situation will never happen again. They have agreed not to send weapons to Iran.”

President Trump referenced the ongoing blockade of the Strait of Hormuz, a key global oil gateway, as WTI crude dropped below $90 to a new April low on the day.
Commenting, trading company QCP Capital was cautious about discounting the ongoing impact of the US-Iran war.
“Equities recovered, oil sold off, and crypto caught a bid. But the more important signal was what failed to confirm the move,” it wrote in its latest “Market Color” update.
“Long-end yields barely budged, gold held its levels, and the bond market, which should be front-running an inflation relief trade more aggressively, did not follow through. When oil drops and the 10-year barely twitches, rates are telling you this is a reduction in headline risk, not a genuine resolution.”

QCP pointed to Iran’s uranium enrichment as a sticking point in the process of diffusing geopolitical tensions.
“The reason is enrichment. Iran is at 60% enriched uranium, while the US wants levels below 20%. That gap does not close with a framework headline. It closes with a concession Tehran has not signalled it is prepared to make,” it continued.
“Previous ceasefires have lasted weeks, while the enrichment issue has remained unresolved since 2015. Markets are trading the former, but the latter still sits at the core of the risk.”

On Monday, the S&P 500 reclaimed its yearly open level, going on to hit local highs of 6,988 on the day, coming within 15 points of new all-time highs.
BTC price “decision time” due
Bitcoin traders preserved earlier skepticism over market strength.
Related: Oil price surges 8% on Iran tensions: Five things to know in Bitcoin this week
Trader Jelle described the latest trip to $76,000 as an “equal high” that “barely went above” February’s peak.
Liquidity games still in play.$BTC technically tagged those previous highs – but I’m viewing this as an equal high rather than a sweep, barely went above it.
Keep an eye out for a real sweep above there; that’ll likely catch a lot of traders off guard. pic.twitter.com/dxO9cgDRY3
— Jelle (@CryptoJelleNL) April 15, 2026
“Bias remains down, but doubt shorts get a free ride from here,” he added in another of his latest posts on X.
Daan Crypto Trades, meanwhile, predicted that BTC/USD would soon face “decision time.”
“Price tapped the $76K high from March and is consolidating in this area currently. Low timeframe grind higher since the start of April which has been making some marginally higher highs and lows,” he summarized to X followers.

QCP also noted price action “grinding higher,” while warning that options markets were “not confirming a clean breakout.”
“The broader regime has not changed. The Fed is still boxed in, sitting near zero net cuts for the year after the oil shock repriced the easing path, while liquidity conditions remain tight,” it concluded.
“This is a geopolitical relief rally, not a macro regime shift. Last week’s trade was to fade the blockade. This week’s question is whether investors should fade the relief.”
This article is produced in accordance with Cointelegraph’s Editorial Policy and is intended for informational purposes only. It does not constitute investment advice or recommendations. All investments and trades carry risk; readers are encouraged to conduct independent research before making any decisions. Cointelegraph makes no guarantees regarding the accuracy or completeness of the information presented, including forward-looking statements, and will not be liable for any loss or damage arising from reliance on this content.

Snap up this powerful Asus TUF F16 Gaming Laptop with an RTX 4050 for under $1,000 at Amazon
Reform candidate shared Covid conspiracy and called late Queen ‘fraud’

Florida leads US states with $4,433 average tax refund, report finds


-

 Politics5 days ago
US brings back mandatory military draft registration
-
 Sports5 days ago
Man United discover Nico Schlotterbeck transfer fee as defender reaches Dortmund agreement
-

 Fashion5 days ago
Weekend Open Thread: Veronica Beard
-

 Politics5 days ago
Malcolm In The Middle OG Turned Down ‘Buckets Of Money’ To Appear In Reboot
-

 Politics3 days ago
World Cup exit makes Italy enter crisis mode
-

 Crypto World6 days ago
Canary Capital Files SEC Registration for PEPE ETF
-

 Business5 days ago
Tesla Model Y Tops China Auto Sales in March 2026 With 39,827 Registrations, Beating Cheaper EVs and Gas Cars
-

 Crypto World2 days ago
The SEC Conditionalises DeFi Platforms to Be Avoided for Broker Registration
-

 Crypto World2 days ago
SEC Signals Exemption for Crypto Interfaces From Broker Registration
-

 News Videos9 hours ago
Secure crypto trading starts with an FIU-registered
-
 NewsBeat3 days ago
Pep Guardiola and Gary Neville agree over Arsenal title problem that benefits Man City
-

 Business5 days ago
OpenAI Halts Stargate UK Data Centre Project Over Energy Costs and Copyright Row
-

 Business4 days ago
Ireland Fuel Protests Enter Day 5 as Blockades Spark Shortages and Government Prepares Support Package
-

 Politics5 days ago
LBC Presenter Mocks Trump Over Iran War Failures
-

 Crypto World5 days ago
Federal judge blocks Arizona from bringing criminal charges against Kalshi
-
 NewsBeat3 days ago
JD Vance announces ‘no agreement’ with Iran over nuclear weapons fear
-

 NewsBeat1 day ago
Trump and Pope Leo: Behind their disagreement over Iran war
-

 Tech6 days ago
A version of Windows 10 released a decade ago is now eligible for additional security patches
-

 Crypto World1 day ago
SEC Proposes Certain Crypto Interfaces Don’t Need to Register as Brokers
-

 Business5 days ago
IMF retains floor for precautionary balances at SDR 20 billion
You must be logged in to post a comment Login