
Crypto World
Nvidia Rode the Chip Sector to a 6-Month Breakout: Can It Lead Now?

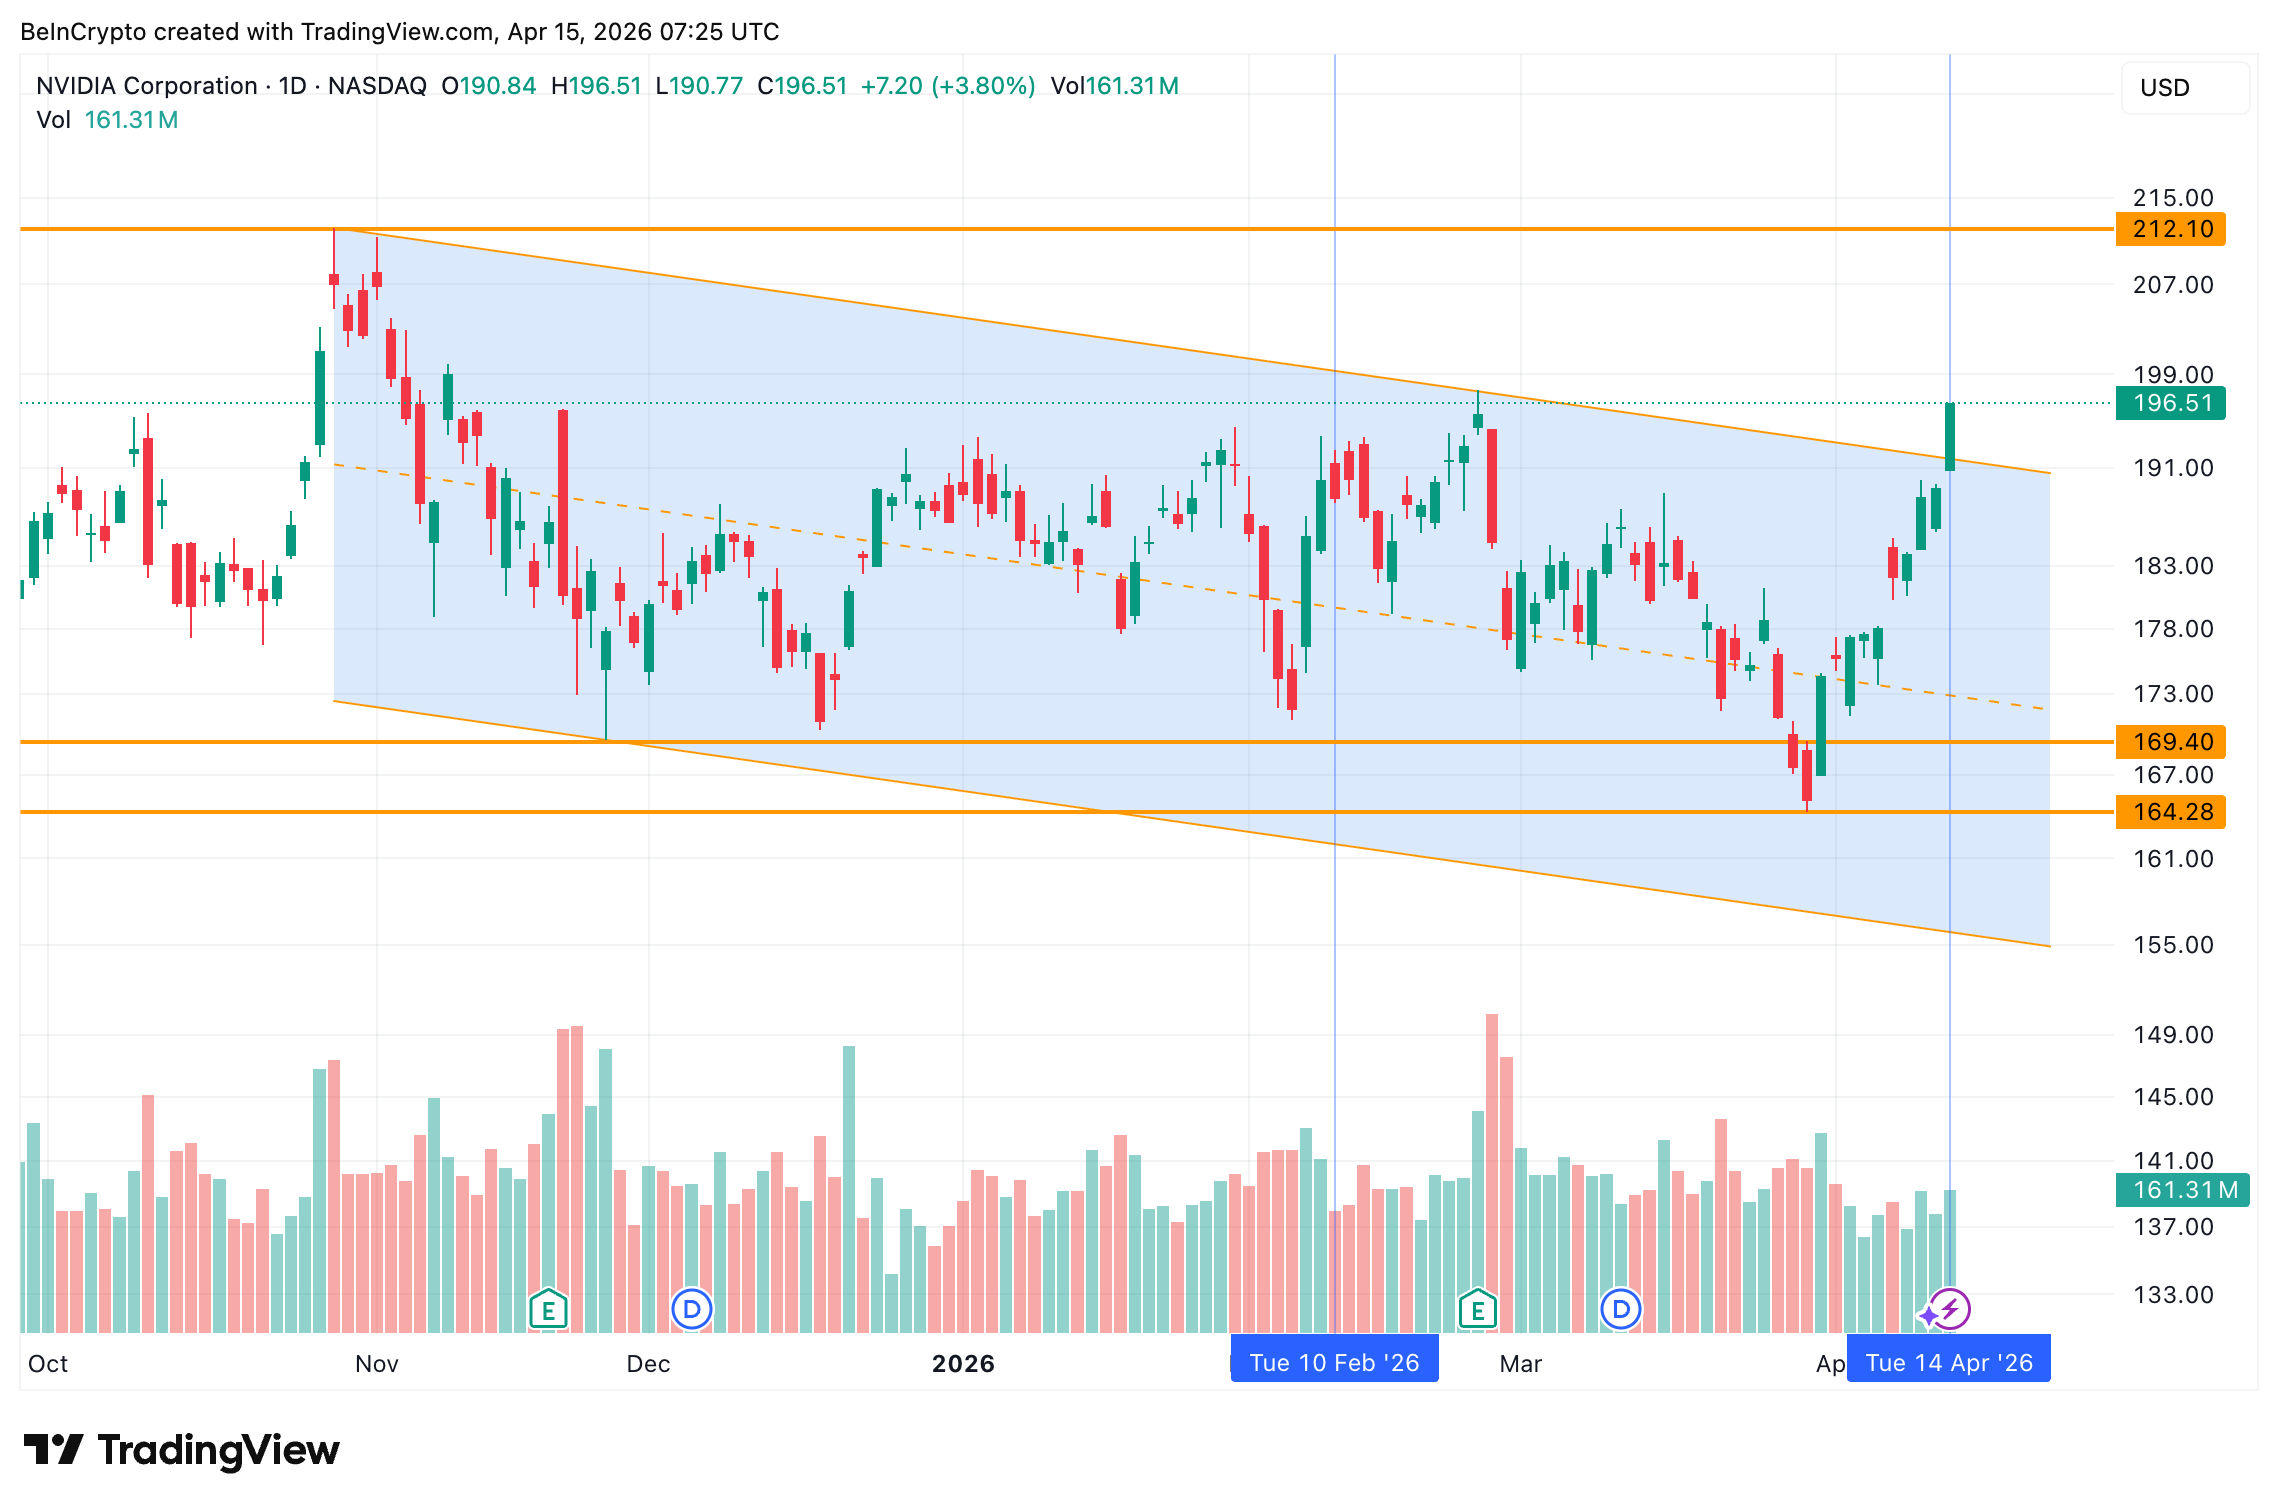
Nvidia (NVDA) stock price closed April 14 at $196.51, up 3.80%, marking a 4-day winning streak. The move broke NVDA out of a falling channel that had held since late October.
Yet a proprietary indicator reveals something the price chart alone does not show. The broader semiconductor sector has been gaining strength far faster than Nvidia itself. NVDA appears to have been carried to its breakout rather than leading it.
Channel Break With Volume as Three Green Bars Confirm the Push
Nvidia stock price has traded inside a falling channel on the daily chart since October 29, 2025. Every rally attempt over the past six months stalled at the channel’s upper trendline before reversing.
That changed on April 14. NVDA broke above the channel’s upper boundary with four consecutive green volume bars. Volume hit 161.31 million shares on the breakout candle. The rising sequence confirms that buying pressure built progressively rather than arriving in a single spike.
Want more insights like this? Sign up for Editor Harsh Notariya’s Daily Newsletter here.
The breakout is structurally significant. It marks the first clean exit from the bearish channel since NVDA peaked in late October. However, a channel breakout only tells half the story. The question is whether Nvidia earned this move on its own merits or was pushed through by a broader force. And can the breakout even hold?
The Chip Sector Outran Nvidia and Dragged It to a Breakout
BeInCrypto’s NVDA versus SOXX Relative Performance indicator is a proprietary tool. It normalizes both to a common baseline and tracks which is gaining faster in real time.
The VanEck Semiconductor ETF (SOXX), a fund that tracks the broader chip sector, currently reads on the normalized scale. NVDA sits lower. The gap has been widening since February 10. Between February 10 and April 14 another thing happened. SOXX trended higher while NVDA trended lower on the relative scale. Yet NVDA stock still broke out.
A similar gap-widening happened in late November as SOXX led NVDA. This eventually helped the Nvidia share price avoid a drop under $169.47.
The implication is clear. The sector was fueled by TSMC’s record earnings, CoreWeave’s AI deals, and soft PPI data.
That created enough upward force to lift even its underperformer through resistance.
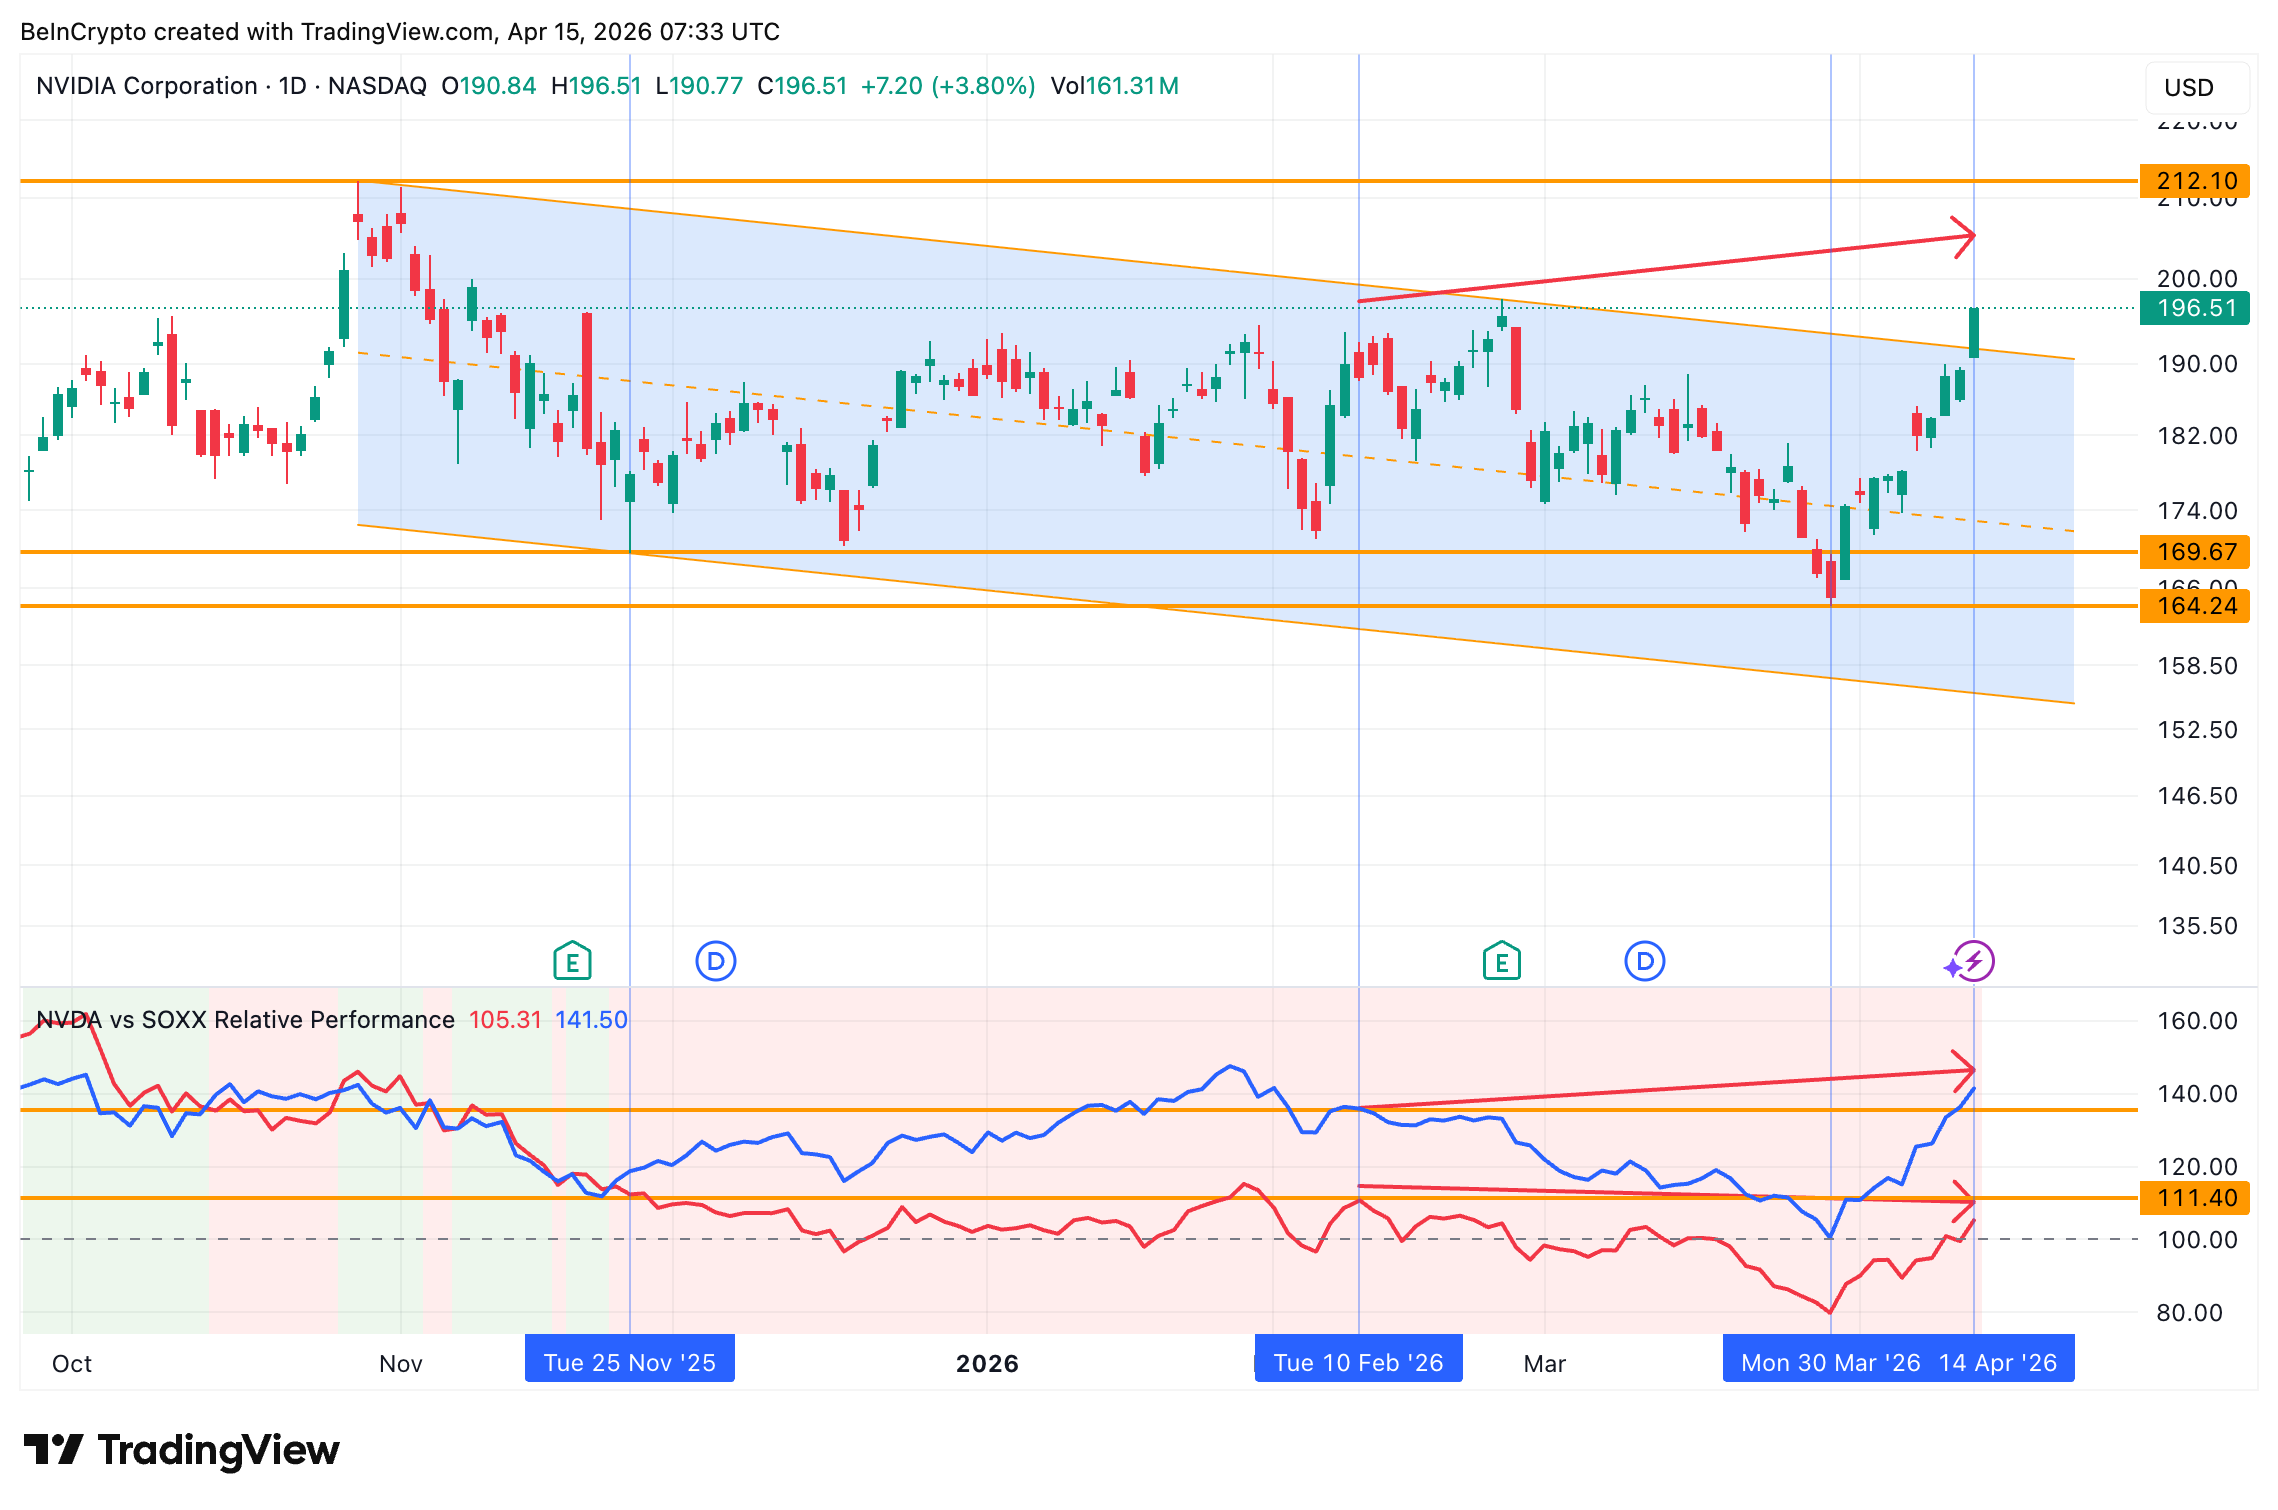
The year-to-date numbers confirm the gap. SOXX is up roughly 28% in 2026. NVDA has gained just 4%. The chip sector outpaced Nvidia by 24 percentage points.
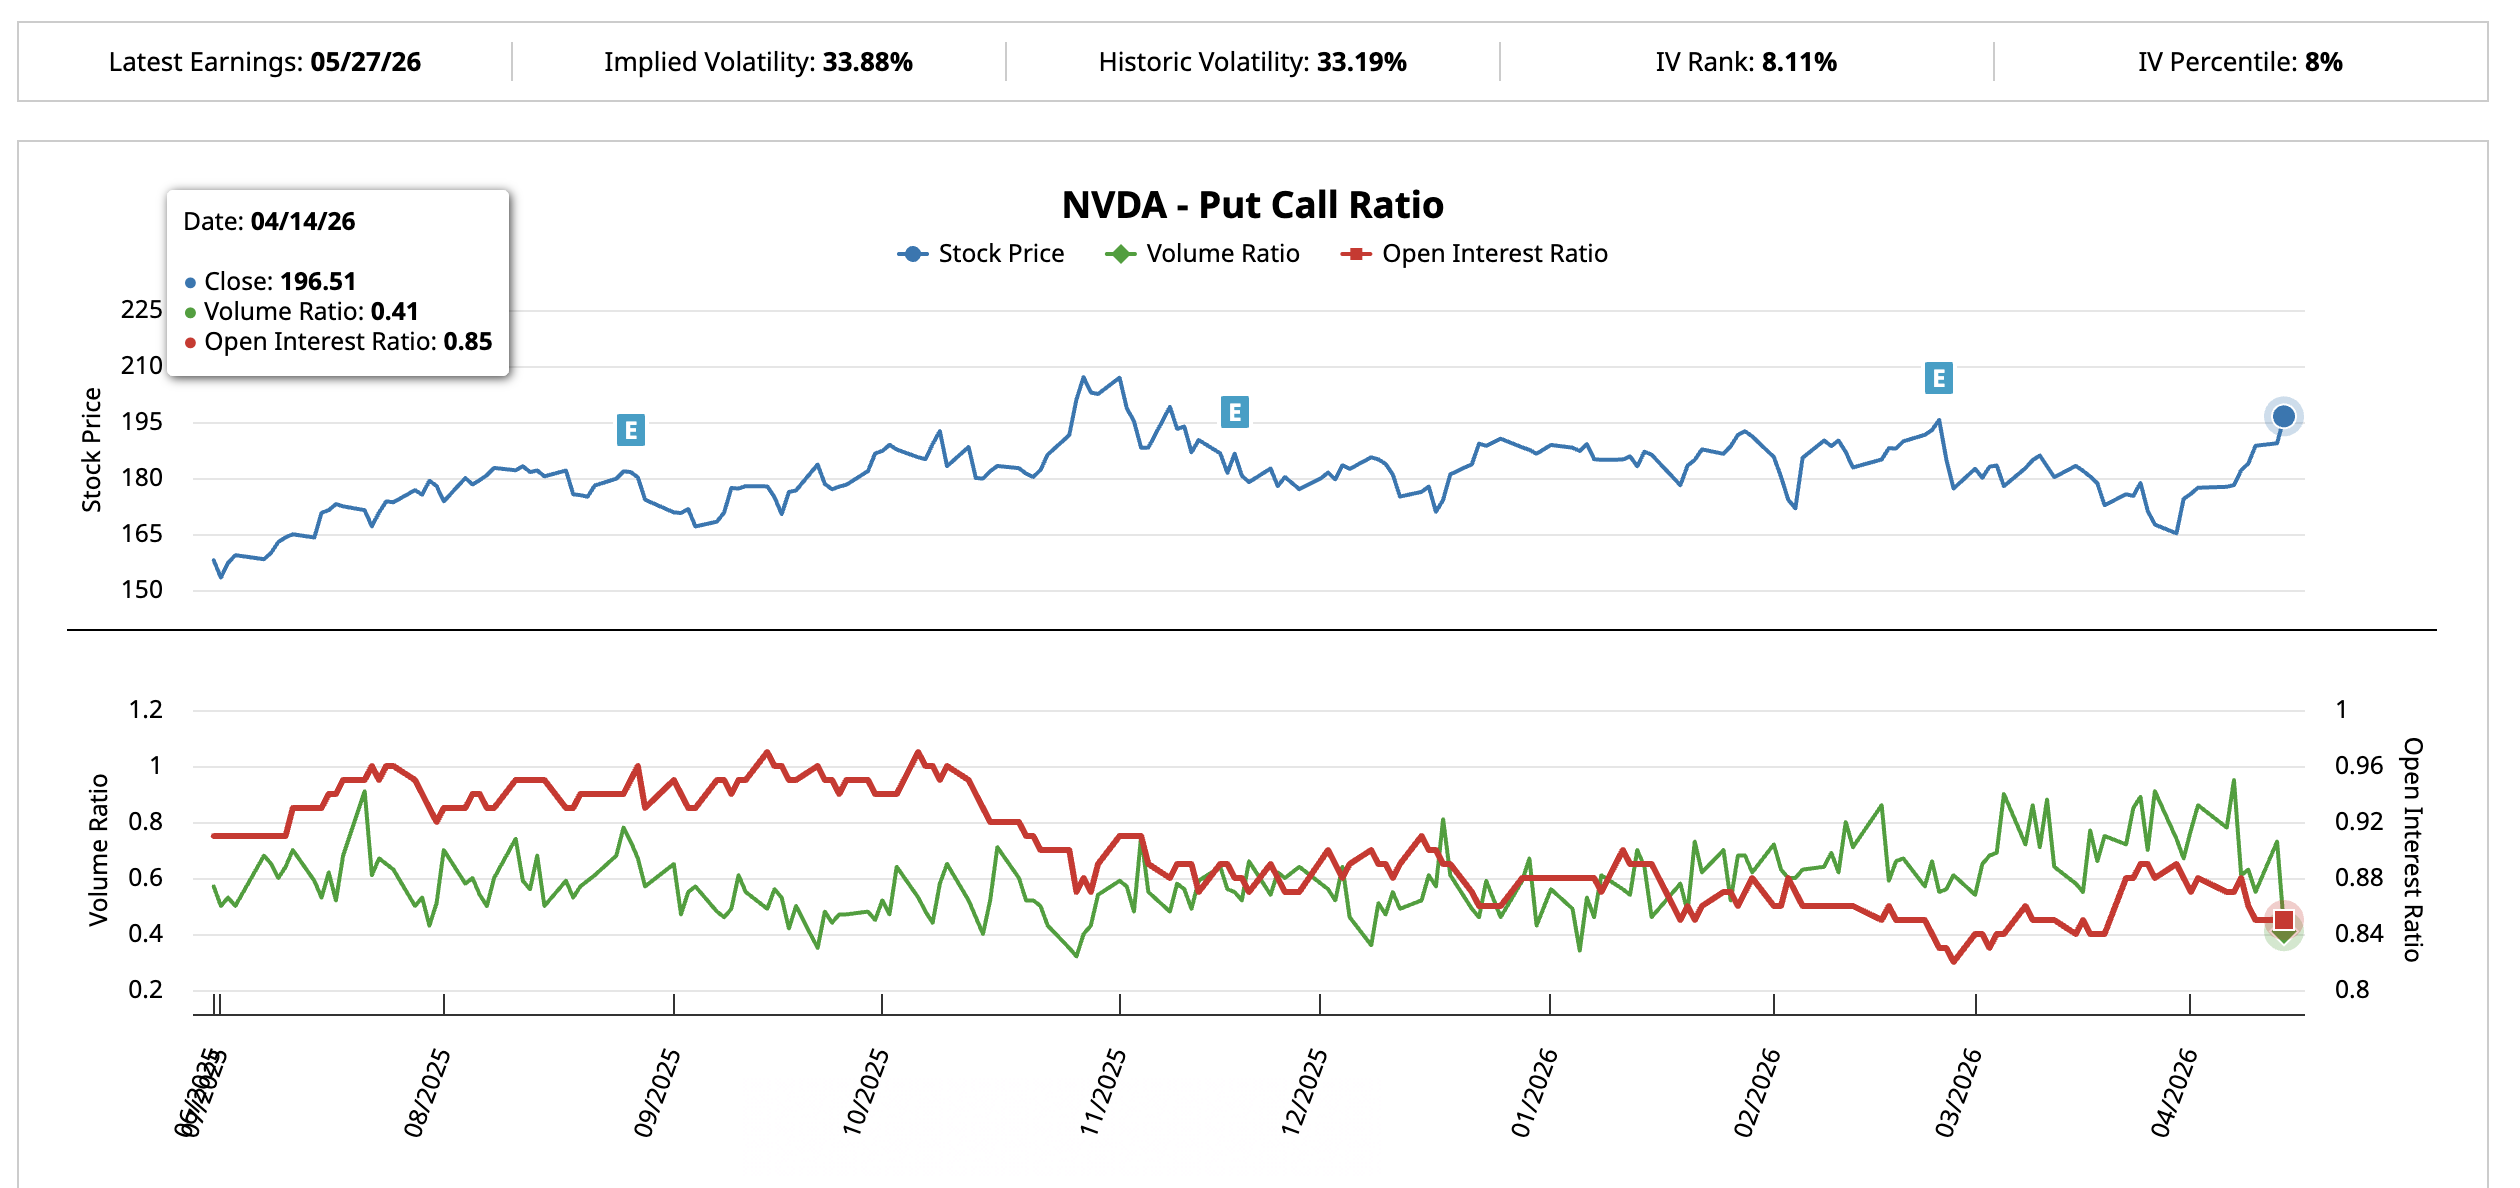
Meanwhile, options positioning on NVDA reflects cautious optimism rather than outright conviction. On February 10, the put-call volume ratio, which compares bearish bets against bullish bets, stood at 0.69.
As of April 14, it has dropped to 0.41. Call activity is rising, but the open interest ratio held steady near 0.85. That means traders are adding new bullish bets without unwinding existing hedges. The positioning mirrors the SOXX story. Money is flowing in, but with protection still in place.
The sector tailwind and cautious options positioning both support the breakout. However, without NVDA closing the performance gap with SOXX, the rally risks being a passenger’s ride.
Nvidia Stock Price Levels That Decide If the Breakout Holds
The daily price chart maps where Nvidia stock price must deliver. NVDA has broken above $193.88, the 0.618 Fibonacci level. That zone was rejected earlier in 2026 and has been reclaimed until now.
Holding above $193.88 keeps the breakout intact. The next target sits at $201.92, the 0.786 Fibonacci, just 2.84% above the current price. That level also aligns with the psychological $200 mark. Beyond $200, $212.17 comes into focus, matching the October high.
Yet with NVDA lagging the sector by 24 points, conviction at higher prices depends on closing that gap. If SOXX stalls and NVDA keeps climbing, leadership shifts. If SOXX keeps rising while NVDA flatlines, however, the sector-driven lift fades.
Nvidia stock price support sits at $188.23, the 0.5 Fibonacci level. A loss of that exposes $182.58. However, the channel breakout only fully weakens below $164.28.
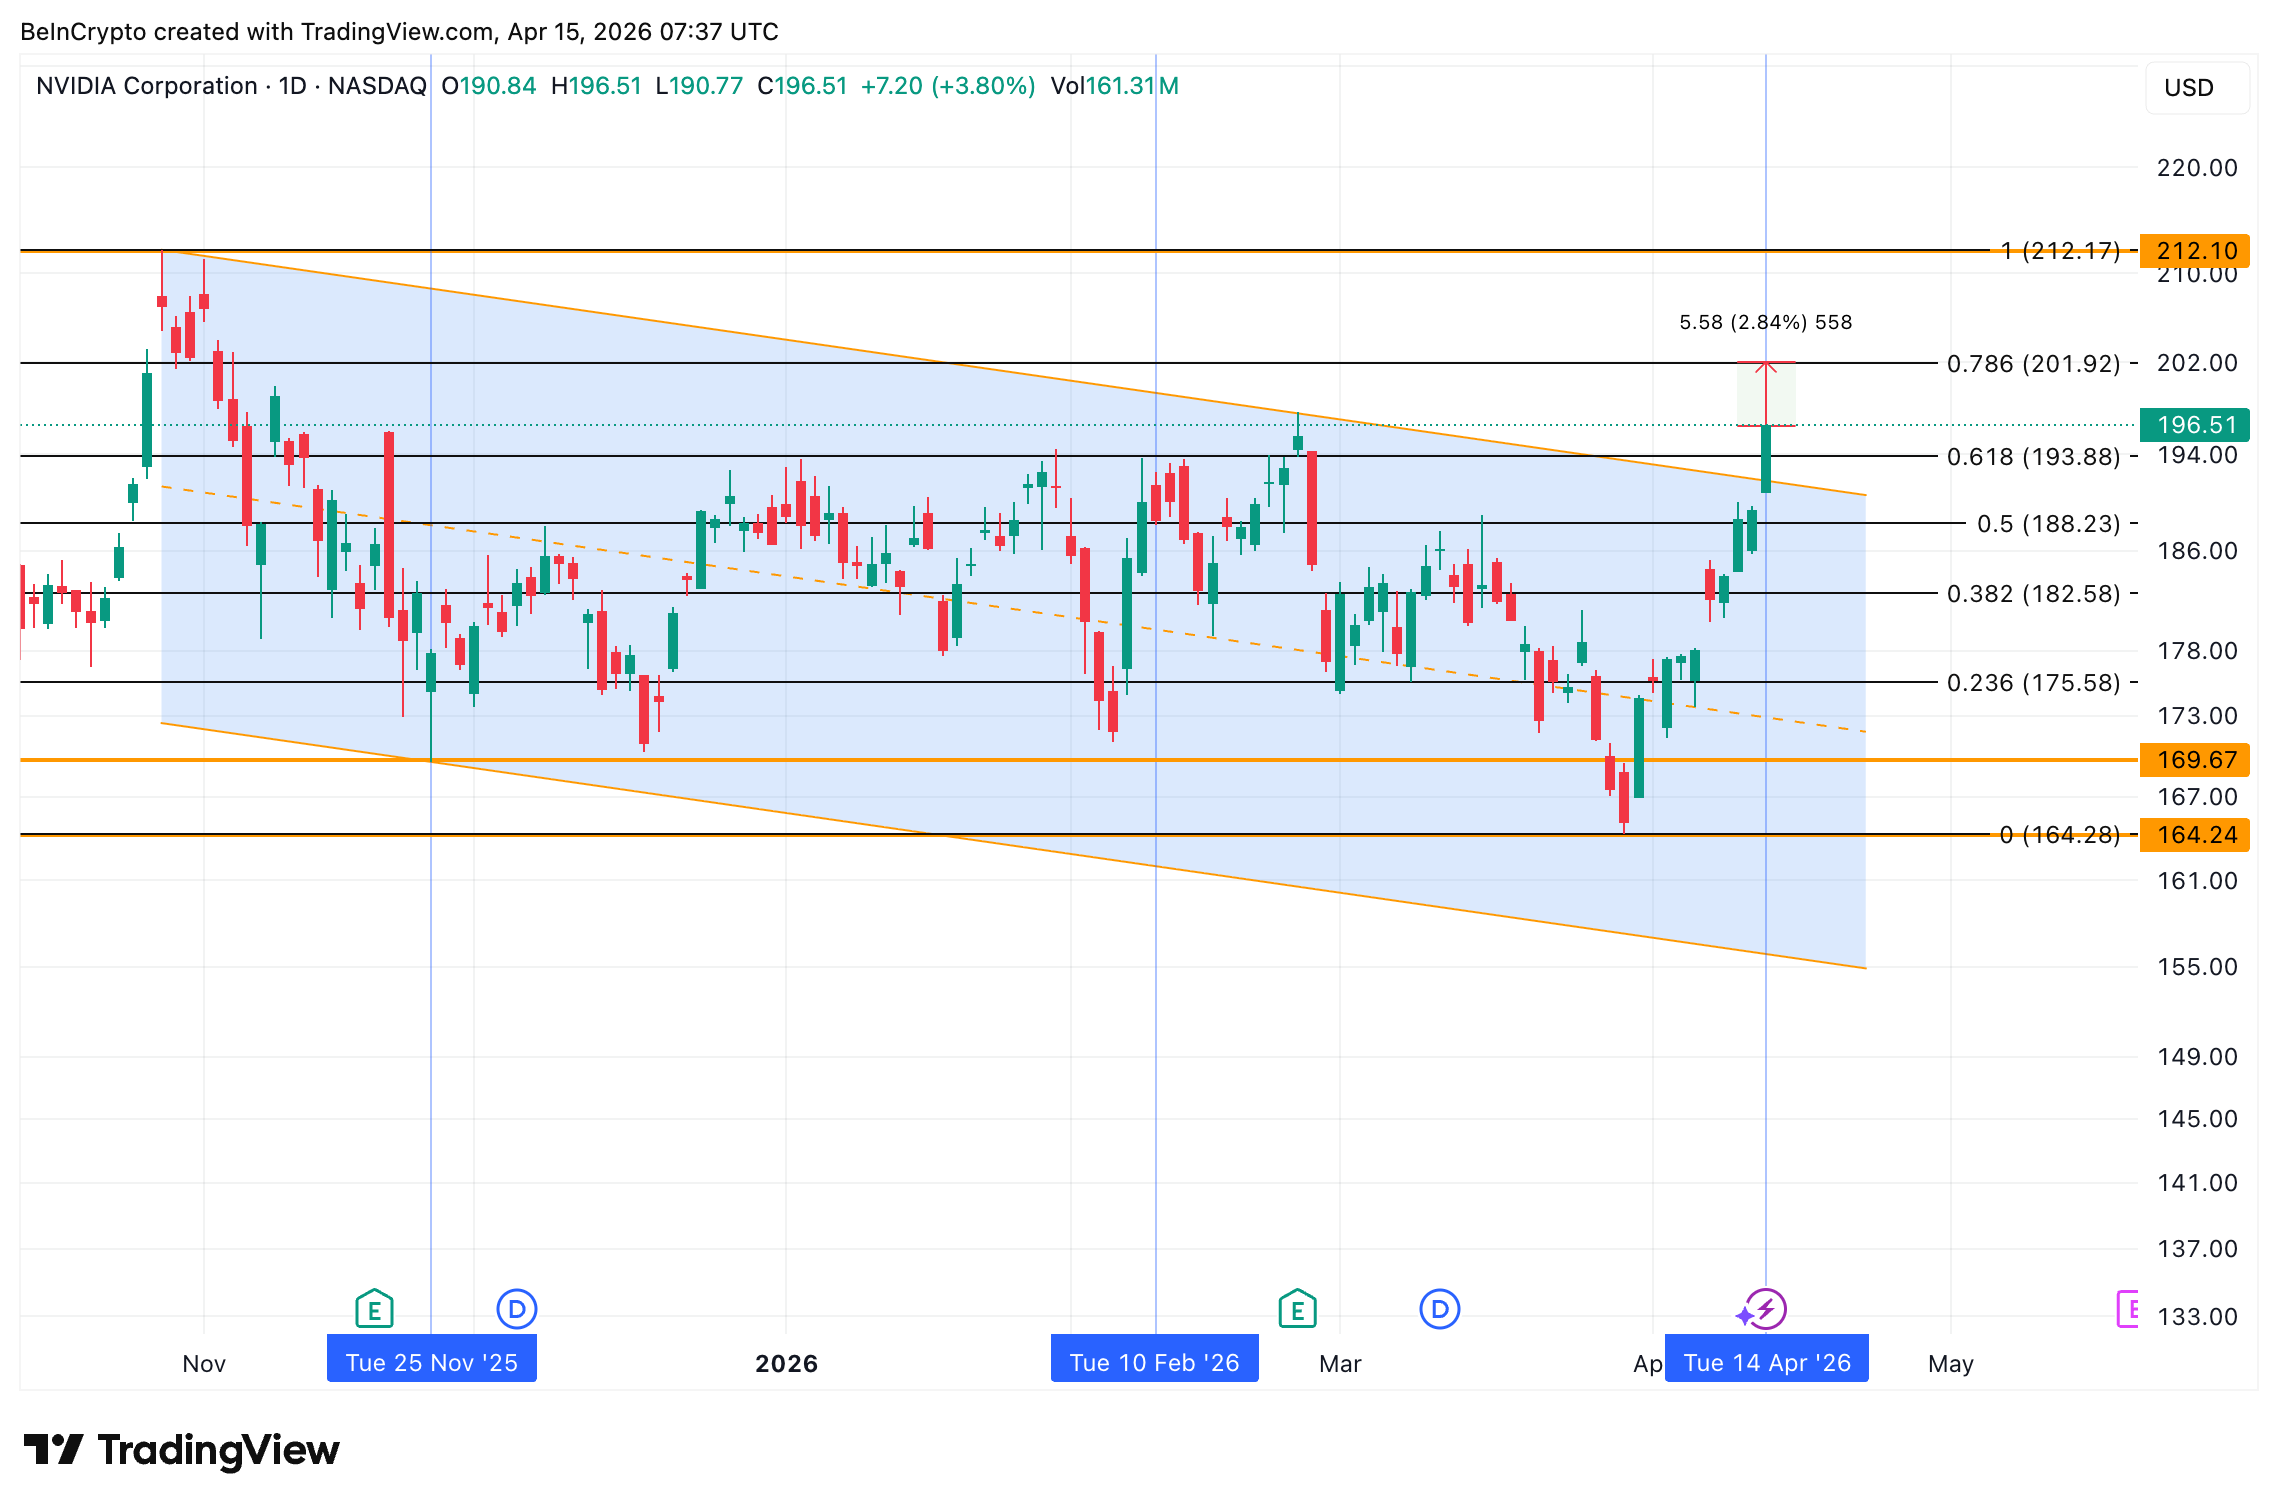
A daily close above $201.92 confirms the breakout has legs. A drop below $193.88 sends NVDA back into the range the chip sector spent six months pushing it out of.
The post Nvidia Rode the Chip Sector to a 6-Month Breakout: Can It Lead Now? appeared first on BeInCrypto.

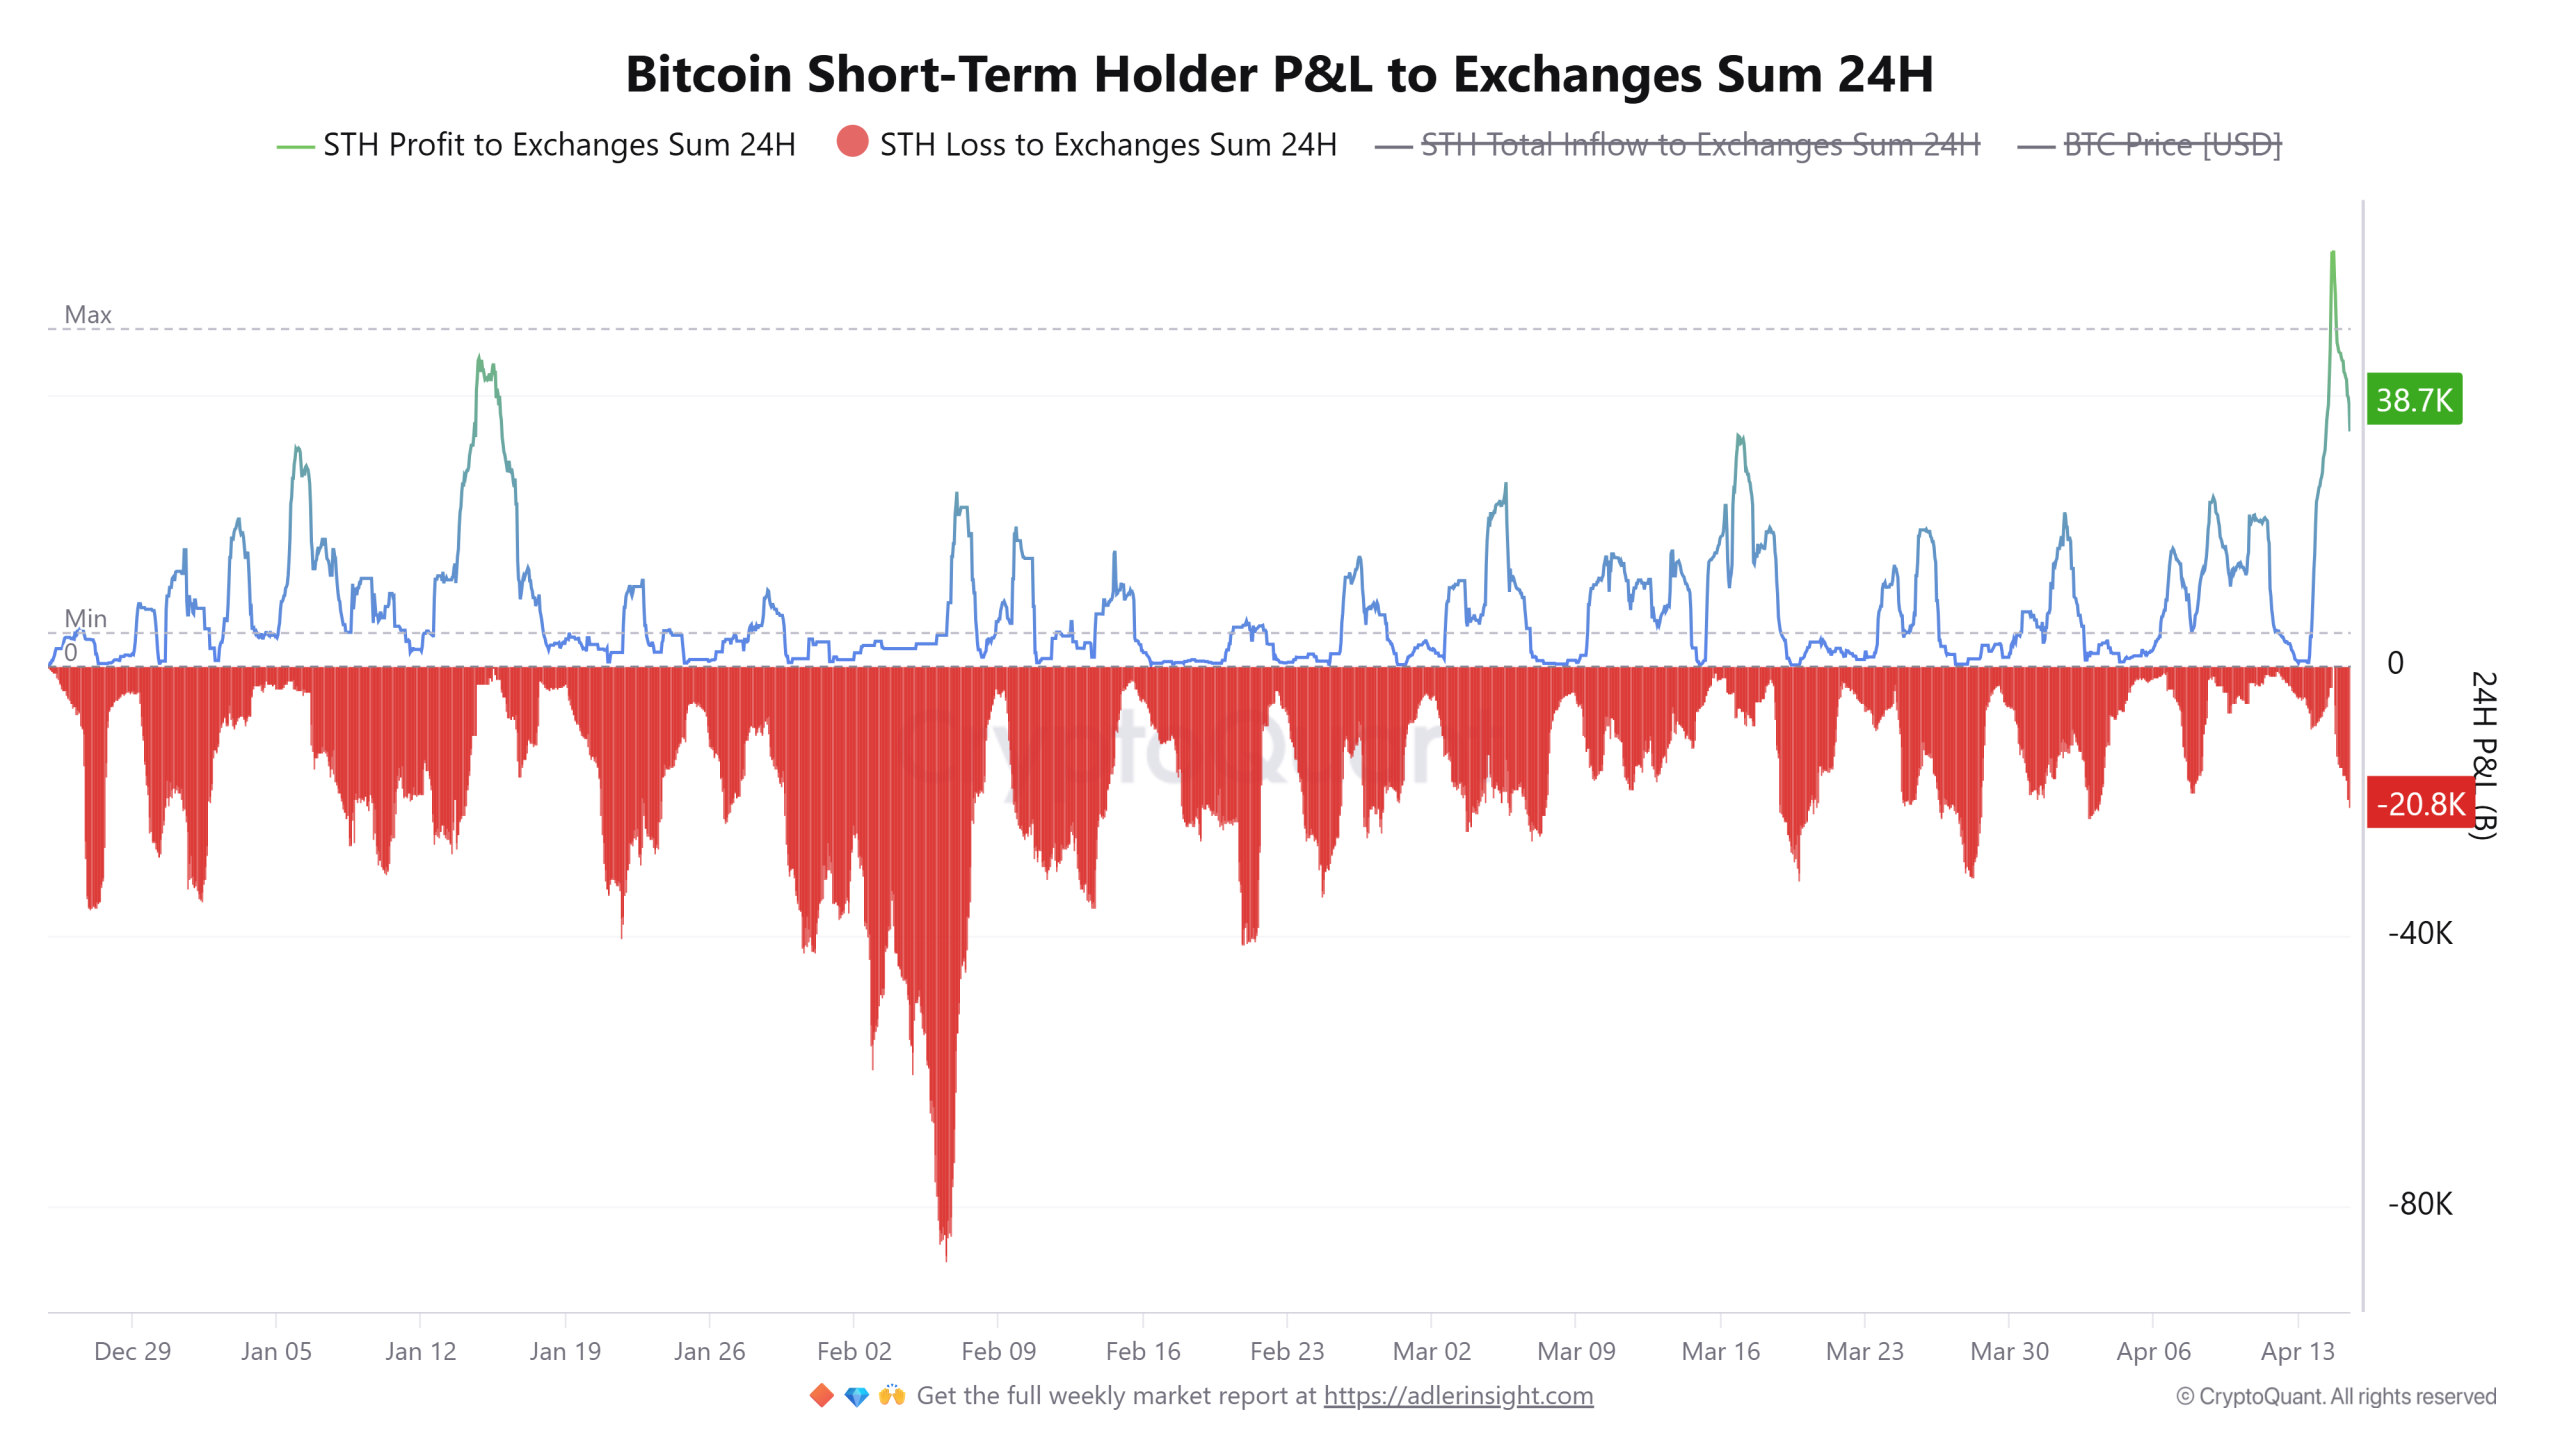
Bitcoin’s (BTC) rally stalled above $76,000 stalled on Tuesday after short-term profit-taking by traders reached its highest level in 2026.
The activity coincided with continued accumulation by long-term holders, and this opposing interaction between the two cohorts may continue to impact Bitcoin’s attempts to break into the $80,000 range.
Bitcoin profit-taking meets whale demand
New Bitcoin short-term holders moved their holdings as BTC in profit sent to exchanges reached 63,000 BTC on April 14, the highest level in 2026, since the 44,800 spike on Jan. 14.

Onchain data shows that the one-day-to-one-week cohort moved nearly 2,000 BTC back to Binance during the same time. This implied that freshly acquired coins are rotating into sell-side liquidity as BTC traded near $76,000.
Crypto analyst Amr Taha flagged this as the first clear wave of profit-taking after the retest of the monthly highs. The activity aligns with cautious distribution, in which newer participants seek to secure gains at key resistance levels during a bear market.
Taha noted that this indicates a natural cooling phase in momentum.
Meanwhile, BTC whale behavior shows a different pattern. Market analyst CW noted a single-day inflow of over 71,000 BTC into accumulation addresses, the largest bullish inflow since early 2022. The large holders appear to be absorbing available supply from the short-term sellers.

The relationship between these flows points to a transfer of coins from weaker hands to stronger ones, which may stabilize the price while limiting an immediate rally.
Related: Bitcoin ETFs post $412M in inflows as Goldman Sachs files for BTC ETF
Bitcoin liquidity cluster may lead to a small dip
After forming equal highs near $76,000, BTC’s price rejected near the 100-day exponential moving average (EMA), marking the first test of this trend since Jan. 14. The momentum slowed after the rejection, with price slipping to $73,500.

However, on the lower time frame, the bullish trend remains intact.
On the one-hour chart, internal liquidity levels are resting around $73,000 and $72,000. These zones may attract bid orders that may get filled before a trend continuation.

The liquidation heatmap provides additional context, with $1.4 billion in cumulative long liquidations clustered around $73,000. That figure rises to $3.5 billion in long positions at risk near $70,500.
At the opposite end, a move toward $80,000 would expose $2 billion in leveraged short positions. The spread between the long and short liquidation zones suggests BTC may retest the $72,000 to $70,000 range before moving higher.

Related: Bitcoin shows ‘bull market behavior’ as chart pattern targets $90K
This article is produced in accordance with Cointelegraph’s Editorial Policy and is intended for informational purposes only. It does not constitute investment advice or recommendations. All investments and trades carry risk; readers are encouraged to conduct independent research before making any decisions. Cointelegraph makes no guarantees regarding the accuracy or completeness of the information presented, including forward-looking statements, and will not be liable for any loss or damage arising from reliance on this content.

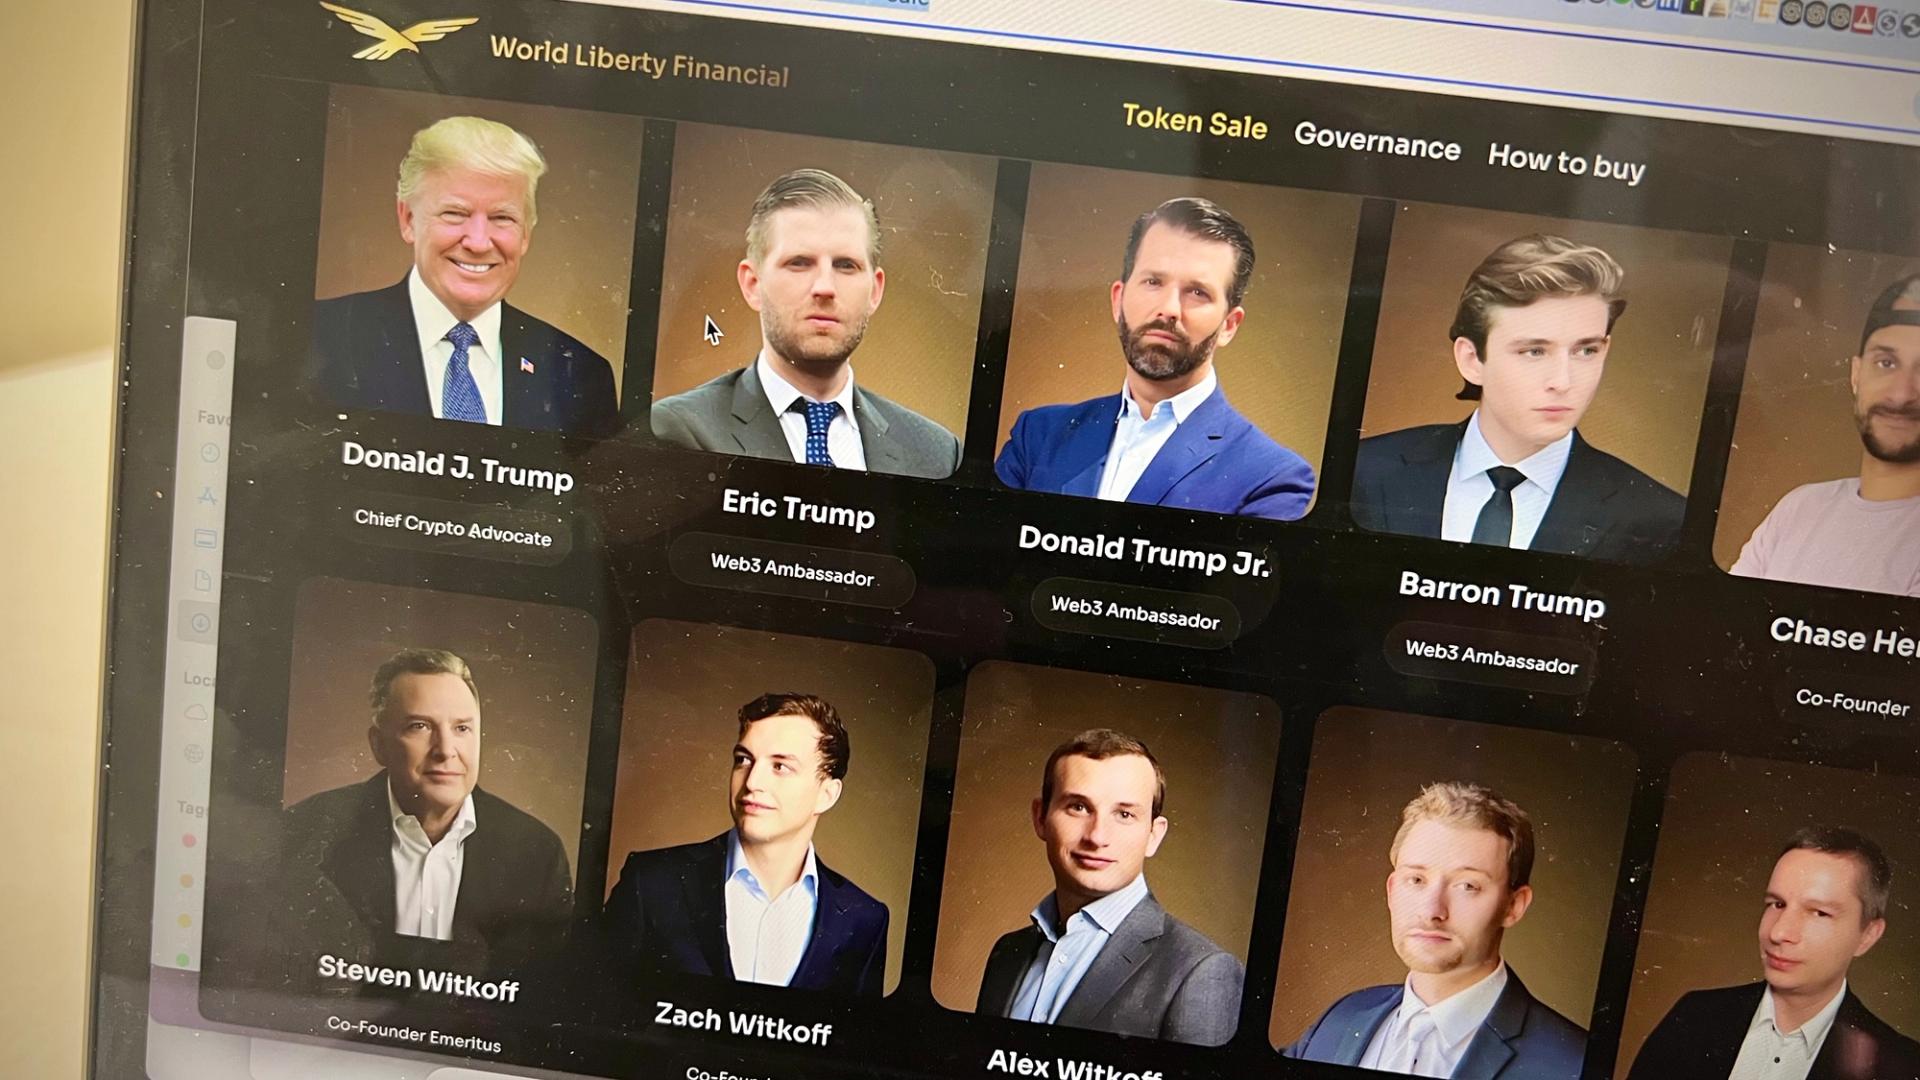
The Trump family-backed World Liberty Financial has proposed unlocking 62.3 billion WLFI governance tokens on Tuesday, less than a week after CoinDesk reported the venture had used 5 billion of its own tokens as collateral on lending platform Dolomite to borrow $75 million in stablecoins.
WLFI’s token was originally sold as a governance-only token with no transferability and indefinite locks. A vesting schedule with a defined path to liquidity changes the economic profile of what holders bought.
The proposal would open up liquidity for insiders who previously had no exit, changing the economics of the token.
The proposal splits the locked supply into two groups. Early supporters holding 17 billion WLFI would receive a 2-year cliff followed by a 2-year linear vest, retaining all tokens.
Founders, team members, advisors, and partners holding 45.2 billion WLFI would face a 2-year cliff and 3-year vest, but with 10% of their allocation, roughly 4.5 billion tokens, burned immediately on passage. (Burns refer to the permanent removal of tokens from supply, usually by sending to an address that is not controlled by anyone.)
In practice, it means insiders would surrender 4.5 billion tokens in exchange for beginning to unlock 40.7 billion that were previously locked indefinitely with no vesting schedule attached. Those tokens had no path to liquidity before this proposal.
WLFI included participation data from its six prior votes in the Wednesday post, showing that even the most engaged proposal – the vote to make the token tradeable – drew 11.1 billion WLFI in voting power.
The quorum for this proposal is 1 billion, with a simple majority required to pass. At those thresholds, the proposal could pass with a fraction of the founders and team allocation alone.
Holders who do not affirmatively accept the new vesting terms keep their tokens locked indefinitely and retain governance voting rights.
The timing comes on the back of events of the past week.
CoinDesk reported on April 9 that WLFI had deposited 5 billion of its own governance tokens into Dolomite, a lending protocol whose co-founder advises WLFI, and borrowed $75 million in stablecoins that were partially routed to Coinbase Prime.
The WLFI token dropped 12% to a record low the following day. Then, Tron founder Justin Sun, once the project’s largest backer, publicly accused the team of treating users as “personal ATMs,” prompting WLFI to threaten legal action.
The token was trading near $0.079 on Tuesday, down roughly 48% from the average price at which WLFI’s own treasury conducted $65.6 million in open-market buybacks over the past six months.
Voting on the Wednesday proposal runs for a seven day period.


OpenAI circulated an internal memo this week directly attacking rival Anthropic, accusing it of inflating its $30 billion revenue figure by roughly $8 billion as Claude’s grip on enterprise AI becomes increasingly hard for the company to dismiss.
Summary
- OpenAI chief revenue officer Denise Dresser sent a four-page memo to employees accusing Anthropic of overstating its run rate through gross accounting on cloud deals with Google and Amazon.
- The memo describes Anthropic’s strategy as built on “fear, restriction, and the idea that a small group of elites should control AI,” and labels its compute position a strategic misstep.
- Anthropic’s annualized revenue has surpassed $30 billion by its own figures, up from $9 billion at end-2025, as Claude was described as having “become a religion” among enterprise users at a major AI conference.
OpenAI’s chief revenue officer Denise Dresser sent a four-page internal memo to employees this past Sunday attacking rival Anthropic, accusing it of inflating its widely reported $30 billion run-rate figure by roughly $8 billion. The memo, reported by CNBC and The Verge, alleges that Anthropic “grosses up” revenue sharing from its cloud partnerships with Amazon and Google rather than reporting net figures, which OpenAI does with its Microsoft arrangement.
The accusation puts the real Anthropic figure closer to $22 billion, which would place it behind OpenAI’s reported $24 billion run rate. Both companies are preparing for potential IPOs and are competing aggressively for enterprise contracts and investor positioning.
Dresser goes well beyond accounting in the note. She describes Anthropic’s strategy as built on “fear, restriction, and the idea that a small group of elites should control AI,” contrasting it with what she frames as OpenAI’s more “positive message.” She also calls Anthropic’s compute strategy a “strategic misstep,” noting that OpenAI is targeting 30 gigawatts of compute by 2030 while projecting Anthropic will have only 7 to 8 gigawatts by end-2027.
Anthropic announced a deal with Google and Broadcom earlier this month for “multiple gigawatts” of compute. OpenAI itself is also in the middle of a pivot, turning to Amazon after acknowledging that its Microsoft partnership has “limited our ability” to reach enterprise clients on rival cloud platforms.
Claude Mania and the Enterprise War
The sharpness of the memo reflects a real competitive problem for OpenAI. At the HumanX conference in San Francisco last week, enterprise sentiment was overwhelmingly in Anthropic’s favor. Arvind Jain, CEO of enterprise AI startup Glean, described the phenomenon plainly. “It has become a religion, that’s the level of that mania,” he said of Claude’s penetration into corporate workflows.
Anthropic’s momentum has come primarily from Claude Mythos and its coding tools, which have driven the revenue surge from $9 billion to $30 billion in under a year. The two labs are also racing to build competing AI cybersecurity products, with OpenAI finalizing a security tool for limited partner release while Anthropic runs its tightly controlled Project Glasswing initiative.
What It Means for the AI Race
OpenAI is valued at over $850 billion following a March fundraise. Anthropic was valued at $380 billion in its most recent round. Both companies are heading into IPO windows with very different stories to tell investors about their enterprise position.
The memo is notable precisely because confident market leaders do not typically challenge a rival’s accounting in writing. It signals that Anthropic’s gains are being felt inside OpenAI in a way that a memo to employees alone cannot solve.

TLDR
- Kalshi launched a new Commodities Hub that expands its 24/7 event contracts platform into agriculture, metals, and energy markets.
- The company added contracts tied to natural gas, coffee, copper, sugar, corn, soybeans, wheat, nickel, diesel, and lithium.
- Kalshi structured the contracts as binary markets based on price direction and threshold outcomes.
- The platform allows users to trade around the clock, including weekends and holidays.
- Kalshi said federal authorities and courts confirmed that its event contracts fall under CFTC oversight.
Kalshi has expanded its platform with a new Commodities Hub that adds agriculture, metals, and energy markets. The company launched the hub on Tuesday to widen access to event contracts tied to raw materials. The move strengthens its 24/7 trading model and targets rising demand for flexible commodity exposure.
Kalshi Expands Commodities Suite with Agriculture, Metals, and Energy Contracts
Kalshi added new markets linked to natural gas, coffee, copper, sugar, corn, soybeans, wheat, nickel, diesel, and lithium. The expansion builds on existing contracts tied to WTI crude, Brent crude, gold, and silver. The company said the hub offers broader commodity coverage through binary event contracts.
The platform structures each contract around price direction and threshold outcomes. Users can trade on whether a commodity will close above or below a set level. Kalshi said this format removes margin requirements, contract rollovers, and complex mechanics tied to futures.
Kalshi stated that geopolitical stress and inflation concerns have fueled higher commodities activity. The company linked the launch to oil market swings tied to Middle East tensions. It said supply chain disruption has also increased trading interest across global markets.
The hub allows continuous trading, including weekends and holidays. Users can express views during off-hours when traditional exchanges remain closed. Kalshi said this access supports faster reactions to macro shocks in energy and agriculture.
The company emphasized that contracts operate under federal financial oversight. It said federal authorities and courts recently affirmed that its event contracts fall under CFTC jurisdiction. This position places the products outside state gaming law.
Regulatory Clarity and Institutional Push Support Kalshi Growth
Kalshi said recent court decisions strengthened its regulatory standing. Federal rulings supported the company’s view that prediction markets qualify as financial products. The firm stated that CFTC oversight governs its commodity event contracts.
The company also confirmed that it received an NFA license for margin trading. This approval allows Kalshi to expand trading features for qualified participants. It said the license supports broader participation across its markets.
Kalshi reported that it has worked with Jump Trading on contract development and liquidity support. The firm said these efforts aim to deepen market efficiency and order flow. It stated that institutional engagement remains a core priority.
The Commodities Hub integrates with Kalshi’s existing event contract interface. Users can access price thresholds and directional markets from a single dashboard. The company said contracts trade around the clock without interruption.

TLDR
- Fellowship PAC raised $11 million and quickly spent $3 million on advertising services.
- The PAC booked its advertising through Nxum Group, a firm co-founded by Tether US CEO Bo Hines.
- Federal Election Commission filings show that Cantor Fitzgerald contributed $10 million to the PAC.
- Anchorage Digital contributed $1 million and described it as part of its bipartisan policy approach.
- The PAC supported Republican candidates in Georgia, Kentucky, and Nebraska with targeted ad spending.
A newly formed crypto political committee has raised $11 million and quickly directed $3 million to advertising services. Fellowship PAC booked those ads through Nxum Group, a firm co-founded by Tether US CEO Bo Hines. Federal Election Commission filings released Wednesday detailed the funding sources and spending activity.
Fellowship PAC funding and early spending
Fellowship PAC collected $10 million from Cantor Fitzgerald and $1 million from Anchorage Digital, according to filings. The committee then committed $3 million for advertising through Nxum Group, which Hines co-founded with his father and a partner.
The PAC supports Republican candidates in congressional and gubernatorial races. It spent $300,000 to support Clay Fuller after he won a Georgia special election. It also directed $850,000 to Nate Morris in Kentucky’s Senate race and $350,000 to Senator Pete Ricketts in Nebraska.
Filings show Nxum Group received the full $3 million in disbursements for advertising services. Before this work, Nxum reported limited campaign activity. The firm previously donated $1 million in billboard advertising to MAGA Inc. in 2024.
Hines served as former President Donald Trump’s crypto adviser before joining Tether last year. He co-founded Nxum before taking his White House role. Nxum’s recent filings now connect it to the PAC’s initial advertising push.
Tether links and corporate contributions
Fellowship PAC has reported ties to Tether since its launch last year. A senior Tether executive serves as the PAC’s chairman. However, most of the current funding came from Cantor Fitzgerald.
Cantor manages reserves for Tether’s stablecoin operations. Howard Lutnick, Cantor’s former chief executive, now serves as Commerce Secretary under Trump. His children now oversee Cantor’s operations.
Fellowship PAC previously announced plans to raise $100 million to support pro-crypto candidates. That pledged total has not appeared in current filings. The PAC has not responded to requests for comment.
Anchorage Digital described its $1 million contribution as part of a broader strategy. The company stated, “Anchorage Digital has made a corporate contribution to the Fellowship PAC as part of our broader, bipartisan approach to advancing regulatory clarity for digital assets in the United States.” Anchorage also posted the statement on its website.
Neither Tether US nor Cantor Fitzgerald responded to media inquiries about their involvement. Filings identify a Cantor executive as the PAC’s treasurer. Current records do not show direct contributions from Tether entities.
U.S. law bars non-U.S. entities from directly participating in federal campaign financing. Tether operates globally, and public records do not clarify whether its U.S. arm contributed funds. The latest Federal Election Commission filings reflect $11 million raised and $3 million disbursed for advertising.
Crypto World
Dogecoin Price Prediction Targets $0.32 While AlphaPepe AI-DEX Demo Goes Live and Presale Nears $1M

The Dogecoin price prediction is shifting. After months pinned below $0.10, multiple analyst models now project DOGE reaching $0.32 by late 2026 if the ascending channel structure holds and broader crypto momentum returns. DigitalCoinPrice and CoinCodex place their conservative band between $0.32 and $0.50, while Binance Square contributors are mapping breakout targets at $0.26, $0.32, and $0.36 if resistance clears. The setup is forming but the timeline stretches across quarters. Meanwhile AlphaPepe just pushed its live AI-DEX demo into public access, crossed $850,000 in presale capital with the $1 million mark now visible, and continues offering a Stage 13 entry at $0.01450 where the distance to analyst targets makes the Dogecoin price prediction look like a rounding error.
What the $0.32 Dogecoin Price Prediction Actually Requires
DOGE trades at $0.093. The 200-day moving average sits at $0.14, more than 50% above the current price. Bollinger Bands remain compressed between $0.087 and $0.101, and every attempt to reclaim $0.10 this year has been rejected. For the Dogecoin price prediction to reach $0.32, the token needs to clear $0.10, flip $0.14 from resistance to support, break through the $0.28 descending trendline that has capped rallies since July 2025, and sustain momentum long enough for the ascending channel to complete.

That is four sequential resistance levels and a minimum of six to eight months under favorable market conditions. From $0.093 to $0.32 is a 244% return. For holders who bought below a penny years ago, that is a recovery story worth watching. For new capital entering at $0.093 today, that is eight months of waiting for a triple that depends entirely on Bitcoin, sentiment, and meme cycle timing all cooperating at once.
AlphaPepe AI-DEX Demo Goes Live as Presale Approaches $1M
The AlphaSwap demo is no longer a claim. It is running. Anyone can access the AlphaPepe cross-chain AI DEX interface and watch it screen contracts for exploit signatures, surface whale wallet movements in real time, and route swaps across chains through an AI execution layer. This is the product that will generate fee revenue the moment public trading opens. It works today, before a single listing candle has printed.
Behind the demo sits a codebase built by an engineer who cut their teeth shipping Shibarium infrastructure across 500 million live transactions. The smart contract carries a 10/10 BlockSAFU audit with zero vulnerabilities flagged. Supply is capped at 1 billion tokens. Every presale purchase delivers tokens to the wallet instantly with no vesting and no lock period.
The presale is approaching $1 million. Over $850,000 has been collected from 7,600 wallets, with roughly 100 new addresses entering every day. Stage 13 is live at $0.01450 but the price climbs every few days and jumps again when the current stage sells through. Stakers are collecting 85% APR while they wait for the Q2 DEX launch. A Tier 1 CEX listing follows directly after.
A $1,000 entry at $0.01450 secures 68,966 tokens. Analysts placing conservative targets at $1.50 would value that at $103,449 when trading begins. The Dogecoin price prediction needs eight months and four resistance flips for a 244% gain. AlphaPepe needs Q2 to arrive for a return measured in multiples of 100. Buyers entering at $5,000 or more can apply code ALPHA100 for a 100% bonus allocation, doubling their token count before the listing math even begins.
One Prediction Needs Permission. The Other Needs a Calendar.
The $0.32 Dogecoin price prediction may arrive. The technical structure supports it if conditions align. But the presale window at $0.01450 with a live AI-DEX demo, a flawless audit, and $1 million in sight does not wait for conditions. Stage 13 is filling and the next stage is approaching at a higher price.
Click To Visit AlphaPepe Official Website To Enter The Presale
FAQs
What is the Dogecoin price prediction for 2026?
Multiple models target $0.32 to $0.50 by late 2026, requiring a breakout above $0.10, $0.14, and $0.28 resistance levels from the current $0.093 price.
What is the AlphaPepe AI-DEX demo?
AlphaSwap is a live cross-chain AI DEX that screens contracts, tracks whale wallets, and routes swaps. The demo is publicly accessible now ahead of the Q2 launch.
How close is AlphaPepe to raising $1M?
Over $850,000 raised across 7,600 wallets with 100 new addresses daily. Stage 13 at $0.01450 is active and the next stage approaches at a higher price.
Disclaimer: This is a Press Release provided by a third party who is responsible for the content. Please conduct your own research before taking any action based on the content.
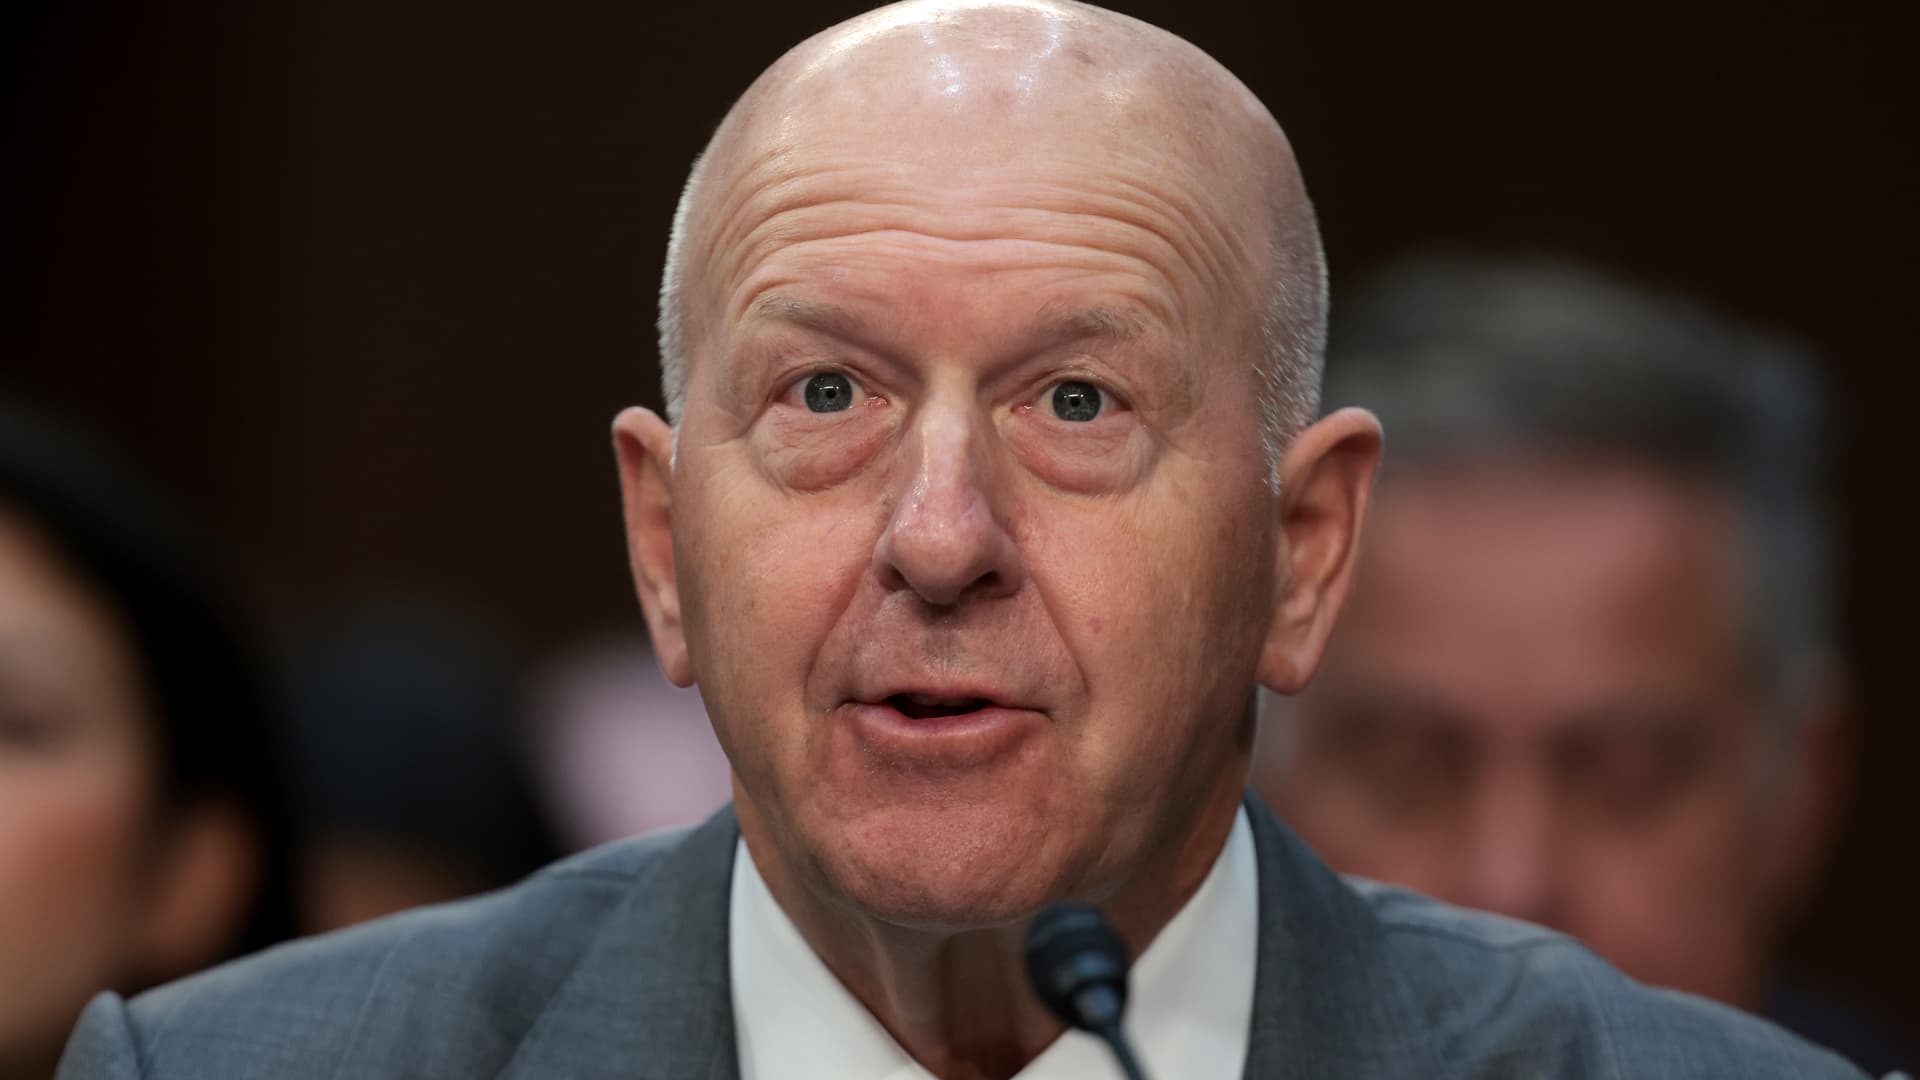
David Solomon, CEO Goldman Sachs, speaking on CNBC’s Squawk Box at the World Economic Forum in Davos, Switzerland on Jan. 22nd, 2026.
Oscar Molina | CNBC
When Goldman Sachs executives were asked about disappointing results in the firm’s fixed income division this week, they made it sound as though the trading environment was simply not in their favor.
Fixed income revenue fell 10% in the first quarter, coming in $910 million below analysts’ expectations, according to StreetAccount data. It was an unusually large miss for one of Goldman’s flagship Wall Street businesses.
“It was basically just a function of the overall environment making markets,” CFO Denis Coleman told an analyst on Monday after the bank’s earning report. “We remain actively engaged with clients, but our performance in rates and mortgages was relatively lower.”
But as nearly all of Goldman’s rivals, including JPMorgan Chase, Morgan Stanley and Citigroup, posted blockbuster results for first-quarter fixed income in the days that followed, one thing became clear to Wall Street: Goldman Sachs’ vaunted fixed income traders had underperformed.
JPMorgan saw fixed income trading revenue jump 21% to $7.1 billion, the bank’s second-biggest haul ever. Morgan Stanley, where fixed income is less a priority than equities, posted a 29% jump in the bond business. Citigroup saw bond trading revenue jump 13% to $5.2 billion.
Since before the 2008 financial crisis, when Lloyd Blankfein led Goldman Sachs, the firm’s fixed income division had been the envy of Wall Street. Goldman was known for its trading prowess, a reputation forged in periods of dislocation when its desks generated outsized gains. The bank’s identity as a trader’s firm — one expected to outperform in turbulent times — has endured in the decade-plus since.
That makes the first-quarter stumble particularly notable.
“It seems that something went wrong at Goldman in fixed income,” said veteran Wells Fargo analyst Mike Mayo, who called the bank’s results “worst-in-class.”
“I’d imagine that at Goldman, a fire is being lit under the traders, managers and risk overseers in FICC after such an underperformance,” Mayo said in an interview with CNBC, using an acronym standing for fixed income, currencies and commodities, the formal name for that business.
The prevailing theory is that Goldman was caught offsides on trades tied to interest rates in the first quarter, according to several market participants who asked for anonymity to speak candidly.
That’s because of the positioning that many Wall Street firms had at the start of this year, when markets were expecting the Federal Reserve to cut interest rates at least twice in 2026, these people said.
But after the price of oil surged with the advent of the Iran war, roiling expectations for inflation, the markets began pricing those cuts out, with some investors even bracing for the possibility of rate hikes this year.
Fixed income was the sole blemish on a quarter in which Goldman Sachs exceeded expectations handily, thanks to the firm’s equities traders and investment bankers. Despite the earnings beat, the firm’s shares dropped as much as about 4% on Monday following the report.
Goldman Sachs didn’t immediately return a call seeking comment. But on Monday, CEO David Solomon sought to put the quarter’s performance into context:
“When I look at the scale and the diversity of the business, it’s performing very, very well,” Solomon said during the company’s conference call. “Some quarters, it’s going to be stronger here, stronger there.”
Crypto World
Wall Street broker Bernstein sees prediction market volumes hitting $1 trillion by 2030 with HOOD, COIN as key players


Wall Street broker Bernstein expects prediction market volumes to reach roughly $1 trillion by 2030, as the sector evolves from niche wagering into broad-based “information markets” spanning sports, crypto, politics and the economy.
Volumes hit $51 billion last year and are on pace to reach about $240 billion in 2026, implying roughly 80% compound annual growth through the end of the decade, the report said. Activity has already accelerated in 2026, with Polymarket and Kalshi recording combined year-to-date volumes of $60 billion.
“Increasing regulatory clarity at the federal level is expanding the addressable market, while blockchain-based tokenization and integration with crypto markets is enabling global liquidity, long-tail event creation and participation from institutions,” wrote analysts led by Gautam Chhugani.
Prediction markets have surged from a niche corner of crypto and academic experimentation into a fast-growing segment of global trading activity in just a few years.
Volumes have spiked alongside major news cycles, most notably the 2024 U.S. election, while platforms like Polymarket and Kalshi have expanded access beyond politics into sports, crypto and macroeconomic events.
The combination of clearer U.S. regulatory footing, improved user experience and the integration of blockchain-based liquidity has accelerated adoption, pushing the sector toward mainstream relevance
The report attributed the growth to improving federal regulatory clarity, which expands access beyond fragmented state-level gaming rules, alongside blockchain-based infrastructure that enables global liquidity and rapid creation of new event contracts.
Sports currently accounts for about 62% of volumes, benefiting from lower effective take rates versus traditional online sportsbooks. But the analysts expect that share to fall to roughly 31% by 2030, as crypto-linked contracts and macro, political and economic events gain traction. Institutional participation is also expected to grow, particularly for hedging event-driven risks.
$10.8 billion in revenue
Bernstein analysts estimate industry revenues could expand from roughly $400 million in 2025 to $2.5 billion in 2026, reaching about $10.8 billion by 2030 at current take rates. Even with significant fee compression, they see potential for a multi-billion-dollar revenue pool.
Distribution is emerging as a key competitive moat. The report pointed to Robinhood (HOOD) and Coinbase (COIN) as early leaders, leveraging their combined tens of millions of users.
Robinhood has already built a $350 million annualized revenue run rate from prediction markets and is moving toward owning exchange infrastructure, while Coinbase entered via Kalshi with nationwide access to more than 1,000 contracts, the report added.
The broker has an outperform rating on both Coinbase and Robinhood.
ETH, SOL, and major altcoins are marginally higher on the day.
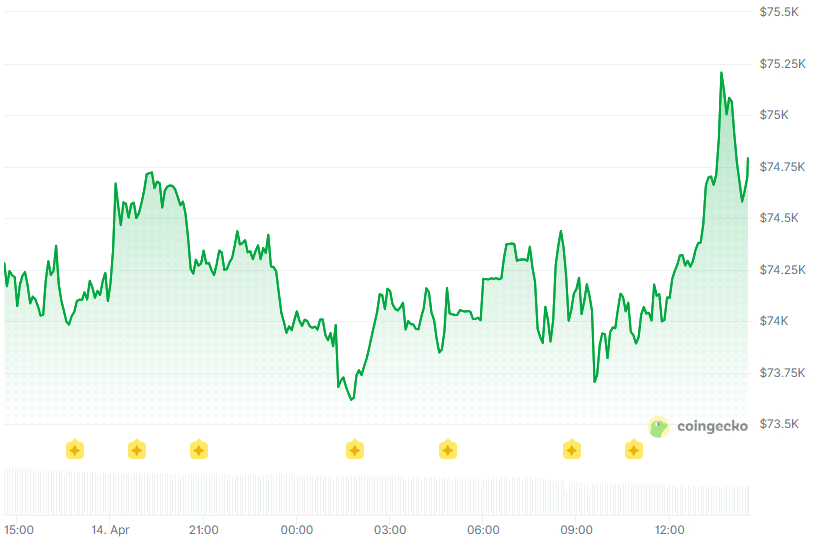
Bitcoin traded around $74,700 on Wednesday, consolidating just below the psychologically significant $75,000 level after retreating from a brief touch above $76,000 earlier this week.
Ethereum changed hands near $2,360, up roughly 2% on the day, while Solana rose to $85 and XRP climbed to $1.39, according to CoinGecko.

Among the Top 100 digital assets, DeFi lending protocols Aave and Morpho are today’s top gainers, up 8% and 7%, respectively.
Meanwhile, RaveDAO is the biggest loser after losing a quarter of its value overnight.
The total crypto market cap stands at $2.61 trillion with 24-hour trading volume near $97 billion. Bitcoin dominance is steady at 57.2%, with Ethereum dominance at 10.9%, per CoinGecko.
ETF Flows Whipsaw
U.S. spot Bitcoin ETFs posted $411.5 million in net inflows on Tuesday, according to SoSoValue data, the second-largest daily inflow day in April and enough to push 2026 year-to-date net flows back into positive territory. Total spot Bitcoin ETF assets under management surged above $96.5 billion.
BlackRock’s IBIT led with approximately $214 million, extending its inflow streak to five consecutive days totaling around $696 million.
The Tuesday inflows marked a sharp reversal from the previous day, when spot Bitcoin ETFs recorded $325.8 million in net outflows, underscoring the tug-of-war between institutional demand and profit-taking in a range-bound market.
Resistance at $75K
Bitcoin has struggled to sustain a break above $75,000, briefly piercing that level yesterday before pulling back to the low $74,000s. Since the onset of the U.S.-Iran conflict, BTC is up roughly 12%, benefiting from its perception as an apolitical store of value, but the rally has stalled at overhead resistance.
The geopolitical backdrop remains the dominant macro variable. Iran’s acceptance of Bitcoin as payment for Strait of Hormuz transit tolls, as confirmed by a spokesperson for Iran’s Oil, Gas and Petrochemical Products Exporters’ Union, continues to ripple through markets.
Bitwise CIO Matt Hougan argued this week that Iran’s use of Bitcoin in sovereign trade positions it to eventually challenge gold’s $34 trillion market cap.
Three near-term catalysts could determine whether Bitcoin breaks higher or retests the $70,000 support zone: the April 15 tax deadline, the Iran ceasefire expiry on April 22, and the FOMC meeting on April 28–29.
Bitwise Asset Management has launched a spot Avalanche exchange-traded product, giving investors exposure to the Avalanche token while staking a portion of its holdings to generate yield.
Bitwise plans to stake roughly 70% of its AVAX holdings through its in-house infrastructure, while maintaining a liquidity reserve of about 30% to meet redemptions and operational needs.
The fund began trading Wednesday on the NYSE under the ticker BAVA, closing up about 1.5%, to $25.50 per share, according to Yahoo Finance. The Avalanche token (AVAX) was last trading at $9.52, up 1.8%, according to CoinMarketCap.
According to Wednesday’s announcement, the product carries a sponsor fee of 0.34%, with a temporary waiver to 0% for the first month on the first $500 million in assets, and is structured to distribute net investment income, including staking rewards, to shareholders periodically.
The fund holds AVAX directly and uses an in-house staking unit, Bitwise Onchain Solutions, to participate in network validation and earn rewards, which are paid in additional tokens. Avalanche staking rewards were about 5.4% as of mid-April, according to the announcement.
Avalanche is a Layer-1 blockchain built for high throughput and low latency. It is used across tokenization and enterprise pilots, including initiatives tied to FIFA, state-level stablecoin efforts in Wyoming, and projects from companies such as Toyota and asset managers including BlackRock.
The new fund is the latest Avalanche fund development in recent weeks. Nasdaq last week filed with the US Securities and Exchange Commission (SEC) to list shares of the VanEck Avalanche Trust, a proposed ETF designed to provide exposure to AVAX under rules governing commodity-based trust shares.
Related: CME Group expands crypto futures with Avalanche and Sui contracts
Bitcoin ETFs and DATs hold an increasing amount of Bitcoin
The launch of Bitwise’s Avalanche ETF comes as exchange-traded crypto products and publicly traded companies continue to accumulate a growing share of Bitcoin’s (BTC) circulating supply.
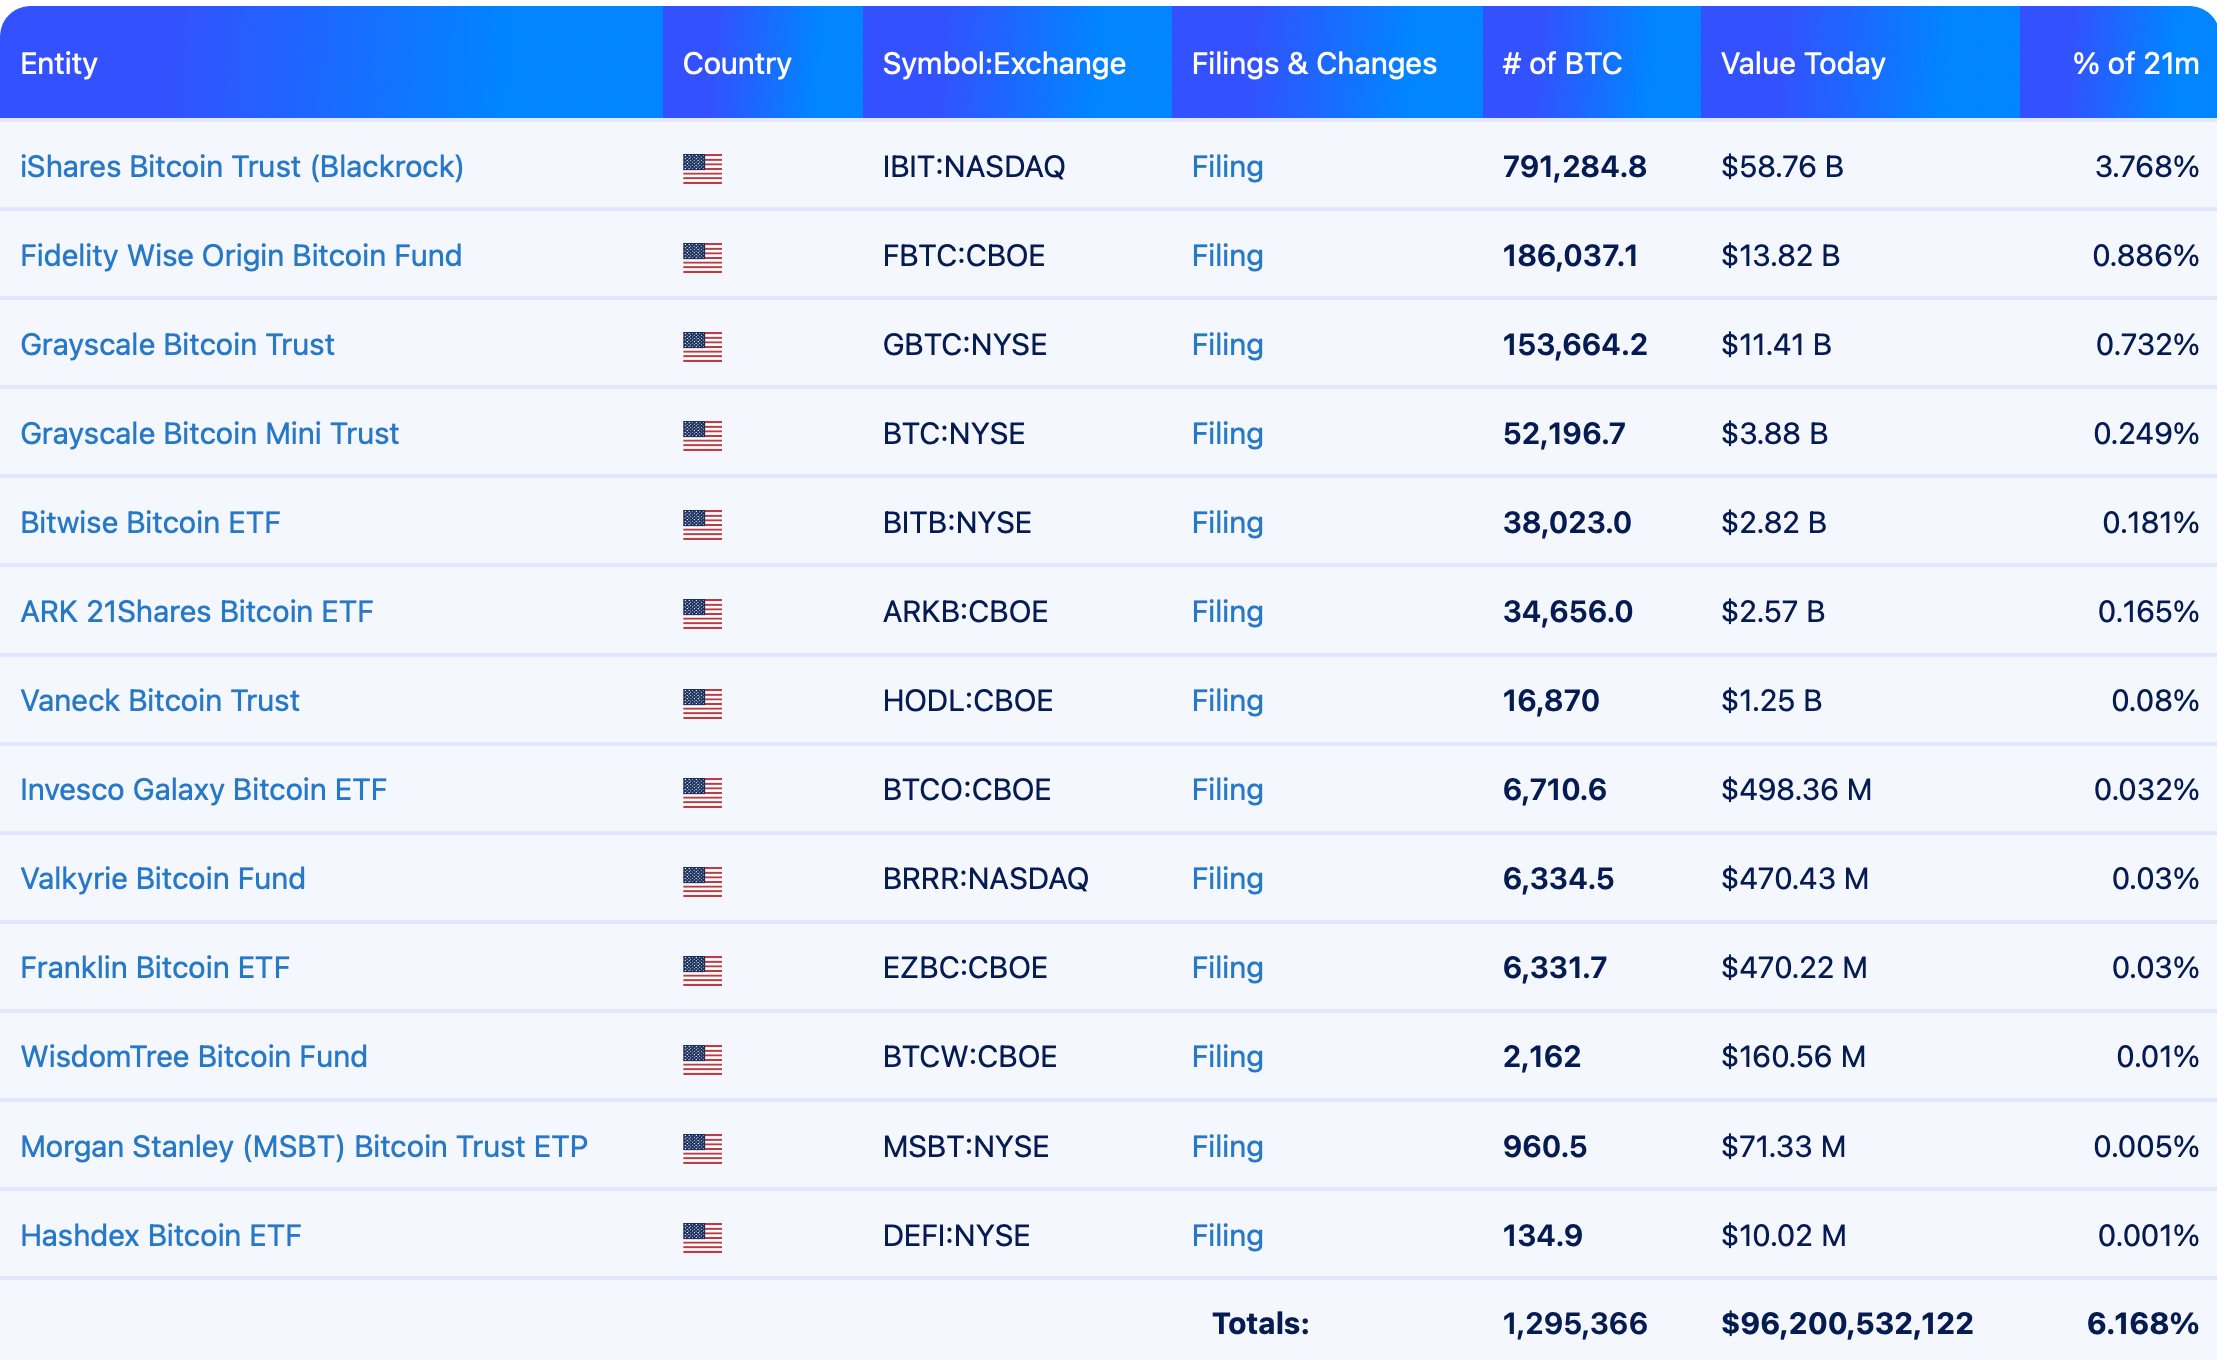
According to data from BitBO.io, Bitcoin ETFs hold more than 1.29 million BTC, or just over 6% of circulating supply. Public companies hold an additional 1.17 million BTC on their balance sheets, based on figures from BitcoinTreasuries.NET. Combined, ETFs and corporate holders now account for around 12% of Bitcoin’s circulating supply.
Among ETFs, accumulation is led by BlackRock’s iShares Bitcoin Trust, which holds about 791,000 BTC, or roughly 3.8% of total supply, followed by Grayscale’s Bitcoin Trust with around 153,600 BTC, or about 0.7%.

Beyond asset managers, banks are also entering the market. Earlier this month, the Morgan Stanley Bitcoin Trust (MSBT), the first spot Bitcoin ETF offered by a US bank, recorded $30.6 million in inflows on its trading debut and generated about $34 million in first-day volume.
On Tuesday, Goldman Sachs filed with the SEC to launch a Bitcoin-linked exchange-traded fund designed to generate income while limiting exposure to the cryptocurrency’s volatility. The proposed fund would invest in Bitcoin ETPs and sell call options to generate income while limiting exposure to price swings.
Among public companies, Strategy, the first Bitcoin treasury company, chaired by Michael Saylor, holds 780,897 Bitcoin, or around 4% of the total supply.
Governments also collectively hold around 3% of circulating Bitcoin, with around 649,870 BTC on their balance sheets. The United States is the largest holder with about 328,000 BTC, followed by China with roughly 190,000 BTC and the United Kingdom with more than 61,000 BTC.
Bitcoin’s price has fallen from its high of around $126,000 in October, and is trading around $75,100, per CoinGecko data.
Magazine: Bitcoin will not hit $1M by 2030, says veteran trader Peter Brandt

Young and Restless Early Spoilers April 20-24: Nick Overdosed in Alarming Crisis – Cane’s Major Gesture Shocks Everyone!

Why Bitcoin’s Supply Shock is ALREADY Here

Willis Lease Finance: Engine Leasing Strength Supports Strong Buy Rating (Upgrade) (WLFC)

Why Israel is blocking foreign journalists from entering

Bitcoin: We’re Entering The Most Dangerous Phase

Alan Cumming Brands Baftas Ceremony A ‘Triggering S**tshow’
Why Bitcoin’s Supply Shock is ALREADY Here

HDB Financial Services Q4 Results 2026 | HDB Financial Services Results Today | HDB Share News

HDB Financial Share q4 result 2026 I HDB Financial SHARE DIVIDEND I HDB Financial DIVIDEND I HDBFS
-

 Politics5 days ago
US brings back mandatory military draft registration
-
 Sports5 days ago
Man United discover Nico Schlotterbeck transfer fee as defender reaches Dortmund agreement
-

 Fashion5 days ago
Weekend Open Thread: Veronica Beard
-

 Politics6 days ago
Malcolm In The Middle OG Turned Down ‘Buckets Of Money’ To Appear In Reboot
-

 Politics3 days ago
World Cup exit makes Italy enter crisis mode
-

 Crypto World6 days ago
Canary Capital Files SEC Registration for PEPE ETF
-

 Business5 days ago
Tesla Model Y Tops China Auto Sales in March 2026 With 39,827 Registrations, Beating Cheaper EVs and Gas Cars
-

 Crypto World2 days ago
The SEC Conditionalises DeFi Platforms to Be Avoided for Broker Registration
-

 Crypto World2 days ago
SEC Signals Exemption for Crypto Interfaces From Broker Registration
-

 News Videos14 hours ago
Secure crypto trading starts with an FIU-registered
-
 NewsBeat3 days ago
Pep Guardiola and Gary Neville agree over Arsenal title problem that benefits Man City
-

 Business5 days ago
OpenAI Halts Stargate UK Data Centre Project Over Energy Costs and Copyright Row
-

 Business4 days ago
Ireland Fuel Protests Enter Day 5 as Blockades Spark Shortages and Government Prepares Support Package
-

 Politics6 days ago
LBC Presenter Mocks Trump Over Iran War Failures
-

 Crypto World5 days ago
Federal judge blocks Arizona from bringing criminal charges against Kalshi
-
 NewsBeat4 days ago
JD Vance announces ‘no agreement’ with Iran over nuclear weapons fear
-

 NewsBeat2 days ago
Trump and Pope Leo: Behind their disagreement over Iran war
-

 Crypto World2 days ago
SEC Proposes Certain Crypto Interfaces Don’t Need to Register as Brokers
-

 Tech6 days ago
A version of Windows 10 released a decade ago is now eligible for additional security patches
-

 Business5 days ago
IMF retains floor for precautionary balances at SDR 20 billion
You must be logged in to post a comment Login