
Crypto World
WTI Oil Prices Volatile Ahead of Potential Talks

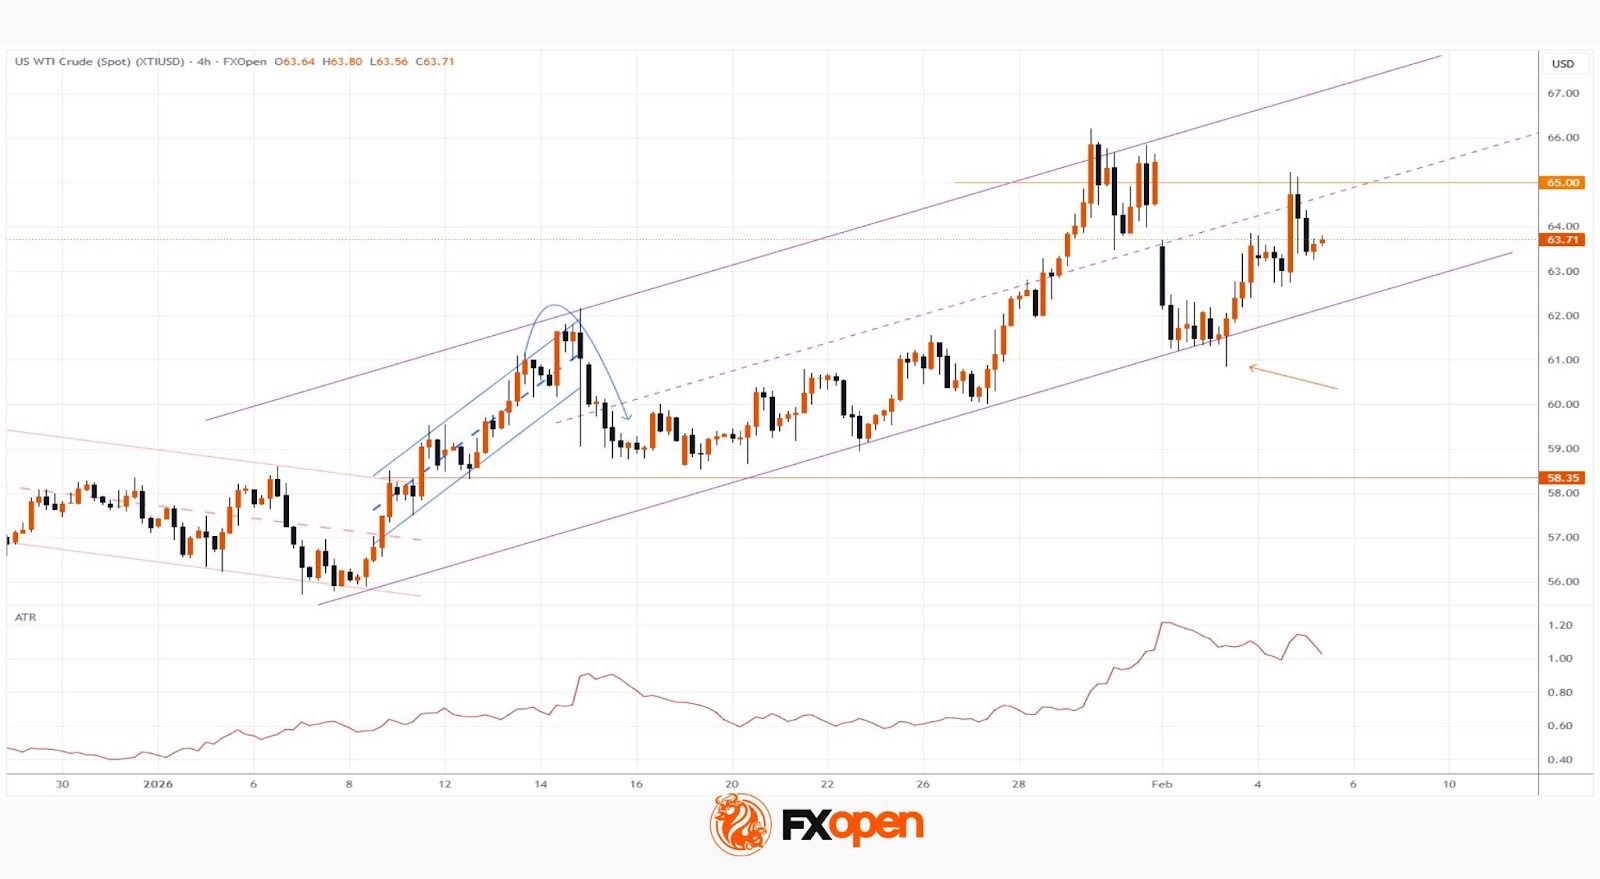
As the XTI/USD chart shows, the price of a barrel rose above $65 yesterday, reacting to the risk of talks between Iran and the United States on the nuclear deal breaking down. These negotiations could begin on Friday.
According to Axios, Arab world leaders have urged Donald Trump not to follow through on his threats to withdraw from the talks and shift towards military action after demands put forward by Iran. This news prompted a pullback in prices below $64.
The news backdrop is further complicated by conflicting reports regarding India’s refusal to purchase Russian oil, alongside other global factors. All of this is contributing to heightened volatility in the oil market, a trend also confirmed by the ATR indicator.
Technical Analysis of XTI/USD
On 14 January, we:
→ analysed swings in WTI crude prices to identify a breakout from a descending channel (shown in red) and outline an upward trajectory (shown in blue);
→ noted that the breakout level (around $58.35) was acting as support;
→ suggested that the market was vulnerable to a corrective move.
Indeed, on the same day (as indicated by the blue arrow), the price formed a bearish impulse towards this support, where the market found some balance.
However, geopolitical developments since the second half of January have supported higher prices, providing grounds to draw a broad ascending channel (shown in purple). In this context:
→ its lower boundary is acting as support, with the long lower wick on the 3 February candle confirming aggressive buying interest;
→ the $65 level appears to be a key resistance. Broad price swings formed there on 29–30 January — a sign of “smart money” activity — after which prices declined. Yesterday, the market again reversed sharply from this level.
It is therefore reasonable to assume that this resistance will pose a significant hurdle for bulls if they attempt to keep prices within the ascending purple channel. At the same time, the further direction of WTI oil price movements will most likely be determined by developments surrounding Friday’s Iran–US nuclear talks in Oman.
Start trading commodity CFDs with tight spreads (additional fees may apply). Open your trading account now or learn more about trading commodity CFDs with FXOpen.
This article represents the opinion of the Companies operating under the FXOpen brand only. It is not to be construed as an offer, solicitation, or recommendation with respect to products and services provided by the Companies operating under the FXOpen brand, nor is it to be considered financial advice.

Crypto World
U.S. Treasury to loop in crypto sector on hacker warnings shared with traditional firms

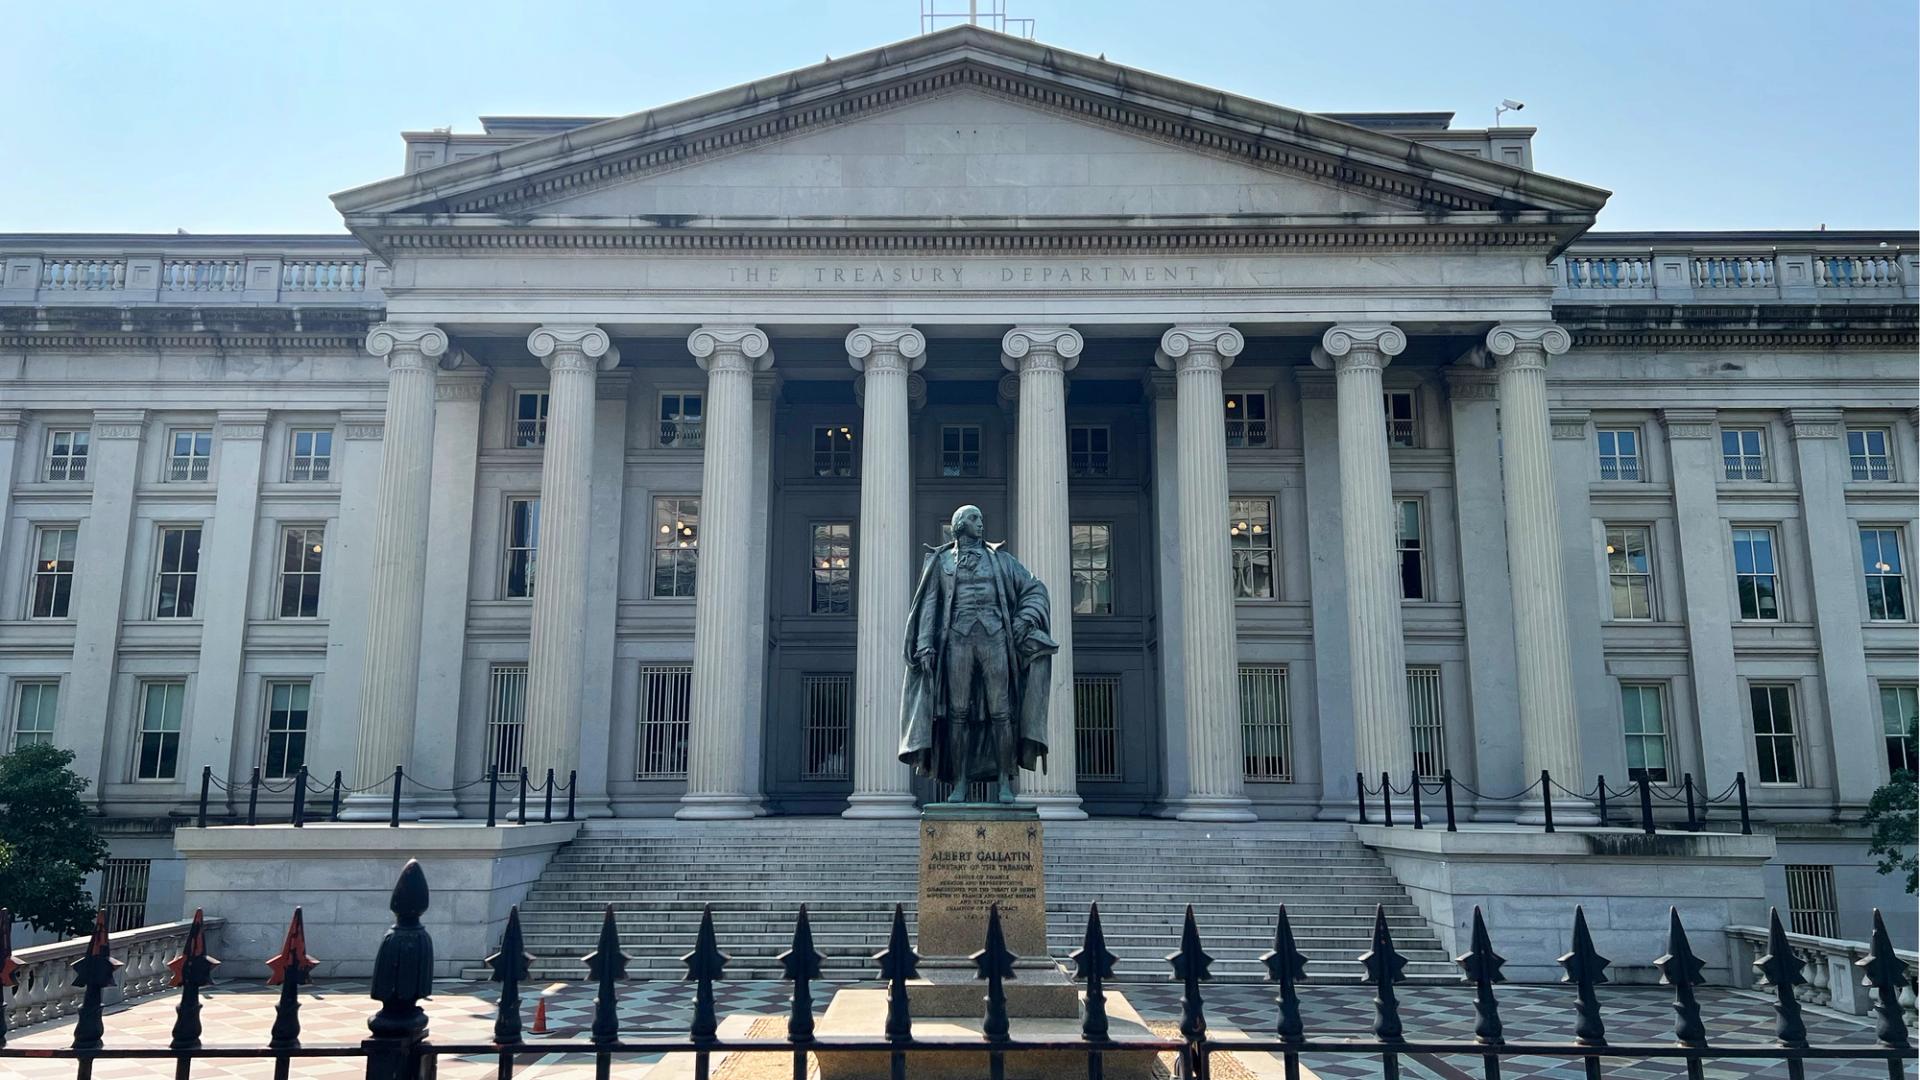
The U.S. Department of the Treasury is opening its cybersecurity information sharing to crypto businesses to help them ward off attacks as the industry becomes an increasingly important arm of the financial system, according to a Thursday statement.
Eligible crypto firms and organizations — a status not yet clearly defined in the announcement — can sign on for the same service enjoyed by traditional financial institutions. The Treasury’s Office of Cybersecurity and Critical Infrastructure Protection will include them on “timely, actionable cybersecurity information,” and encouraged interested companies to reach out to that office if they’re interested in the free service.
The move responds to an earlier recommendation from the President’s Working Group on Digital Asset Markets, which issued a report last year that included several information-sharing ideas on cyber-attack dangers.
“By extending access to the same high-quality cybersecurity information used by traditional financial institutions, Treasury is helping promote a more secure and responsible digital asset ecosystem,” said Luke Pettit, assistant secretary for financial institutions, in a statement.
The digital assets sector has been plagued since its earliest days by malicious hacks. Hardly a month goes by without a noteworthy cyber assault draining significant funds or data from crypto operations. North Korean-linked hackers stole over $280 million from decentralized platform Drift last week. Just this week, recent incidents spurred the Solana Foundation to pursue new security measures to prevent exploits.
Billions of dollars in assets are stolen each year, often by hacker groups sponsored by nations such as North Korea. Digital security has remained one of the points of concern for U.S. lawmakers weighing legislation that would bring the crypto sector into the regulated financial system.
Read More: U.S. DOJ Pursues North Korea’s Illicit Money Machine, Seizes More Crypto
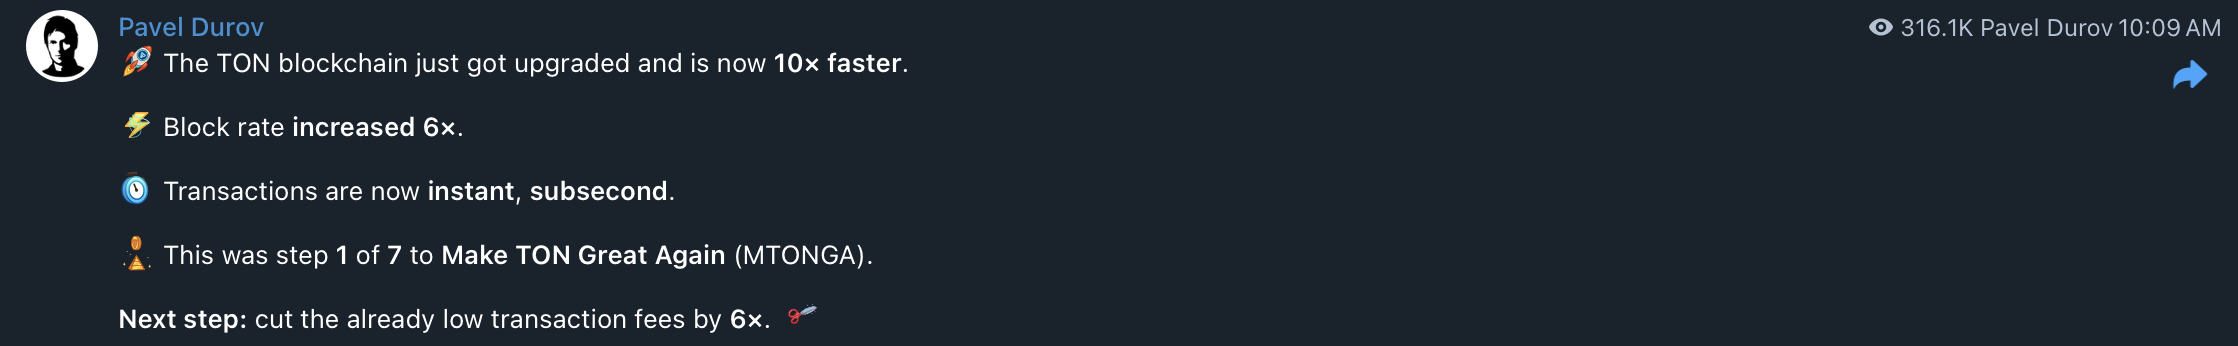
The Open Network (TON), an independent layer-1 blockchain that has integrations with the Telegram messaging application, said it has slashed block times to 400 milliseconds with the release of its Catchain 2.0 consensus upgrade.
Payment transactions now settle in about 1 second, while trades settle in “real time,” and decentralized applications will now operate at speeds comparable to traditional apps, according to TON’s announcement on Thursday.
Faster block times produce more validator rewards, as the number of blocks added to the chain increases. TON’s annual inflation is projected to increase six-fold, to 3.6% from about 0.6% following the update, TON said. Inflation represents the continuing minting and burning of Toncoin within its ecosystem.

“More blocks mean more validator rewards, which create stronger staking incentives and bring more TON into the network,” according to TON’s announcement.
The update builds on TON’s Catchain consensus algorithm, first proposed in 2020, and brings near-instant settlement to the blockchain network integrated into an application with more than 1 billion users worldwide.
TON was trading up 2.3% to $1.28 at last look on Thursday, data from CoinMarketCap showed. Volume was $130.1 million, up more than 35%. The token’s market cap was $3.17 billion.

Related: Dynamic adds embedded wallet infrastructure to TON for Telegram apps
Telegram provides users with a lifeline to communicate and send crypto worldwide
Pavel Durov, the co-founder of Telegram, said that despite government bans in Iran and Russia, significant numbers of people in both countries still use the application.
Telegram bans have backfired, as users circumvent national firewalls and state-imposed online restrictions by using virtual private networks (VPNs), which mask IP addresses, allowing users to bypass banned content online.
“The government hoped for mass adoption of its surveillance messaging apps, but got mass adoption of VPNs instead,” Durov said.

The integration with TON enables Telegram users to send crypto payments directly within the messaging application to other users, including businesses.
In February, the in-app crypto wallet in Telegram introduced self-custodial vaults that allow users to earn yield on Bitcoin (BTC), Tether’s USDt stablecoin (USDT) and Ether (ETH).
Earlier this month, the wallet launched perpetual futures trading for users directly in the Telegram application.
The integration was launched with perpetual decentralized exchange Lighter, and supports perpetual futures trading across multiple asset classes, including crypto, equities, commodities, precious metals and energy.
Magazine: As Ethereum phishing gets harder, drainers move to TON and Bitcoin

Disclosure: This article does not represent investment advice. The content and materials featured on this page are for educational purposes only.
Zcash and Avalanche show steady gains as investors eye faster-moving opportunities like BlockDAG.
Summary
- Zcash gains 6% toward $257 while Avalanche advances RWA strategy amid steady crypto market growth
- BlockDAG (BDAG) surges with rapid growth, drawing attention as a high-momentum contender in 2026
- Investors eye BDAG entry levels as strong demand and price momentum fuel market interest
The recent market trends show that the Zcash price has climbed 6% toward the $257 liquidity zone, showing steady momentum for privacy-focused investors. At the same time, Avalanche crypto continues to focus on institutional deals and real-world assets to maintain its market standing. While these traditional coins show steady growth, BlockDAG (BDAG) is moving at a much faster pace, offering a rare opportunity that outshines the rest.

With its $300 million market cap already secured and a recent $0.4 surge on CoinMarketCap, BlockDAG is building massive trust as the next market leader. The current $0.0000061 price is offering a final window for a potential 95x ROI.
Plus, with the project already tradable on LBank, BitMart, Coinstore, Biconomi, Acendex, etc., soon, this is the absolute last call to secure coins before the price explodes, making BlockDAG one of the top crypto gainers today.
Zcash price rises 6% past $250 resistance
The Zcash price recently jumped by over 6%, moving past the $250 price level. On April 6, it reached around $254.70 as more people started trading the coin. This increase happened alongside a general rise in the digital money market. Right now, the total value of all Zcash in the world is about $4.22 billion. Many people use this coin because it helps keep their transaction details private and safe.
Experts are watching a specific area near $257. If the Zcash price stays above $250, it might climb even higher toward $270. However, there is a risk that the price could drop again. If buyers decide to sell their coins to take a profit at $257, the price might fall back down to $240, which could make investors nervous about its future growth..
Avalanche crypto launches multi-chain subnet upgrades
Avalanche crypto is currently focused on bringing large financial companies onto its network. It uses a fast system that helps banks and businesses handle digital assets and official tasks like shareholder voting. Because of this, the value of real-world assets on the network is expected to hit $2.1 billion very soon. New updates have also made it much easier for organizations to build their own custom projects on the platform.
While Avalanche crypto is working with major names like ANZ and Galaxy Digital, the market still sees some ups and downs. Even with all the new partnerships, the price recently saw a dip of over 4%. This shows that while the technology is growing, the coin’s value can still be affected by general market shifts. If these big institutional projects don’t bring in enough regular users, they could face a slow period.
Why BlockDAG is the ultimate opportunity for 95x ROI at just $0.0000061
BlockDAG is currently moving at a speed that has left the market stunned. It has already secured a massive $300 million market cap, a milestone that most projects take years to reach. A recent price surge to $0.4 on CoinMarketCap proved that this network is a serious contender for the top spot. This rapid growth has built deep trust among experts who now name BDAG as the next potential market leader.
The window to secure BDAG at the Batch 4 price of $0.0000061 is closing fast. This specific entry point is ending soon, and once the transition happens, this low price will likely never be seen again.
Analysts suggest that entering at $0.0000061 could deliver a staggering 95x ROI for those who act now. Since Batch 3 sold out almost instantly, the rush for Batch 4 is even more intense. Market makers are also predicting BDAG to hit the $1 mark soon. This represents the final opportunity to get in before the project hits a whole new level of value.

Global demand is about to explode as BDAG has just become tradable on major exchanges, including XT.com, LBank, Coinstore, Biconomi, and Ascendex. Following even broader exchange coverage in late April, the roadmap shifts to DEX integration and liquidity incentives in May.
By June, the project will launch its “Super App,” featuring lending protocols and dApps. With a $300M market cap, rapid $0.4 price surge on CMC, and a low-entry price of $0.0000061, it is clear why everyone is rushing to jump in on one of the top crypto gainers today.
Final verdict
While the Zcash price shows steady growth near its liquidity zones and Avalanche crypto secures its future with institutional partnerships, they lack the explosive potential of newer projects. These established coins are reliable, but they don’t offer the rapid wealth-building power seen in the BlockDAG presale.
BlockDAG has already proven its dominance with a $300 million market cap and a massive surge on CoinMarketCap. With the $0.0000061 price ending and a 95x ROI on the horizon, the opportunity to act is vanishing. Investors are quickly moving their funds into this project to secure a spot in one of the top crypto gainers today.
For more information, visit the presale website, official website, Telegram, and Discord.
Disclosure: This content is provided by a third party. Neither crypto.news nor the author of this article endorses any product mentioned on this page. Users should conduct their own research before taking any action related to the company.
The Commodity Futures Trading Commission (CFTC) filed a motion Wednesday seeking a preliminary injunction and temporary restraining order against Arizona’s enforcement of state gambling laws on prediction markets.
The motion escalates an already historic conflict. The agency sued Arizona, Connecticut, and Illinois last week, marking the first time in its 50-year history that it has sued a state.
Federal Power Play With Family Ties
CFTC Chairman Michael S. Selig framed the injunction request as a defense of federal authority, noting that the CFTC will vigorously defend its exclusive authority over prediction markets.
“The agency won’t stand for intimidation by states seeking to nullify federal law,” wrote Selig in a post.
It follows a motion in Arizona that builds on a recent filing against States that use criminal and gambling laws to interfere with CFTC-regulated prediction markets.
Arizona’s decision to weaponize preempted state criminal law against companies that comply with a comprehensive federal regime sets a dangerous precedent… The CFTC is committed to vigorously defending its exclusive authority over prediction markets,” read an excerpt in the press release, citing Selig.
Arizona filed criminal charges against Kalshi in March, alleging illegal gambling and unauthorized election wagering.
The CFTC argues that prediction markets fall under the Commodity Exchange Act (CEA), which grants the agency exclusive federal jurisdiction over event contracts.
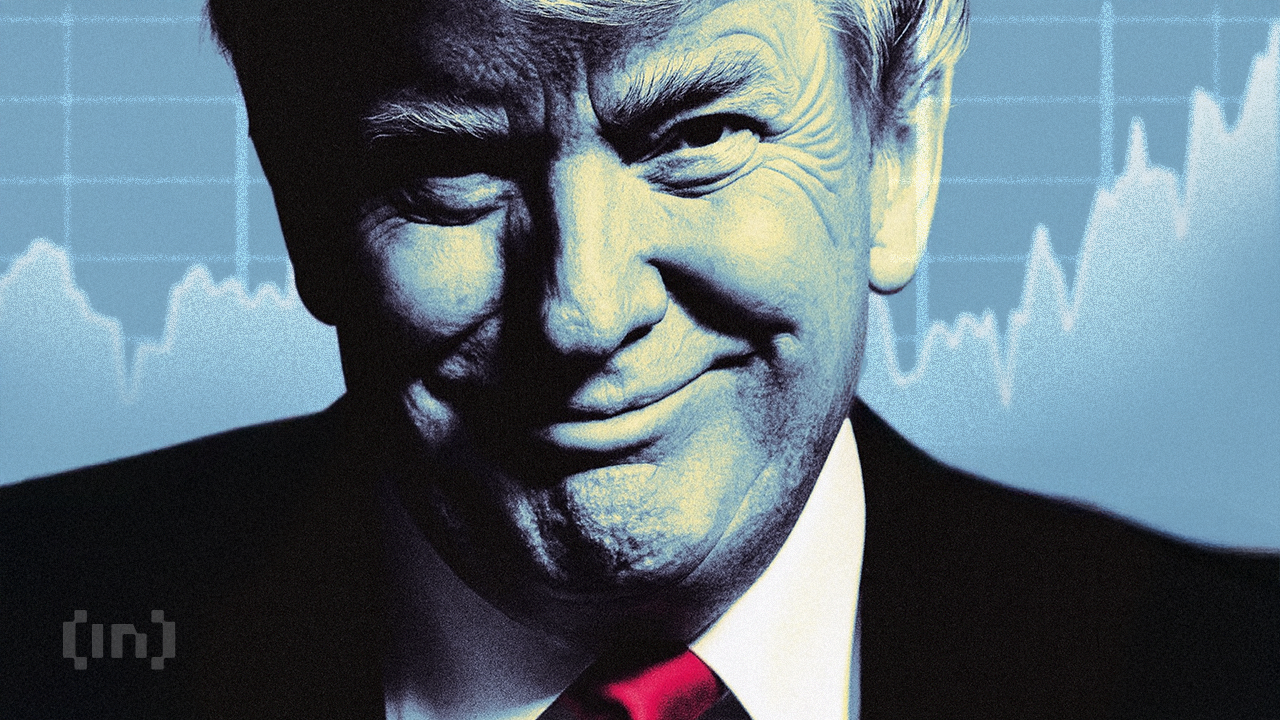
However, the platforms the CFTC is defending carry significant financial ties to the Trump family.
Donald Trump Jr. serves as a paid strategic advisor to Kalshi and sits on Polymarket’s advisory board. His venture capital firm, 1789 Capital, invested millions into Polymarket in August 2025.
Crypto.com, Robinhood, and the Conflict Question
The connections extend further. Trump Media & Technology Group (TMTG) partnered with Crypto.com to build Truth Predict, a prediction market platform for Truth Social.
Crypto.com has donated at least $35 million to MAGA Inc., Trump’s primary Super PAC.
Robinhood announced Monday it will serve as the brokerage and initial trustee for Trump Accounts. All four companies received cease-and-desist letters from the states the CFTC is now suing.
Georgia State University professor Todd Phillips told NPR the federal suits go beyond advocacy. He described them as an attempt to tilt the scales in favor of prediction markets.
Connecticut Attorney General William Tong pushed back, calling prediction market contracts plainly unlicensed illegal gambling and pledging to defend state consumer protection laws.
The Ninth Circuit will hear oral arguments on April 16 in a consolidated case involving Kalshi, Robinhood, and Crypto.com.
That ruling could determine whether prediction markets operate under one federal framework or face state-by-state restrictions.
The post Trump’s CFTC Shields His Family’s Prediction Market Partners From Prosecution appeared first on BeInCrypto.
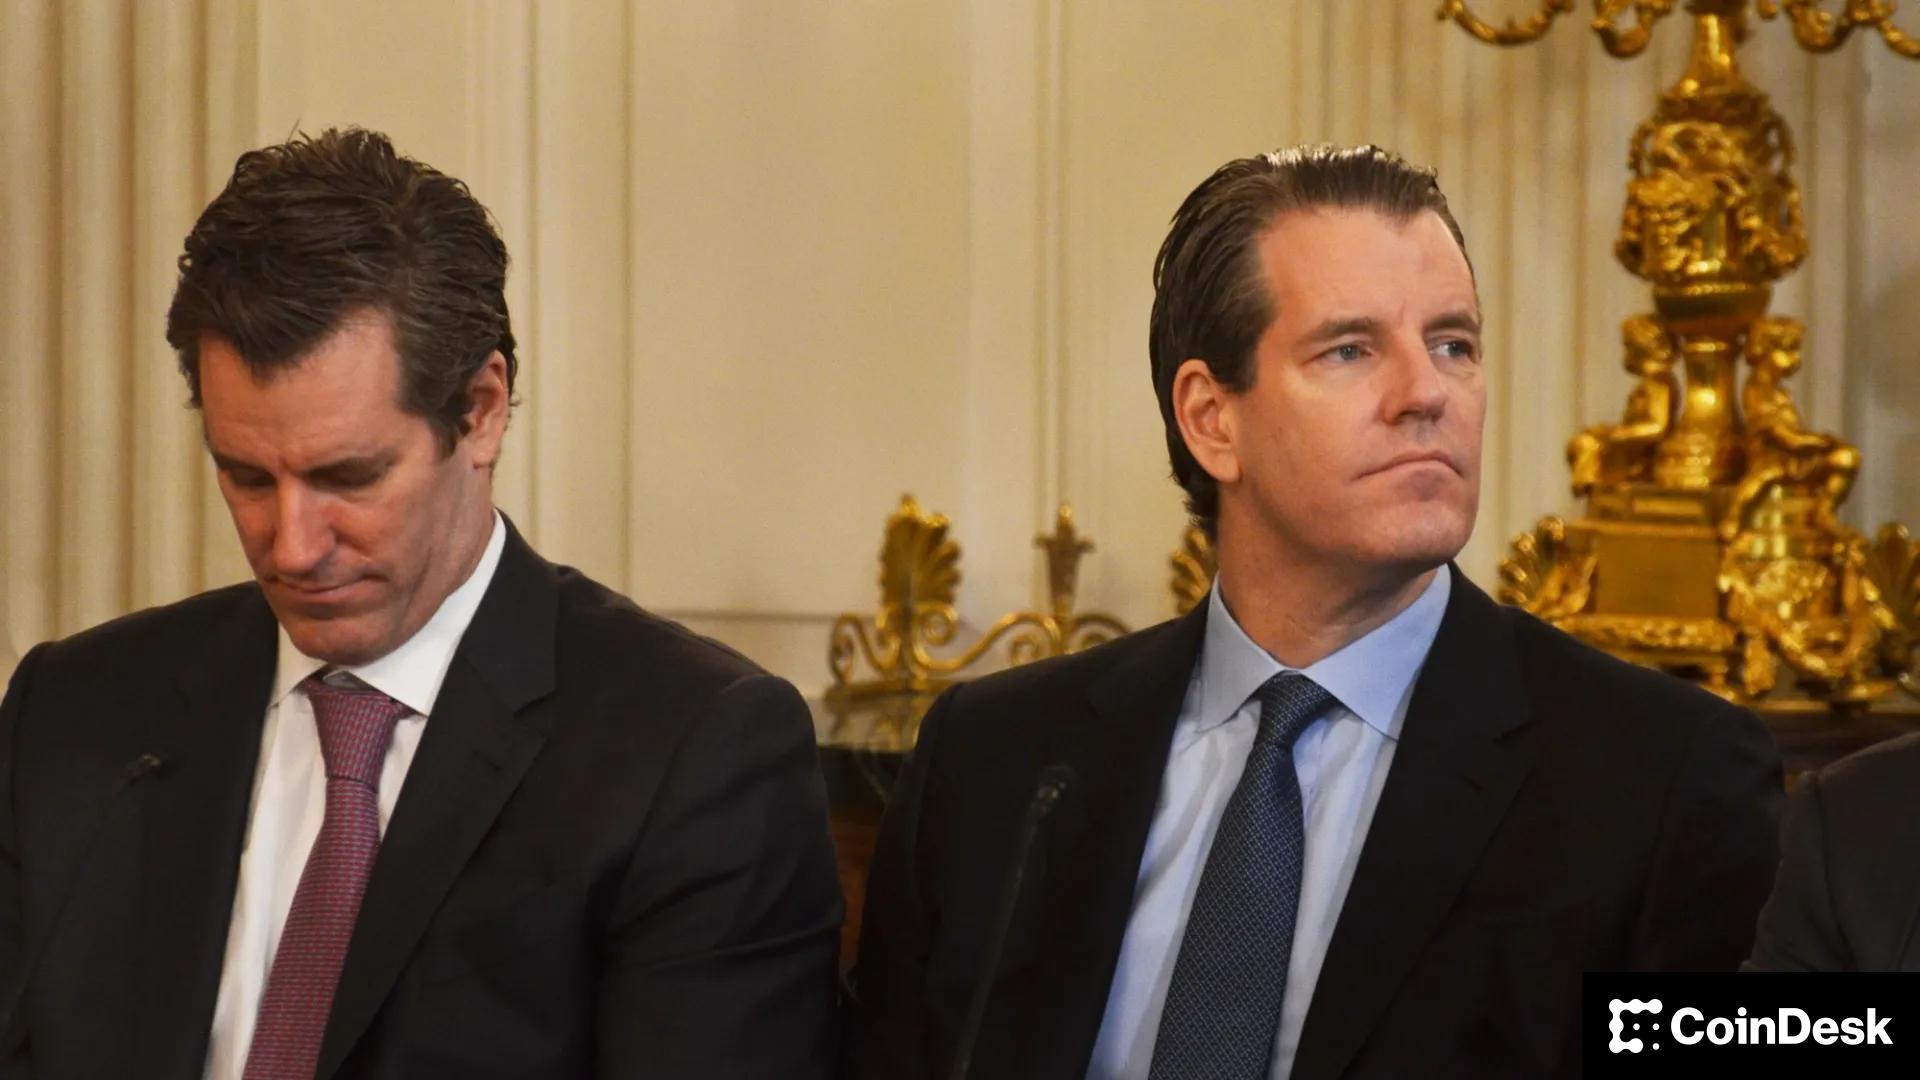

Potential buyers are evaluating an acquisition of parts of Gemini Space Station (GEMI), the crypto exchange backed by the billionaire Winklevoss twins, according to a person with direct knowledge of the matter.
The New York-based firm said in February that it was cutting its global workforce by 25% and shutting down its operations in the U.K., the European Union and Australia and keeping only its U.S. and Singapore businesses.
Some would-be acquirers are interested in buying the company’s now-shuttered operations in Europe and the U.K. to obtain regulatory licenses in these jurisdictions and are not interested in a full takeover of the Nasdaq-listed company, the person said, who spoke on condition of anonymity as the matter is private.
A company spokesperson declined to comment.
Gemini extends beyond a trading venue, offering institutional custody, staking and yield products, and payments infrastructure enabling fiat–crypto on- and off-ramps. It has also built brokerage and clearing capabilities, positioning itself as a full-service platform rather than just an exchange. The firm also provides a crypto rewards credit card, allowing users to earn digital assets on everyday spending.
Regulatory approvals
In Europe, Gemini operated under a combination of national registrations across several jurisdictions and a Markets in Crypto-Assets (MiCA) license that enabled it to offer services across the EU single market.
In the U.K., the exchange is registered with the Financial Conduct Authority (FCA) as an electronic money institution (EMI), allowing it to provide certain regulated payment services. It also appears on the FCA’s register of approved cryptoasset service providers.
Securing regulatory approvals in Europe and the U.K. can take years, which is why acquiring Gemini’s now-shuttered operations makes sense, the person added.
Under Europe’s MiCA regime, a crypto license doesn’t simply transfer to a new owner in an acquisition. Instead, any takeover of a licensed firm is treated as a “change of control” event, meaning regulators reassess the deal rather than automatically allowing the authorization to pass.
Acquirers must notify the relevant national competent authority and, in many cases, secure approval, or at least a formal non-objection, before closing, effectively subjecting the new owner to regulatory scrutiny similar to a fresh applicant.
The Financial Conduct Authority takes a very similar approach. A crypto firm registered with the FCA does not have a transferable license in an acquisition. A takeover is treated as a change of control, not a transfer of authorization.
Volatile run
Gemini’s shares have been volatile since its September 2025 IPO.
The stock was priced at $28 in its IPO, opened above $37 and closed its first day around $32, with intraday gains of more than 30% signaling strong investor demand.
However, that early momentum quickly unraveled.
The stock has since collapsed from its post-listing highs and now trades at around $4.36, down more than 80% from its IPO price, underscoring a steep loss of investor confidence amid a broader crypto market downturn and company-specific headwinds.
Senior departures
The company recently parted ways with three top executives, including its chief operating officer (COO), chief financial officer (CFO), and chief legal officer (CLO), the exchange disclosed in a February filing.
COO Marshall Beard, CFO Dan Chen and CLO Tyler Meade all left with immediate effect, according to the filing. Beard also resigned from Gemini’s board of directors, with the firm stating his departure was not the result of any disagreement related to its operations, policies or practices.
The departures came just days after Gemini announced it would shut down its crypto exchange operations in the U.K., European Union and Australia.
Gemini shares were 11% higher after the news. Short interest is 15% of the float according to FactSet data.
Read more: Gemini stock falls 10% after it parts ways with COO, CFO and Chief Legal Officer months after IPO
UPDATE (April. 9, 6.20 pm UTC): Updates story with the share price move and short interest data.

The window of opportunity in the digital asset market is closing faster than most traders realize. While many investors wait for mainstream news outlets to confirm a breakout, the real wealth is being generated in the quiet moments before the vertical climb.
Identifying the best crypto to buy right now requires a shift in perspective from following the crowd to anticipating the needs of the future global financial infrastructure. The market is currently signaling a massive rotation into projects that offer more than just hype; it is hungry for scalability, interoperability, and genuine utility.
Those who hesitate to diversify into these high-conviction assets today may find themselves watching from the sidelines as the most promising opportunities move out of reach forever.
1. BlockDAG (BDAG): The 95x Opportunity of the Year
BlockDAG is currently dominating conversations as the best crypto to buy right now due to a unique pricing gap that savvy investors are exploiting for maximum gain. On CoinMarketCap, the asset has already crossed the $0.02 threshold, after validating the early projections made by market makers who foresaw a climb to $0.4. With that milestone achieved, the trajectory is now set for a $1 valuation in the near future.
However, a massive opportunity remains for those who know where to look. While the public market price reflects steady growth, individuals can still acquire BDAG tokens directly through the BlockDAG website for just $0.0000061. This price difference creates a mathematical path toward 95x returns for those who act before the direct sale window terminates.
The momentum behind this project is fueled by its upcoming accessibility on several major trading platforms. Liquidity and volume are expected to surge as BDAG becomes tradeable on XT.com, LBank, Coinstore, Biconomi, BitMart, P2B, AscendEX, and more. These listings ensure that once the direct purchase phase concludes, the asset will have the global reach necessary to sustain its march toward the $1 target.
Investors are rushing to secure their positions at the fractional entry price of $0.0000061, recognizing that the current discrepancy between the direct sale and the market price is a rare chance to front-run the broader retail market.
2. Chainlink (LINK): The Essential Backbone of DeFi
Chainlink remains a staple for anyone searching for the best crypto to buy right now because it functions as the central nervous system for decentralized finance. It provides the essential oracle infrastructure that bridges the gap between isolated blockchains and the vast amount of data existing in the real world.
Without the reliable data feeds provided by Chainlink, smart contracts would be unable to execute based on price fluctuations, weather patterns, or even sports results. This makes LINK a fundamental necessity rather than a speculative luxury, as the entire DeFi ecosystem relies on its accuracy to maintain its integrity and security.
Beyond simple data delivery, the project has introduced the Cross-Chain Interoperability Protocol (CCIP), which is setting the global standard for how different blockchains communicate. This technology has caught the attention of major traditional financial institutions like Swift and DTCC, which are using Chainlink to explore how tokenized assets can be settled across various networks.

Because node operators must stake LINK as collateral to secure the network, there is a direct correlation between the adoption of these services and the demand for the token. As more global banks integrate CCIP, the pressure on LINK’s circulating supply could lead to a significant valuation shift.
3. Polkadot (DOT): Leading the Multi-Chain Future
Polkadot offers a sophisticated solution to the problem of blockchain fragmentation, making it a top contender for the best crypto to buy right now. Its unique architecture allows various specialized blockchains, known as parachains, to run in parallel while leaning on the central Relay Chain for their security.
This setup allows developers to build chains that are perfect for one specific task without having to worry about building their own security from scratch. With the transition toward Polkadot 2.0 and the implementation of async backing, the network has seen a massive boost in how many transactions it can handle, drastically reducing wait times for users.
One of the most significant changes to the ecosystem is the introduction of Coretime. This new model changes how blockspace is distributed, making it much more affordable and flexible for new projects to join the network compared to the old auction system.
For those holding DOT, the project offers a governance system that provides actual power over the network’s future, including how the treasury is spent. Additionally, with staking rewards currently sitting between 14% and 16% APY, DOT provides a way to grow a portfolio through passive income while the broader ecosystem of specialized chains continues to expand.
4. Cosmos (ATOM): Powering the App-Chain Revolution
Cosmos is built on the belief that the future of the internet consists of thousands of independent blockchains, and it provides the tools to make that happen. The Cosmos SDK is currently the most popular framework for creating custom blockchains, utilized by heavy hitters like Celestia and the BNB Chain.
This widespread use ensures that ATOM remains at the heart of a massive network of interconnected apps. The Inter-Blockchain Communication (IBC) protocol is the secret sauce here, allowing over 100 different chains to trade data and assets instantly, creating a web of value that is unmatched in its fluidity.

The value of the ATOM token has recently been strengthened by the introduction of interchain security. This allows the main Cosmos Hub to lend its security to newer, smaller chains. In return, ATOM stakers receive a portion of the revenue generated by these newer projects.
This creates a diversified reward stream for holders, who earn from both the main hub and the various “consumer chains” it protects. For investors looking for the best crypto to buy right now, ATOM represents a diversified bet on the entire “app-chain” philosophy, capturing value from every new project that chooses to build within the Cosmos ecosystem.
Which is the Best Crypto to Buy Right Now?
The current market window presents a rare alignment of technological maturity and undervalued entry points. While the fear of missing out often drives irrational decisions, the data behind these four projects suggests that the real risk lies in inaction.
From the massive 95x potential found in the BlockDAG direct purchase to the institutional-grade stability of Chainlink, Polkadot, and Cosmos, the best crypto to buy right now is defined by utility and scalability.
Securing a position in these assets today is not just about catching a trend; it is about owning a piece of the infrastructure that will define the next decade of finance. The opportunity to buy at these levels is a fleeting moment in a rapidly accelerating market cycle.
Disclaimer: This is a Press Release provided by a third party who is responsible for the content. Please conduct your own research before taking any action based on the content.


UK-led Operation Atlantic froze over $12M in crypto scam proceeds tied to “approval phishing,” identifying 20,000+ victims and $45M in suspected fraud.
Summary
- UK, US and Canadian agencies ran Operation Atlantic, freezing more than $12M in suspected crypto scam proceeds and identifying over 20,000 victims.
- The crackdown targeted “approval phishing,” where victims are tricked into signing malicious on-chain authorizations that let scammers drain wallets.
- Binance and other private firms provided account screening and fraud intelligence support, though no funds were frozen on Binance itself.
UK, US and Canadian law enforcement have frozen more than $12 million in suspected crypto scam proceeds in a coordinated action targeting “approval phishing” schemes that hit over 20,000 victims. The joint effort, dubbed Operation Atlantic and led by the UK’s National Crime Agency (NCA), focused on scams that trick users into signing malicious on‑chain approvals, allowing attackers to drain tokens directly from victims’ wallets. Authorities say total fraud linked to the identified infrastructure exceeds $45 million.
According to the NCA, Operation Atlantic was co‑hosted with the U.S. Secret Service, Ontario Provincial Police and the Ontario Securities Commission, and ran as an intensive, week‑long initiative in March. Rather than only tracing funds after the fact, agencies worked to “identify victims who have lost, or were at risk of losing, cryptocurrency through ‘approval phishing’,” securing assets before criminals could move them further down the laundering chain. Chainalysis, which supported the operation, described the approach as targeting “a fast-growing threat: approval phishing scams that trick victims into granting criminals permission to drain their wallets,” and noted that the effort “secured and frozen more than $12 million in suspected criminal proceeds” while mapping over $45 million in stolen crypto tied to related schemes.nationalcrimeagency.
crypto scam funds found
Private sector firms played a visible role. Binance said its Special Investigations team provided on‑site support at the NCA’s London headquarters, including “live account screening and scam intelligence” and the identification of still‑active scam websites, but stressed that “no funds were frozen on Binance as part of the operation.” In a statement supporting the action, Binance called approval phishing “one of the most damaging types of scams targeting crypto users today,” arguing that Operation Atlantic shows “how effective crime fighting is possible when private and public partners move together to stop fraud at the source.” NCA deputy director of investigations Miles Bonfield said the operation “has led to the safeguarding of thousands of victims in the UK and overseas, stopped criminals in their tracks and helped save others from losing their funds,” adding that fraudsters “operate globally and, together with our international partners, so will the NCA to target them wherever they are based.”
While the sums recovered are small relative to the broader crypto market, the operation highlights both the growing sophistication of on‑chain fraud and the increasing willingness of law enforcement and major exchanges to coordinate in near real time. It also underlines a practical lesson for users: the most dangerous transaction is often the one you approve yourself.


Coinspaid has partnered with The Residency to give early-stage founders preferential access to its stablecoin and crypto payment infrastructure, usually reserved for larger fintechs.
Summary
- Coinspaid, one of Europe’s largest crypto payment providers, will offer Residency startups preferential access to its stablecoin processing and payout stack.
- The deal includes multi-chain connectivity, automated on-chain settlements, liquidity tools, and compliance-ready payment APIs typically used by larger global businesses.
- The Residency, backed by operators and advisors such as Sam Altman, sees the partnership as giving founders infrastructure “normally out of reach” for early-stage companies.
Coinspaid, one of Europe’s largest blockchain payment infrastructure providers, has entered a strategic partnership with The Residency, a global community for early-stage founders and innovators. The deal will give startups inside The Residency access to Coinspaid’s stablecoin and payment stack on preferential terms normally reserved for larger fintechs and scale-ups.
The Residency has built a reputation for backing ambitious founders in a tight network of operators, researchers and tech leaders, including advisors like Sam Altman, who has long argued that talent and innovation often flourish outside traditional tracks. In that context, the partnership is designed to turn “who’s in the room” into “what infrastructure you can actually plug into,” by giving early teams access to compliant, production-grade payments plumbing from day one.
Coinspaid brings blockchain to Europe
Under the collaboration, Residency startups will be able to tap Coinspaid’s stablecoin processing and payout architecture, direct multi-chain connectivity and node infrastructure, automated on-chain settlements and liquidity management, plus developer-ready APIs and payment interfaces. They will also receive exclusive commercial terms, priority access to Coinspaid’s full suite of payment, treasury and settlement tools, and built-in compliance logic and risk controls already used by thousands of businesses. For founders trying to move money across borders or streamline treasury without building everything in-house, the offer aims to compress both time and regulatory friction.
“Startups need reliable, compliant financial infrastructure from day one, especially in fast-moving markets like the blockchain industry and digital finance,” said Pavel Kashuba, Strategic Leader at Coinspaid. “We’re excited to partner with The Residency and equip founders with solutions that help them scale confidently and securely.” The Residency’s founder, Nick Linch, framed it as an upgrade to the community’s toolkit: “Coinspaid brings world-class technology and a track record of enabling businesses to grow at scale. This partnership will provide our founders with access to infrastructure that would typically be out of reach for early-stage companies.”
Both organizations position the agreement as more than a simple vendor discount. By lowering the barrier to compliant, cross-border crypto payments and stablecoin rails, they are effectively betting that the next generation of digital commerce and fintech companies will expect institutional-grade infrastructure from the moment they launch, not years later.
Bitmine Immersion Technologies (BMNR) began trading on the New York Stock Exchange on April 9, but the stock dropped nearly 2% despite an announcement of a $4 billion buyback.
The transition from the NYSE American to the main NYSE board marks the Ethereum-focused treasury firm’s largest corporate event to date.
BitMine Lands on NYSE, Expands Buyback to $4 Billion
Chairman Thomas “Tom” Lee confirmed the uplisting on April 9. BMNR ceased trading on the NYSE American after-market on April 8 and opened on the main board the following morning.
Alongside the move, BitMine’s board unanimously approved a fourfold expansion of its 2025 share repurchase program. The authorization grew from $1 billion to $4 billion, ranking it among the 10 largest buyback announcements in 2026, according to Fundstrat data.
“There may be a time in the future when Bitmine shares are trading below intrinsic value, and the Company wants to be in a position to accretively retire common shares,” read an excerpt in the announcement.
Repurchases will continue under existing terms through open market transactions via Cantor Fitzgerald & Co.
4.8 Million ETH and a 5% Supply Target
As of this writing, BitMine held approximately 4.803 million Ethereum tokens valued at roughly $10.6 billion at current prices near $2,218.
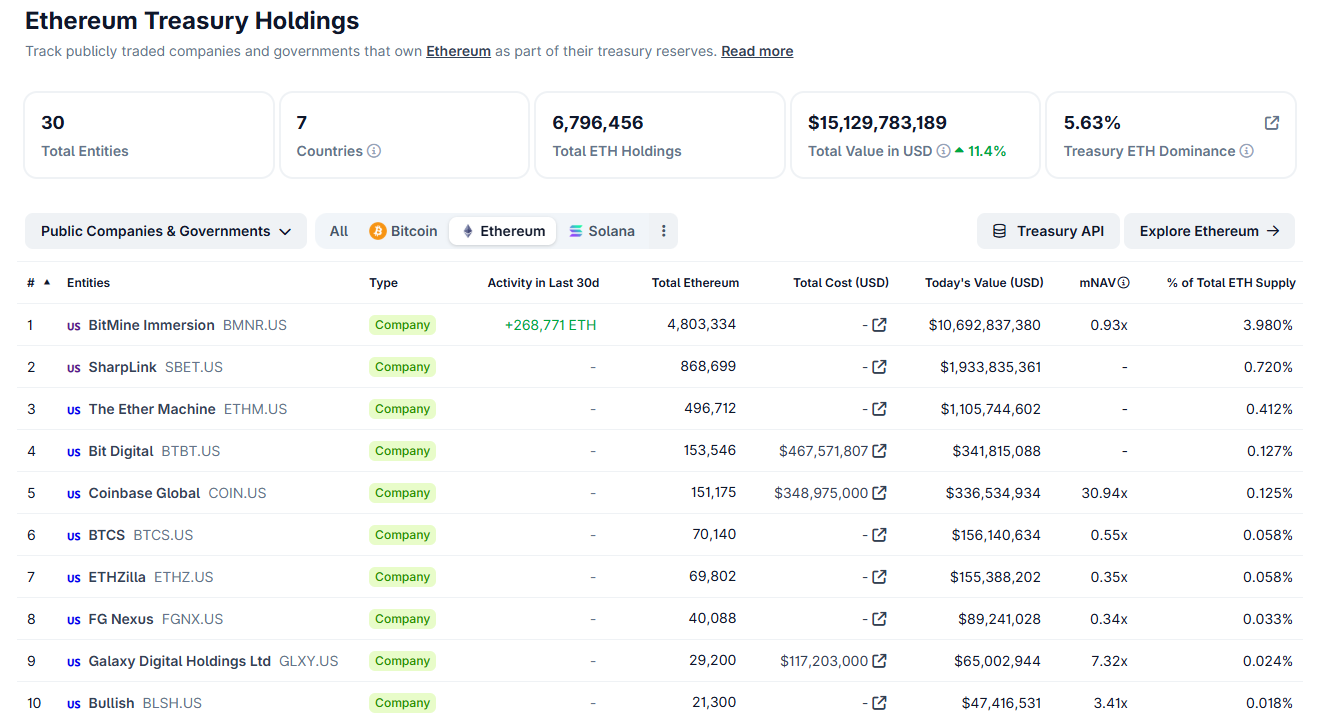
That position represents 3.98% of total ETH supply, putting the firm over 79% toward its stated “Alchemy of 5%” accumulation target.
Despite these figures, BMNR stock slid from a previous close of $21.52, dipping as low as $20.50 during the session before partially recovering.
The muted reaction signals that investors may have already priced in the uplisting news, which BitMine first disclosed on April 6.
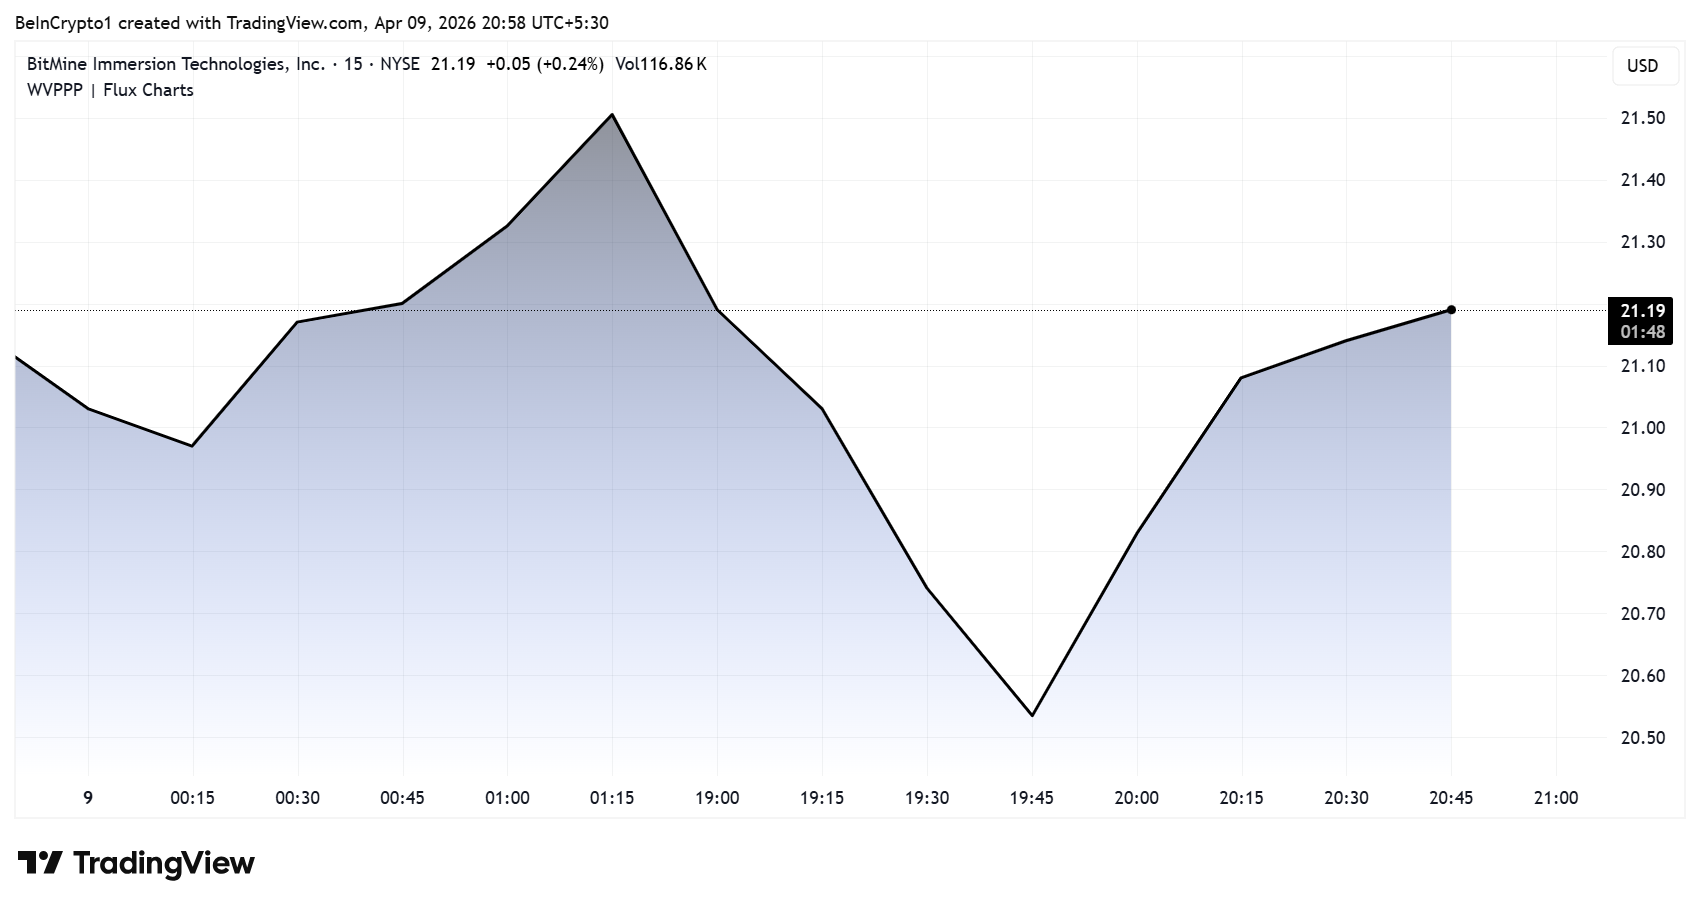
BitMine counts ARK Invest’s Cathie Wood, Founders Fund, Pantera Capital, and Galaxy Digital among its institutional backers.
The post Tom Lee’s BitMine Hosts Its Largest Corporate Event, Will Stock React? appeared first on BeInCrypto.


Securitize has appointed former U.S. Securities and Exchange Commission (SEC) official Brett Redfearn as president and a member of its board, adding regulatory experience as the firm prepares to go public this year.
Redfearn, who previously led the SEC’s Division of Trading and Markets, will work with Securitize’s leadership team to scale its offerings across issuance, trading and fund administration, the company announced in a press release. The company focuses on turning traditional financial assets, such as funds or private credit, into blockchain-based tokens that can be traded more easily.
His appointment comes at a time when tokenization is gaining traction among large financial firms. Banks and asset managers are testing ways to move assets onto blockchain rails in an effort to speed up settlement and widen access to investors.
Securitize is positioning itself as a regulated bridge between those institutions and digital asset infrastructure. The hire adds weight to Securitize’s leadership as it prepares for a proposed public listing through a business combination with Cantor Equity Partners II. It also reflects a broader trend of firms bringing in former regulators to navigate a complex policy environment.
“Brett has been instrumental in how modern markets are structured and regulated,” Securitize co-founder and CEO Carlos Domingo said in a statement. “He is deeply familiar with our business, leadership team, and long-term vision.”
Redfearn brings experience from both traditional finance and crypto. Before joining Securitize, he founded Panorama Financial Markets Advisory, advising exchanges and asset managers. He also served as head of capital markets at Coinbase (COIN), where he worked on expanding institutional participation in digital assets. Prior to joining the SEC, Redfearn was at JP Morgan for over a dozen years.

Jogja Financial Festival Hadir Lebih Seru! Ada Konser & Comedy Show!
Family of mum, 29, ‘assaulted on roadside’ share heartbreaking update
North East ship repairer UK Docks Marine Services lands new contract with Bangladesh Navy


-

 NewsBeat7 days ago
Steven Gerrard disagrees with Gary Neville over ‘shock’ Chelsea and Arsenal claim | Football
-

 Business7 days ago
No Jackpot Winner and $194 Million Prize Rolls Over
-

 Fashion6 days ago
Weekend Open Thread: Spanx – Corporette.com
-

 Business5 days ago
Expert Picks for Every Need
-

 Business4 days ago
Three Gulf funds agree to back Paramount’s $81 billion takeover of Warner, WSJ reports
-

 Sports5 days ago
India men’s 4x400m and mixed 4x100m relay teams register big progress | Other Sports News
-

 Tech2 days ago
How Long Can You Drive With Expired Registration? What Florida Law Says
-
Business4 days ago
No Jackpot Winner, Prize to Climb to $231 Million
-

 Fashion3 days ago
Massimo Dutti Offers Inspiration for Your Summer Mood Board
-
Politics6 days ago
Wings Over Scotland | The quality of mercy
-

 Fashion2 days ago
Let’s Discuss: DEI in 2026
-

 Business5 days ago
Akebia Therapeutics, Inc. (AKBA) Discusses Pipeline Progress and Strategic Focus on Kidney Disease Treatments at R&D Day – Slideshow
-

 Fashion7 days ago
Statement Sunglasses: The Accessory Shaping Modern Fashion
-

 Crypto World1 day ago
Bitcoin recovers as US and Iran Agree a Ceasefire Deal
-

 Politics7 days ago
East Jerusalem Palestinian families eviction orders
-

 Politics7 days ago
Why so many children are now classified as ‘disabled’
-

 Fashion7 days ago
For Love & Lemons’ Spring 2026 Line is for the Romantics
-

 Politics7 days ago
Nuclear rockets, moon bases and NASA’s Mars plan
-

 Tech7 days ago
The Threadless Ball Screw Never Took Off, But Don’t Write It Off
-
 Business6 days ago
HPS FY 2025 slides: SaaS inflection drives 22% revenue growth
You must be logged in to post a comment Login