
Crypto World
Zcash Price Warning: Another Major Crash Incoming?
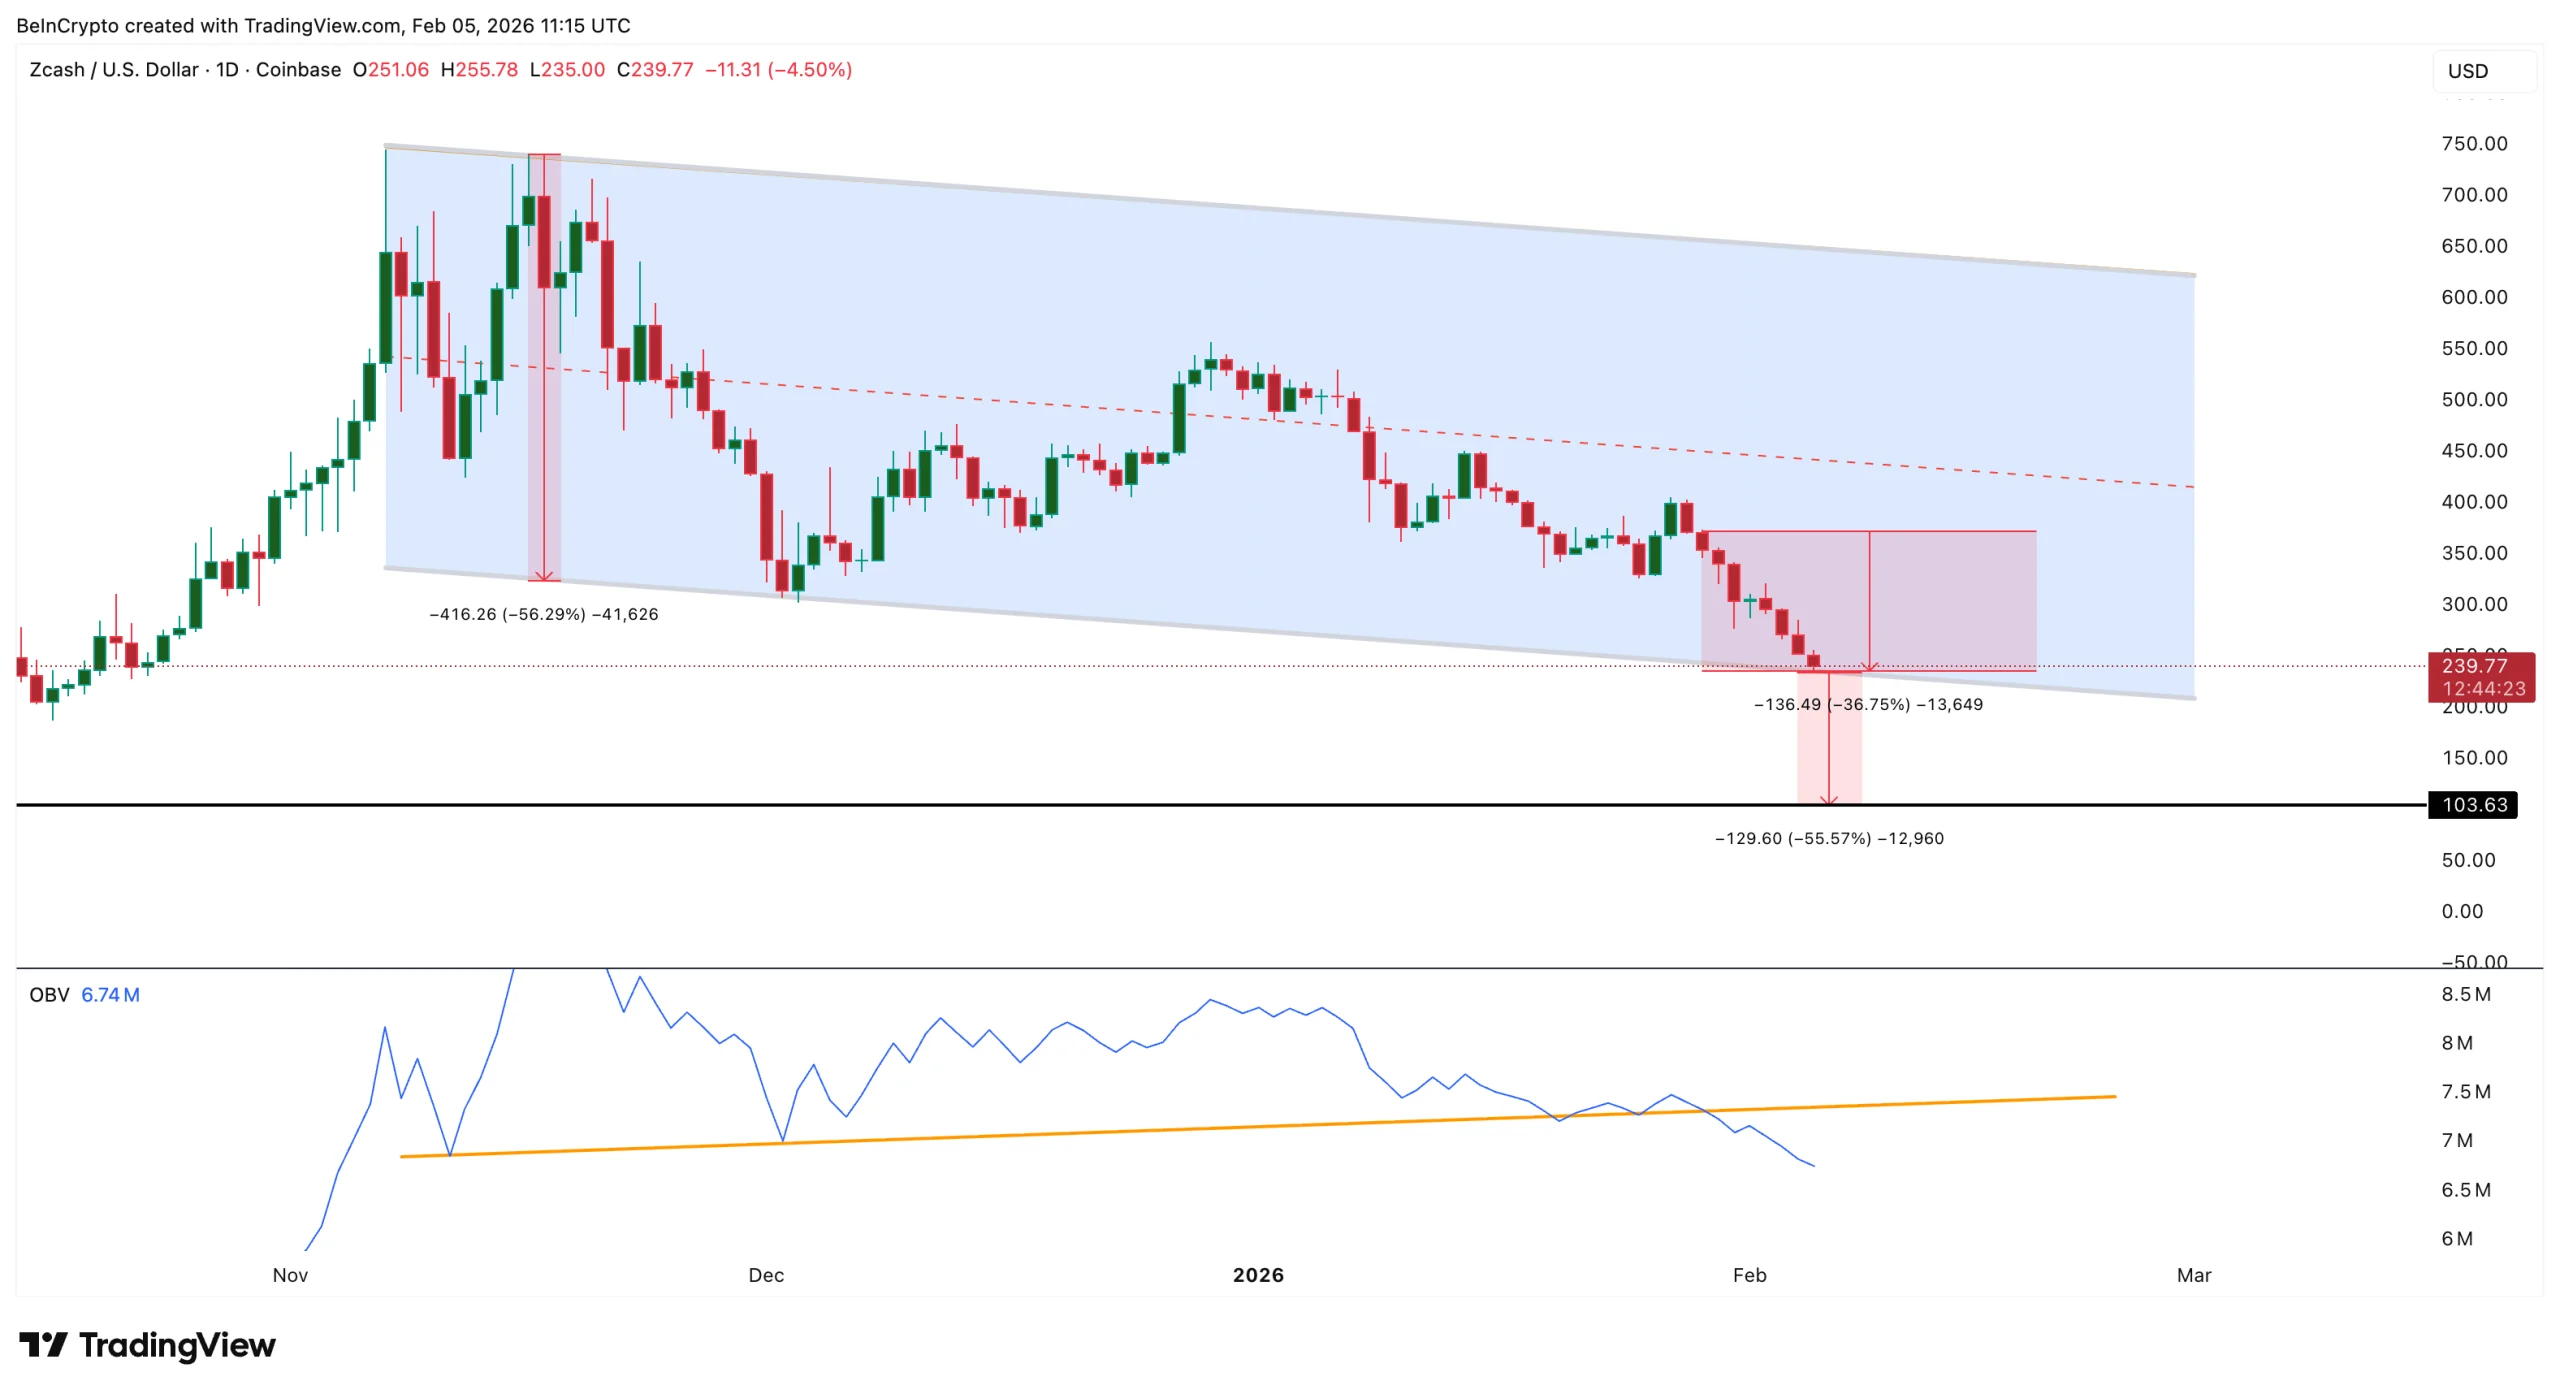
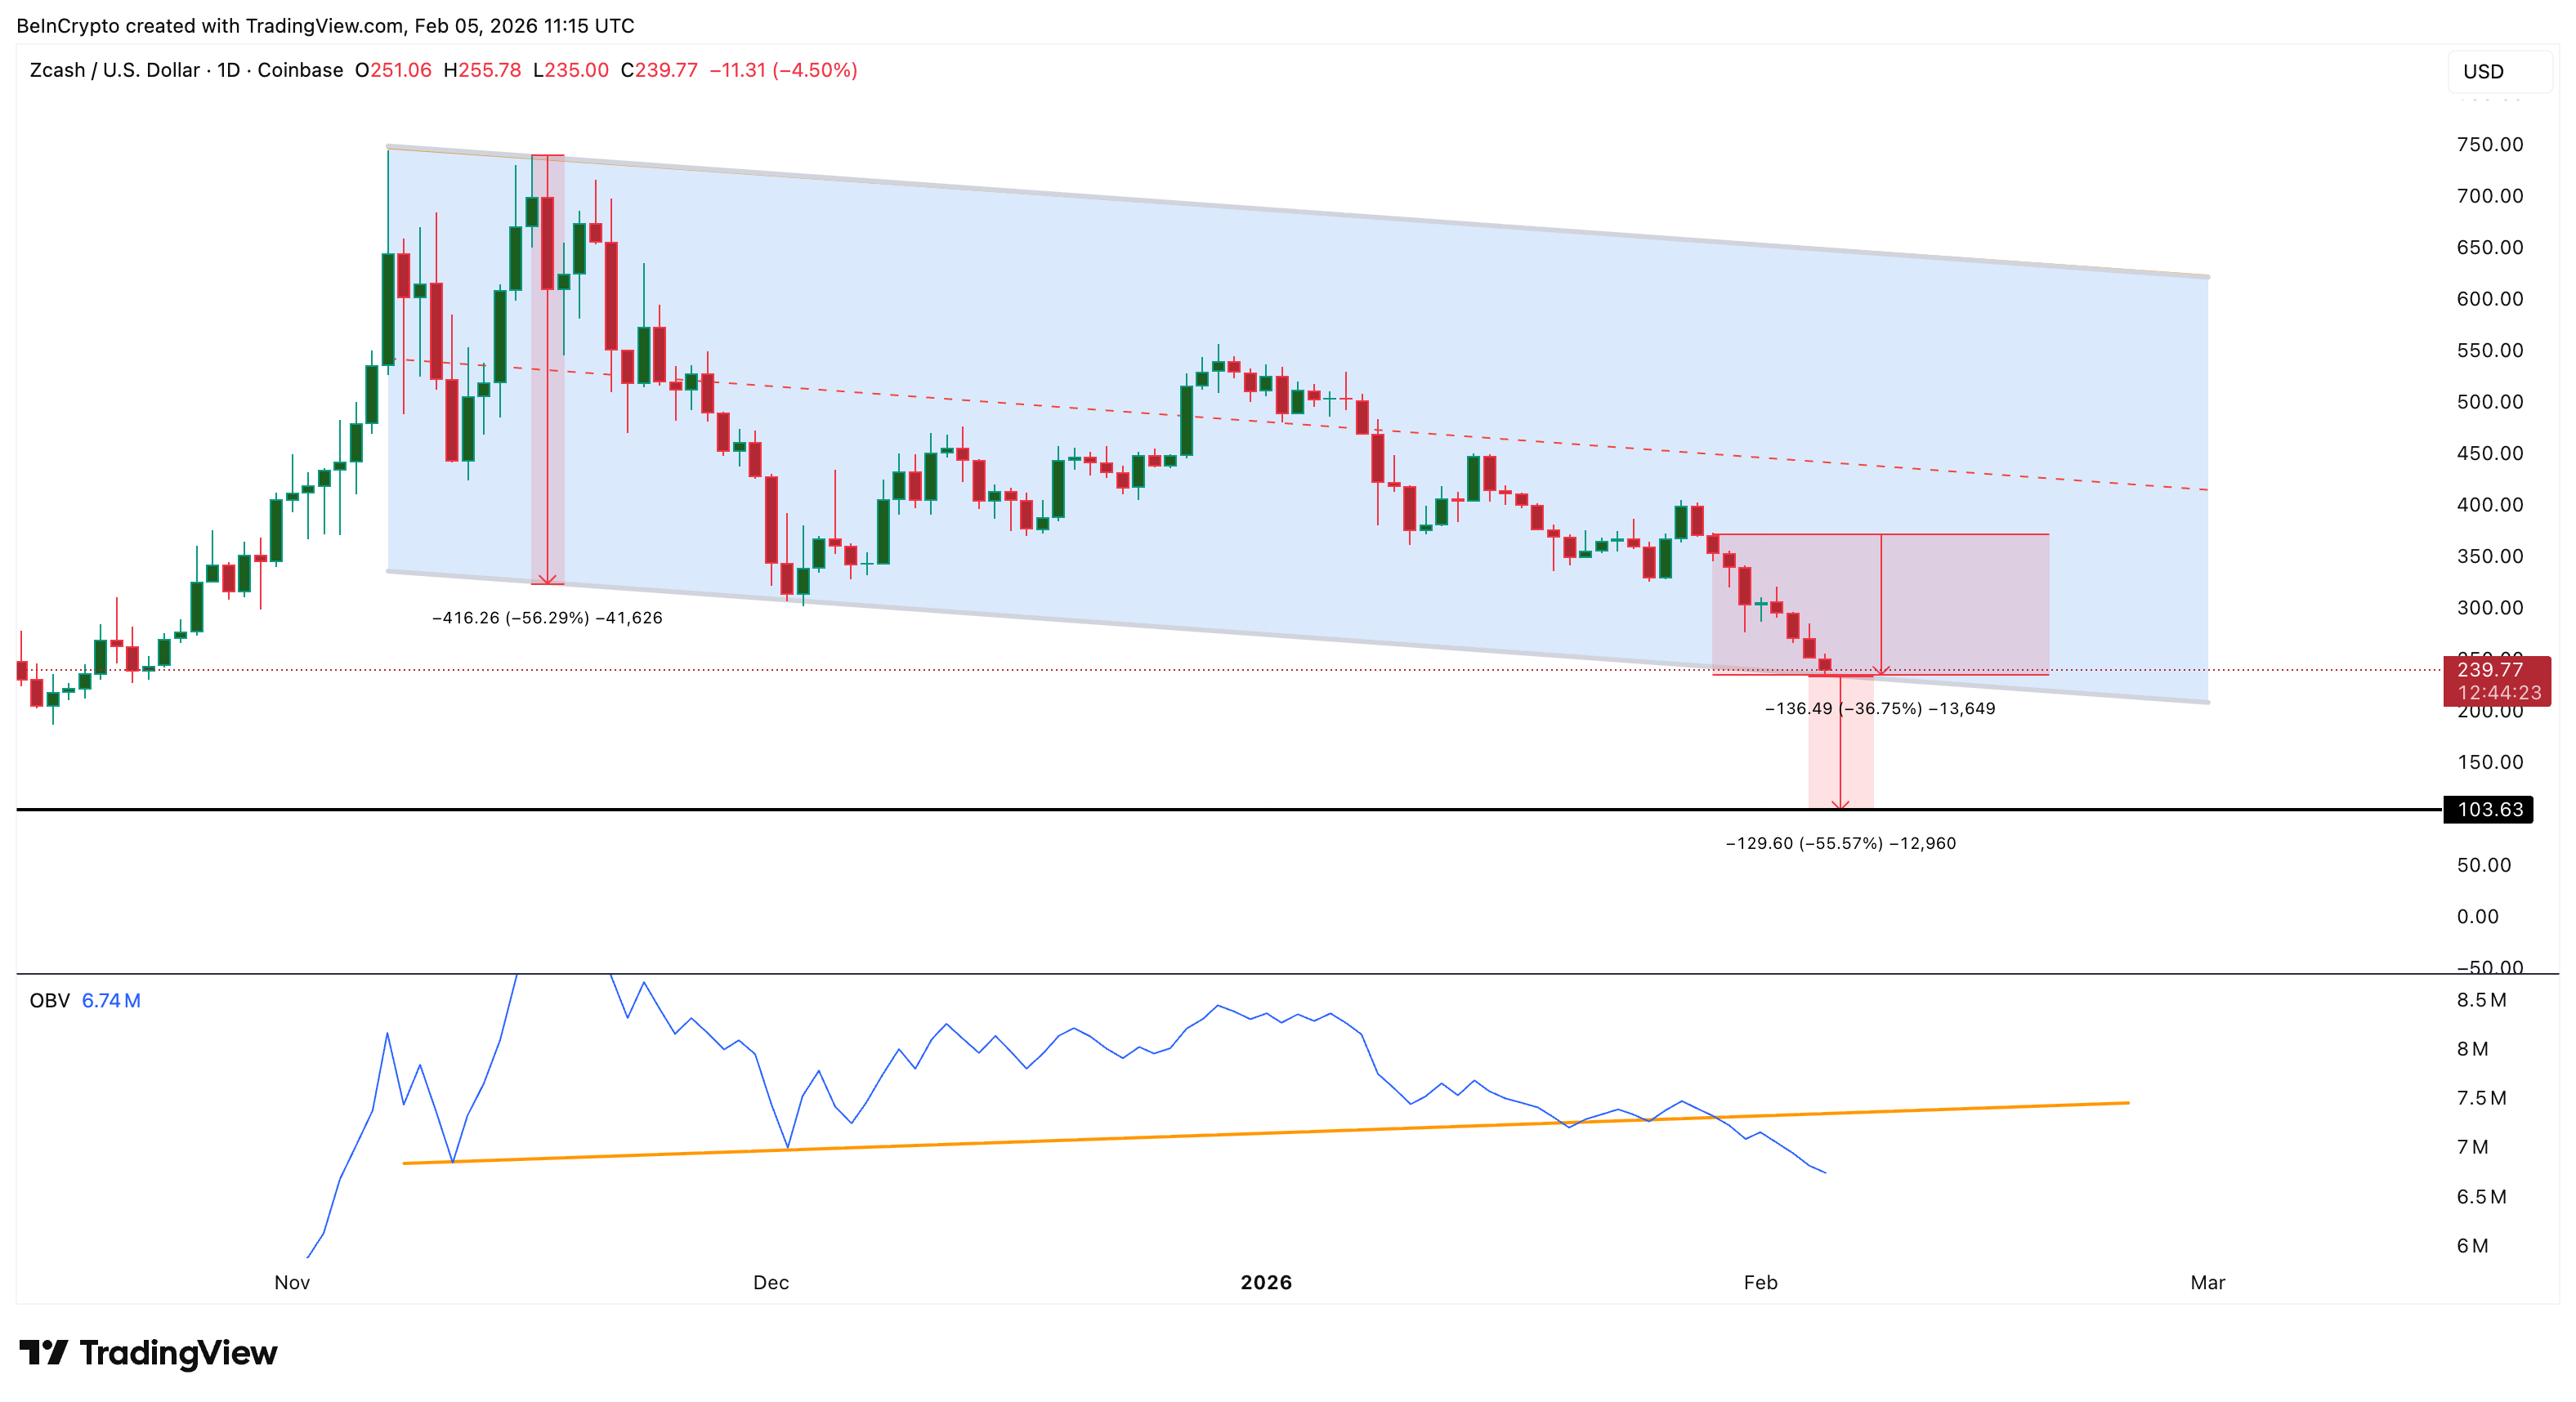
Zcash price remains under heavy pressure as bearish momentum continues to build across the market. After losing nearly 35% since late January, Zcash (ZEC) is now slipping deeper inside a falling channel that has guided prices lower for months.
Weak volume, fading whale interest, and shrinking derivatives activity are all reinforcing the downside trend. With multiple indicators flashing warning signs, charts now suggest that Zcash may be entering another breakdown phase.
Falling Channel and OBV Breakdown Show Sustained Selling Pressure
Zcash has been trading inside a clear falling channel since November, marked by consistent lower highs and lower lows.
Sponsored
Sponsored
After peaking above $740, ZEC entered this declining range and has already experienced one major collapse of more than 56% inside the channel, also the breakdown target. Each rebound has become weaker, showing that buyers are unable to shift momentum.
The weakening structure is confirmed by On-Balance Volume (OBV) tracks buying and selling pressure by adding volume on up days and subtracting it on down days. Rising OBV suggests accumulation, while falling OBV signals distribution.
From early November through late January, Zcash’s OBV was forming an ascending trendline. This showed that some Zcash buyers were still trying to accumulate, even as the price traded inside a falling channel.
Want more token insights like this? Sign up for Editor Harsh Notariya’s Daily Crypto Newsletter here.
That support finally failed on January 29. Since this breakdown, Zcash has already fallen nearly 36%. This validates the OBV signal and shows that the loss of volume support directly translated into lower prices.
On-chain behavior reinforces this trend. Over the past seven days, whale holdings have declined by around 36%, with large wallet counts falling toward the 8,000 range. This suggests that major holders are trimming exposure rather than accumulating.
Sponsored
Sponsored
At the same time, exchange balances have surged by nearly 160%. Rising exchange supply usually means more tokens are being prepared for sale, increasing immediate selling pressure.
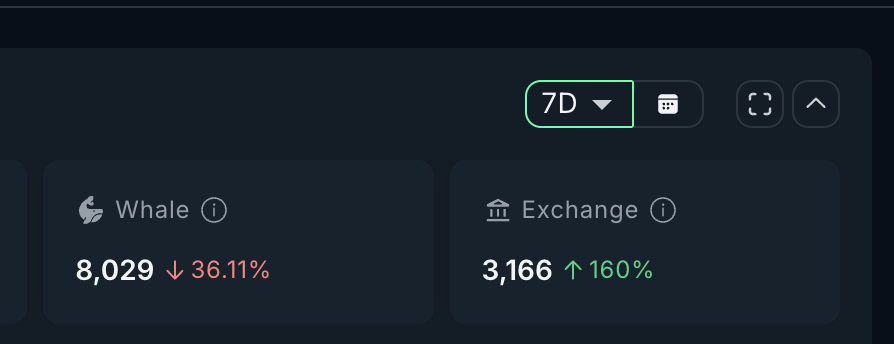
Together, the falling channel, OBV breakdown, whale reduction, and exchange inflows point to sustained distribution. Retail participation is weakening, long-term holders are reducing exposure, and supply is moving toward selling venues. This combination explains why ZEC continues to struggle to hold support.
Derivatives Activity Weakens as Remaining Long Positions Add Risk
With spot participation fading, the next question is whether derivatives can push prices up, as they have during past short squeezes.
So far, the data suggests limited support.
Zcash open interest peaked near $1.13 billion in December. It has now dropped to around $395 million, a decline of nearly 65%. This shows that speculative interest has cooled sharply, with many traders closing positions and moving to the sidelines.
Sponsored
Sponsored
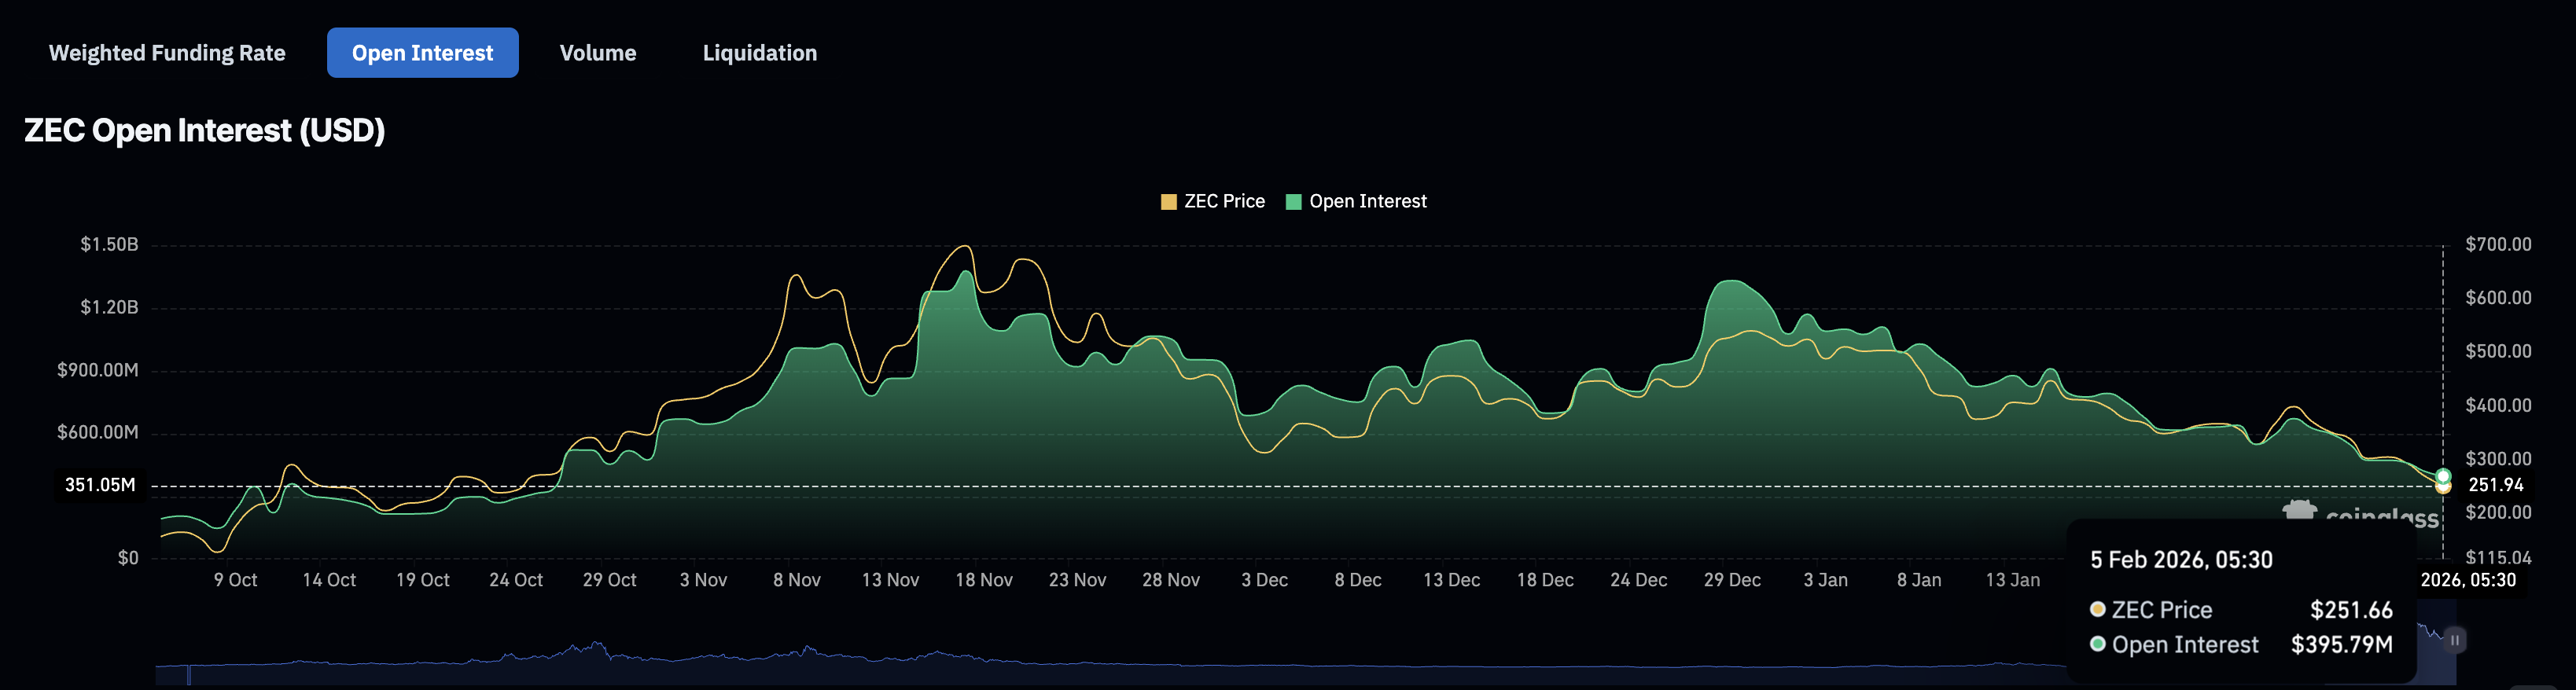
When open interest falls this much, it signals reduced conviction. There is less leverage in the system to drive strong rebounds, and fewer traders willing to defend key levels.
At the same time, funding rates have cooled since October but remain slightly positive. Positive funding means that long positions still dominate, even though overall participation is shrinking. In simple terms, fewer traders are active, but many of those who remain are still betting on higher prices.
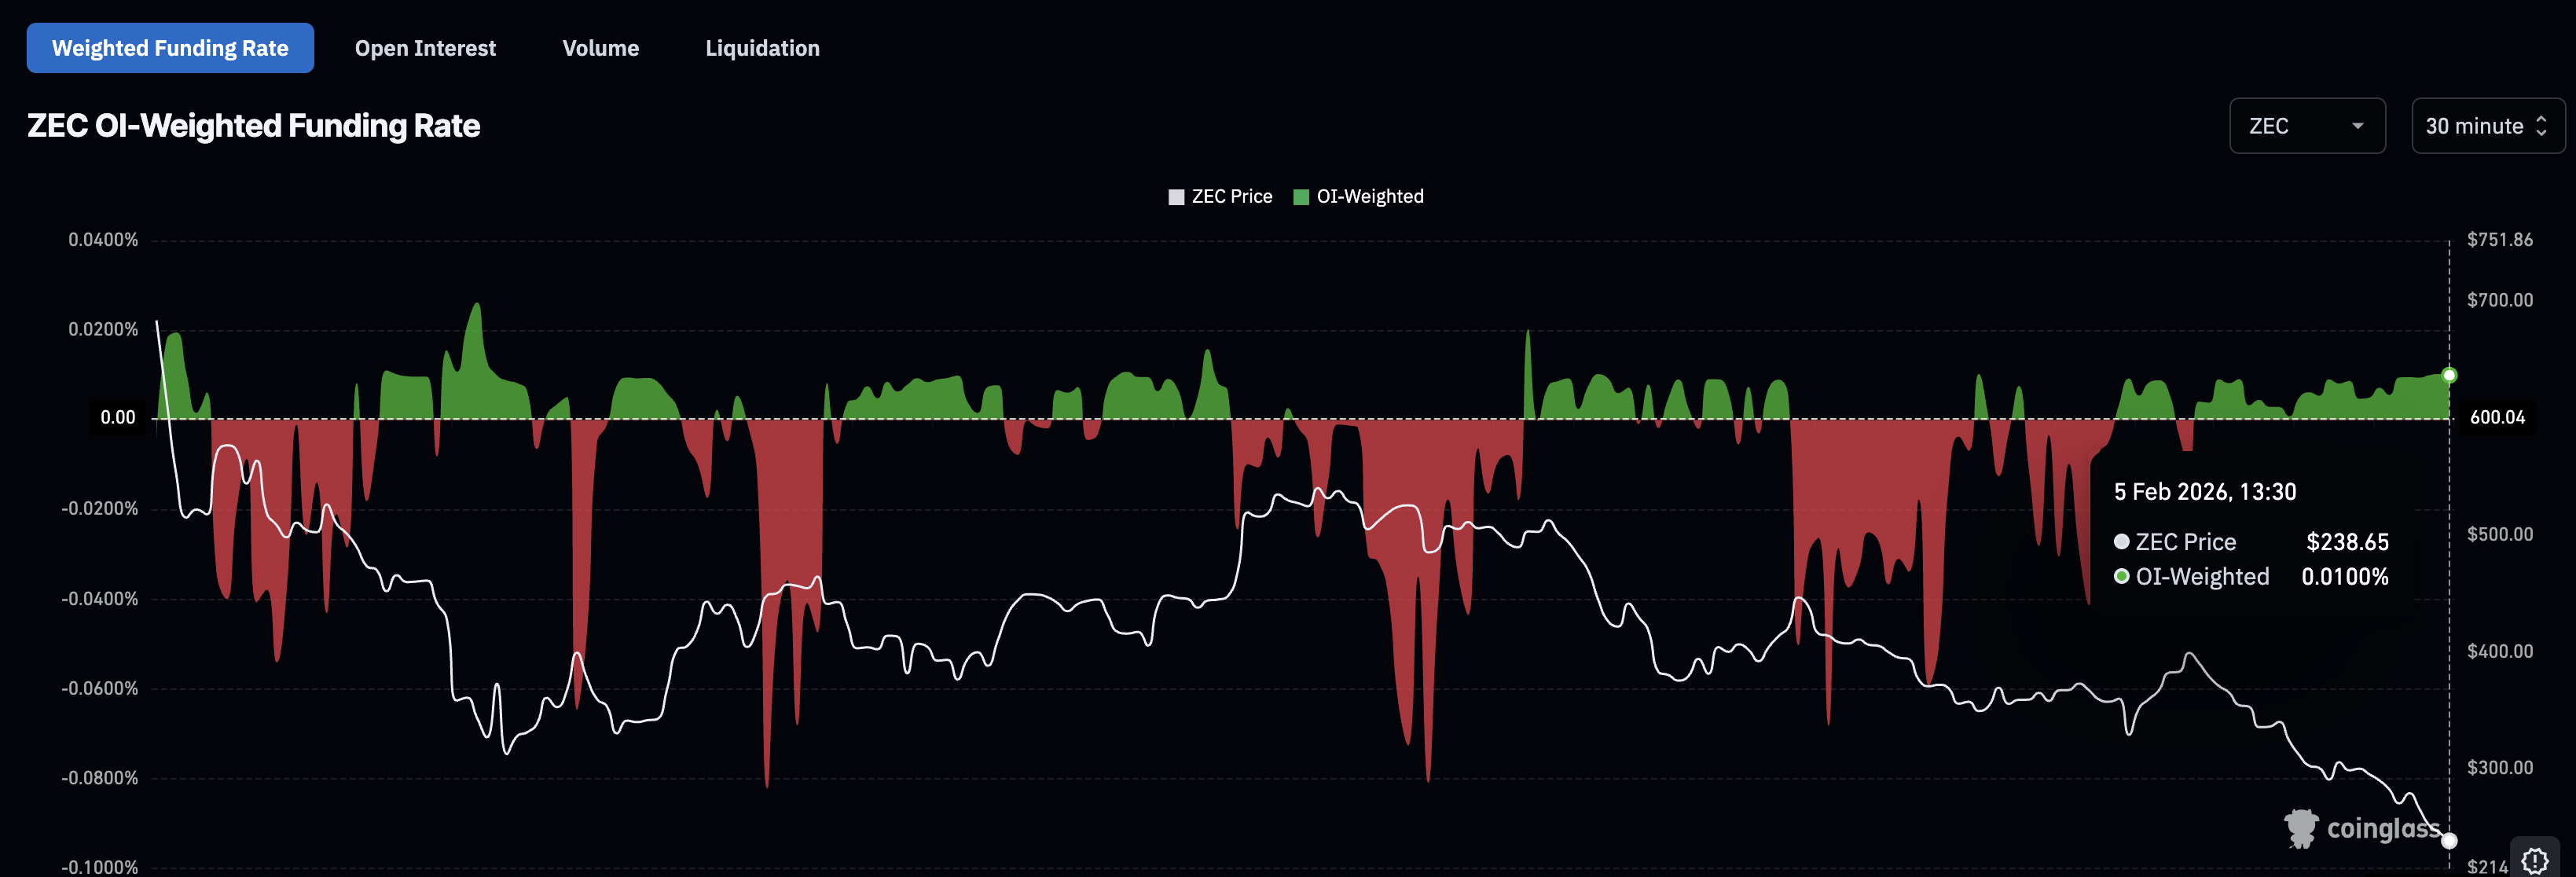
This creates a fragile setup. If prices fall further, these remaining longs become vulnerable to liquidation. When liquidations occur in low-liquidity conditions, they can trigger rapid downside moves.
So even though derivatives no longer have enough “fuel” to drive a major rally, the presence of exposed long positions still amplifies breakdown risk. Instead of supporting price, leverage now increases the chance of accelerated selling.
Sponsored
Sponsored
Key Zcash Price Levels Show Why the $100 Zone Remains in Focus
The Zcash price remains trapped inside its falling channel, with the lower trendline continuing to guide the price lower. The first major support zone sits at $230.
A sustained daily close below $230 would expose the next support near $212, but not without triggering a trendline breakdown.
If $212 fails, the channel projection and Fibonacci extensions both point toward the $103 region. This zone represents the full downside move implied by the current structure.
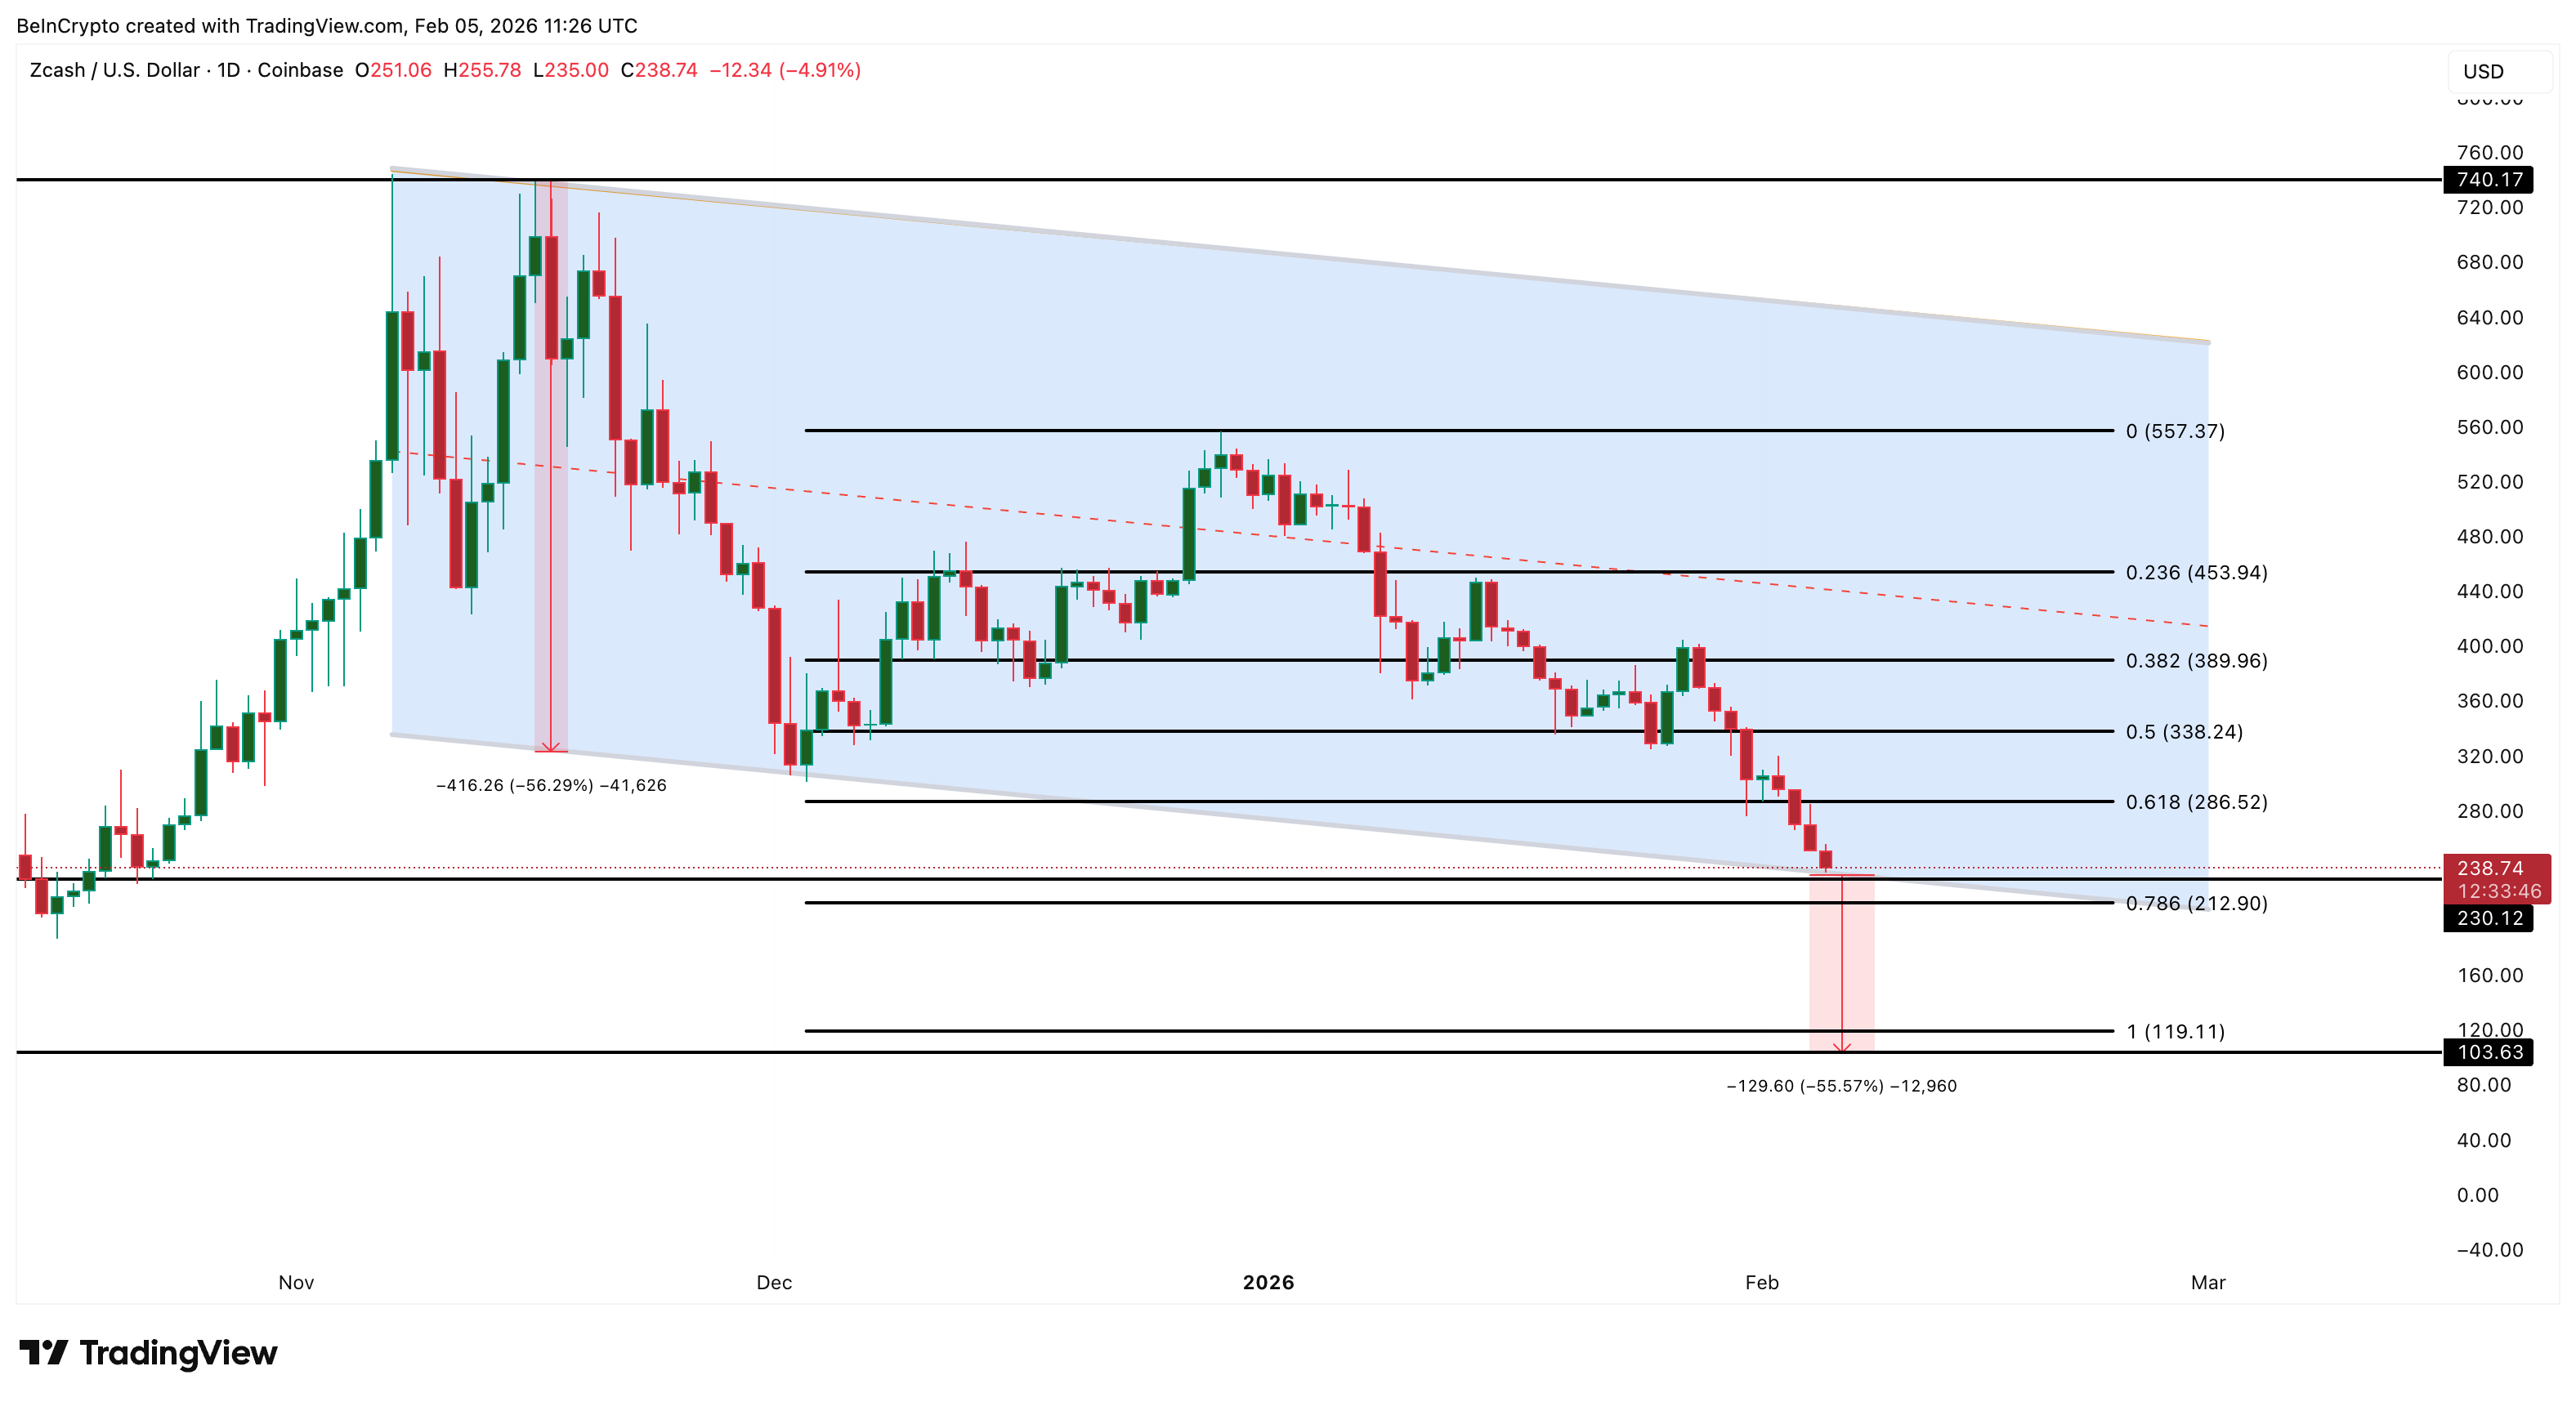
On the upside, recovery remains difficult. ZEC must first reclaim $286 to regain short-term stability. A move above $389 is needed to improve the medium-term structure. A rally toward $557 would require a major revival in volume, whale accumulation, and derivatives participation, making it unlikely under current conditions.
As long as Zcash remains below $230 and fails to hold $212, downside risks dominate. Without renewed participation and capital inflows, the charts continue to favor a move toward the $100 zone.

Total value locked on decentralized lending protocol Aave dropped by nearly $8 billion over the weekend after hackers behind the $293 million Kelp DAO exploit borrowed funds on Aave, leaving roughly $195 million in “bad debt” on the protocol and triggering withdrawals.
Data from DeFiLlama shows that Aave’s TVL fell from about $26.4 billion to $18.6 billion by Sunday, losing the top spot as the largest DeFi protocol.
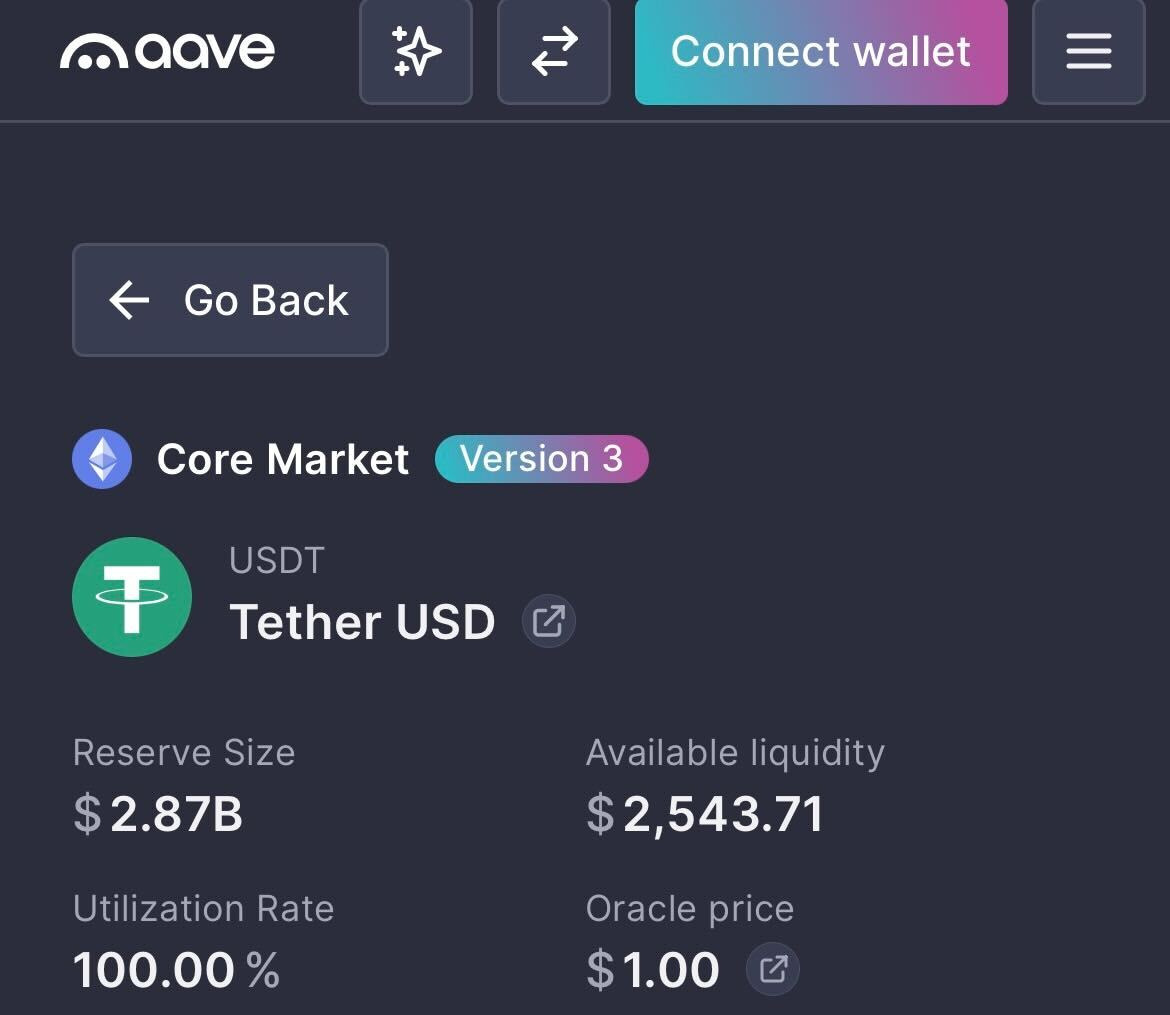
Aave v3’s lending pools for USDt (USDT) and USDC (USDC) are now at 100% utilization, meaning that more than $5.1 billion worth of stablecoins cannot be withdrawn until new liquidity arrives or borrows are repaid.

Aave’s TVL fall shows how rapidly risk from a single security incident can spread throughout the broader, interconnected DeFi lending market, potentially leading to a severe liquidity crisis.
The incident began on Saturday when hackers stole 116,500 Kelp DAO Restaked ETH (rsETH) tokens worth about $293 million from Kelp DAO’s LayerZero-powered bridge and used them as collateral on Aave v3 to borrow wrapped Ether (wETH).
Crypto analytics platform Lookonchain said the move created about $195 million in “bad debt” on Aave, which contributed to the Aave (AAVE) token tanking nearly 20% from $112 on Saturday at 6:00 pm UTC to $89.5 about 25 hours later.
Lookonchain noted that some of the largest crypto whales to withdraw funds from Aave were the MEXC crypto exchange and Abraxas Capital at $431 million and $392 million, respectively.

Several crypto networks and protocols tied to rsETH or the LayerZero bridge have paused use of the bridge until the problem is resolved, including DeFi platform Curve Finance, stablecoin issuer Ethena and BitGo’s Wrapped Bitcoin (WBTC).
Aave has frozen several rsETH, wETH markets
Shortly after the Kelp DAO exploit, Aave said it froze the rsETH markets on both Aave v3 and v4 to prevent any suspicious borrowing and later stated that rsETH on Ethereum mainnet remains fully backed by underlying assets.
WETH reserves also remain frozen on Ethereum, Arbitrum, Base, Mantle and Linea, Aave said.
This incident marks the first significant stress test of Aave’s “Umbrella” security model, which was introduced in June 2025 to provide automated protection against protocol bad debt while enabling users to earn rewards.
Related: Aave DAO backs V4 mainnet plan in near-unanimous vote
Earlier this month, the Bank of Canada found that Aave avoided bad debt in its v3 market by using overcollateralization, automated liquidations and other strategies that shifted risk to borrowers.
In comments to Cointelegraph, Aave defended its liquidation-based model, framing it as a core safety mechanism that protects lenders while limiting downside for borrowers.
It comes as Aave parted ways with its longest-standing DeFi risk service provider, Chaos Labs, on April 6, following disagreements over the direction of Aave v4 and budget constraints.
Magazine: Are DeFi devs liable for the illegal activity of others on their platforms?


A breach at web infrastructure provider Vercel is forcing crypto teams to rotate API keys and do a deep inspection of their underlying code.
In a bulletin, Vercel said the hacker was able to grab behind-the-scenes settings that weren’t locked down, potentially exposing API keys — the digital credentials apps use to connect to other services. Those credentials act like digital passwords, allowing software to connect to databases, crypto wallets, and external services. In the wrong hands, they can be used to impersonate an app, burn through usage limits, or manipulate how it runs.
A post on cybercrime forum BreachForums claimed to be selling Vercel data for $2 million, including access keys and source code, though those claims have not been independently verified. Vercel said it has engaged incident response firms and law enforcement and is continuing to investigate whether any data was exfiltrated.
The company traced the intrusion to Context.ai, a third-party AI tool used by an employee, its CEO said in an X post, where a compromised Google Workspace connection allowed attackers to escalate access into Vercel’s internal environments. Vercel said environment variables marked as “sensitive” are stored in a way that prevents them from being read, and that there is no evidence that they were accessed.
The incident is drawing scrutiny because Vercel underpins frontend infrastructure for many crypto applications and is the primary steward of Next.js, one of the most widely used web development frameworks. Many Web3 teams host wallet interfaces and decentralized app dashboards on Vercel, relying on environment variables to store credentials that connect their frontends to blockchain data providers and backend services.
Solana-based decentralized exchange Orca said its frontend is hosted on Vercel and that it has rotated all deployment credentials as a precaution. The project added that its on-chain protocol and user funds were not affected.
Crypto World
BeInCrypto 100 Institutional Awards Nomination: BitGo for Best Stablecoin Infrastructure Leader


Stablecoins have moved into core financial infrastructure. Monthly on-chain volume now exceeds $2 trillion. Payment networks like Visa, Mastercard, and Stripe have all expanded into the space.
However, the infrastructure behind them is almost invisible. This includes custody, minting, settlement, and compliance systems. That is where BitGo operates.
The company is now nominated for Best Stablecoin Infrastructure Leader at the BeInCrypto Institutional 100 Awards 2026.
Growing Institutional Footprint
The nomination centers on BitGo Mint, launched April 2, 2026. The platform allows institutions to mint, redeem, and manage stablecoins directly within BitGo’s custody environment.
BitGo’s move comes after a series of structural milestones. In December 2025, the Office of the Comptroller of the Currency approved its conversion to a federally chartered national trust bank.
One month later, BitGo listed on the New York Stock Exchange under the ticker BTGO.
That sequence placed BitGo in a unique position where it operates stablecoin infrastructure inside a federally regulated banking framework.
Founded
Assets on Platform
Clients
Ticker
Insurance
Federal Charter
2013
$81.6 billion
5,322
NYSE: BTGO
$250 million
OCC
Assets and client data are based on BitGo’s SEC filings as of December 31, 2025. Insurance and charter details follow the OCC approval in December 2025.
BitGo Mint launched with support for two stablecoins. These include USD1, developed by World Liberty Financial, and SoFiUSD, issued by SoFi Bank. Both run on BitGo’s Stablecoin-as-a-Service infrastructure.
This system handles custody, reserve management, and minting mechanics. It also provides compliance frameworks required for institutional issuance. USD1 is backed by short-term US Treasuries and cash equivalents, with reserves held under qualified custody.
Building a Regulated Stablecoin Backbone
Scale is a central part of the nomination. According to its March 2026 10-K filing, BitGo reports $81.6 billion in assets on platform.
Institutional clients reached 5,322, up 103.5% year over year. The platform also serves 1.2 million users and holds $15.6 billion in staked assets.
The company operates under a national trust bank charter. This allows it to provide custody and related services across all 50 US states without separate licenses. Assets held in custody are insured for up to $250 million.
Analysts have described BitGo as a “military-grade custodian.” The comment reflects its long-standing focus on institutional security infrastructure.
The stablecoin push extends beyond BitGo Mint. In March 2026, the firm partnered with Stable Sea to support B2B stablecoin payments and on-chain treasury services. These products run through its Crypto-as-a-Service stack.
As a result, BitGo now offers a unified system. Custody, wallets, staking, trading, financing, and stablecoin infrastructure operate within a single regulated entity.
This is the core of the nomination. BitGo has combined federal banking oversight with stablecoin issuance and custody in one platform. Most providers still separate these functions across different systems.
The model is already live. Institutions can mint, hold, and distribute stablecoins within a regulated custody workflow.
That changes how stablecoins move between issuers, markets, and counterparties.
The BeInCrypto Institutional 100 Awards aim to identify infrastructure providers shaping the next phase of digital finance. BitGo’s nomination reflects its role in building the backend systems that support institutional stablecoin adoption.
The post BeInCrypto 100 Institutional Awards Nomination: BitGo for Best Stablecoin Infrastructure Leader appeared first on BeInCrypto.

TLDR:
- Bitcoin Open Interest fell from $27B to $24B, reflecting broad long position closures across the derivatives market.
- Funding rates stayed slightly positive, confirming shorts are not leading BTC’s current price correction phase.
- One-hour heatmap data showed no major liquidity zones, pointing to capital outflows rather than liquidity hunting moves.
- Analyst Carmelo Alemán noted BTC’s price decline is a consequence of prior structural weakness, not a fresh bearish trigger.
Bitcoin Open Interest has declined sharply, drawing attention to the market’s weak structural foundation. On-chain analyst Carmelo Alemán noted that BTC’s recent price pullback aligns with a notable drop in derivatives exposure.
Open Interest fell from roughly $27 billion to $24 billion. This pattern reflects long position closures and progressive deleveraging rather than aggressive selling. The data confirms that the earlier rally lacked real spot demand and was largely built on leveraged positions.
BTC Price Decline Tied to Derivatives Deleveraging
Bitcoin’s recent correction is directly connected to a derivatives-heavy market structure. Alemán had previously raised concerns that the bullish move lacked structural consistency.
The rally was fueled by futures activity rather than genuine demand in the spot market. Recent market behavior has since confirmed that earlier assessment clearly.
Open Interest dropping from $27 billion to $24 billion captures the full scope of the unwind. Long positions have been closing at a steady pace, pulling down overall derivatives exposure.
This process does not point to aggressive bearish pressure from short sellers. Instead, it reflects a gradual, market-wide effort to reduce leveraged exposure.
Heatmap analysis on the one-hour timeframe adds further context to the price movement. Based on TradingDifferent visual data, no major contiguous liquidity zones were identified in the area.
This rules out liquidity hunting or stop-loss sweeps as the primary driver behind the move. The price action therefore reflects capital outflows rather than directional pressure from either side.
Alemán, a verified contributor on CryptoQuant, noted that this outcome was foreseeable. A move built on derivatives tends to lose consistency once leverage begins coming off.
The price decline is not the root of the problem but a consequence of earlier fragility. The weak structural base was already present before the correction started materializing.
Positive Funding Rates Signal Risk Reduction, Not Bearish Control
Funding rates have remained slightly positive even as Bitcoin’s price continues to pull back. This is an important data point when assessing who is leading the current market move.
Positive funding rates show that long traders are still paying short traders a small periodic fee. Shorts are not the dominant force pushing prices lower at this stage.
Alemán noted that the market is not attacking the downside. Rather, participants are collectively choosing to reduce their derivatives exposure in an orderly way.
There is no evidence of coordinated short-side aggression driving the current phase. The correction aligns more with disciplined deleveraging than with a fresh bearish trend forming.
The one-hour heatmap data also supports this more neutral reading of market structure. Without major liquidity clusters nearby, price tends to drift lower in a measured, methodical manner.
The sharp, reactive moves typical of liquidity-driven markets are largely absent here. This reinforces the view that capital outflows, not targeted selling, are steering the current phase.
Bitcoin Open Interest contraction is clearing the excess leverage that accumulated during the earlier rally. Once this process runs its course, the market may find a more stable structural base.
Alemán’s analysis ties the current correction directly to the previously identified weakness in market structure. The price decline reflects the consequence of that fragility rather than a fresh bearish catalyst.

Crypto World
Aave Faces Crisis: rsETH Exploit Drains $250M as TVL Plunges $7B and AAVE Token Falls 15%
TLDR:
- An rsETH collateral exploit on Aave allowed an attacker to extract approximately $250 million from the protocol
- Aave’s total value locked dropped by roughly $7 billion in a single day following the exploit and mass withdrawals
- Exchange inflows for AAVE surged to over 355,000 tokens, totaling around $32 million across all platforms
- The AAVE token dropped nearly 15% as panic selling intensified amid contributor exits and collateral risk concerns
Aave is facing mounting pressure following a series of internal and external setbacks. The decentralized lending protocol recently suffered an exploit tied to rsETH, a collateral asset accepted within its ecosystem.
The attack allowed a malicious actor to extract approximately $250 million. This event compounded existing challenges, including the departure of key contributors BGD Labs and Chaos Labs.
As a result, the protocol experienced a sharp drop in total value locked and investor confidence.
rsETH Exploit Exposes Collateral Risks on Aave
The exploit did not originate from a flaw within Aave’s core protocol. Instead, the issue was rooted in rsETH, an asset accepted as collateral on the platform.
When a collateral asset deteriorates, it can trigger cascading effects across the lending system. These effects often result in bad debt accumulating within the protocol.
Crypto analyst Darkfost noted on X that cascading risk is inherent to collateral-based lending systems. The decision to accept rsETH ultimately opened the door to this vulnerability.
Once the exploit occurred, panic spread quickly through the community. Users began pulling their funds from the protocol at a rapid pace.
The wave of withdrawals caused the platform’s total value locked to fall by approximately $7 billion. This contraction took place over the course of a single day.
Many participants chose to exit their positions rather than absorb the uncertainty. The reaction was swift and spread broadly across the ecosystem.
The timing also worsened the situation considerably. BGD Labs and Chaos Labs had already left their contributor roles before this event.
Their exits weakened the protocol’s risk management and development capacity. The exploit therefore arrived at a particularly vulnerable moment for the protocol.
AAVE Token Selloff and Exchange Inflows Surge Amid Crisis
The AAVE token fell by approximately 15% on the day the exploit became public. This correction reflected the combined weight of the attack and the loss of community trust.
Investors moved quickly, reducing their exposure to the token as uncertainty grew. The drop was among the sharpest the token had recorded in recent months.
Exchange inflows for the token surged sharply during this period. The monthly average for token inflows into exchanges sits at around 31,000.
During the crisis, more than 236,000 AAVE flowed into exchanges in a short window. That volume represented roughly $21 million at current prices.
According to Darkfost, cumulative inflows across all exchanges exceeded 355,000 AAVE in total. This translates to approximately $32 million worth of the token.
Binance absorbed the largest share of these inflows due to its deep liquidity. The concentration on Binance reflected organized and rapid selling activity.
Together, these numbers point to a broad loss of confidence in the protocol. The platform has lost key contributors and now faces questions about its collateral risk framework.
Exchange inflows and token price declines both show sustained selling pressure. Market participants are watching closely as the situation continues to develop.


Bitcoin changed hands near $73,996 during Monday’s Asian trading session, down 2.5% over the past 24 hours. The decline tracked a weekend escalation in the Gulf, where US forces boarded an Iranian vessel Sunday.
Risk assets broadly weakened as Wednesday’s ceasefire deadline loomed, with fresh military friction eroding hopes for de-escalation.
Ship Seizure Raises War Escalation Fears
The US destroyer USS Spruance disabled the engine room of the Iranian-flagged cargo ship Touska after six hours of unheeded stop orders. Tehran’s joint military command labeled the boarding unlawful and pledged a direct response against US naval assets. Sunday’s capture was the first since Washington began enforcing its port blockade one week ago.
Crude futures jumped on the incident, as traders priced in a longer chokehold on Gulf shipping lanes. About one-fifth of the world’s seaborne oil normally transits the strait, which has been mostly idle. Iran’s Supreme National Security Council stated that traffic controls would stay in place until hostilities conclude.
A US team led by Vice President JD Vance is due in Islamabad on Monday for renewed negotiations. Special envoys Steve Witkoff and Jared Kushner will reportedly return for round two after last weekend’s marathon session. Tehran’s state broadcasters cast doubt on whether Monday’s sit-down would proceed, citing fresh grievances with Washington.
The US president also warned of strikes on Iran’s entire power grid and bridge network if terms are refused. Despite Sunday’s slide, Bitcoin remains 4.3% higher over the past seven days, keeping the weekly uptrend intact.
Traders Eye Wednesday Truce Expiry
Daily action swung between $73,886 and $76,165, with the sharpest pressure arriving early Monday in Asia. Total market value held around $1.48 trillion while turnover hovered near $62 billion during the same window.
Market focus shifts to Wednesday’s truce deadline, a pivot point that could sharpen the tone across risk assets. If diplomacy stalls, additional US operations appear likely, potentially extending the pressure on digital assets and equities.
The post Bitcoin Slips Below $74K as US Navy Strikes on Iranian Ship appeared first on BeInCrypto.
TLDR:
- ETH moved between $2,200 and $2,500 as liquidation zones triggered sharp price reversals
- Heavy leverage clusters near $2,200 and $2,480 continue shaping short-term ETH volatility patterns
- The failed breakout near $2,450 led to renewed downside pressure toward lower liquidity support zones
- Despite price weakness, Ethereum recorded over 200M transactions, showing strong network activity
Ethereum traded within a volatile range as liquidity clusters shaped short-term price action. Recent data showed weakening momentum after a failed breakout, while on-chain activity reached record levels despite a challenging first-quarter performance.
Liquidation Clusters Drive Short-Term Price Movement
Ethereum’s recent structure reflects a liquidity-driven market rather than a sustained directional trend. Price initially climbed from the $2,200 zone toward $2,380 before entering a tight consolidation phase.
A brief breakout near $2,450 followed, but momentum faded quickly, leading to a controlled decline toward the $2,300 range.
A market update shared by Ted Pillows pointed to heavy liquidation clusters influencing price behavior. The tweet noted that Ethereum appeared weak, with long liquidation zones concentrated near $2,200.
It also identified short-side liquidity between $2,450 and $2,480 as a potential final upward move before rejection.
The heatmap data showed bright zones where leveraged positions were concentrated. These levels often attract price movements as the market seeks to trigger liquidations.
Strong resistance formed between $2,480 and $2,520, where the price faced immediate rejection. Meanwhile, support zones between $2,280 and $2,320 acted as a near-term magnet.
As the price moved lower, long positions began to unwind. This shift aligned with the broader pattern of liquidity sweeps between key levels.
The range between $2,300 and $2,450 remained active, with repeated moves targeting both sides of the market.
Strong Network Activity Contrasts Price Weakness
While price action remained under pressure, Ethereum’s network activity expanded sharply. The network recorded over 200 million transactions during the first quarter of 2026.
This marked one of the highest usage periods despite the asset’s 32 percent decline during the same timeframe.
At the same time, ecosystem developments continued to build. Ethereum Name Service integrated with PayPal, enabling users to send funds using simplified name-based addresses. This update aimed to improve accessibility for mainstream users interacting with blockchain systems.
Security and decentralized finance infrastructure have also advanced. Safe introduced a beta version of its wallet designed to act as a pre-execution security layer. In parallel, Silo Finance launched its V3 upgrade, focusing on improved lending safety within decentralized markets.
Looking ahead, price scenarios remain tied to key liquidity levels. A hold above $2,280 could allow a move back toward $2,400 and higher resistance zones. However, a breakdown below this level may lead to a sweep toward $2,200, where deeper liquidity sits.
Market conditions continue to show a balance between technical pressure and underlying network growth. As a result, price action remains sensitive to leveraged positioning, while broader adoption trends develop in the background.
TLDR:
- Changpeng Zhao confirmed he does not know Satoshi Nakamoto’s identity during a recent interview discussion.
- CZ stated he would not reveal Satoshi’s identity even if known, maintaining a consistent long-term stance.
- He explained that anonymity helps Bitcoin avoid central authority and maintain its decentralized structure.
- CZ noted that Satoshi’s absence allows Bitcoin to operate without influence from a single individual.
Changpeng Zhao addressed long-standing curiosity about Bitcoin’s creator during an April 9, 2026, interview. Speaking on the TBPN Channel, he stated he does not know the identity of Satoshi Nakamoto and would not reveal it if known.
CZ Maintains Distance From Satoshi Identity Debate
Changpeng Zhao, founder of Binance, addressed one of crypto’s oldest questions during the interview. He confirmed he does not know Satoshi Nakamoto’s real identity. He also made clear he would not disclose such details even if he had access.
A widely shared post captured his remarks during the interview session. In the clip, CZ reiterated his position calmly and without hesitation.
The statement quickly circulated across crypto communities, drawing attention to his consistent stance on the topic.
He explained that curiosity about Bitcoin’s creator exists across the industry. However, he stressed that uncovering the identity could create unnecessary risks. According to CZ, anonymity has played a key role in Bitcoin’s growth and resilience.
He further noted that Bitcoin operates without reliance on a central figure. This structure, he said, has helped maintain trust in the network. As a result, he sees no reason to pursue the identity question actively.
Anonymity Seen as Core to Bitcoin’s Structure
CZ emphasized that Bitcoin’s decentralized nature remains closely tied to its anonymous origins. He explained that a known founder could attract unwanted attention or influence. That scenario could shift how the network is perceived and governed.
He pointed out that Satoshi Nakamoto’s absence removes any central authority figure. This absence, in turn, allows Bitcoin to function without leadership pressure. It also prevents decisions from being tied to one individual’s influence.
During the discussion, CZ made it clear that he does not intend to investigate further. He described the search for Satoshi’s identity as unnecessary for Bitcoin’s continued operation. Instead, he focused on the system’s design and independence.
He added that Bitcoin’s strength lies in its open and distributed framework. Without a visible founder, the network avoids personality-driven narratives. This structure supports its position as a decentralized financial system.
CZ’s comments align with a broader view held by many in the crypto space. The unknown identity of Satoshi Nakamoto remains one of Bitcoin’s defining characteristics. For CZ, preserving that mystery remains aligned with maintaining the network’s original structure.

BlackRock pulled $505 million into its iShares Bitcoin Trust across two April sessions, the biggest haul since early March. That scale of buying in a slow macro window says real money is already positioning before retail even opens a chart. Against that backdrop, Pepeto is drawing attention on the meme coin exchange layer of the market.
The presale has crossed $9.2 million raised and the token keeps landing on watchlists alongside the latest Bitcoin price news for 2026.
Morgan Stanley launched MSBT this April and delivered the strongest first day for any of its ETFs on record, according to Bitcoin Magazine. Across the same window, BlackRock’s IBIT pulled $505 million in two sessions, per Crypto Briefing.
The combination puts bank distribution firmly behind Bitcoin, and fresh capital is rotating into early entries as the overflow spreads. Money flowing this steady during a quiet macro window reads like slow motion buying by the biggest wallets on the board.
Two Names Worth Watching This April: Pepeto and Bitcoin
Pepeto Could Mirror Bitcoin’s Early Run Ahead of the Binance Listing
Right now, serious money in crypto is moving toward projects that already ship working products. BlackRock’s IBIT flow this week backs the same pattern, that capital rewards platforms actually building rather than publishing pitch decks. While big exchanges focus on expanding market infrastructure, Pepeto targets the meme coin trading layer with a zero fee exchange and a cross chain bridge live today.
The Pepeto presale has pulled more than $9.2 million and the token sits at $0.000000186 ahead of the Binance listing. A built in risk scorer checks every contract wallets interact with against known attack patterns, helping new buyers avoid the scams that emptied bags during the last meme cycle.
Auditors at SolidProof cleared every piece of the contract stack, a Binance alum drives the engineering side, and the founder who put the original Pepe into the market is at the head of this operation. That team previously drove a token with no working utility up to an $11 billion valuation, and this round a functional exchange is attached before the listing even prints.
Experienced buyers know the biggest returns come from entering before the broader wave shows up. Early buyers in Bitcoin captured that dynamic long before mainstream headlines caught on, and many investors are paying the same attention to Pepeto now. A 150x move matches what Pepe proved once, only this time a live exchange, clean audit, and Binance listing sit in the queue. The people who move during fear own the supply the late crowd pays up for.
BTC Price Prediction: Bitcoin Tests $75.143 With $80K in Range
Bitcoin broke through $75.143 this week according to CoinMarketCap as the Iran tension eased and oil rolled over, and technicals now point at $80,000 as the next zone, per Intellectia analysis. BlackRock IBIT ended Q1 with $54 billion in assets and captured roughly $8.4 billion in net inflows for the quarter.
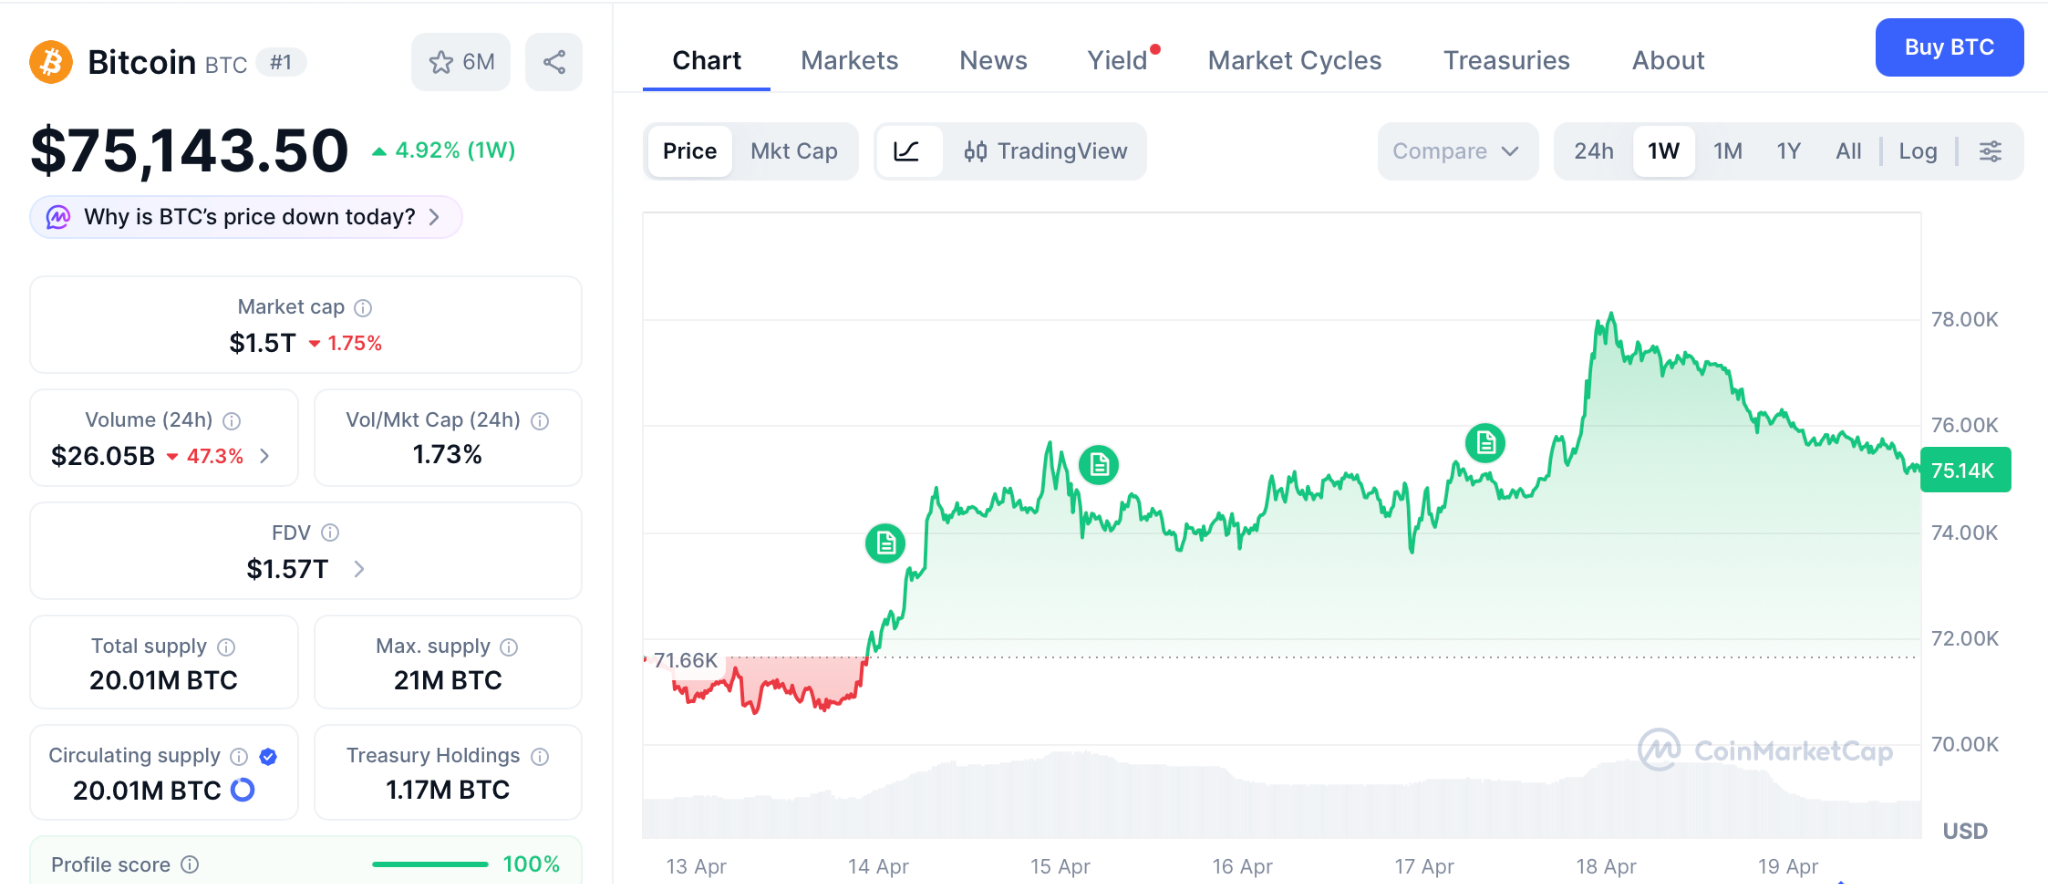
Wallets holding 10,000 to 100,000 BTC have been quietly adding, and ETF holdings now sit near $96 billion across the category. A break above $78,000 opens a path to $80,000 and eventually the $97,000 prior cycle peak.
Failure at $75,143 keeps the range tight between $70,000 and $78,000 while the Fed decision weights. Either way, Bitcoin’s next 2x takes months, which is the same window a 150x presale can close in days.
Conclusion
Retail watches the latest Bitcoin price news hoping for a quick 10% off ETFs, and BlackRock’s $505 million IBIT buy gave them reason to stare. But the setup that produced every early buyer story in crypto looks nothing like a large cap grinding from $75K to $80K.
It looks like an entry today on a token with a working exchange, a clean audit, and the same founder who took Pepe from nothing to $11 billion with zero products.
The same setup minted early SHIB and Pepe millionaires in the last run, and wallets buying Pepeto through the Pepeto official website today walk out of the Binance listing holding the same returns.
Click To Visit Pepeto Website To Enter The Presale

FAQs
Why is institutional activity important for the latest Bitcoin price news?
BlackRock IBIT pulled $505 million this week while Morgan Stanley’s MSBT posted its best ETF debut, keeping structural demand under the Bitcoin price news cycle.
How does the Binance listing affect the Pepeto path from here?
The listing opens Pepeto trading to the biggest exchange audience in the world, and the current entry price at the Pepeto official website closes the moment it prints.
What signals are traders watching for the next Bitcoin move?
Traders track ETF flows, whale wallets, and the $80,000 resistance, which together shape whether BTC breaks out or ranges through the Fed window.
Disclaimer: This is a Press Release provided by a third party who is responsible for the content. Please conduct your own research before taking any action based on the content.

The banking sector’s exposure to stablecoins remains modest for now, but analysts say the landscape could tilt as the sector of stablecoins and tokenized real-world assets (RWAs) swells in market size. While adoption is still evolving, the on-chain payments and cross-border use cases are broadening, potentially reshaping how traditional banks compete with a new class of digital assets.
According to Abhi Srivastava, associate vice president of Moody’s Investors Service Digital Economy Group, the stablecoin market capitalization exceeded $300 billion by the end of last year. Cointelegraph’s coverage highlights that figure as a marker of rapid growth, even as everyday usage lags behind headline numbers. (Source: Cointelegraph)
Srivastava noted that the role of stablecoins in payments, cross-border commerce, and on-chain finance is expanding, even as today’s U.S. payment rails remain fast, low-cost, and trusted. He argues that near-term disruption risk to banks appears limited, particularly given policy constraints that currently bar yield-bearing stablecoins from paying yields—meaning they are unlikely to replace traditional deposits domestically in the near term.
Nonetheless, the report suggests that sustained growth in stablecoins and tokenized RWAs could exert pressure on banks over time, potentially driving deposit outflows and constraining lending capacity as more financial assets migrate onto the blockchain or into tokenized forms.
The policy debate around stablecoins has become a focal point for crypto executives and bankers alike, especially as concerns grow that yield-bearing stablecoins could erode traditional banking market share. This tension is playing out in broader regulatory discussions in Washington, where the CLARITY Act—officially the Digital Asset Market Clarity Act of 2025—seeks to deliver a formal taxonomy and regulatory oversight for crypto markets. Source: Cointelegraph.
CLARITY Act stalled, as banks push back on yield-bearing stablecoins
The CLARITY Act aims to establish a comprehensive framework for digital assets, including asset taxonomy and regulatory jurisdiction. It has stalled in Congress after a coalition of crypto companies, led by Coinbase, publicly opposed earlier drafts, citing concerns over open-source software protections and a prohibition on yield-bearing stablecoins. The clash underscores a broader negotiation between the crypto industry and the banking lobby over how far regulators should go in defining and controlling digital-asset activities.
Lawmakers and the White House have pursued negotiations to bridge the gap, but concrete compromises remain elusive. Earlier this month, North Carolina Senator Thom Tillis signaled plans to release an updated draft proposal that could address concerns from both sides; Politico reports the plan exists, though no public draft has been released at this time. Source: Politico.
Analysts warn that a failure to pass a clear regulatory framework could invite renewed or stricter regulatory crackdowns on the crypto sector in the years ahead. With the CLARITY Act at a critical juncture, market participants are watching not only its fate but also how lawmakers weigh stability, innovation, and consumer protection in a rapidly evolving ecosystem. For some observers, the risk is not only about a single bill failing to pass but about the signaling effect of regulatory gridlock on market development and institutional participation.
What to watch next for stablecoins and market structure
As the debate progresses, investors and builders should monitor how stablecoins evolve in payments and cross-border use, and how tokenized RWAs intersect with traditional banking services. The outcome of the CLARITY Act negotiations, along with any new proposals from lawmakers such as Tillis, will influence not just compliance requirements but the pace at which banks and fintechs collaborate or compete with on-chain financial instruments. The broader question remains: will a clear regulatory framework unlock wider institutional adoption of stablecoins, or will it slow the pace of innovation through tighter restrictions?
Readers should stay attuned to updates from Congress and major industry voices, as the balance between fostering innovation and ensuring financial stability will shape the trajectory of stablecoins, RWAs, and the crypto market’s interaction with traditional banking in 2025 and beyond.
What remains uncertain is how quickly a consensus will emerge on yield-bearing stablecoins and related products, and how any new framework will translate into practical rules for exchanges, issuers, and users. The coming weeks could offer critical signals about the sector’s path and the readiness of policymakers to align on a shared approach to digital assets.

USMNT roundup: Red-hot Folarin Balogun chasing Ligue 1 history as Americans’ World Cup form takes shape

‘No more excuses’ as EU launches free age verification app

Jio Finance Q4 Results 2026 | Jio Finance Results Today | Jio Financial Services Latest News

Why Israel is blocking foreign journalists from entering

Bitcoin: We’re Entering The Most Dangerous Phase

Alan Cumming Brands Baftas Ceremony A ‘Triggering S**tshow’
Jio Finance Q4 Results 2026 | Jio Finance Results Today | Jio Financial Services Latest News

Justice Thomas issues MAJOR REBUKE against Democrats as Mamdani makes FINANCIAL MISTAKE

Sam Smith – Money On My Mind (Official Music Video)
-

 Crypto World6 days ago
The SEC Conditionalises DeFi Platforms to Be Avoided for Broker Registration
-

 Fashion2 days ago
Weekend Open Thread: Theodora Dress
-

 NewsBeat6 days ago
Trump and Pope Leo: Behind their disagreement over Iran war
-

 Crypto World6 days ago
SEC Signals Exemption for Crypto Interfaces From Broker Registration
-

 News Videos5 days ago
Secure crypto trading starts with an FIU-registered
-

 Sports3 days ago
NWFL Suspends Two Players Over Post-Match Clash in Ado-Ekiti
-

 Crypto World6 days ago
SEC Proposes Certain Crypto Interfaces Don’t Need to Register as Brokers
-

 Business13 hours ago
Powerball Result April 18, 2026: No Jackpot Winner in Powerball Draw: $75 Million Rolls Over
-

 Politics2 days ago
Palestine barred from entering Canada for FIFA Congress
-

 Crypto World2 days ago
Russia Pushes Bill to Criminalize Unregistered Crypto Services
-

 Sports7 days ago
NWFL opens Pathway for new Clubs ahead of 2026 Season
-
 Business3 days ago
Creo Medical agree sale of its manufacturing operation
-
 Entertainment6 days ago
Brand New Day’ Footage Reveals the Devastating Impact of ‘Now Way Home’
-

 Politics18 hours ago
Zack Polanski demands ‘council homes not luxury flats for foreign investors’
-

 Crypto World7 days ago
Trump whales load up ahead of Mar-a-Lago luncheon.
-
Business7 days ago
Kering slides after Morgan Stanley downgrade, Gucci woes loom
-

 Tech7 days ago
Apple glasses won’t go brand shopping like Meta did with Ray-Ban and Oakley
-

 Tech7 days ago
Google adds E2E encryption to Gmail for iOS and Android enterprise users
-
 Entertainment6 days ago
Karol G’s ‘Ultra Raunchy’ Coachella Set Gave ‘Satanic Vibes’
-
Entertainment7 days ago
How Euphoria Season 3 Premiere Paid Tribute to Eric Dane After Death
You must be logged in to post a comment Login