
Crypto World
US Crackdown on Southeast Asian Scam Centers Nets $700 Million Crypto Seizure


The US Department of Justice (DOJ) restrained more than $700 million in crypto and filed wire fraud conspiracy charges against two Chinese nationals who allegedly managed scam compounds.
US Attorney Jeanine Ferris Pirro, Assistant Attorney General A. Tysen Duva, and partners announced the coordinated actions alongside Treasury and State Department measures aimed at dismantling Southeast Asia’s compound-based fraud network.
Scam Center Strike Force Targets Burma Compound and Cambodia Expansion
The Scam Center Strike Force announced the enforcement push against transnational criminal groups accused of stealing billions from American victims.
Huang Xingshan and Jiang Wen Jie allegedly managed the Shunda compound in Min Let Pan, Burma, between January and November 2025. They also use the aliases “Ah Zhe” and “Jiang Nan,” according to the press release.
“According to the investigation, Huang served at Shunda as a high-level manager and enforcer and personally participated in the physical punishment of trafficked compound workers. Jiang served as a team leader directly supervising workers who specifically targeted American victims,” the authorities revealed.
Follow us on X to get the latest news as it happens
Prosecutors say one American victim lost more than $3 million to a worker managed by Jiang. The two defendants also tried to establish a second compound in Cambodia. Investigators seized 503 websites that hosted fraudulent investment platforms.
Authorities also took control of a Telegram channel with over 6,000 followers. The channel recruited victims into a Cambodia-based scheme that posed as law enforcement.
FBI Co-Deputy Director Christopher G. Raia described the actions as a significant blow to transnational criminal organizations targeting American citizens.
“We have taken down more than 500 websites used to steal people’s savings. And my Office continues to work to identify funds stolen from victims, having now caused restraint of more than $700 million in cryptocurrency involved in money laundering from US victims of fraud. This Administration is lock-step in combatting these scams, and we are not done,” US Attorney Jeanine Pirro said.
In addition, the Treasury Department’s Office of Foreign Assets Control (OFAC) designated Kok An, a Cambodian senator accused of controlling scam compounds across the country.
Subscribe to our YouTube channel to watch leaders and journalists provide expert insights
The post US Crackdown on Southeast Asian Scam Centers Nets $700 Million Crypto Seizure appeared first on BeInCrypto.

Crypto World
U.S. government’s Intel stake swells to $35 billion, netting $26.5 billion unrealized gain


The U.S. government is holding an unrealized gain of roughly $26.5 billion on its Intel (INTC) stake after the chipmaker’s shares jumped more than 22% in pre-mrket trading on Friday, following a stronger-than-expected first-quarter earnings report.
The position stems from an August deal in which the Trump administration converted $8.9 billion in CHIPS Act grants and Secure Enclave funding into 433.3 million Intel shares at $20.47 apiece, giving it about a 9.9% ownership stake. With Intel trading near $81.80 in pre-marketing trading Friday, the holding is now valued at approximately $35.4 billion, nearly tripling in less than a year.
The government also holds warrants to purchase an additional 5% stake at $20 per share, options that are now deep in the money.
Intel’s rally was driven by a sharp earnings beat. The company reported first-quarter revenue of $13.6 billion, up 7% year over year and above Wall Street expectations of $12.4 billion. Non-GAAP earnings per share came in at $0.29, far exceeding the consensus estimate of a $0.01 loss.
Growth was led by Intel’s Data Center and AI segment, which rose 22% to $5.1 billion as demand for Xeon processors accelerates alongside the broader AI infrastructure buildout.
CEO Lip-Bu Tan pointed to a shift in AI computing toward inference and agentic workloads, saying the trend is “significantly increasing the need for Intel’s CPUs.”
Intel guided revenue in the range of $13.8 billion to $14.8 billion for the second quarter.


Crypto prices stayed muted with major assets, including Bitcoin, experiencing slight declines on Friday as hopes of peace between the U.S. and Iran began to fade.
Summary
- Crypto prices remained subdued as fading U.S.-Iran peace hopes kept Bitcoin range-bound and weighed on overall market sentiment.
- Ongoing naval blockade and stalled negotiations pushed oil prices higher, raising macro uncertainty and keeping investors in a wait-and-watch mode.
- Analysts remain divided, with derivatives data signaling caution while some expect a potential short squeeze if Bitcoin breaks key resistance near $80,000.
Bitcoin (BTC) price traded sideways between $77,000 and $79,000 over the past 24 hours before consolidating around $77,700 at press time, down 0.6% in the period. Ethereum (ETH) was down 1.5%, exchanging hands at $2,314, while XRP (XRP), BNB (BNB), and Solana (SOL) saw less than 1% sideways movement on the day. The global crypto market cap was down 0.2% at $2.68 trillion, indicating subdued interest from investors.
This trend is likely from traders entering a wait-and-watch mode as the odds of peace between the U.S. and Iran look rather slim while both continue with their back-and-forth escalation at the Strait of Hormuz.
Per recent reports, U.S. President Donald Trump has noted that the U.S. is under no pressure to end the war with Iran, though a failure to reach terms could likely lead to a heavy attack on Iranian infrastructure.
“I have all the time in the world, but Iran doesn’t. The clock is ticking!” Trump wrote in a recent Truth Social post.
The U.S. has continued the naval blockade against Iranian ports for the tenth consecutive day to pressure Iran to accept a denuclearization deal. However, Iran, for its part, has rejected any peace talks in Islamabad as long as the blockade remains in place, stating it will not succumb to bullying.
The stalemate regarding the shipping lanes has led crude oil prices to move back to $95 and could surge back above $100 if no resolution is found. Concerns remain over a potential global recession if conflict disrupts the Strait of Hormuz for a prolonged period.
Traditional markets echoed these concerns with safe-haven assets such as gold and silver down slightly on the day. However, Asian tech stocks like the Nikkei 225 and Hang Seng ended a little higher despite the geopolitical noise.
As such, if there is a delay in any peaceful resolution to the conflict, it could continue to pressure markets, especially risk assets such as cryptocurrencies, including Bitcoin.
A prolonged geopolitical standoff could cause Bitcoin to lose its gains over the past month and hence trigger a wider selloff across the altcoin market. If it fails to hold its current support levels, investors may see a rapid exodus from more volatile projects as capital seeks the relative safety of cash or stablecoins.
How will Bitcoin react?
Singapore-based QCP Capital maintains that the recent bounce in Bitcoin does not signal a structural shift and is unlikely to reverse the bearish momentum seen in recent months.
The firm noted that confidence in risk assets has been supported mainly by the temporary truce extension and reassurances from Federal Reserve Chair nominee Kevin Warsh regarding the central bank’s independence.
Derivatives data also suggests caution. Options markets continue to show muted short-term volatility, while demand for downside protection remains elevated, indicating hedging activity.
In contrast, analysts at K33 Research see scope for further upside. They point to a divergence between Bitcoin’s price recovery and persistently negative funding rates, which could leave the market exposed to a potential short squeeze.
Even so, the $79,000 to $80,000 range is emerging as a key resistance zone, aligning with the realized price of short-term holders who may look to exit positions as prices rise. Data platform CryptoQuant has similarly described the $80,000 level as a “critical inflexion point.”
From a longer-term perspective, Anthony Pompliano argued that sharp pullbacks can lay the foundation for stronger rallies. He suggested that a 50% correction from October highs could eventually pave the way for new peaks, adding that “Bitcoin has become the king of safe havens in all kinds of chaos.”
Disclosure: This article does not represent investment advice. The content and materials featured on this page are for educational purposes only.
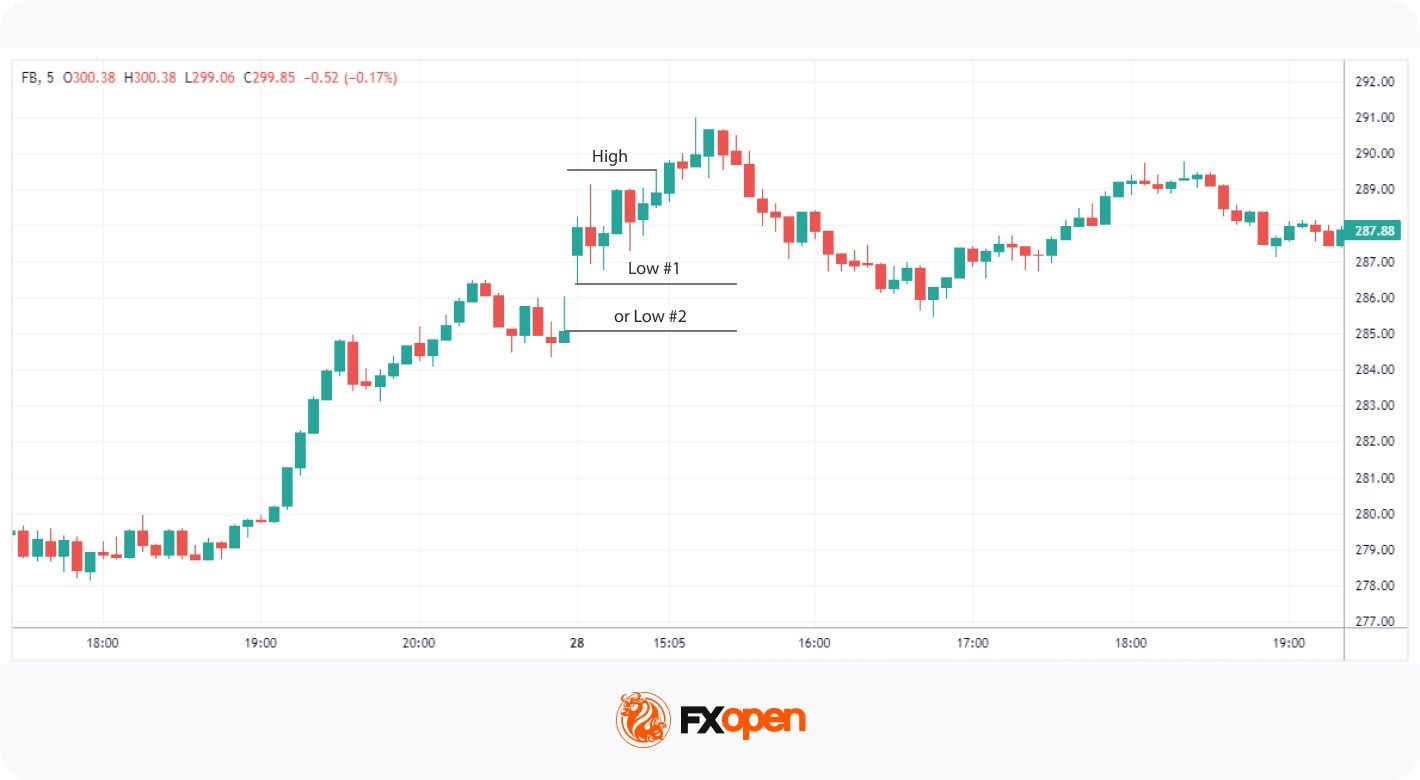
The Opening Range Breakout strategy is an intraday trading approach that marks the high and low of a market’s first 5, 15, or 30 minutes of activity, then treats a candle closing above the range high or below the range low as a signal of potential directional momentum.
The first minutes after a market opens are often marked by heightened volatility, rapid price movements, and a surge in trading activity. This period reflects the reaction to overnight news, global events, and the positioning of market participants at the start of the session. These opening moves may provide a breakout trading framework that can shape trading for the rest of the day.
In this article, we examine the Opening Range Breakout strategy, a widely used approach that focuses on this critical window of market activity and its potential implications for intraday trading.
Overview of the Opening Range Breakout Trading Strategy

The ORB, or the Opening Range Breakout, is a time-tested breakout trading strategy that centres around identifying the price range established in the initial minutes of a market session. The strategy typically focuses on the price range formed within the first 5, 15, or 30 minutes after the market opens. This range forms because the market absorbs overnight news, early positioning by institutional participants, and concentrated order flow as liquidity returns at the bell.
Traders mark the highest and lowest points reached during this period as key levels. While some rely solely on this range, others also incorporate the prior day’s closing price for additional context. Traders keen on trading the open range breakout pay close attention to these high and low levels, as a breakout or breakdown from these levels can indicate a strong trend.
Variations of Opening Range Breakout
The ORB framework adapts to different timeframes, and traders often select one based on how quickly they want a signal.
- 5-minute ORB: Produces the fastest setups and is popular among scalpers, though the narrow range may increase the rate of false breakouts.
- 15-minute ORB: Balances speed and structure. The range typically captures the initial reaction to the open while filtering out the first burst of noise.
- 30-minute ORB: Produces a larger range and fewer signals per session, which some traders find cleaner for position sizing and stop placement.
Using the ORB for Stocks
Trading the Opening Range Breakout in the stock market offers distinct advantages, primarily due to the well-defined opening and closing times of the stock exchanges. These regulated timeframes provide a clear structure for implementing the ORB trading strategy. Typically, stock traders focus on the initial 5 to 30 minutes post-opening bell to define the range, as this period often captures the essence of market sentiment.
Liquidity is usually high during this time and volumes are significant. According to theory, the strategy may help traders identify trends early in the trading session. However, traders also consider the current trend. Looking for entries in the broader trend direction can reduce the odds of being misled by a false breakout.
Using the ORB for Forex
In forex, the Opening Range strategy can also be applied, albeit with some unique considerations. Unlike the stock market, forex operates 24 hours a day, five days a week, with no clearly defined opening or closing times. The ORB strategy applies the same logic to specific forex sessions. The London open breakout strategy and the New York session breakout are the two common session anchors, as both tend to produce directional moves tied to institutional order flow.
Liquidity and trading volume can vary substantially between these sessions, affecting the results of the Opening Range Breakout method. The overlap between London and New York often produces the largest ranges on major pairs, while the Asian session is believed to be quieter, which can flatten the opening range.
Additionally, it may be helpful to be aware of currency pairs; each pair may have increased activity and, therefore, potentially more reliable breakouts during the session of its originating country. Lastly, given the almost continuous trading, overnight gaps are rare, making a careful session-based approach critical for forex ORB.
Breakout Logic and Trade Structure
The opening breakout strategy is a widely used approach to take advantage of strong upward or downward movements that break the defined opening range.
Opening range breakout process traders use:
- Define the opening range (first 5–30 minutes of the session)
- Identify the range high and low
- Monitor price approaching the range boundaries
- Wait for a breakout with a candle close outside the range
- Manage the trade using predefined risk parameters
Let’s consider the Opening Range Breakout example above.
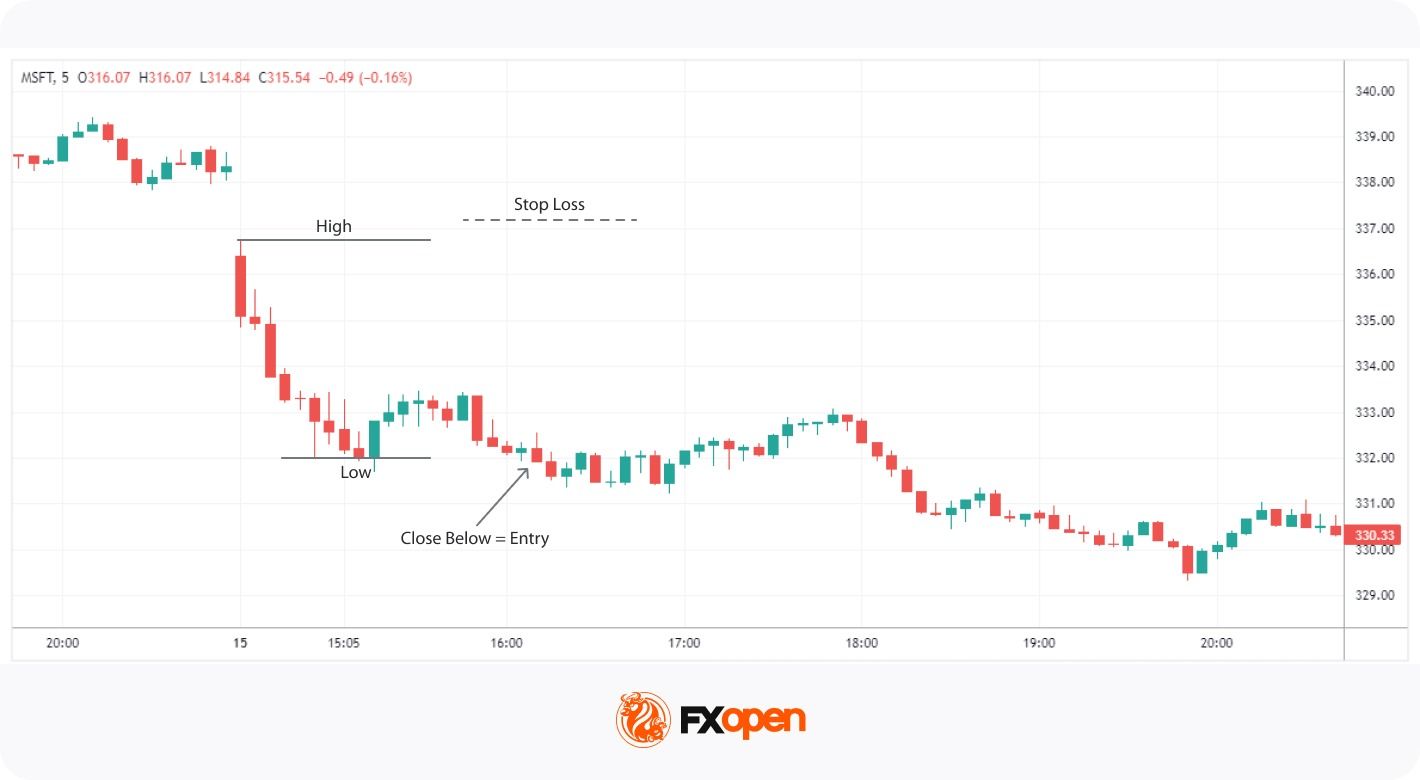
Entry
- Traders often monitor the price as it approaches the high or low of the opening range, typically using the 5, 15, and 30-minute charts. The opening range is generally defined as the first 30 minutes of the session.
- Entry confirmation typically comes from a candle closing above the high for a bullish breakout or below the low for a bearish one.
Stop Loss
- A stop loss might be set just below the opening range high for bullish trades or above the low for bearish trades. Factors like market volatility and liquidity are often taken into consideration when placing the stop loss.
Take Profit
- The profit target could be set at a distance based on risk/reward ratio, like 2:1 or 3:1.
- Traders also consider major support and resistance levels as potential take-profit levels.
To see how it works for yourself, consider heading over to FXOpen’s TickTrader trading platform. There, you’ll be able to explore a wide range of forex and stock CFDs.
Popular Practice for Trading the ORB Strategy
To improve the accuracy of the Open Range Breakout strategy, traders approach it with a disciplined and informed methodology.
Some of the Popular Practices
- Defining a Clear Opening Range: Traders often focus on the first 5, 15, or 30 minutes after the market opens to establish a trading range. Consistency in the chosen timeframe may be helpful for thoughtful analysis.
- Focusing on Liquid Markets: The ORB is usually applied to markets with high trading volumes during the opening session since these typically see more breakouts than thinly traded assets.
- Aligning with Market Trends: Breakouts that align with the broader market or news events could reduce the probability of false signals.
- Accounting for Volatility Regimes: High-volatility sessions often produce wider opening ranges and stronger follow-through once price closes outside the boundary. Low-volatility conditions tend to produce narrower ranges and a higher proportion of false breakouts, so some traders step aside or tighten filters during quieter periods.
- Incorporating Session-Specific Analysis: For forex markets, using the opening range of specific sessions (e.g., London or New York) often yields more relevant breakouts for currency pairs linked to those regions.
- Back-Testing and Optimisation: Traders typically refine their approach by back-testing the ORB trading strategy on their chosen market and timeframe.
- Using Breakout Indicators: Some traders may use Opening Range breakout indicators, such as volume or volatility measures (including VWAP and ATR), to support breakout confirmation.
Pullback Strategy
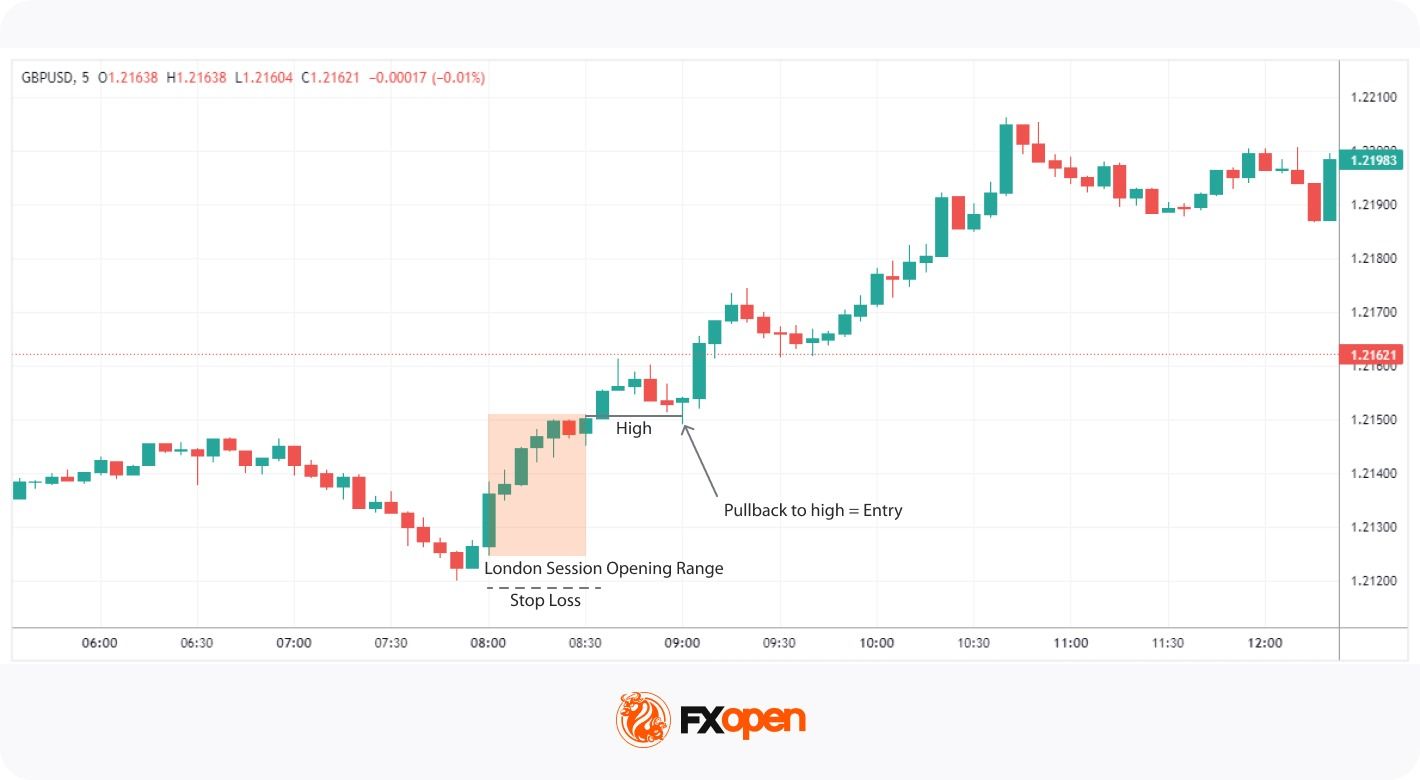
The pullback strategy within the ORB framework offers traders an alternative approach that seeks additional confirmation before initiating a trade. This strategy can be particularly useful in markets where false breakouts are common.
Entry
- Rather than entering immediately on a breakout, traders often wait for the price to break beyond the opening range and then retrace back to the high or low of that range or to a relevant support or resistance level within the range.
Stop Loss
- Stop losses could be placed a few pips below the low of the range for bullish trades or a few pips above the high for bearish trades to accommodate market noise and volatility.
Take Profit
- Profit targets could be based on a risk/reward ratio that aligns with the trader’s overall strategy.
- These targets could also be adjusted depending on subsequent support or resistance levels.
False Breakouts and Filters
The opening range in trading can see false breakouts, which happen when price pushes beyond the opening range, fails to hold, and returns inside within one or two candles. These failures often leave a long wick or a strong reversal candle on the breakout bar, signalling rejection by participants on the other side.
To maintain a level of Opening Range Breakout risk management, traders often apply simple filters:
- No close outside the range: A wick beyond the high or low without a closing print above or below counts as a test, not a breakout.
- Quick reversal back through the level: Price returning through the range within a candle or two invalidates the setup.
- Low volatility sessions: Narrow opening ranges during quiet conditions produce a higher share of fakeouts, so some traders step aside until volume returns.
Key Characteristics and Limitations of the ORB Strategy
The Opening Range Breakout strategy offers traders a systematic approach to take advantage of early market movements. While it may be a powerful tool for capturing significant price shifts, it may be important to understand its strengths and weaknesses.
Characteristics
- Early Trend Identification: The ORB may help traders spot potential trends right after the market opens, allowing for timely entry into positions.
- High Liquidity Periods: Trading during the opening range often means higher liquidity, which could lead to smoother order execution and tighter spreads.
- Risk Management Rules: The strategy provides defined entry and exit points.
- Defined Stop Placement: Stops typically sit just beyond the opposite side of the opening range. This anchors risk to session structure rather than an arbitrary pip distance.
- Versatility: Applicable to various markets like stocks and forex, the ORB can be adapted to different trading instruments and timeframes.
Limitations
- False Breakouts: The strategy is susceptible to fakeouts, where the price breaks the range but quickly reverses. The potential for losses means risk management is an important consideration for traders using the ORB strategy.
- Market Noise: High volatility during opening sessions can cause erratic price movements, making it challenging to distinguish genuine breakouts.
- Requires Quick Decision-Making: Traders need to act swiftly, which may lead to wrong decisions and additional psychological pressure.
- Not Always Reliable in All Markets: The ORB may be less reliable in markets that don’t exhibit strong opening movements or during periods of low volatility.
- Range Width and Volatility Affect Risk: Wider opening ranges translate into larger stop distances. Volatile sessions can inflate the range to a point where the resulting setup no longer fits a trader’s risk parameters, even when the breakout itself looks structurally valid.
The Bottom Line
The ORB trading strategy gives traders a structured way to trade the early part of a session across stocks and forex. Range width, session timing, and volatility conditions all shape how the setup performs on a given day.
If you want to apply the strategy across a selection of forex and stock CFD markets, you can consider opening an FXOpen account and access tight spreads and low commissions (additional fees may apply).
FAQ
What Is the Opening Range Breakout Strategy in Trading?
The Opening Range Breakout (ORB) strategy is based on the price range formed during the first minutes of a trading session, typically 5 to 30 minutes. Traders monitor the high and low of this range, as price movements beyond these levels may indicate increased volatility and potential directional momentum.
How May the ORB Strategy Be Used By Traders?
Traders typically define the opening range using short-term timeframes, such as 5-, 15-, or 30-minute charts, and monitor price action near its boundaries. Breakouts above or below the range may be considered alongside confirmation signals such as candlestick structure or volatility conditions.
What Confirms an Opening Range Breakout?
Confirmation usually comes from a candle closing outside the opening range high or low on the chosen timeframe. A wick beyond the level without a closing print is generally treated as a test rather than a breakout. Some traders add volume expansion, a move away from VWAP, or a rising ATR reading as secondary filters before acting on the signal.
What Is the 15-Minute Opening Range Breakout Strategy?
This variation uses the first 15 minutes of trading to establish the opening range. It appeals to those looking for quicker setups compared to the more traditional 30-minute range.
How May Traders Select Stocks for an ORB Strategy?
Stocks with high liquidity and strong pre-market activity are often chosen by traders for the ORB strategy. Traders may also consider stocks influenced by significant news or earnings reports, as these are likely to show volatility at the open.
What Is the Opening Range Breakout Strategy’s Success Rate?
The results of a strategy usually vary based on general factors like market conditions, timeframe, and trade execution and private factors, like trading approach, skills, and risk management. According to theory, traders often find the ORB strategy useful in volatile markets with clear trends and robust volume.
This article represents the opinion of the Companies operating under the FXOpen brand only. It is not to be construed as an offer, solicitation, or recommendation with respect to products and services provided by the Companies operating under the FXOpen brand, nor is it to be considered financial advice.


Key takeaways
- XMR is trading above $380 on Friday, after over 3% rebound from the 200-day EMA on the previous day.
- The positive derivatives data could push XMR’s price above $400.
Monero (XMR) is trading around $380 on Friday, showing a mild retracement after a 3% gain the previous day. The privacy coin is steadily regaining demand in the derivatives market, as traders anticipate further upside amid a broader market risk-on phase
Monero derivatives signal strong retail sentiment
Monero has continued its recovery since the early February sell-off, with growing retail demand for its derivatives.
According to CoinGlass data, the XMR futures Open Interest (OI) has risen to $139.39 million, up from $109.94 million on February 7, reflecting renewed investor confidence.
Furthermore, the OI-weighted funding rate remains positive at 0.0093%, indicating a persistent preference for holding long positions at a premium.
The positive derivatives data indicate that buyers are starting to enter the Monero market. This could push XMR’s price higher in the near to medium term.
Technical outlook: Can Monero surge to $400?
The XMR/USD 4-hour chart is bearish and efficient, but the structure could flip bullish if Monero continues with its rally.
Currently, XMR is holding above the 50-day Exponential Moving Average (EMA) at $351 and the 200-day EMA at $364.
The 4-hour chart reveals a rising channel pattern, signaling a constructive market structure. The Relative Strength Index (RSI) at 61 and a positive Moving Average Convergence Divergence (MACD) above its signal line support sustained upside momentum.
On the upside, immediate resistance is at $400, aligning with the Inducement Liquidity (ILQ) created on February 4. A breakout above this level could push Monero towards the 50% retracement level at $470, above the 4-hour TLQ level.

However, if the bears regain control, support is found at the 200-day EMA at $364, followed by the 50-day EMA at $351.
A deeper pullback below the rising support trendline at $330 would signal a more significant shift in the current constructive outlook.

The euro remains under pressure, extending its corrective decline following the previous impulsive rally. Market participants are taking profits and trimming positions ahead of key macroeconomic releases, reducing demand for the single currency and keeping both pairs near important levels, with the potential for increased volatility.
Ongoing geopolitical uncertainty in the Middle East continues to act as an additional factor, particularly through its impact on commodity markets, especially oil. Fluctuations in energy prices are influencing inflation expectations and the outlook for monetary policy, which is particularly relevant for commodity-linked currencies such as the Canadian dollar.
Focus now shifts to upcoming data from the euro area, Canada, and the United States, which may reshape expectations regarding the next steps of major central banks. Weak or neutral data could increase pressure on the euro and extend the current downside move, while stronger figures may provide support and trigger a corrective rebound or stabilisation near current levels.
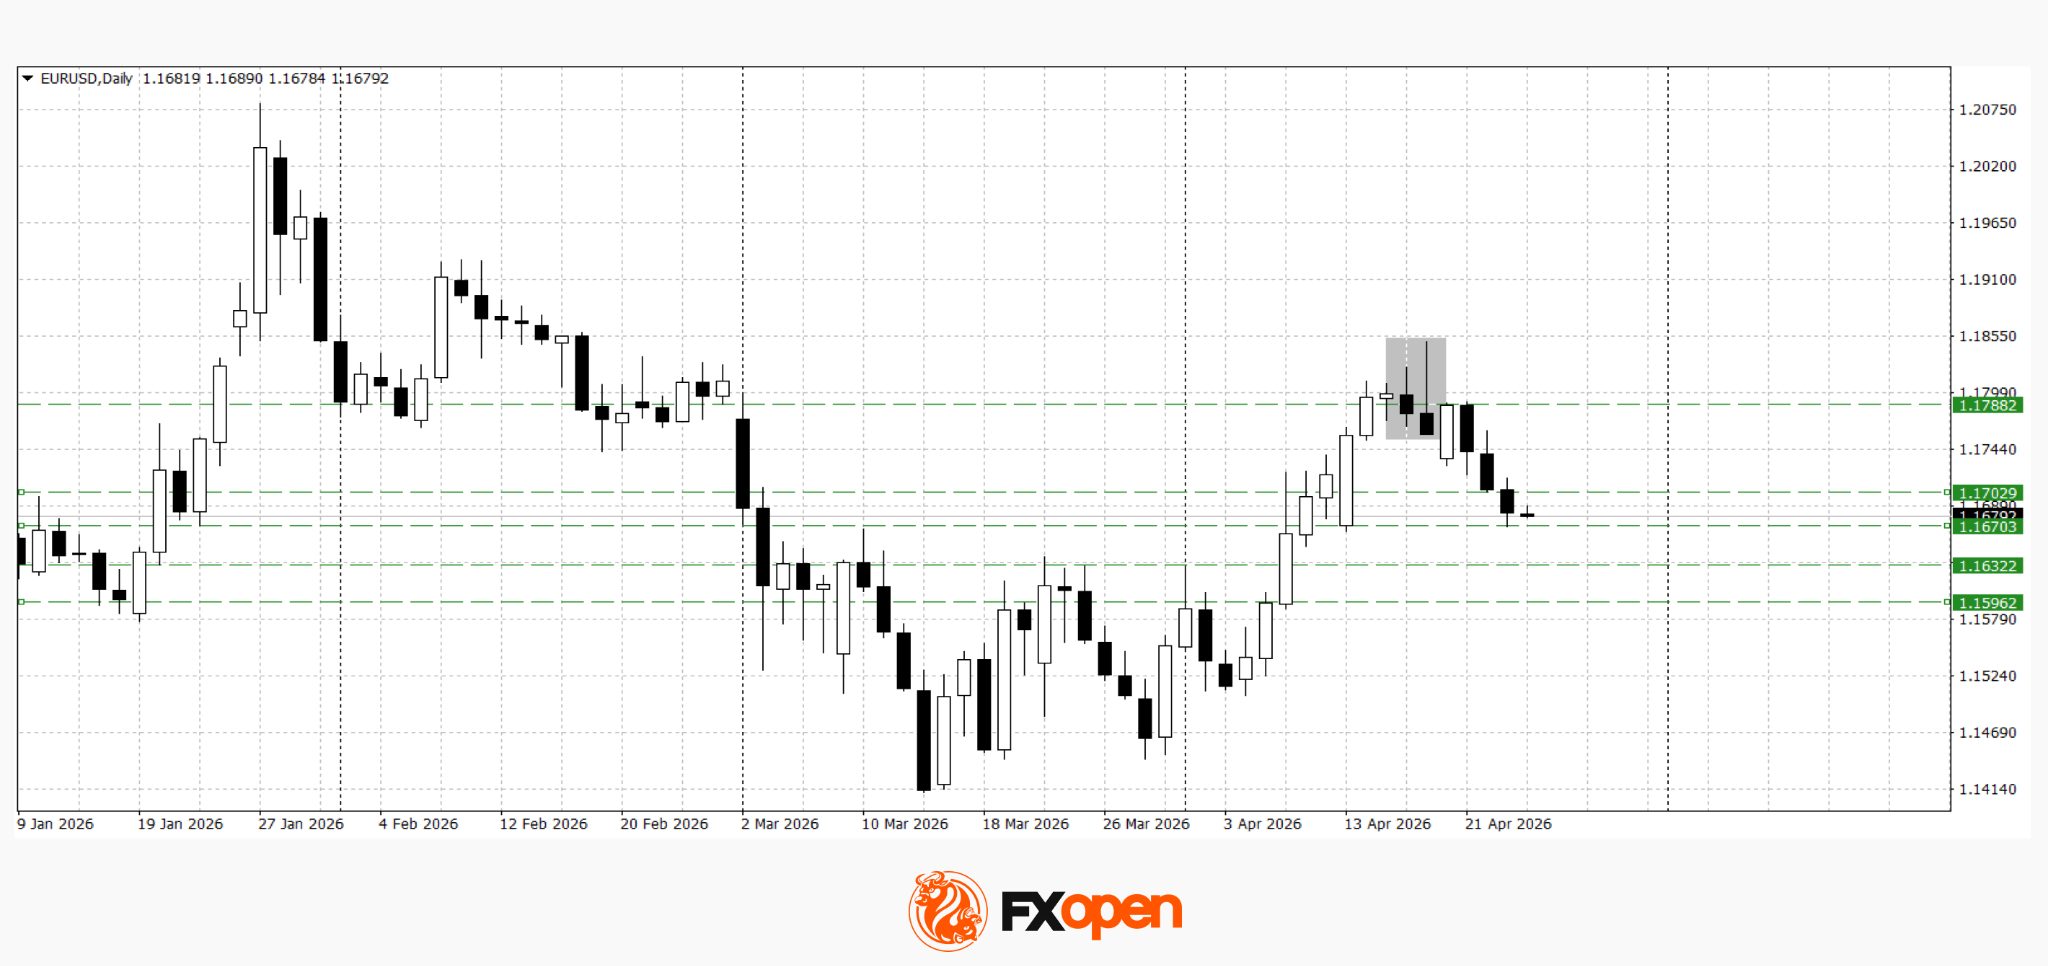
EUR/USD
After forming a bearish reversal pattern last week, EUR/USD continues to trade within a corrective downtrend. Sellers managed to push the pair below the key 1.1700 support level yesterday. If this level turns into resistance, a retest of recent lows and further decline towards 1.1630–1.1600 may follow.
Key events for EUR/USD:
- today at 09:45 (GMT+3): France consumer confidence
- today at 11:00 (GMT+3): Germany IFO business climate index
- today at 17:00 (GMT+3): US inflation expectations (University of Michigan)
EUR/CAD
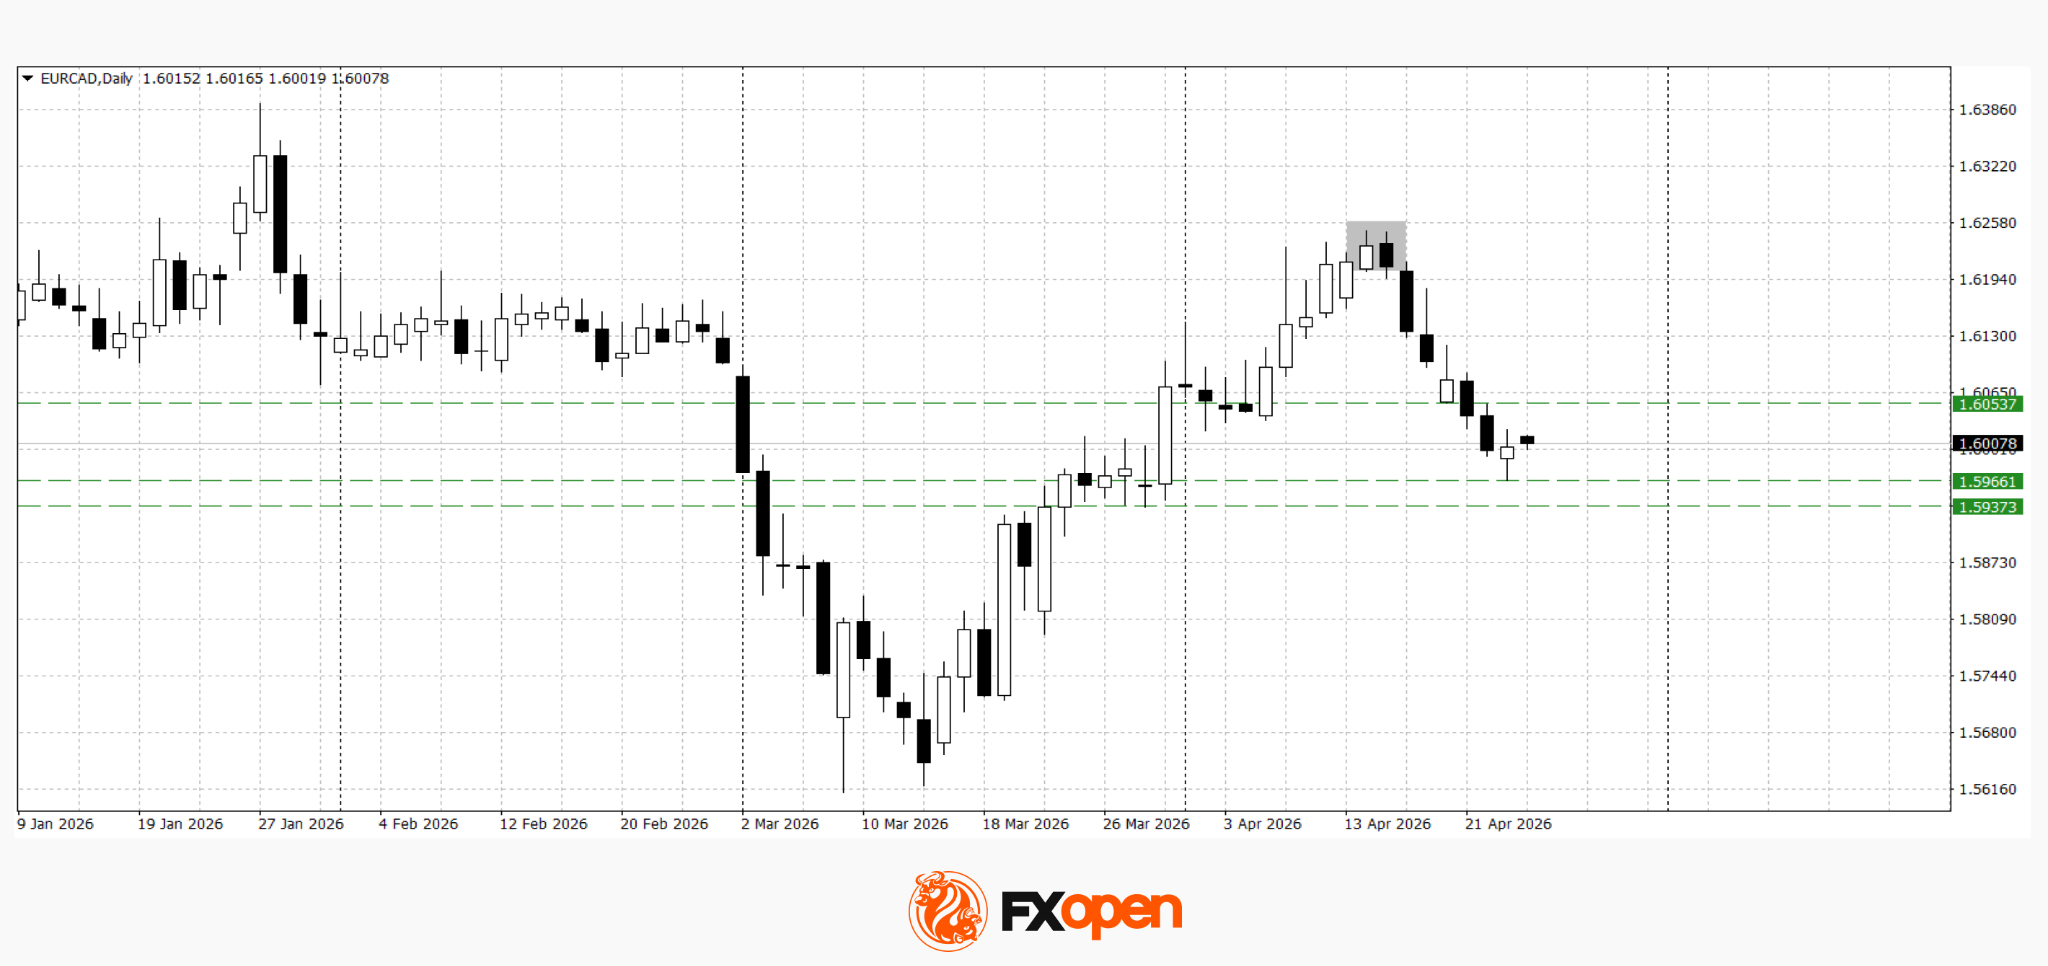
EUR/CAD is also moving lower, testing important levels amid mixed fundamental drivers. Technical analysis points to the possibility of further downside towards 1.6000–1.5940, supported by a confirmed bearish “tweezer” pattern on the daily chart. A move above 1.6050 could bring buyers back into the market.
Key events for EUR/CAD:
- today at 15:30 (GMT+3): Canada core retail sales
- today at 18:00 (GMT+3): Canada budget balance
- today at 22:30 (GMT+3): CFTC CAD net speculative positions
Both pairs remain near key levels, with future direction dependent on a combination of fundamental factors. Depending on incoming data, the market may either shift into consolidation with attempts to hold support, or see an extension of the current corrective decline.
Trade over 50 forex markets 24 hours a day with FXOpen. Take advantage of low commissions, deep liquidity, and spreads from 0.0 pips (additional fees may apply). Open your FXOpen account now or learn more about trading forex with FXOpen.
This article represents the opinion of the Companies operating under the FXOpen brand only. It is not to be construed as an offer, solicitation, or recommendation with respect to products and services provided by the Companies operating under the FXOpen brand, nor is it to be considered financial advice.

Besides freezing crypto, the strike force also seized a Telegram channel used to recruit unsuspecting job seekers and took down 503 fake crypto investment websites.
The White House has reportedly confirmed that US President Donald Trump will attend the exclusive event for top TRUMP memecoin holders at his Florida residence on Saturday, after questions were raised earlier this month over whether he would attend.
Reuters reported on Friday that the White House confirmed Trump would deliver a keynote address at the gala luncheon organized by the company behind his Official Trump (TRUMP) memecoin.
The gala is set to take place at Mar-a-Lago. It will be open to the top 297 holders of the TRUMP token, and the top 29 holders will also qualify for a private reception with the president.
When the event was announced in March, a White House official told Politico that it was not locked into Trump’s schedule and that it was taking place the same day Trump said he would attend the White House Correspondents’ Association Dinner in Washington, DC, the first time he would do so as president.

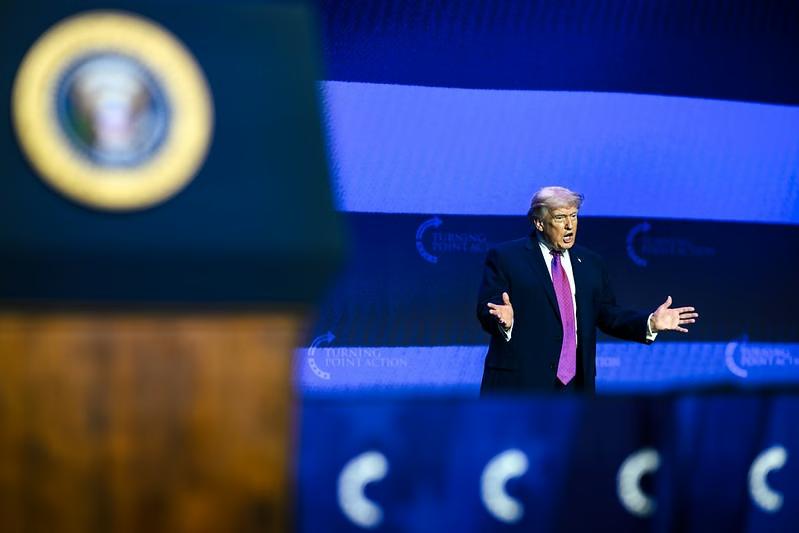
Donald Trump, pictured at a Turning Point USA event on April 17, is confirmed to be addressing an event for holders of his memecoin on April 25. Source: The White House
The event’s terms also state that Trump may not be able to attend the event, and it “may be canceled for any reason.”
Trump’s potential attendance at the event has been a sticking point for some lawmakers, who have criticized the event as a conflict of interest for the president.
Earlier this month, Democratic Senators Elizabeth Warren, Richard Blumenthal and Adam Schiff reportedly sent a letter to Bill Zanker, the individual behind the TRUMP memecoin, questioning whether Trump intends to “dangle access” to himself at the upcoming event.
Related: Trump-linked American Bitcoin energizes 11,298 new ASICs
“[O]rganizers are promoting a conference by dangling access to President Trump to potential attendees (and in doing so, are encouraging purchases of his meme coin that will generate transaction fees for the President and his family) on a day he may not actually be able to attend,” the letter said.
It is the second event for holders of the TRUMP token. The first took place at a Trump golf club in May 2025 and drew criticism from those who said Trump was using his position as president for personal financial gain.
Magazine: Quitting Trump’s top crypto job wasn’t easy: Bo Hines

The White House has confirmed that U.S. President Donald Trump will deliver a keynote address at a private gala for the top holders of the TRUMP memecoin, slated to take place at Mar-a-Lago this weekend. The event has already drawn scrutiny over the intersection of politics, finance and social media hype surrounding meme coins tied to political figures.
According to Reuters, the White House affirmed on Friday that Trump would speak at the gala luncheon organized by the company behind the Official TRUMP memecoin. The affair is designed to be exclusive, with access limited to the top 297 TRUMP token holders, and the top 29 holders qualifying for a private reception with the president. The organizers list attendance terms that acknowledge the possibility that Trump’s schedule could prevent participation, or that the event could be canceled for any reason.
Key takeaways
- The White House has confirmed Trump will keynote a gala for TRUMP memecoin holders at Mar-a-Lago, with the event planned for April 25.
- Access is restricted to the top 297 TRUMP token holders, and the top 29 are eligible for a private reception with the president.
- Lawmakers are raising concerns about conflicts of interest and access diplomacy tied to the event; a formal inquiry has been issued to the event’s organizer.
- Past criticism surrounding a previous TRUMP memecoin event in 2025 underscores ongoing questions about the use of presidential platforms for personal financial gain.
White House confirms keynote at Mar-a-Lago gala
In a development that blends political life with crypto-tinged fundraising, Reuters reported that the White House has given the green light for Trump to address attendees at the TRUMP memecoin gala. The appearance would mark a high-profile moment for the meme-based project, which markets itself around the former president’s name and brand. The venue is Mar-a-Lago, a setting that has already become a focal point for the event’s exclusivity and spectacle.
The organizers’ terms note that participation is not guaranteed if Trump cannot attend or if circumstances necessitate cancellation. The stated plan to host a closed, invitation-only luncheon aligns with how crypto-promotional events have historically attempted to leverage star power to drive attention and potential liquidity for token holders.
Media coverage of the development has focused not only on the logistical details but also on the broader implications for governance and accountability when political figures lend themselves to crypto campaigns. The event’s framing—as a fundraiser, a social meet-up for the crypto community, and a potential venue for policy or influence peddling—has drawn varying responses from observers across the political spectrum.
Lawmakers raise conflict-of-interest concerns
The invitation to such a high-profile engagement has quickly become a political talking point. Earlier this month, Democratic Senators Elizabeth Warren, Richard Blumenthal and Adam Schiff reportedly sent a letter to Bill Zanker, the entrepreneur behind the TRUMP memecoin initiative, questioning whether the event would amount to “dangles of access” to the president. The lawmakers argued that tying access to a personal crypto project could incentivize attendees to purchase the token to gain proximity to power, potentially generating transaction-related benefits for Trump and his family.
As described in the letter, organizers were urged to clarify the intent behind offering faces of power in exchange for financial participation and to address potential conflicts with ethical standards governing the president’s official duties. The questions underscore ongoing tensions around the use of presidential branding for commercial ventures, particularly where digital assets could be involved in fundraising or promotional activities.
Past controversy shadows the current event
This event would be the second time TRUMP token holders have gathered under the president’s orbit. The first such gathering occurred in May 2025 at a Trump golf club and drew sharp criticism from critics who argued that a sitting president’s involvement in a personal financial venture could blur lines between public duties and private enterprise. Critics argued the optics suggested the administration was enabling personal financial gain through the presidency—a concern that has echoed through debates about crypto marketing and political power.
Observers note that the current event’s terms explicitly acknowledge uncertainty around attendance, a feature that some critics have highlighted as a necessary check against overreach. Still, the persistence of such events signals a broader trend in which political figures’ associations with crypto tokens become part of the public discourse surrounding policy, regulation, and the evolving role of digital assets in society.
What to watch next
The immediate question is whether Trump will attend or cancel, given the formal caveats in the event’s terms and the fluctuating nature of schedules for sitting presidents. The President’s schedule and public appearances often shift due to broader political considerations, making the outcome uncertain even as the event date approaches. Additionally, lawmakers’ inquiries could influence how such memecoin-linked events are perceived by regulatory bodies and the public.
In broader market terms, the episode illustrates how political branding and crypto marketing continue to intersect in ways that attract both attention and scrutiny. For investors and observers, the key takeaway is not the hype around a single token event but the signal it sends about governance, transparency, and the evolving boundaries of political influence in digital asset cultures. The outcome could shape how future memecoin campaigns navigate ethics, disclosures, and accountability when tied to public figures.
As coverage develops, readers should monitor official statements from the White House, updates from Reuters and Politico on scheduling, and any formal responses from lawmakers or the campaign organizers. The next steps will likely illuminate how such high-profile political-crypto intersections are managed going forward and what safeguards—if any—emerge to balance access, publicity, and governance in this rapidly evolving space.

Liquidity mining has long been framed as a cornerstone innovation in decentralized finance—an elegant mechanism to bootstrap liquidity, decentralize ownership, and align incentives between users and protocols. But beneath the narrative, a more familiar pattern emerges: liquidity mining often functions as a form of paid customer acquisition, with tokens replacing traditional cash incentives.
This framing does not diminish its importance. Instead, it clarifies both its strengths and its limitations
Reinterpreting Liquidity Mining
At its core, liquidity mining distributes tokens to users who provide capital or perform activities for a protocol. Whether through supplying liquidity, staking assets, or executing trades, participants are rewarded for behaviors that enhance the protocol’s functionality and attractiveness.
From a business perspective, this resembles a classic growth strategy:
- Incentivize user participation
- Increase platform activity
- Build initial network effects
The only difference is the currency. Instead of spending fiat on ads or promotions, protocols issue native tokens—effectively subsidizing early adoption with future upside.
Paid User Acquisition, Repackaged
Traditional startups allocate significant budgets to acquire users through marketing campaigns, referral bonuses, and discounts. Liquidity mining mirrors this approach, but with a structural twist:
- Tokens as incentives: Users are compensated directly in protocol-native assets
- Lower upfront cost: Instead of depleting cash reserves, protocols dilute token supply
- Speculative appeal: Rewards are not just payments—they are perceived investments
This creates a powerful feedback loop. As long as token prices remain stable or increase, participation appears profitable, attracting more users and reinforcing growth.
However, the mechanism is not fundamentally different from paid acquisition—it is simply more capital-efficient in the short term.
Temporary Engagement Spikes
Liquidity mining programs are highly effective at generating rapid traction. When rewards are attractive, capital flows in quickly, often producing dramatic increases in:
- Total Value Locked (TVL)
- Trading volume
- User activity
These spikes can create the appearance of strong product-market fit. Yet, much of this activity is incentive-driven rather than organic.
Participants, particularly sophisticated users, optimize for yield. They allocate capital where rewards are highest and withdraw it just as quickly when incentives decline. This behavior introduces a critical dynamic: engagement is often rented rather than earned.
The Retention Problem
The most significant challenge emerges when rewards taper off.
Without continuous incentives, many users disengage, leading to:
- Declining liquidity
- Reduced trading activity
- Increased volatility in protocol metrics
This reveals a fundamental issue: liquidity mining does not inherently create loyalty. It attracts capital, but it does not guarantee that capital will stay.
In traditional terms, this is equivalent to acquiring users who churn as soon as discounts disappear.
Token Emissions as a Cost
While liquidity mining avoids immediate cash expenditure, it is not free. Token emissions represent a form of cost—one that is often less visible but equally impactful.
Key considerations include:
- Dilution: Increased token supply can suppress long-term value
- Sell pressure: Recipients frequently sell rewards, affecting price stability
- Sustainability: Continuous emissions may be required to maintain engagement
In effect, protocols are paying for growth, just as traditional companies do—only the cost is denominated in equity-like instruments rather than cash.
When Liquidity Mining Works
Despite its limitations, liquidity mining can be highly effective under the right conditions. It performs best when:
- The underlying product delivers genuine utility
- Incentives are used to accelerate, not replace, organic adoption
- Token design aligns long-term participation with protocol success
In these cases, liquidity mining acts as a catalyst—helping a protocol reach critical mass before transitioning to more sustainable growth drivers.
Toward Sustainable Incentive Design
The next evolution of liquidity mining lies in improving retention and reducing reliance on continuous emissions. Emerging approaches include:
- Time-weighted rewards that favor long-term participation
- Revenue-sharing mechanisms that tie rewards to real protocol income
- Dynamic incentive systems that adjust based on user behavior and market conditions
These models aim to shift the focus from short-term attraction to long-term alignment.
Finale
Liquidity mining is not a flawed concept—it is a misinterpreted one. At its essence, it is a sophisticated form of customer acquisition, optimized for decentralized systems and powered by token economics.
The challenge is not whether to use it, but how to use it responsibly. Protocols that recognize liquidity mining as a cost of growth—and design accordingly—are far more likely to convert temporary participation into lasting ecosystems.
Because in the end, incentives can bring users in. Only real value makes them stay.
REQUEST AN ARTICLE

Rising oil prices amid risks to shipping through the Strait of Hormuz have strengthened global inflation expectations. According to the Pentagon, clearing the strait could take at least six months, sustaining uncertainty in commodity markets and weighing on risk assets overall — a category that typically includes cryptocurrencies.
At the same time, institutional demand for Bitcoin remains resilient. As of 20 April, spot ETFs recorded five consecutive days of inflows, with daily volumes around $238 million, while Strategy (formerly MicroStrategy) executed its largest purchase since late 2024, acquiring 34,164 BTC worth $2.54 billion. However, analysts at CryptoQuant note that the current price momentum is being driven primarily by the perpetual futures market, while spot demand is declining. A similar pattern was observed in January ahead of the correction from $98,000, suggesting that the market remains vulnerable.
Technical picture
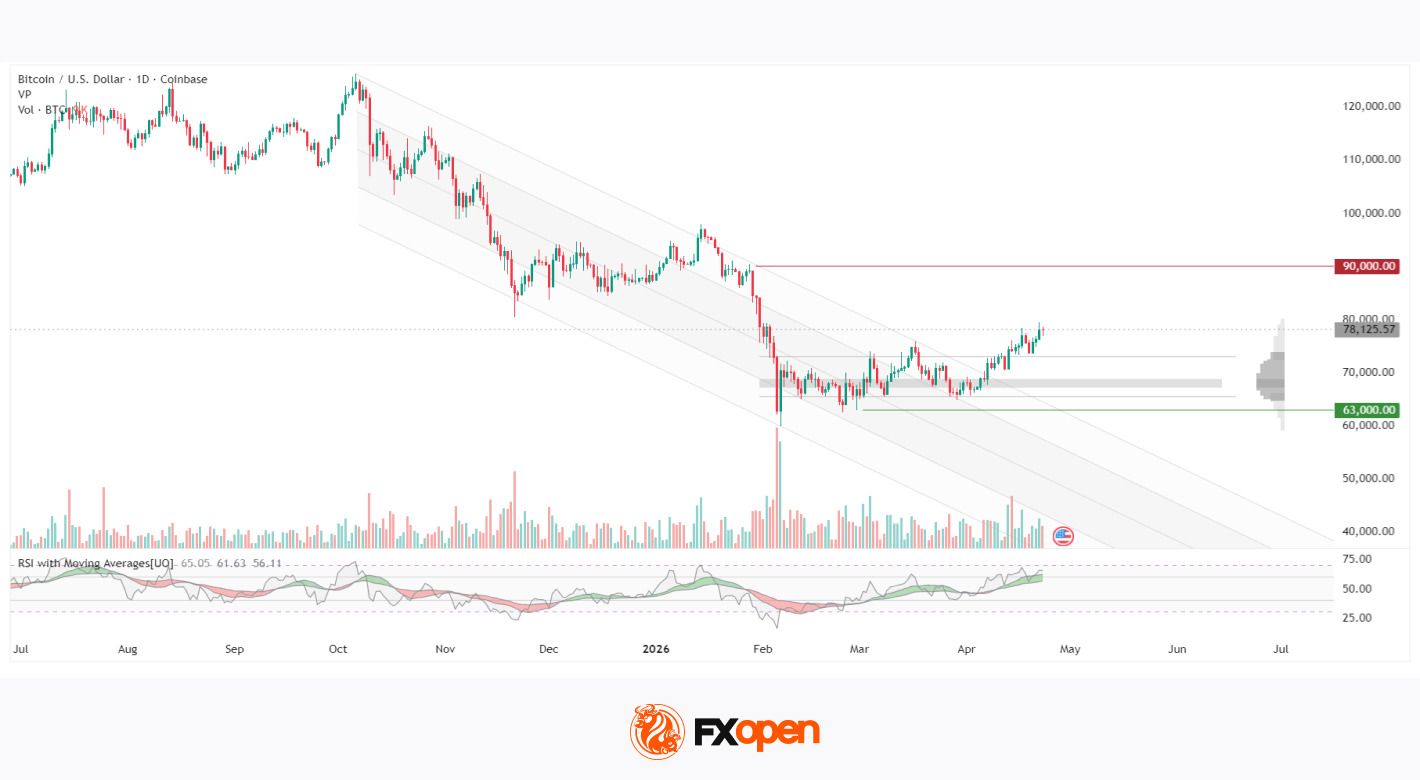
Since October 2025, Bitcoin has been trading within a descending parallel channel, with the lower boundary tested in February 2026 when the price fell to around $60,000 amid exceptionally high trading volumes typical of a selling climax. Following this low, the market shifted into recovery mode, and in the first half of April 2026, the price broke above the upper boundary of the channel and managed to hold above it.
At the same time, the price moved beyond the upper edge of the horizontal volume zone between $65,000 and $73,000, where most trading activity had been concentrated in previous months. This zone now lies below current levels. The nearest resistance is seen at $90,000, while support stands at $63,000. The RSI with moving averages shows readings of 64 / 61 / 56 — the oscillator remains above both moving averages, which are trending upwards, indicating ongoing buying pressure. Vertical volume in recent sessions remains moderate, with no clear signs of acceleration.
Summary
The horizontal volume zone has shifted below the current price, signalling a structural tilt in favour of buyers. The RSI remains above its moving averages, confirming bullish pressure, though recent trading volumes do not yet indicate a strong acceleration in momentum. Resistance at $90,000 and support at $63,000 define the key range within which the next phase of market structure is likely to develop.
FXOpen offers the world’s most popular cryptocurrency CFDs*, including Bitcoin and Ethereum. Floating spreads, 1:2 leverage — at your service (additional fees may apply). Open your trading account now or learn more about crypto CFD trading with FXOpen.
*Important: At FXOpen UK, Cryptocurrency trading via CFDs is only available to our Professional clients. They are not available for trading by Retail clients. To find out more information about how this may affect you, please get in touch with our team.
This article represents the opinion of the Companies operating under the FXOpen brand only. It is not to be construed as an offer, solicitation, or recommendation with respect to products and services provided by the Companies operating under the FXOpen brand, nor is it to be considered financial advice.

The Best Financial Strategies by Income Level: $35k, $75k, $100k+

Ukraine-Russia war latest: Kyiv says it killed 12 FSB officers in drone swarm attack on Russian command centre
DB Realty, Unitech stocks rose after top executives granted bail in 2G scam
Manchester United reach agreement with Casemiro over contract clause amid transfer speculation

US brings back mandatory military draft registration

Steven Gerrard disagrees with Gary Neville over ‘shock’ Chelsea and Arsenal claim | Football


-

 Sports7 days ago
NWFL Suspends Two Players Over Post-Match Clash in Ado-Ekiti
-

 Fashion7 days ago
Weekend Open Thread: Theodora Dress
-

 Politics7 days ago
Palestine barred from entering Canada for FIFA Congress
-
Entertainment4 days ago
NBA Analyst Charles Barkley Chimes in on Ice Spice McDonald’s Fiasco
-

 Tech5 days ago
Auto Enthusiast Scores Running Tesla Model 3 for Two Grand and Turns It Into Bare-Bones Go-Kart
-

 Business5 days ago
Powerball Result April 18, 2026: No Jackpot Winner in Powerball Draw: $75 Million Rolls Over
-

 Politics5 days ago
Zack Polanski demands ‘council homes not luxury flats for foreign investors’
-

 Crypto World6 days ago
Russia Pushes Bill to Criminalize Unregistered Crypto Services
-

 Politics4 days ago
Gary Stevenson delivers timely reminder to register to vote as deadline TODAY
-

 Business2 days ago
Rolls-Royce Voted UK’s Most Iconic Trade Mark as IPO Register Hits 150
-

 Politics2 days ago
Disabled people challenge government SEND proposals over segregation concerns
-

 Politics2 days ago
Making troops accountable for war crimes threatens US alliance, ex-SAS colonel warns
-

 Crypto World6 days ago
Russia Introduces Bill To Criminalize Unregistered Crypto Services
-

 Politics2 days ago
Starmer handler McSweeney to be dragged from shadows by Foreign Affairs Committee
-
Politics2 days ago
Wings Over Scotland | How To Get Away With Crimes
-

 Politics2 days ago
Zack Polanski responds to home secretary’s taser threat
-
 Crypto World5 days ago
Kelp DAO rsETH Bridge Hack Drains $292M as DeFi Losses Top $600M in Two Weeks
-

 Politics2 days ago
‘Iran is still a nuclear threat’
-

 Crypto World2 days ago
New York sues Coinbase, Gemini over prediction market offerings
-
 Sports7 days ago
Kevin Kisner apologizes for Masters criticism: ‘I crossed the line’
You must be logged in to post a comment Login