
Crypto World
Bernstein Says IREN Pivot to AI Cloud Could Drive $3.7B Revenue

IREN could become the next major Bitcoin miner to transition into AI infrastructure following its multi-billion-dollar deal with Microsoft, underscoring a broader shift in mining economics, according to a new research report from Bernstein.
The Bernstein analysts point to IREN’s rapidly expanding AI cloud division, where around 150,000 GPUs are already contracted, supporting an estimated $3.7 billion in annual revenue run rate once fully functional.
A significant portion of this capacity is tied to a long-term agreement with Microsoft, which has committed to using GPU capacity for AI workloads over five years. The deal also includes substantial customer prepayments, helping fund the infrastructure buildout.
In total, IREN’s roughly $5.8 billion GPU investment is largely funded through a combination of Microsoft customer prepayments and GPU-backed financing facilities, alongside additional cash and capital sources, helping keep borrowing costs relatively low.
Bernstein expects this shift to fundamentally reshape the company’s business model.
“IREN will eventually sunset the Bitcoin mining business as it retrofits existing sites to accelerate cloud deployment,” the analysts wrote.
Rather than shutting down operations outright, IREN is repurposing its existing mining infrastructure, particularly in Texas and British Columbia, by replacing ASIC mining rigs with GPUs designed for AI workloads.
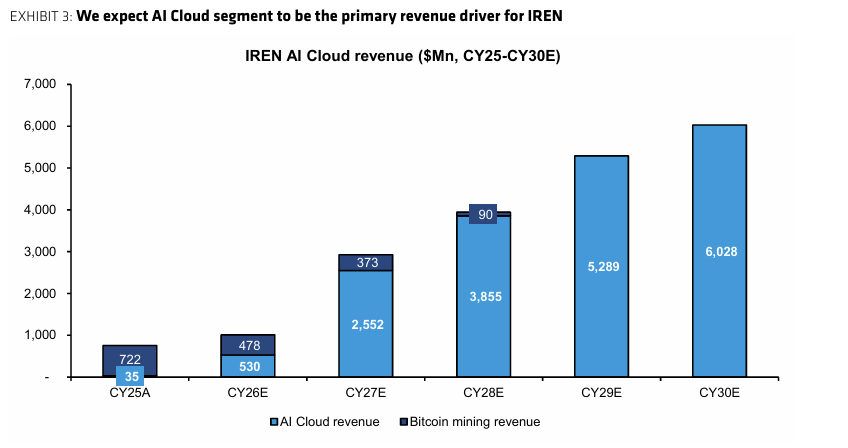
Bernstein expects IREN’s AI cloud revenue to be its primary source of income in the coming years. Source: Bernstein
Monday’s report suggests Bitcoin mining will gradually fade into a legacy segment, with mining revenue declining over time as power capacity is redirected toward higher-margin, contracted AI computing.
IREN is not alone in exploring this pivot. Several mining companies, including TeraWulf and HIVE Digital, have begun reallocating power and capital toward AI and high-performance computing, often alongside their existing Bitcoin mining operations.
Related: AI data center gold rush sparks debate over impact on Bitcoin mining
Bernstein sees nearly 100% upside for IREN stock
Bernstein assigned IREN stock a $100 price target, pointing to significant upside as the company shifts away from Bitcoin mining and toward AI infrastructure.
With the stock currently trading below $50, the target implies a nearly 100% increase from current levels.
The analysts maintained an Outperform rating, even after reducing their previous $125 target, reflecting a more conservative view on dilution and the gradual wind-down of Bitcoin mining.
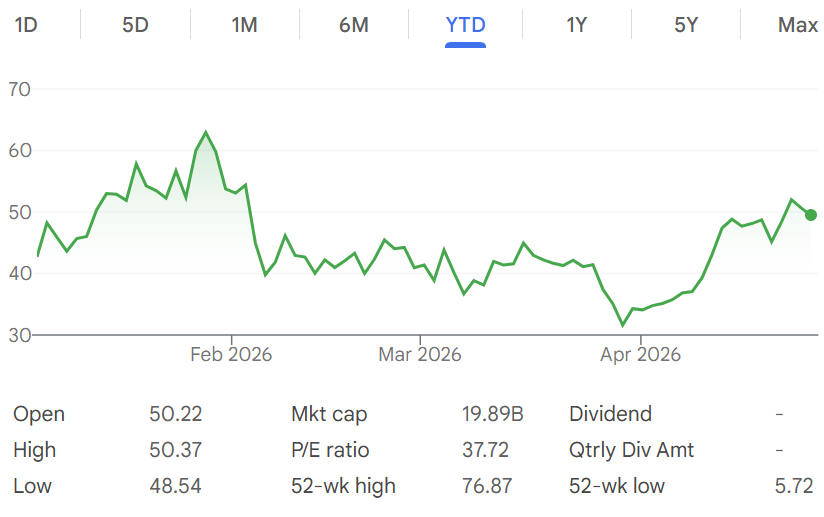
IREN stock. Source: Google Finance
Related: CoreWeave’s $8.5B loan shows how AI is replacing crypto mining finance

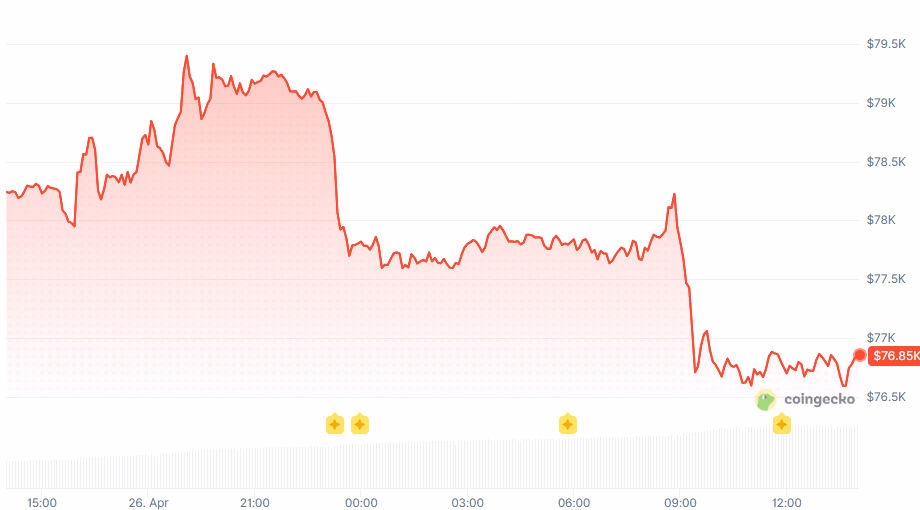
Crude oil jumped as Trump called off Iran peace talks, dragging BTC back below $77,000 and triggering $288 million in long liquidations.
Bitcoin failed at the $80,000 level for the third time this month on Monday, briefly tagging $79,500 before reversing sharply, as a renewed move higher in oil prices amid stalling U.S.-Iran peace talks pushed risk assets into the red ahead of this week’s FOMC decision.
BTC last changed hands at around $76,800 per CoinGecko, down 1.8% over the past 24 hours but still up 1.2% on the week. Ether (ETH) led losses among the majors, falling 3.3% to $2,287. Meanwhile, SOL traded near $84, down 3%, XRP at $1.39, down 2.8%, and BNB at $623, down 2%.

Total crypto liquidations reached $435 million over the past 24 hours, according to CoinGlass, with more than 108,000 traders liquidated.
Stalled Peace Talks
President Donald Trump on Sunday called off a planned Pakistan trip by two senior U.S. negotiators, stalling a fresh round of peace talks even as Iran reportedly sent Washington a new proposal over the weekend. The Strait of Hormuz remains under a U.S. naval blockade.
The risk-off backdrop is unfolding two days before the April 28-29 FOMC meeting. CME FedWatch puts the odds of a rate hold at 100%, with the federal funds rate expected to remain in the 3.50-3.75% range. April carries no fresh dot plot or Summary of Economic Projections, leaving Chair Jerome Powell’s tone the focal point for traders. The Bureau of Economic Analysis releases its advance Q1 GDP estimate on Thursday, with PCE and the Employment Cost Index expected the same morning.
ETFs
U.S. spot Bitcoin ETFs pulled in $823.7 million in net inflows during the week ending April 24, the fourth consecutive positive week, per SoSoValue. April month-to-date inflows now exceed $2.4 billion, nearly double March’s total. Total BTC ETF AUM stood at $102.64 billion as of Friday, with the products holding 1,322,094 BTC, or roughly 6.3% of the circulating supply.
Spot Ether ETFs added $155 million for the week, their third consecutive positive week, while spot Solana ETFs added $9.4 million and spot XRP ETFs added $15.7 million.
Elsewhere
Strategy disclosed its fourth consecutive weekly Bitcoin purchase, adding 3,273 BTC for $255 million at an average price of $77,906, with the latest fill now sitting roughly 1.4% above spot. Total holdings stand at 818,334 BTC, acquired for roughly $61.81 billion at an average cost basis of $75,537, with chairman Michael Saylor citing a 9.6% year-to-date BTC yield. The buy follows last week’s $2.54 billion accumulation of 34,164 BTC, the firm’s largest since 2024.
In DeFi, Aave founder Stani Kulechov said the DeFi United recovery fund has reached the level needed to fully re-collateralize rsETH following the April 18 KelpDAO bridge exploit, subject to pending governance votes. Consensys and Ethereum co-founder Joe Lubin committed up to 30,000 ETH, while the Solana Foundation said it would lend USDT on Aave for the first time.
Outlook
With oil at multi-week highs, and four mega-cap tech names (Microsoft, Alphabet, Meta, Amazon) reporting Wednesday evening after the FOMC decision, the path of least resistance for crypto this week runs through the macro tape rather than crypto-native catalysts.
Crypto World
Western Union (WU) gears up stablecoin launch to settle global transactions without SWIFT

Western Union (WU) is preparing to roll out a stablecoin strategy that could reshape how the 175-year-old money-transfer company settles payments across its global network.
CEO Devin McGranahan said on the company’s first-quarter earnings call that Western Union’s U.S. dollar stablecoin (USDPT) is in the final stages of readiness and is expected to launch next month. The firm announced in October that the digital dollar will run on Solana (SOL) and will be issued with federally chartered crypto bank Anchorage Digital.
Western Union plans to use the stablecoin first as an alternative to the interbank settlement rails it uses today to move money between the company and its agents.
“We are not originally launching [USDPT] as consumer-facing,” McGranahan said. “We are launching it as an alternative to the interbank SWIFT settlement network that we use today.”
That matters, he said, because Western Union’s business still depends on legacy banking systems that settle only on business days and can take two or three days in some markets. Stablecoins could allow the company to settle with partners in real time, including over weekends and holidays, while reducing capital tied up in the system, he added.
The second piece of the company’s strategy is the Digital Asset Network (DAN), which lets crypto wallet companies offer Western Union as a cash-out option. Through that network, wallet users will be able to convert digital assets into local currency through Western Union’s retail footprint, McGranahan said.
The company said its partner pipeline represents tens of millions of crypto wallets globally.
Western Union also plans to launch a Stable Card, expected later this year. It will let customers hold funds in stablecoins and spend through card networks. McGranahan said the card could be useful in inflation-sensitive markets where customers want access to U.S. dollar-denominated value with everyday spending utility.
“We expect to begin rolling this out across dozens of markets with an initial wave targeted for later this year,” he said.
Western Union’s stablecoin push comes as its core remittance business faces pressure, with rival fintechs and crypto payments firms increasingly using blockchain tech for cross-border payments. MoneyGram, for example, is looking to Circle’s USDC stablecoin, while Stripe launched its own stablecoin infrastructure with a payments-focused chain Tempo.
Read more: DoorDash is bringing stablecoin payments to masses with Stripe-backed blockchain

TLDR
- Solana Foundation confirmed that its core developer teams selected Falcon as a post-quantum digital signature solution.
- Anza and Jump Crypto’s Firedancer independently agreed on adopting Falcon for future network protection.
- Solana developers have already started building and testing early versions of Falcon implementations.
- The foundation stated that current quantum computing risks remain distant, but migration plans are ready.
- Solana outlined a phased roadmap that includes research, wallet updates, and eventual network migration.
Solana Foundation detailed a plan to address future quantum computing risks and protect network security. The foundation confirmed that core developers aligned on a post-quantum signature standard. It said the threat remains distant, yet teams have prepared migration strategies.
Solana Aligns Core Teams on Falcon Quantum-Resistant Signatures
The Solana Foundation said its core teams selected Falcon as a post-quantum digital signature scheme. Anza and Jump Crypto’s Firedancer reached the same conclusion through independent technical reviews. The foundation stated that both teams have started building early Falcon implementations for testing.
The foundation said Solana developers examined performance tradeoffs before selecting Falcon for integration. The network’s high-speed design requires low latency and efficient cryptography. However, developers concluded that Falcon can operate within existing technical limits without harming throughput.
The foundation said it will continue research and testing before any protocol change. It added that developers understand migration steps and maintain readiness for deployment. “Quantum is still years away,” the foundation said in its blog update.
Roadmap Covers Wallet Migration and Ecosystem Tools
Solana outlined a phased roadmap for introducing post-quantum protections across the network. The plan includes research on Falcon and other cryptographic options. It also covers potential deployment for new wallets if quantum risks increase.
The foundation said developers could introduce post-quantum schemes for newly created wallets first. Later, teams would migrate existing wallets through planned updates. The foundation stated that such a transition would remain manageable under the current infrastructure.
The blog post also referenced ecosystem work that already supports quantum resistance. Blueshift launched its Winternitz Vault primitive on Solana more than two years ago. The foundation said Google Quantum AI recently cited this implementation in research materials.
The foundation explained that Winternitz Vault operates as a quantum-resistant primitive on chain. It allows users to store assets with alternative cryptographic safeguards. Developers have maintained the tool live on Solana without protocol disruption.
Solana developers stated that they will monitor advances in quantum computing research. They will adjust timelines based on scientific progress and industry benchmarks. The foundation emphasized that no immediate network changes are scheduled.
The foundation said internal testing of Falcon implementations will continue across both core teams. Anza and Firedancer engineers will refine performance benchmarks during development cycles. The foundation confirmed that deployment would follow clear governance processes.


- Pudgy Penguins (PENGU) price touched $0.010 amid double-digit gains.
- The token surged as the Pudgy Penguins floor price pumped.
- Other non-fungible tokens also soared, including the Bored Ape Yacht Club.
Pudgy Penguins’ native PENGU token is up double digits in the past 24 hours, riding high on skyrocketing floor prices to touch three-month highs.
This surge comes amid notable price increases in the Pudgy Penguins NFT, with other tokens related to the sector also experiencing significant gains.
However, an uptick for Bitcoin and Ethereum fizzled on Monday, a scenario that puts the tokens’ prices in danger of retreating amid profit-taking.
Pudgy Penguins soars 14% amid NFT price gains
Data shows top non-fungible token collections are experiencing a remarkable resurgence, with floor prices extending their upside momentum.
Pudgy Penguins currently leads the charge as its floor price climbs above 5 ETH, with over 20% in weekly gains.
Market data highlights this momentum, with over 20 sales and nearly 1,000 ETH in trading volume over the past seven days.
The Bored Ape Yacht Club (BAYC) NFT boosts similar metrics and shows an 81% spike in floor price over the last 30 days.
Yet, this optimism contrasts with contracting overall NFT market participation.
Global sales, transactions, and active users have nearly halved since February, even as average sale prices have more than doubled.
This divergence suggests a concentration of capital among high-value collections like Pudgy Penguins, potentially signaling selective bullishness rather than broad recovery.
Notably, PENGU price is up 40% over the past week, and the 14% gain in the last 24 hours has pushed it to above $0.010 for the first time since late January.
Pudgy Penguins is in double digits up year-to-date.
Pudgy Penguins price analysis
Analysts attribute the NFT rally primarily to surging cryptocurrency prices, with Bitcoin (BTC) recently touching $80,000 and Ethereum (ETH) reaching $2,400.
The broader market sentiment looks to have amplified demand for top-tier NFTs, where Pudgy Penguins has stood out with elevated transaction counts accompanying its price climb.
In the market, surging floor prices typically reflect strong conviction, and the opposite shows amid declining floor prices.
PENGU gains mirror Pudgy Penguins’ NFT momentum, and the upmove lifts bulls above the $0.008 supply zone.
The surge to above $0.010 makes the 100-day and 50-day moving averages key support levels at $0.0082 and $0.007.

Among technical indicators to note is the Relative Strength Index (RSI) that currently hovers above 70, signalling overbought conditions.
Traders may need to watch out for NFT market fatigue or a significant BTC pullback.
If this happens, PENGU price could test lower support levels, including Feb 6 low of $0.0052.
On the flipside, the moving averages hint at a potential golden cross, with price likely to extend towards the YTD peak around $0.014.
TLDR
- Shiba Inu added 24000 new wallets between April 20 and April 27, 2026.
- The total number of SHIB holders surpassed 1.585 million, reaching a new high for 2026.
- On April 25, the network recorded its largest daily increase with 10718 new holders.
- Shibarium has processed more than 1 billion total transactions since its launch.
- The team confirmed the updated wallet and transaction data on April 27, 2026.
Shiba Inu (SHIB) recorded sharp user growth and network activity between April 20 and April 27, 2026. The team reported 24,000 new wallets during the period, pushing total holders above 1.585 million. At the same time, Shibarium processed more than 1 billion transactions, marking a new network record.
SHIB Wallet Count Climbs to 1.585 Million
Shiba Inu’s team shared updated wallet data on April 27 through its official X account. The update confirmed that SHIB holders increased by 24,000 wallets within one week. As a result, the total number of SHIB wallets surpassed 1.585 million, reaching a new high for 2026.
The data showed the largest daily rise occurred on April 25. On that day, the network added 10,718 new holders, which marked the strongest daily growth this year. The team stated, “The ecosystem continues to expand as new users join the network each day.”
Earlier in the week, wallet growth began to accelerate from April 20. The steady rise continued through April 24 before the sharp spike on April 25. This pattern reflected rising participation during the recent crypto market rebound.
After the peak day, growth levels moderated but remained positive. On April 26, the network added 1,040 new holders. On April 27, it recorded another 1,100 new wallets, according to the team’s update.
These additions brought the cumulative holder count to its current level. The team described the increase as a continuation of rising engagement across the ecosystem. The figures reflect on-chain wallet data recorded during the reporting period.
Shibarium Surpasses 1 Billion Transactions
Shibarium also reached a new usage milestone during the same period. The layer 2 network processed more than 1 billion transactions, according to the shared data. This achievement places Shibarium among networks with high cumulative activity counts.
The team confirmed the milestone while outlining recent network statistics. It stated, “Shibarium has now crossed 1 billion total transactions.” The update linked the transaction growth to expanding network usage.
Transaction volumes increased as wallet numbers climbed during the week. The network handled daily transfers that contributed to the cumulative total. Each processed transaction is added to the overall count tracked on-chain.
Shibarium operates as Shiba Inu’s layer 2 scaling solution. The network supports faster transactions and lower fees compared to the main Ethereum chain. Developers continue to build and deploy projects within the ecosystem.
The 1 billion transaction mark reflects total processed transfers since launch. The data covers all confirmed transactions recorded on the network ledger. The team released the figures alongside updated holder statistics on April 27, 2026.
The latest wallet additions and transaction totals represent the most recent verified data. Shibarium’s cumulative transaction count now stands above 1 billion as of April 27. Total SHIB wallet addresses exceed 1.585 million based on on-chain records.
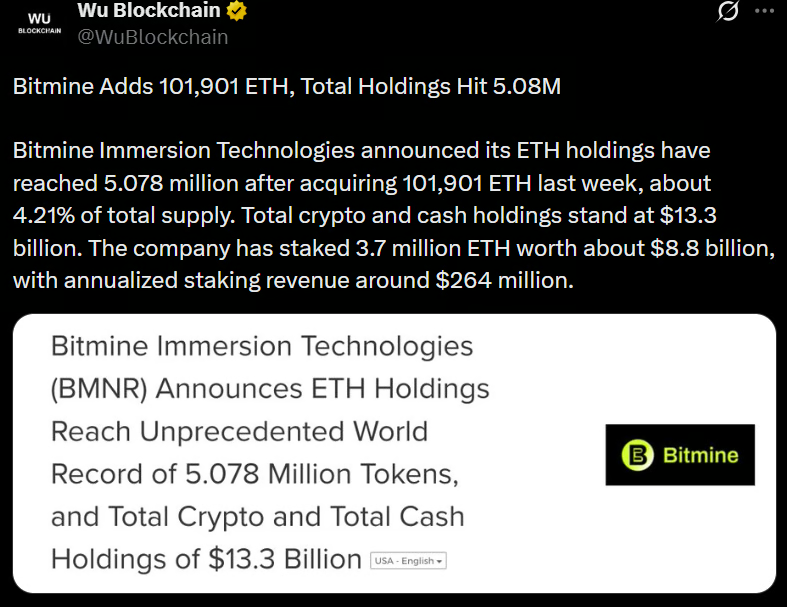
BitMine Immersion Technologies, the Ether treasury company backed by Fundstrat’s Tom Lee, has expanded its ETH holdings for the second time in as many weeks, even as large unrealized losses underscore the strategy’s risks.
The company said Monday it purchased an additional 101,901 Ether last week, bringing its total holdings to roughly 5.08 million ETH. Its combined crypto and cash reserves now stand at about $13.3 billion.
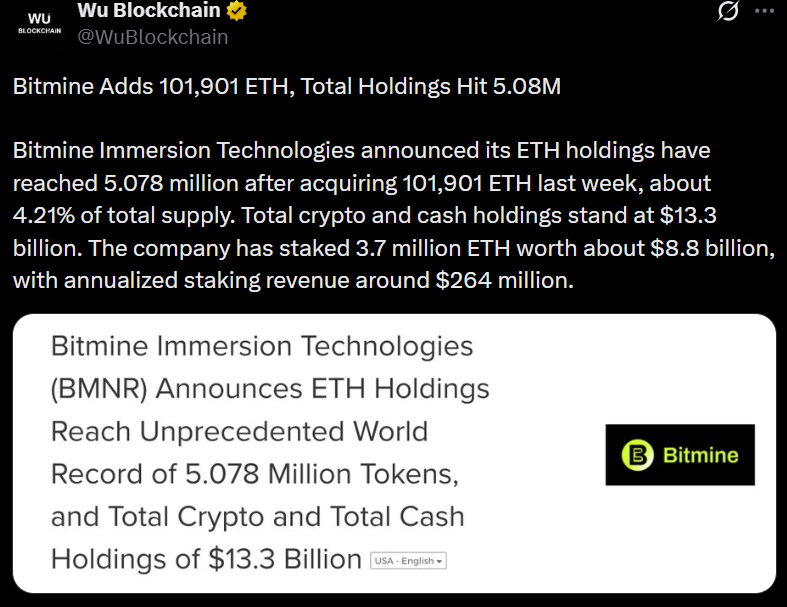
Source: Wu Blockchain
The latest acquisition follows a purchase of 101,627 ETH a week earlier, which was the company’s largest accumulation since December.
Despite the aggressive buying, BitMine is sitting on more than $6.5 billion in unrealized losses, based on total investments of approximately $17.6 billion, highlighting the impact of recent volatility in Ether prices.
The share price of the NYSE-listed BMNR stock is down more than 20% year-to-date, according to Yahoo Finance data.
Still, the company is generating yield on a portion of its holdings. BitMine has staked roughly 3.7 million ETH, allowing it to earn rewards for helping secure the Ethereum network and validate transactions, a strategy that provides a steady income stream even during price downturns.
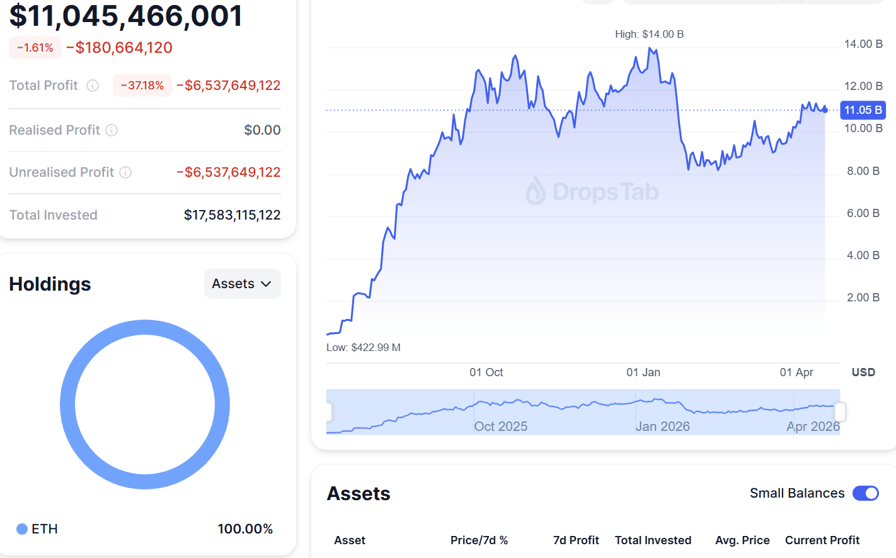
BitMine’s unrealized losses on its ETH treasury have topped $6.5 billion. Source: Dropstab
Related: Crypto Biz: Same players, bigger bets as crypto eyes a rebound
Ether, crypto markets show signs of stabilization
BitMine’s large purchases come as the broader crypto market shows early signs of stabilizing after months of declines through March.
Ether rebounded above $2,400 last week after falling to a low near $1,800 earlier this year, according to TradingView data. Despite the recovery, the second-biggest crypto by market cap remains down roughly 23% year-to-date.
The rebound mirrors a broader uptick across equities and other risk assets in recent weeks, suggesting improving investor sentiment.
However, the volatility underscores the challenges facing crypto treasury players. Companies that accumulate large digital asset reserves are highly exposed to price swings, which can lead to significant unrealized losses during downturns, even as they continue buying.
While strategies like staking can generate yield, they often do little to offset large drawdowns in asset value, leaving balance sheets sensitive to market cycles.
Related: Michael Saylor’s Strategy adds 3.2K Bitcoin at nearly $78K per BTC
TLDR
- Strategy purchased 3,273 Bitcoin for $255 million at an average price of $77,906 per coin.
- The latest acquisition increased Strategy’s total holdings to 818,334 BTC.
- The company funded the purchase by selling 1,451,601 MSTR shares through its at-the-market program.
- Strategy’s Bitcoin holdings are now valued at about $63.7 billion at current market prices.
- The company’s position has returned to profit with an estimated gain of $1.9 billion.
Strategy expanded its Bitcoin holdings with a new 3,273 BTC purchase worth $255 million. The acquisition lifted total reserves to 818,334 BTC and returned the company to profit. However, Peter Schiff challenged Michael Saylor’s $1 million Bitcoin forecast and questioned the accumulation strategy.
Strategy Expands Bitcoin Holdings With $255M Purchase
Strategy confirmed it purchased 3,273 Bitcoin for about $255.0 million at an average price of $77,906. The company increased its total holdings to 818,334 BTC as of April 26, 2026. It acquired the entire stash for $61.81 billion at an average price of $75,537 per coin.
At current prices near $77,850, the holdings carry a market value of $63.7 billion. This valuation places Strategy at roughly $1.9 billion in profit. Earlier this year, Bitcoin traded below $70,000 and left the company’s position underwater.
Michael Saylor announced the purchase on X and reported a 9.6% Bitcoin Yield year-to-date in 2026. He also released the company’s Form 8-K filing with the U.S. SEC. The filing detailed that Strategy funded the purchase through its at-the-market equity program.
Between April 20 and April 26, 2026, Strategy sold 1,451,601 MSTR shares. The share sales generated $255.0 million in net proceeds after commissions. During the same period, the company sold no preferred stock.
Schiff Challenges $1 Million Bitcoin Prediction
Peter Schiff responded to Saylor’s update and targeted his $1 million Bitcoin forecast. In 2025, Saylor said Bitcoin could reach $1 million if Strategy acquired 5% of the total supply. Schiff argued that current accumulation trends do not support that outlook.
Schiff stated that Strategy now controls about 3.9% of the total Bitcoin supply. He said the company purchased 231,666 BTC since Saylor made the forecast. According to Schiff, similar price reactions to future purchases could push Bitcoin below $60,000 before Strategy reaches 5%.
He wrote that “if the next 231,666 BTC move the market as the last ones did, the price could be under $60,000.” Schiff used this calculation to dispute the $1 million target. He has repeatedly supported gold as an alternative store of value.
Schiff also criticized claims about covering a reported 11.5% yield on STRC with modest Bitcoin growth. He argued that continuous issuance raises the required price increase. He said falling STRC prices could force higher yields and strain the structure.
According to Schiff, selling Bitcoin to cover yields would pressure the market. He warned that such actions could trigger a “death spiral” unless Strategy cancels the dividend. Strategy’s latest Form 8-K filing, dated April 27, 2026, confirms the recent equity-funded purchase.
TLDR
- Bitcoin reached $79,488 before easing to $78,223 as futures activity powered the latest price move.
- CryptoQuant CEO Ki Young Ju said the current Bitcoin rally is driven by derivatives, not strong spot demand.
- On-chain data shows Bitcoin’s 30-day apparent demand metric remains in negative territory.
- Michael Saylor’s firm, Strategy, purchased $255 million in Bitcoin after a $2.54 billion acquisition last week.
- Bitcoin ETFs acquired more than $2.6 billion worth of BTC this month despite weak on-chain demand.
Bitcoin climbed toward two-month highs as derivatives activity powered the latest advance. The asset reached $79,488 before easing to $78,223 during the session. However, CryptoQuant CEO Ki Young Ju said futures markets, not spot demand, drive the current Bitcoin rally.
Bitcoin Rally Fueled by Futures While Spot Demand Stays Weak
Ki Young Ju stated that derivatives traders lead the present move in Bitcoin. He said rising open interest shows traders are increasing leverage across futures markets.
He explained, “This rally is futures-driven,” and he pointed to negative on-chain demand data. CryptoQuant data shows Bitcoin’s 30-day apparent demand metric remains below zero.
Meanwhile, institutional buyers continued acquisitions through direct purchases and exchange-traded funds. Michael Saylor’s firm, Strategy, bought $255 million in Bitcoin after acquiring $2.54 billion last week.
At the same time, Bitcoin ETFs accumulated more than $2.6 billion worth of BTC this month. Yet on-chain metrics did not reflect matching growth in spot-driven demand.
CryptoQuant data showed futures demand in strong positive territory during the same period. However, Ju said bear cycles end only when both spot and futures demand recover together.
He added that current data does not show that alignment. Therefore, the structure behind the Bitcoin rally remains uneven.
Short Squeeze Accelerates Bitcoin Price Surge
On April 23, Bitcoin rose from $76,351 to $79,447 within hours. The move marked a 4.05% increase during that session.
Carmelo Alemán, an on-chain analyst at CryptoQuant, attributed the surge to forced liquidations. He said short traders closed positions rapidly as prices climbed.
Open interest jumped from $24.88 billion to nearly $28 billion during the rally. This rise showed a sharp increase in leveraged futures positions.
Short liquidations exceeded $607.9 million in Bitcoin during that move. Ethereum short liquidations reached $580.9 million in the same period.
Together, short liquidations totaled about $1.19 billion across both assets. In contrast, long liquidations remained just above $111 million combined.
Alemán said the imbalance highlighted strong pressure on bearish traders. As shorts closed, forced buying pushed prices higher.
CryptoQuant data indicated that derivatives activity expanded faster than spot transactions. Therefore, leverage played a central role in the advance.
Ju reiterated that on-chain demand still shows weakness despite price gains. He stated that negative apparent demand contrasts with rising futures exposure.
Bitcoin traded near $78,223 after touching $79,488 earlier in the day. Open interest remained elevated near $28 billion at the latest reading.

Oil prices are sitting in the same chart setup that triggered a 13% drop two weeks ago, but the options market and a deepening supply shock have rewritten the variables that determine whether the drop happens again or fails.
Brent crude trades at $101.39 on April 27, up 2.28% on the day and just below the $107.46 high it rejected on April 23. The pattern that triggered April’s drop is back. But the conditions around it are different.
Bearish Divergence Mirrors the Setup That Crashed Brent Crude 13% in April
Since March 9, Brent crude has traded inside a falling channel, a bearish pattern. Within that channel, the pattern flashing now is the same one that preceded April’s drop.
Between January 29 and April 23, Brent printed a higher swing high in price while the Relative Strength Index (RSI) printed a lower swing high. That is a textbook bearish divergence, where price strength outpaces underlying momentum and often signals a trend reversal.
The precedent is uncomfortable. The same divergence formed between January 29 and April 16. Brent then rolled over and dropped over 13% to a local low of $86.09.
Want more insights like this? Sign up for Editor Harsh Notariya’s Daily Newsletter here.
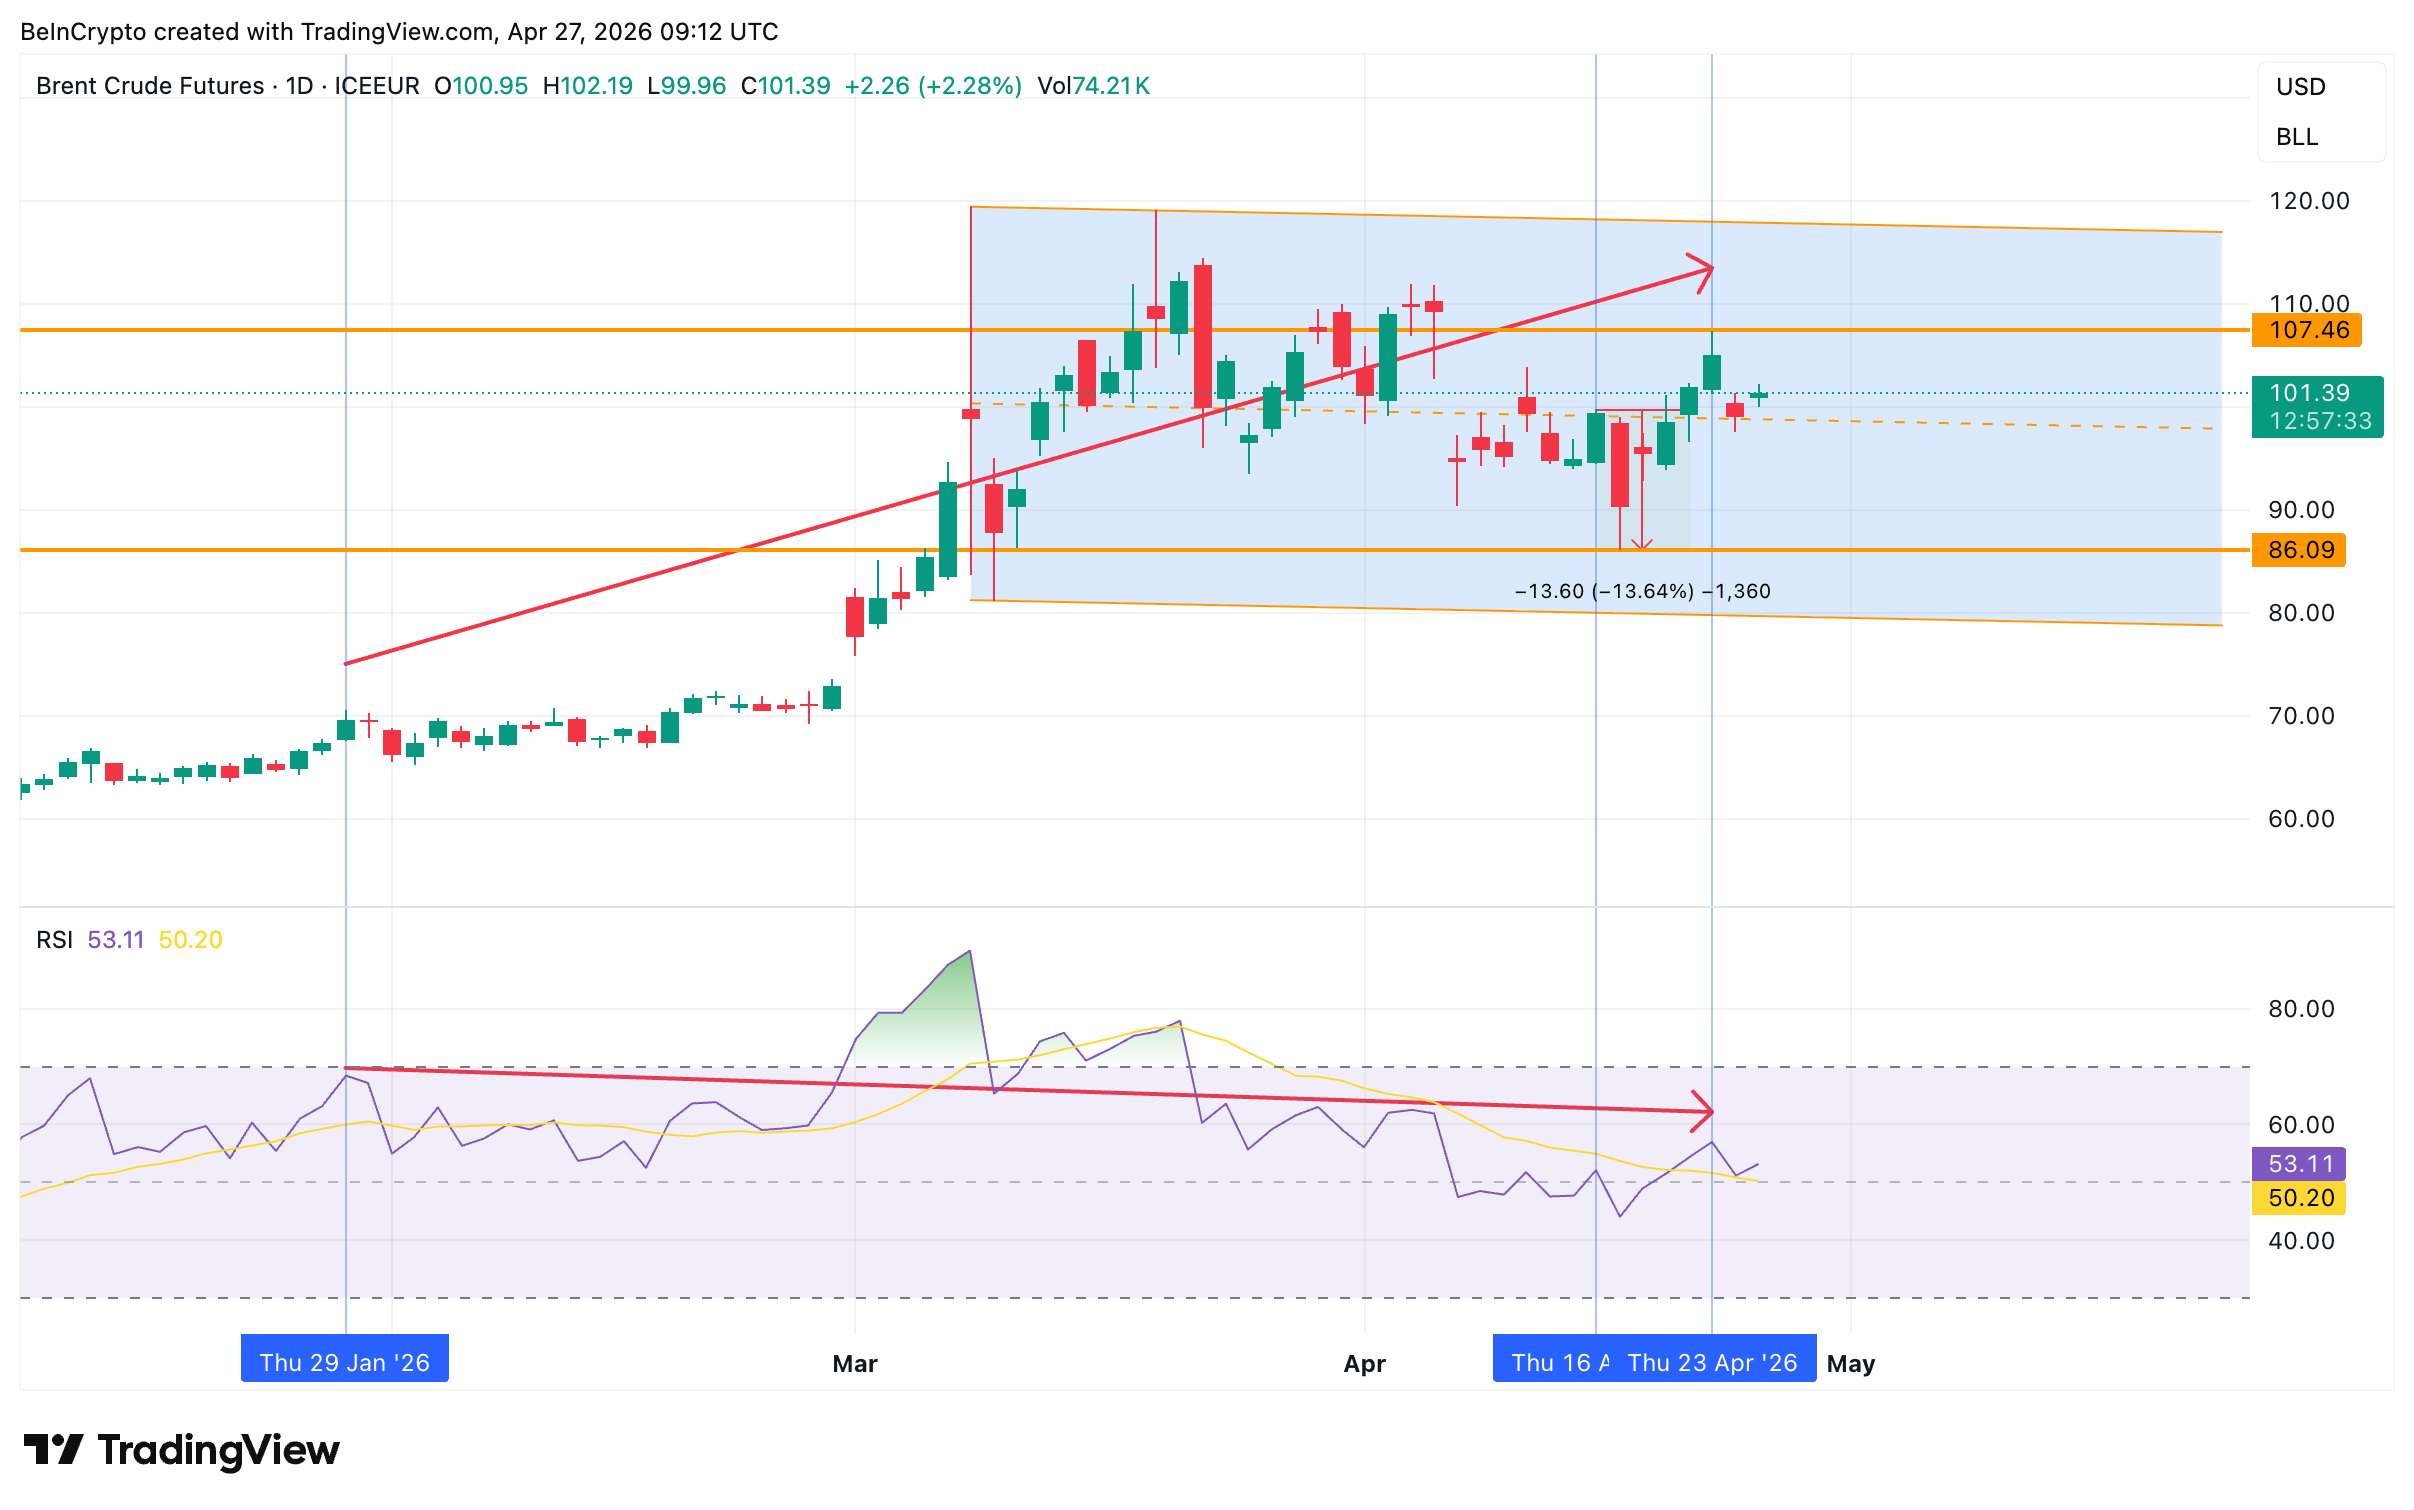
The pattern playing out today is structurally identical, with the same channel, the same momentum failure, and a similar rejection at the upper boundary. If the playbook holds, oil price faces a measured drop back toward the channel floor near $81.72.
Goldman, Inventory Draws, and a Collapsing Put-Call Ratio Disagree With the Chart
The chart says one thing. The options market says another. The United States Brent Oil Fund (BNO), a US-listed exchange-traded fund (ETF) that tracks Brent crude prices, gives a clean window into how options traders are positioning.
On April 16, when the prior bearish divergence flashed, BNO’s volume put-call ratio, a measure of bearish versus bullish bets in daily options flow, sat at 0.18, while its open interest put-call ratio, which measures standing positioning, was 0.25.
Brent then dropped 13%.
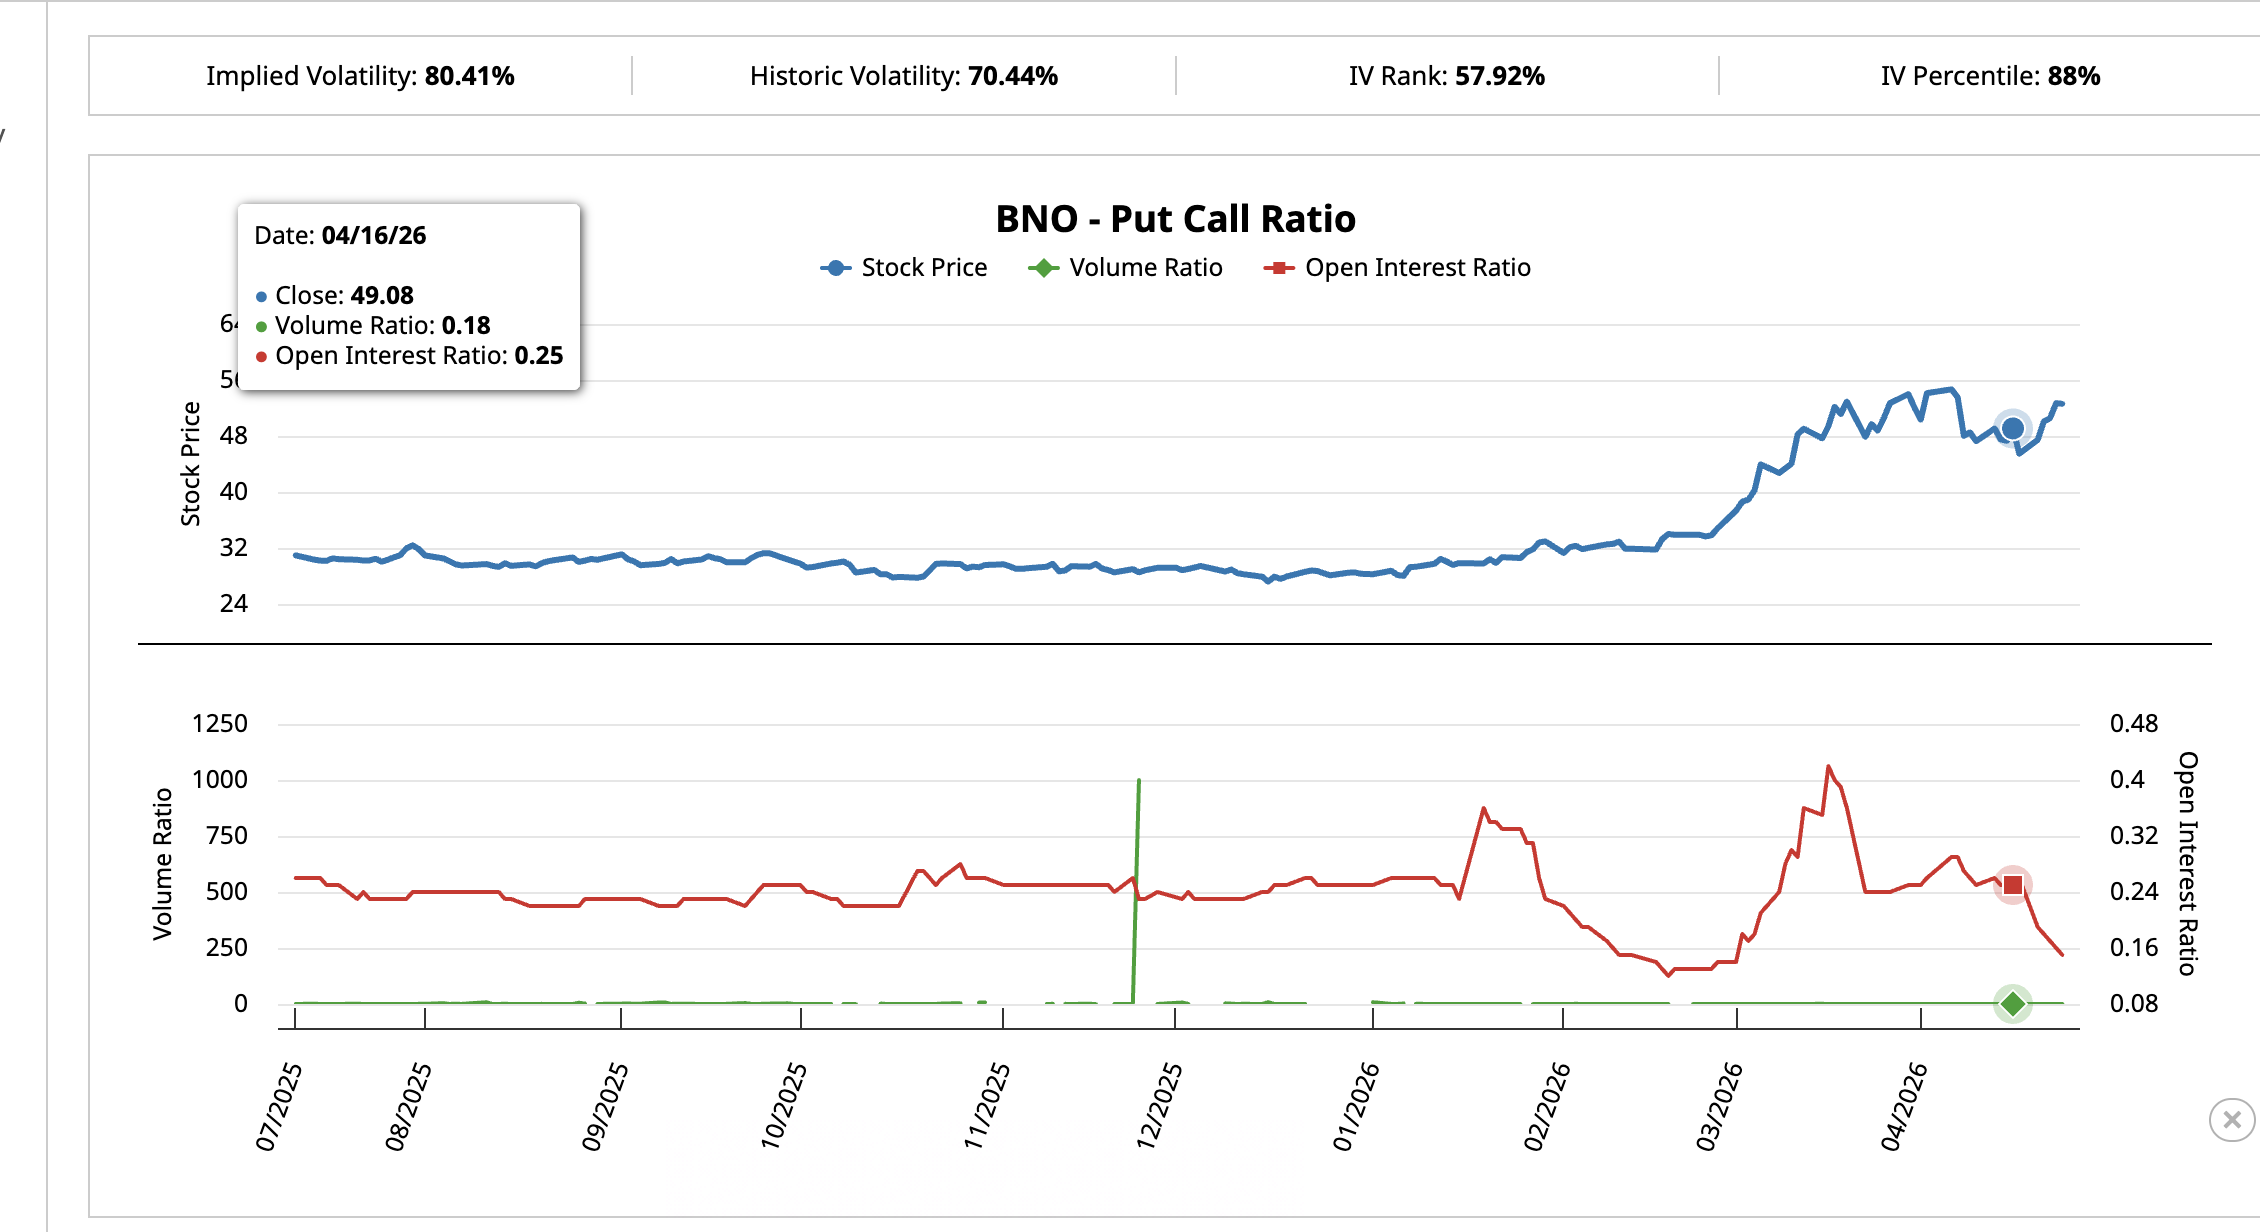
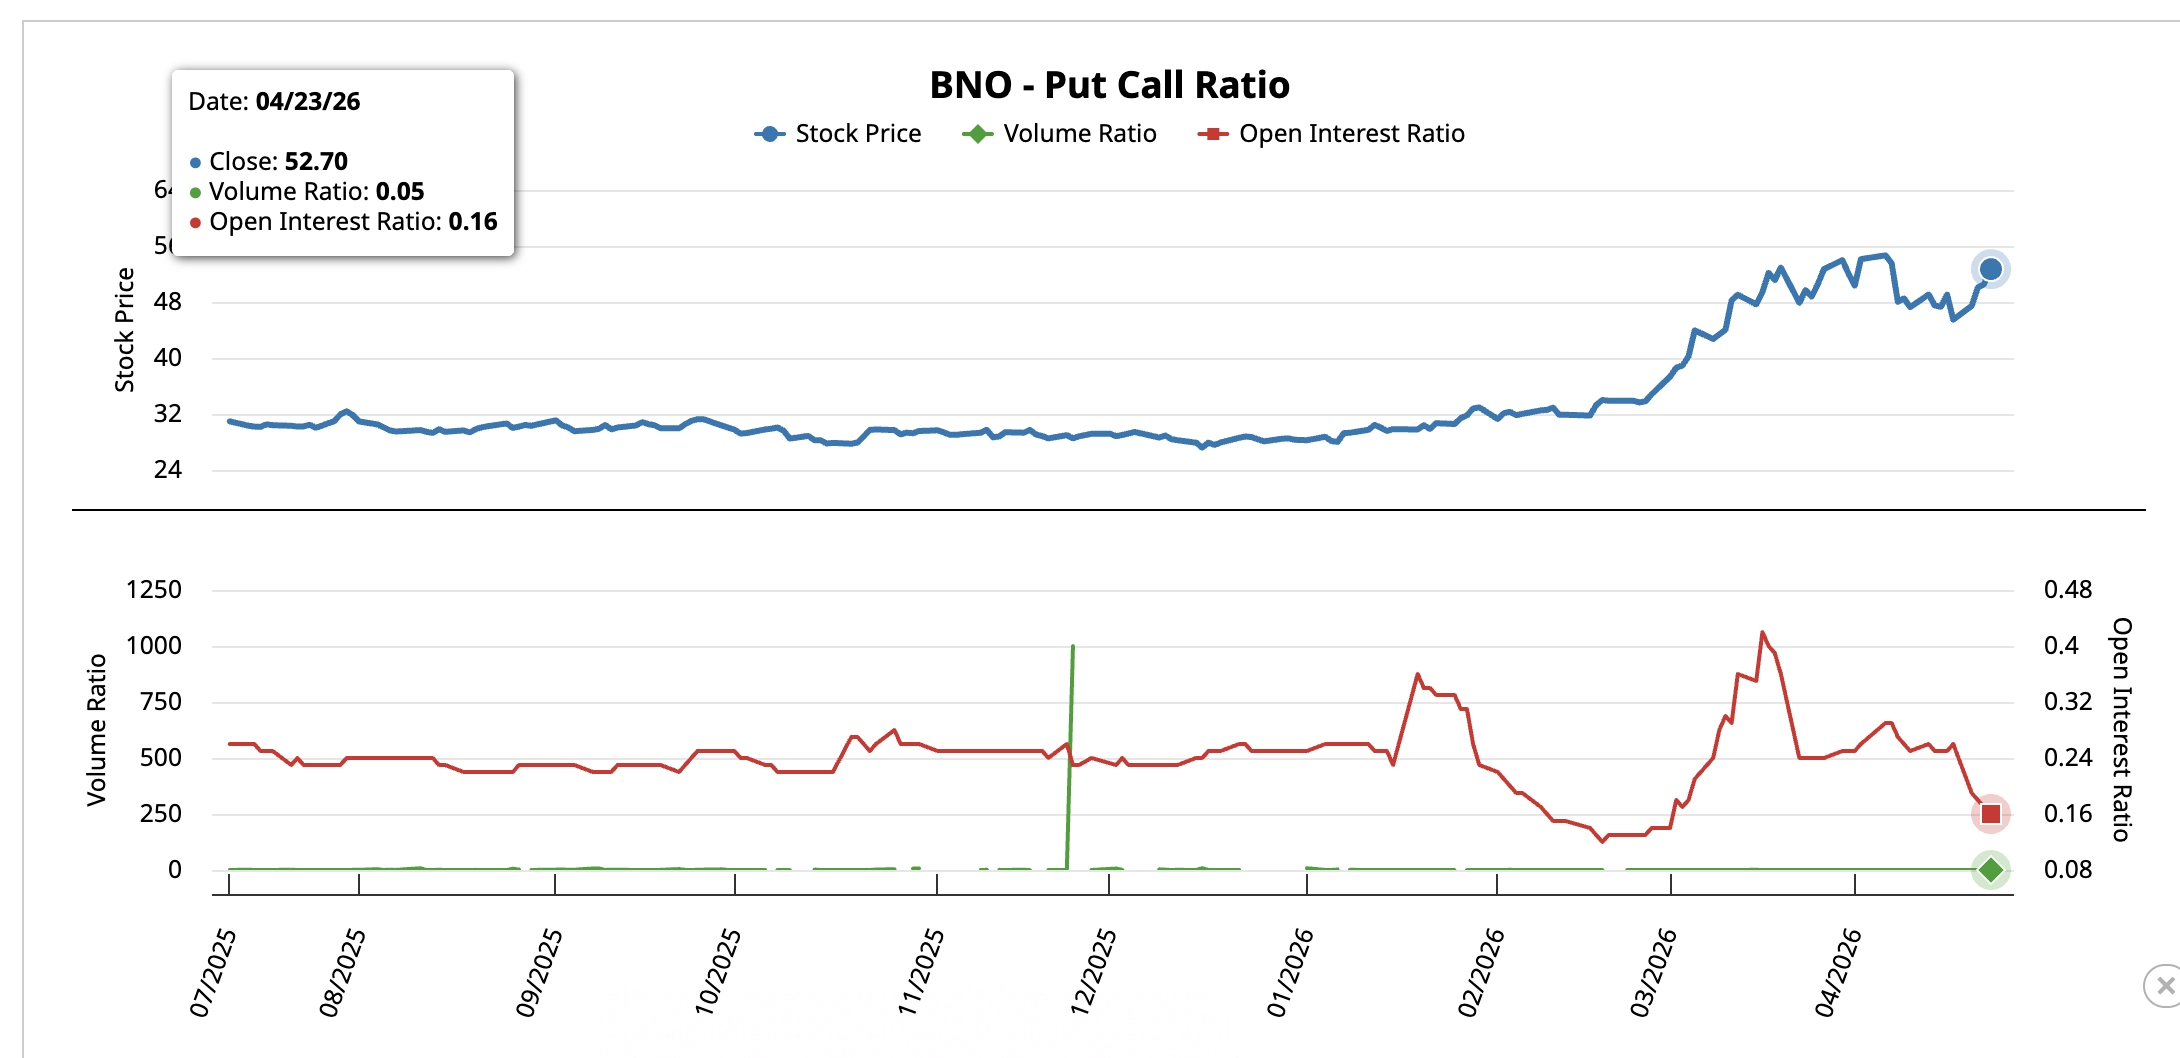
By April 23, when the latest divergence printed, the picture flipped. Volume put-call collapsed to 0.05, and open interest put-call dropped to 0.16, indicating shorts were liquidated and call demand surged.
Implied volatility (IV), the market’s expectation of future price swings, sits at 80.41% with an IV percentile at 88%, signaling traders are pricing a large move ahead.
The supply side explains the bullish positioning. Goldman Sachs raised its Q4 2026 Brent forecast to $90 per barrel from $80 on Monday, citing 14.5 million barrels per day in Persian Gulf production losses and global inventory drawdowns running at 11 to 12 million barrels per day.
That is the structural fuel keeping a bid under oil price, even as the technical picture warns of a drop.
Oil Price Levels Make $99.17 the Trigger, $107.46 the Reversal
The decision sits at $99.17, the 20-day Exponential Moving Average (EMA), where EMA is a trend line that averages price with more weight on recent candles.
On April 13, when oil price lost the 20-day EMA, a 13% drop accelerated within sessions. The same line is now sitting just below the current price.
A daily close above $101.40, the 0.236 Fibonacci level, keeps the bullish path open and points back toward $107.46. A clean break above $107.46 confirms the supply shock thesis. It opens room toward $119.11, the upper channel boundary.
However, a $99.17 loss mirrors the April 13 trigger.
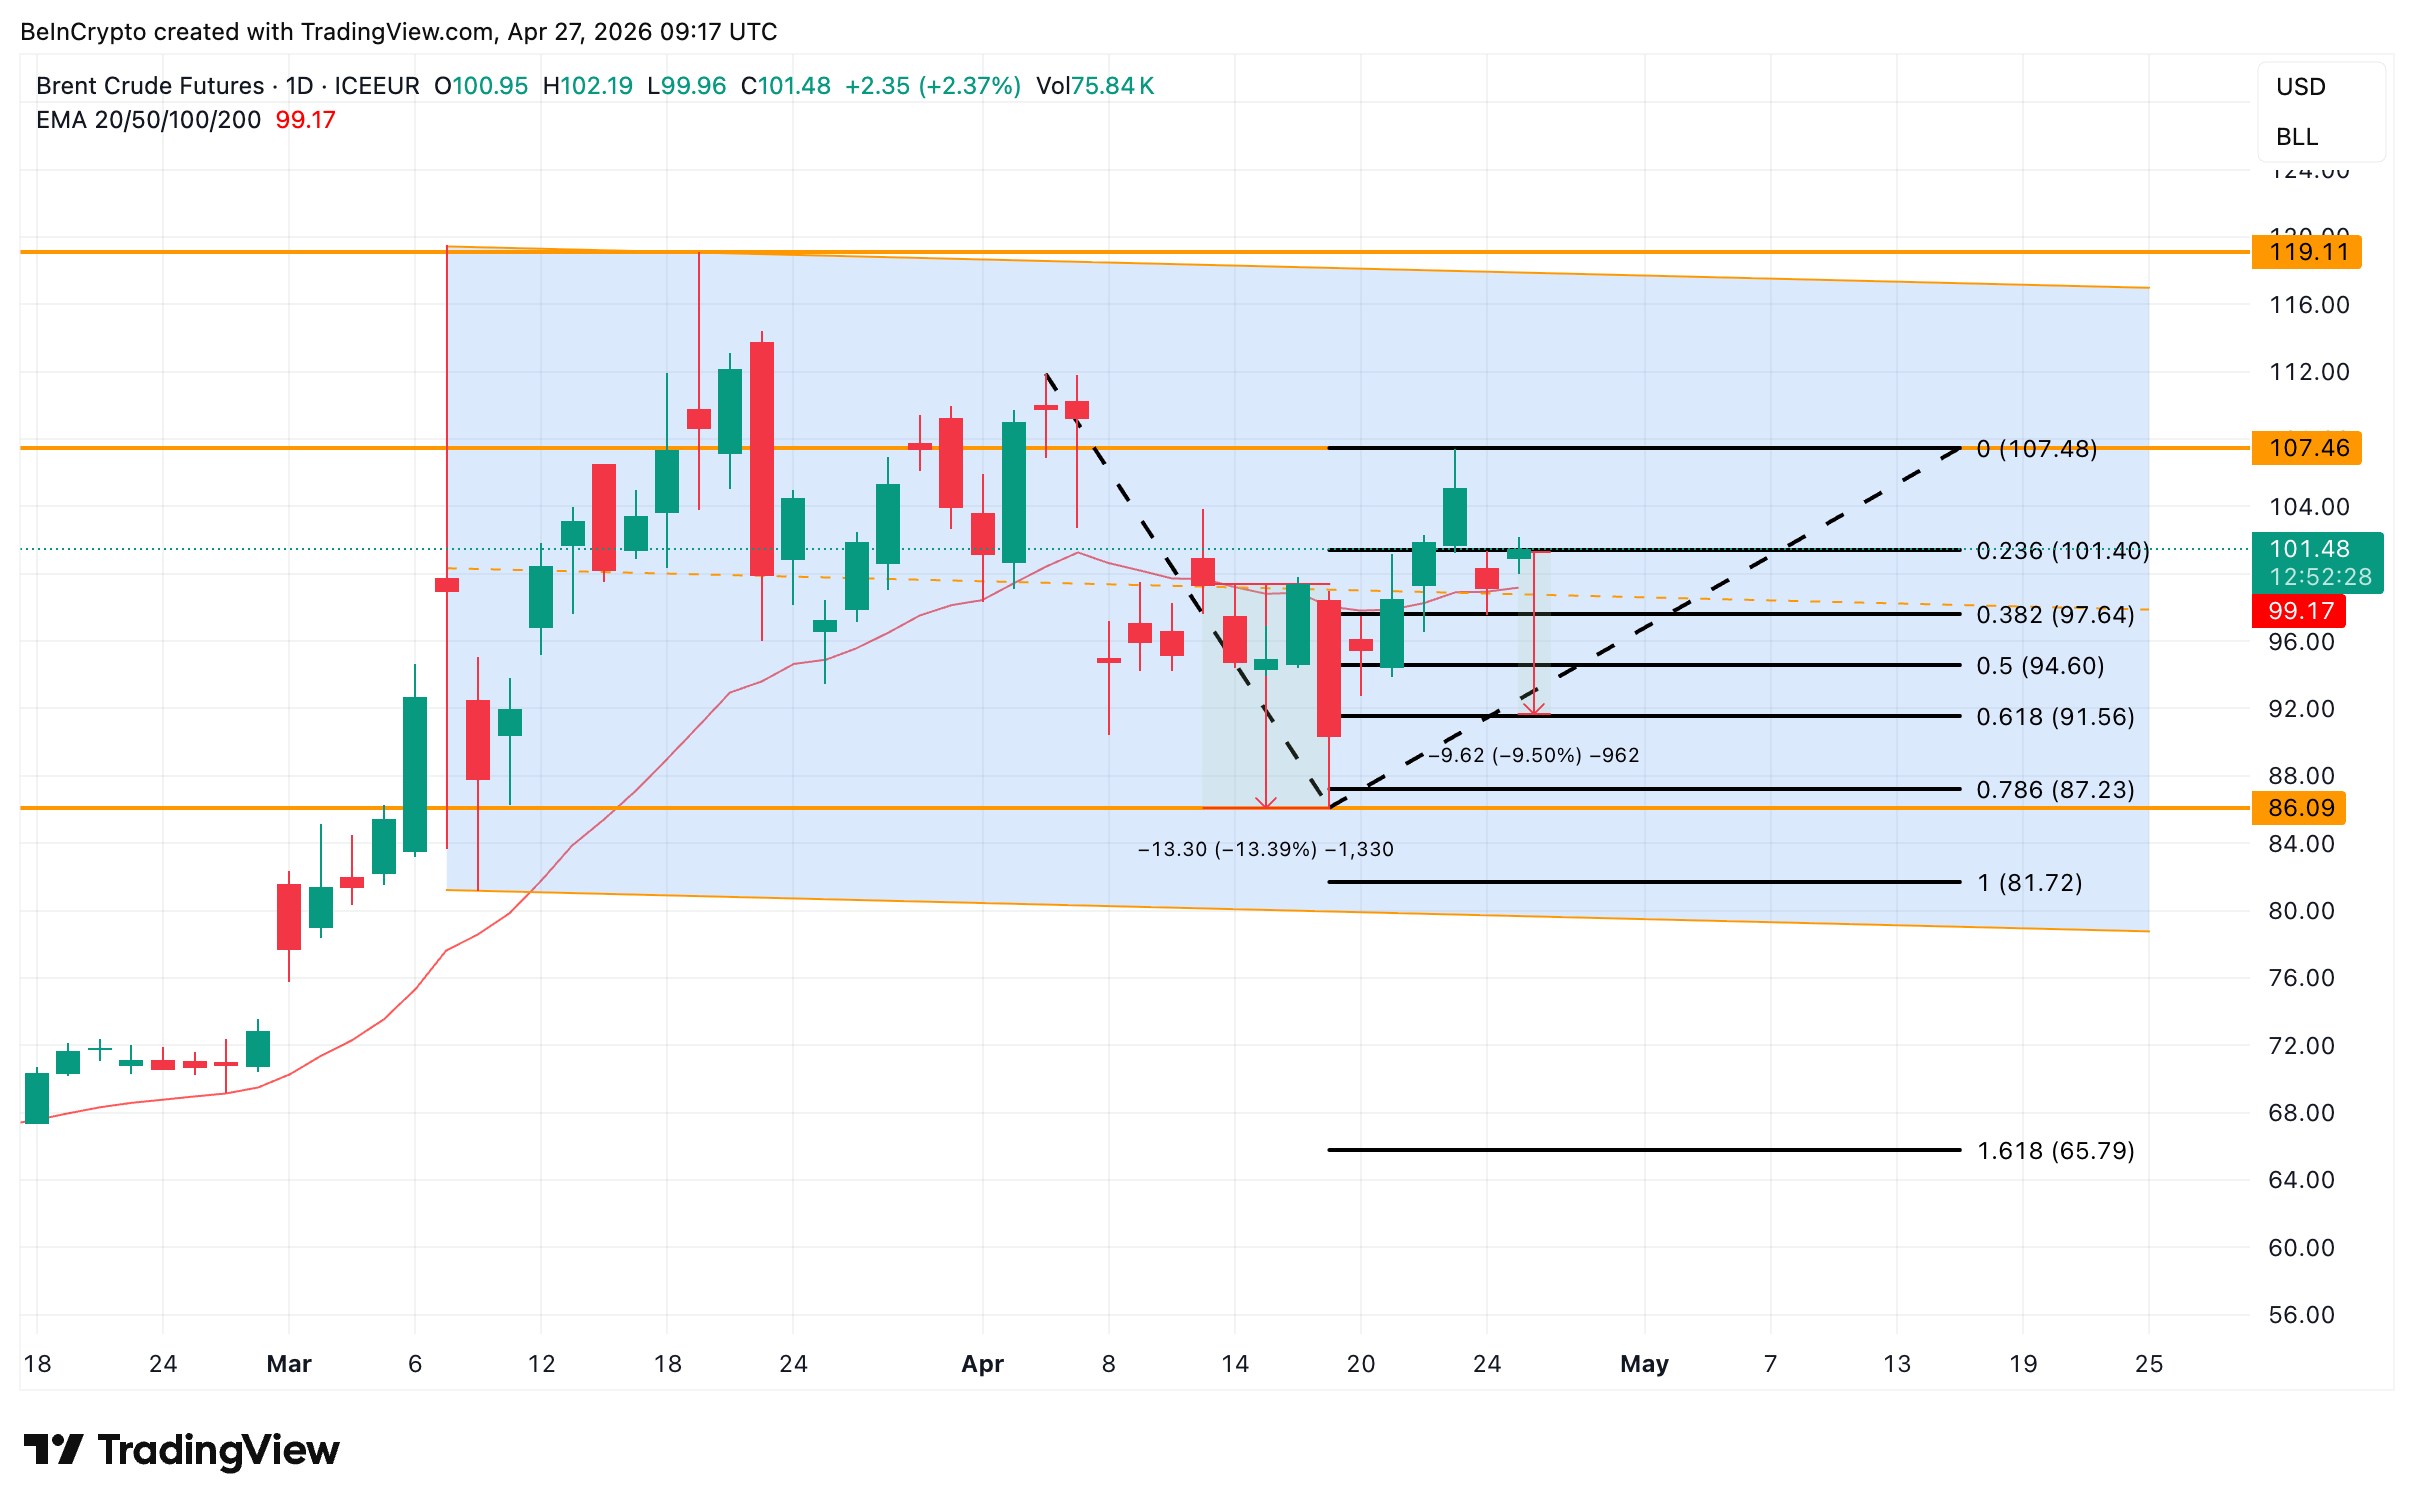
It then exposes $97.64 at the 0.382 Fibonacci level, with $94.60 at the 0.5 Fibonacci level as the next test. The decisive cluster sits at $91.56, the 0.618 Fibonacci, which is the strongest support on the daily chart.
A break below $91.56 opens $87.23 and then $81.72, the channel floor that would complete the repeat-of-April scenario.
For now, $99.17 separates a bearish repeat from a supply-shock-driven rally.
The post Will Oil Price Drop Again or Has the Supply Shock Rewritten the Playbook? appeared first on BeInCrypto.
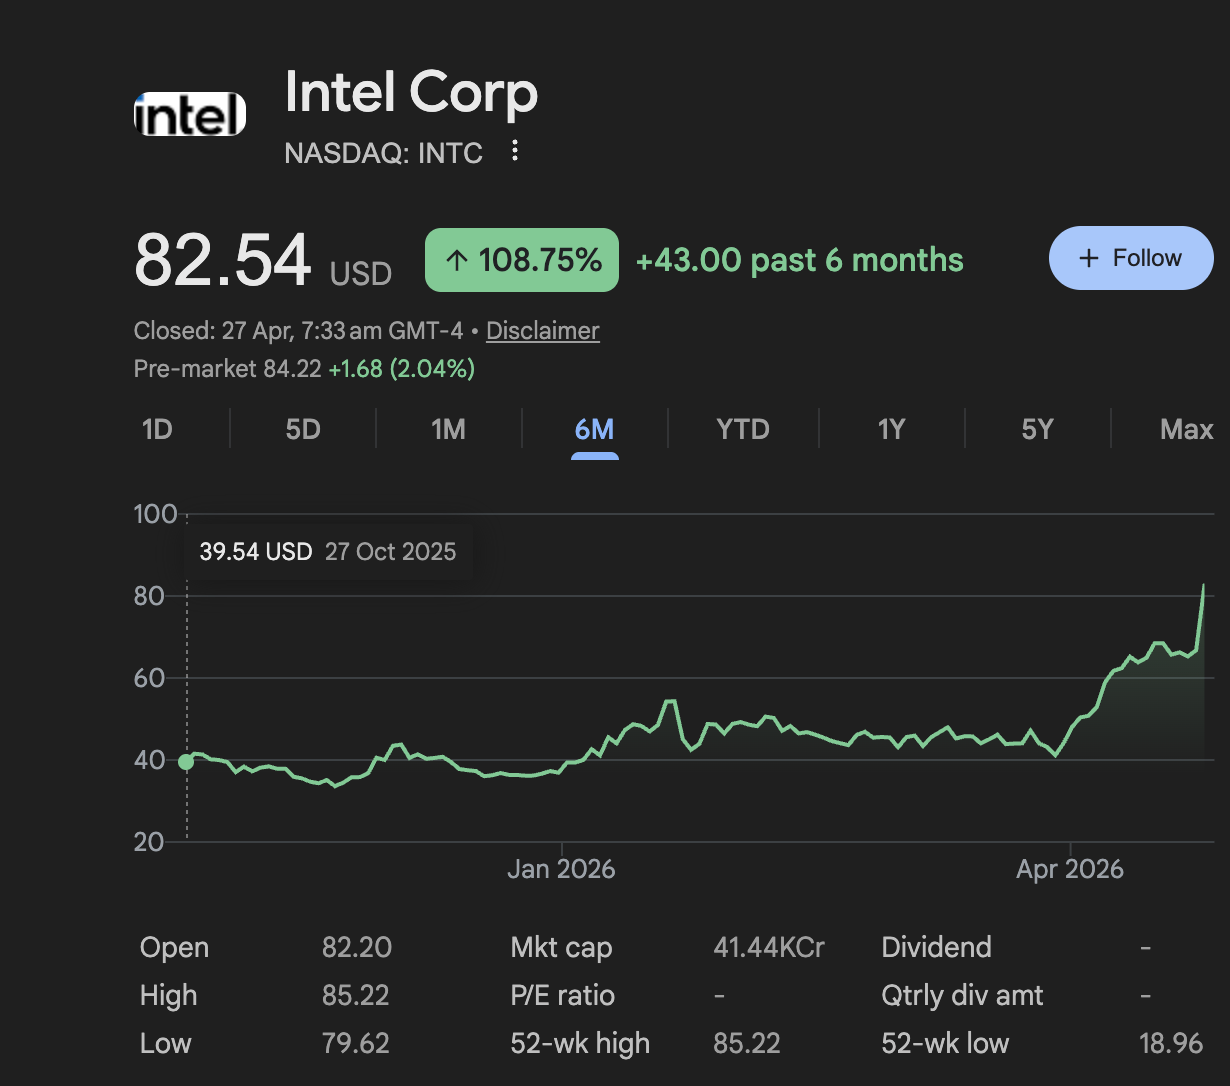
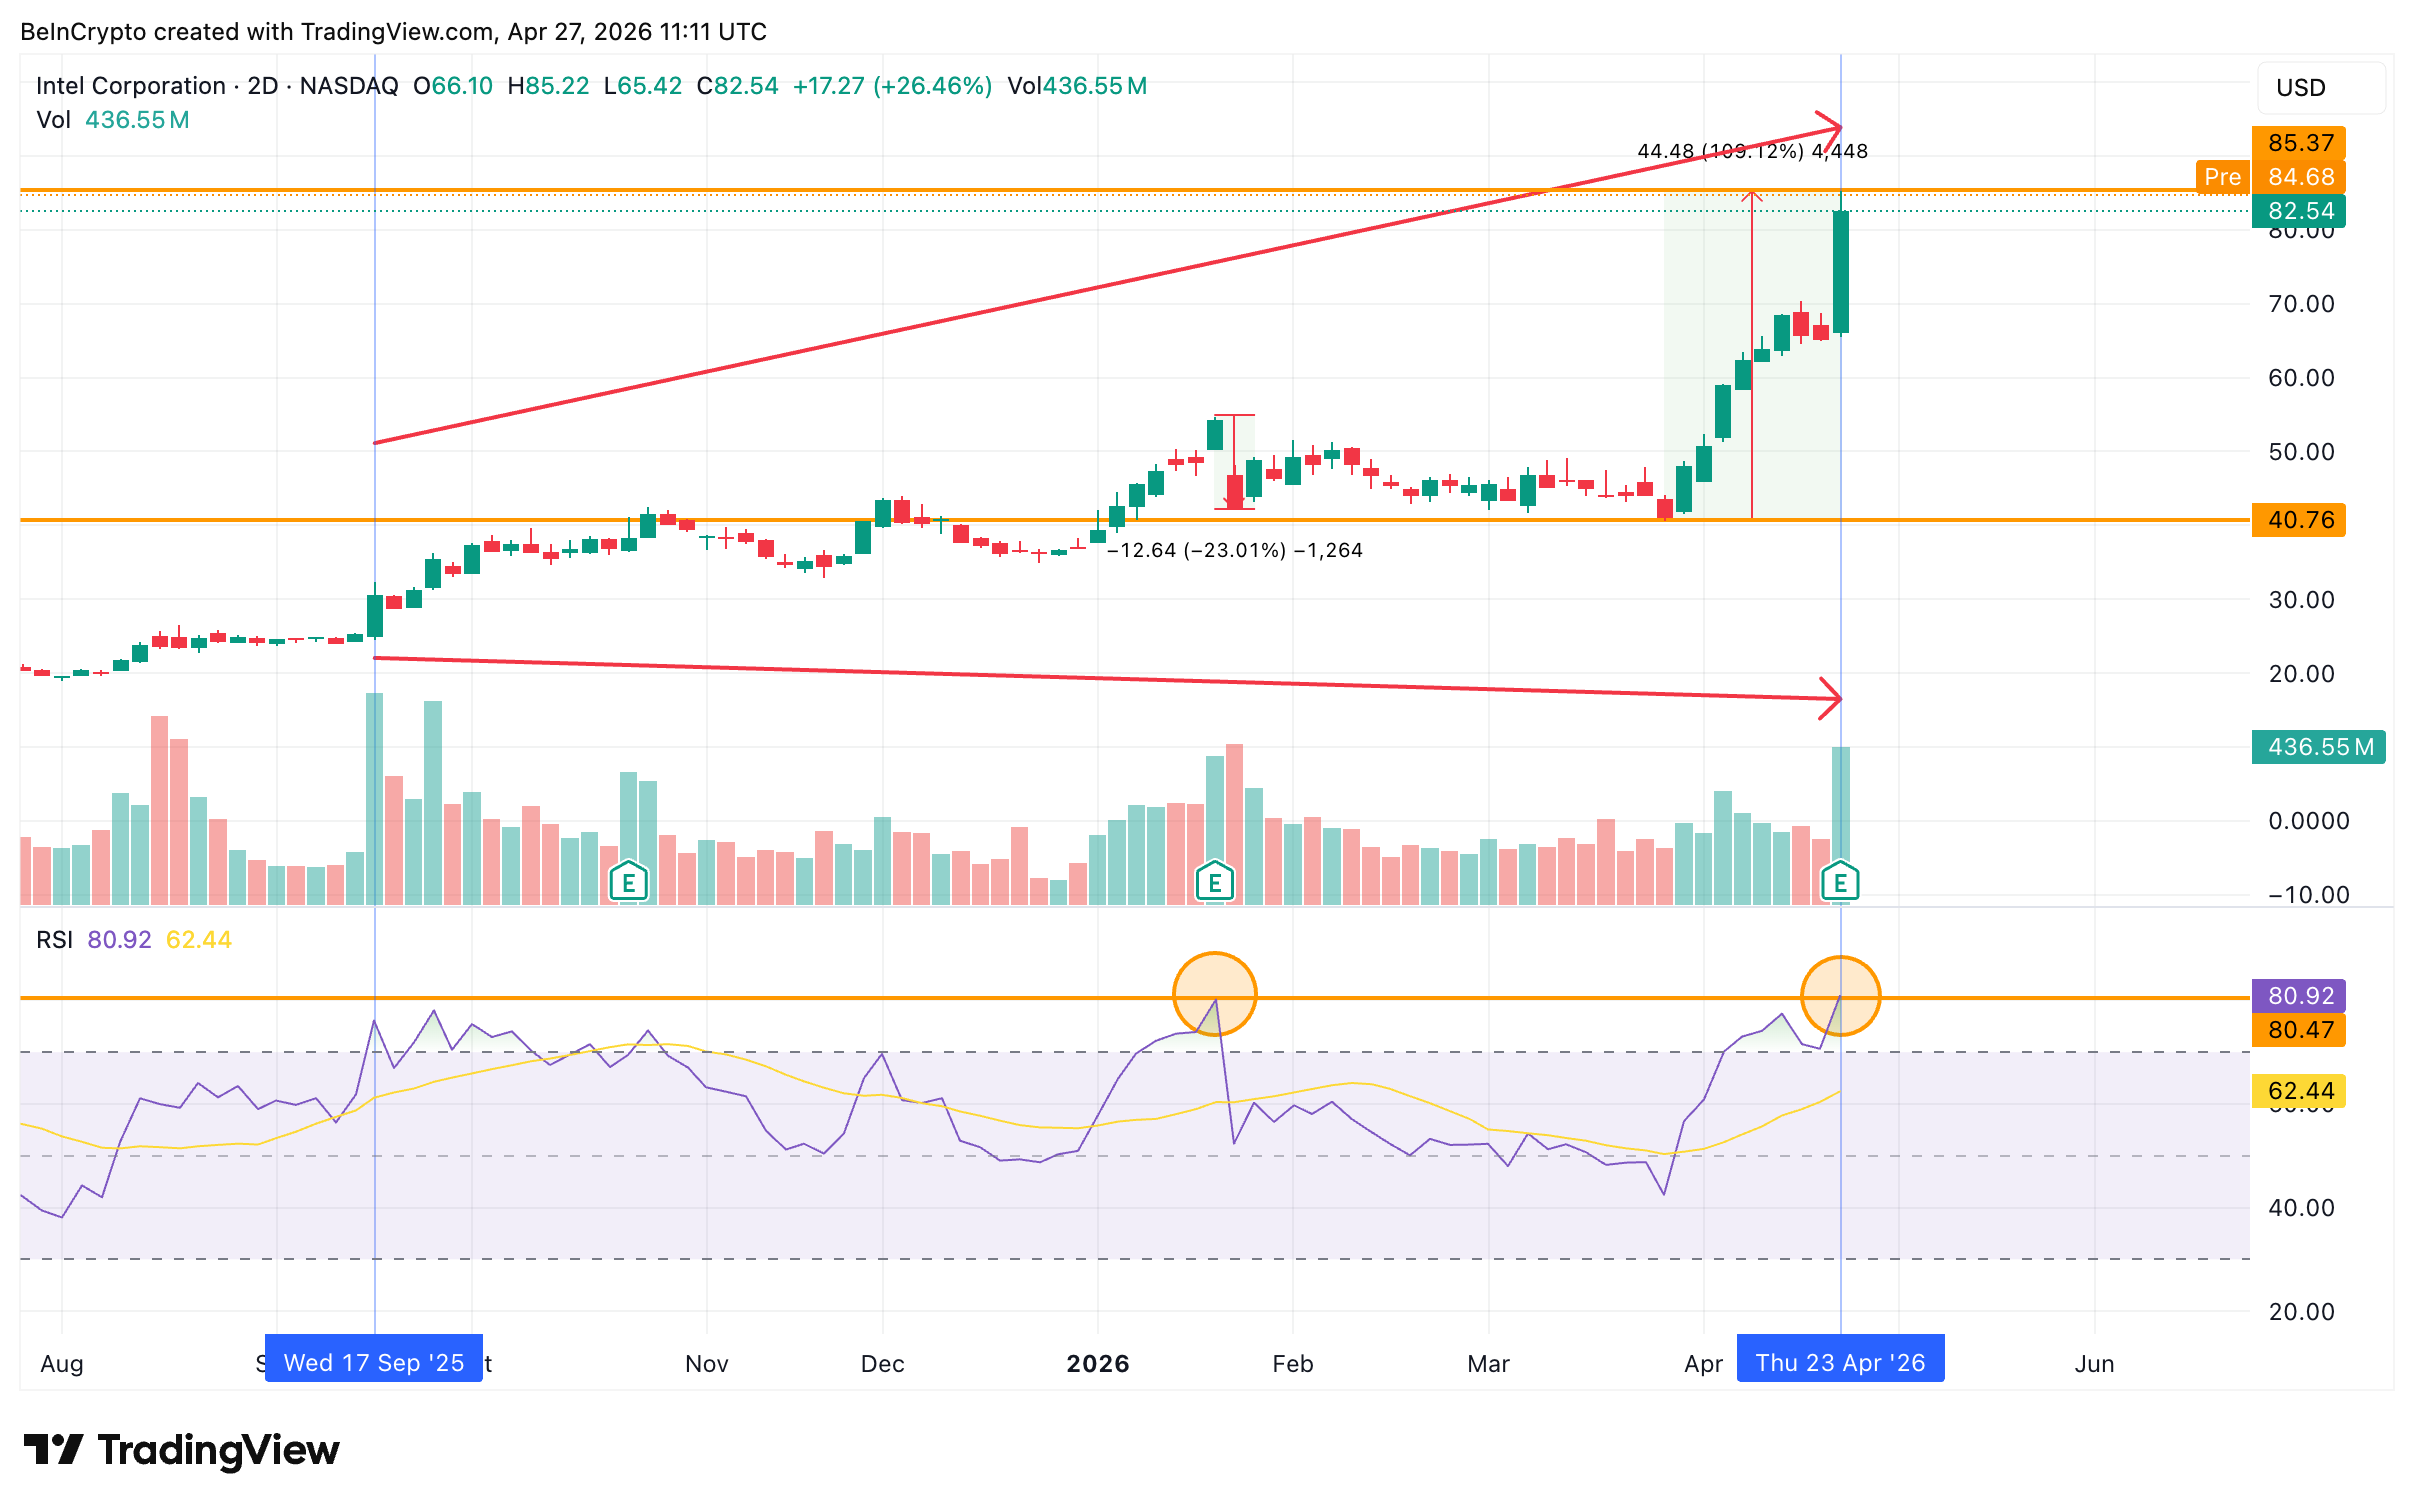
Intel (INTC) stock closed Friday at $82.54, capping a roughly 100% surge in a single month and printing fresh all-time highs, as traders now ask whether $100 is reachable before May ends.
The post-earnings melt-up has pushed Intel into deeply overbought territory while bearish options positioning quietly builds. Whether the chip giant breaks higher or pulls back from here now hinges on a single chart pattern forming on the two-day timeframe.
Intel Stock Volume Divergence Flashes Warning at Overbought RSI
Intel stock has rallied for seven months on the two-day chart, but volume has been thinning the entire way. Between September 17 and April 23, price trended steadily higher while traded volume trended in the opposite direction.
That gap is a classic volume divergence, a warning that conviction behind the move is fading.

Want more insights like this? Sign up for Editor Harsh Notariya’s Daily Newsletter here.
The Relative Strength Index (RSI), a momentum indicator, just printed 80.92. That marks the second time INTC has tagged this exact overbought zone in less than a year.
The first hit came in early 2026, and the stock corrected by roughly 23% in the days that followed. The same volume divergence preceded that pullback, and the same divergence is present now.
That technical exhaustion matters because of what sits underneath the rally.
Intel now trades above 120 times next year’s expected earnings, the richest forward valuation among large-cap chip stocks, meaning every dollar of future profit is already priced in many times over.
On a clean accounting basis, the company posted a $3.7 billion net loss last quarter after a Mobileye writedown, and the Intel Foundry segment, the centerpiece of the entire turnaround thesis, lost another $2.4 billion in the same quarter.
Momentum is the only thing currently holding price above the underlying business. When the RSI resets, that gap tends to close.
Whether options positioning confirms or contradicts that pullback risk is the next piece of the puzzle.
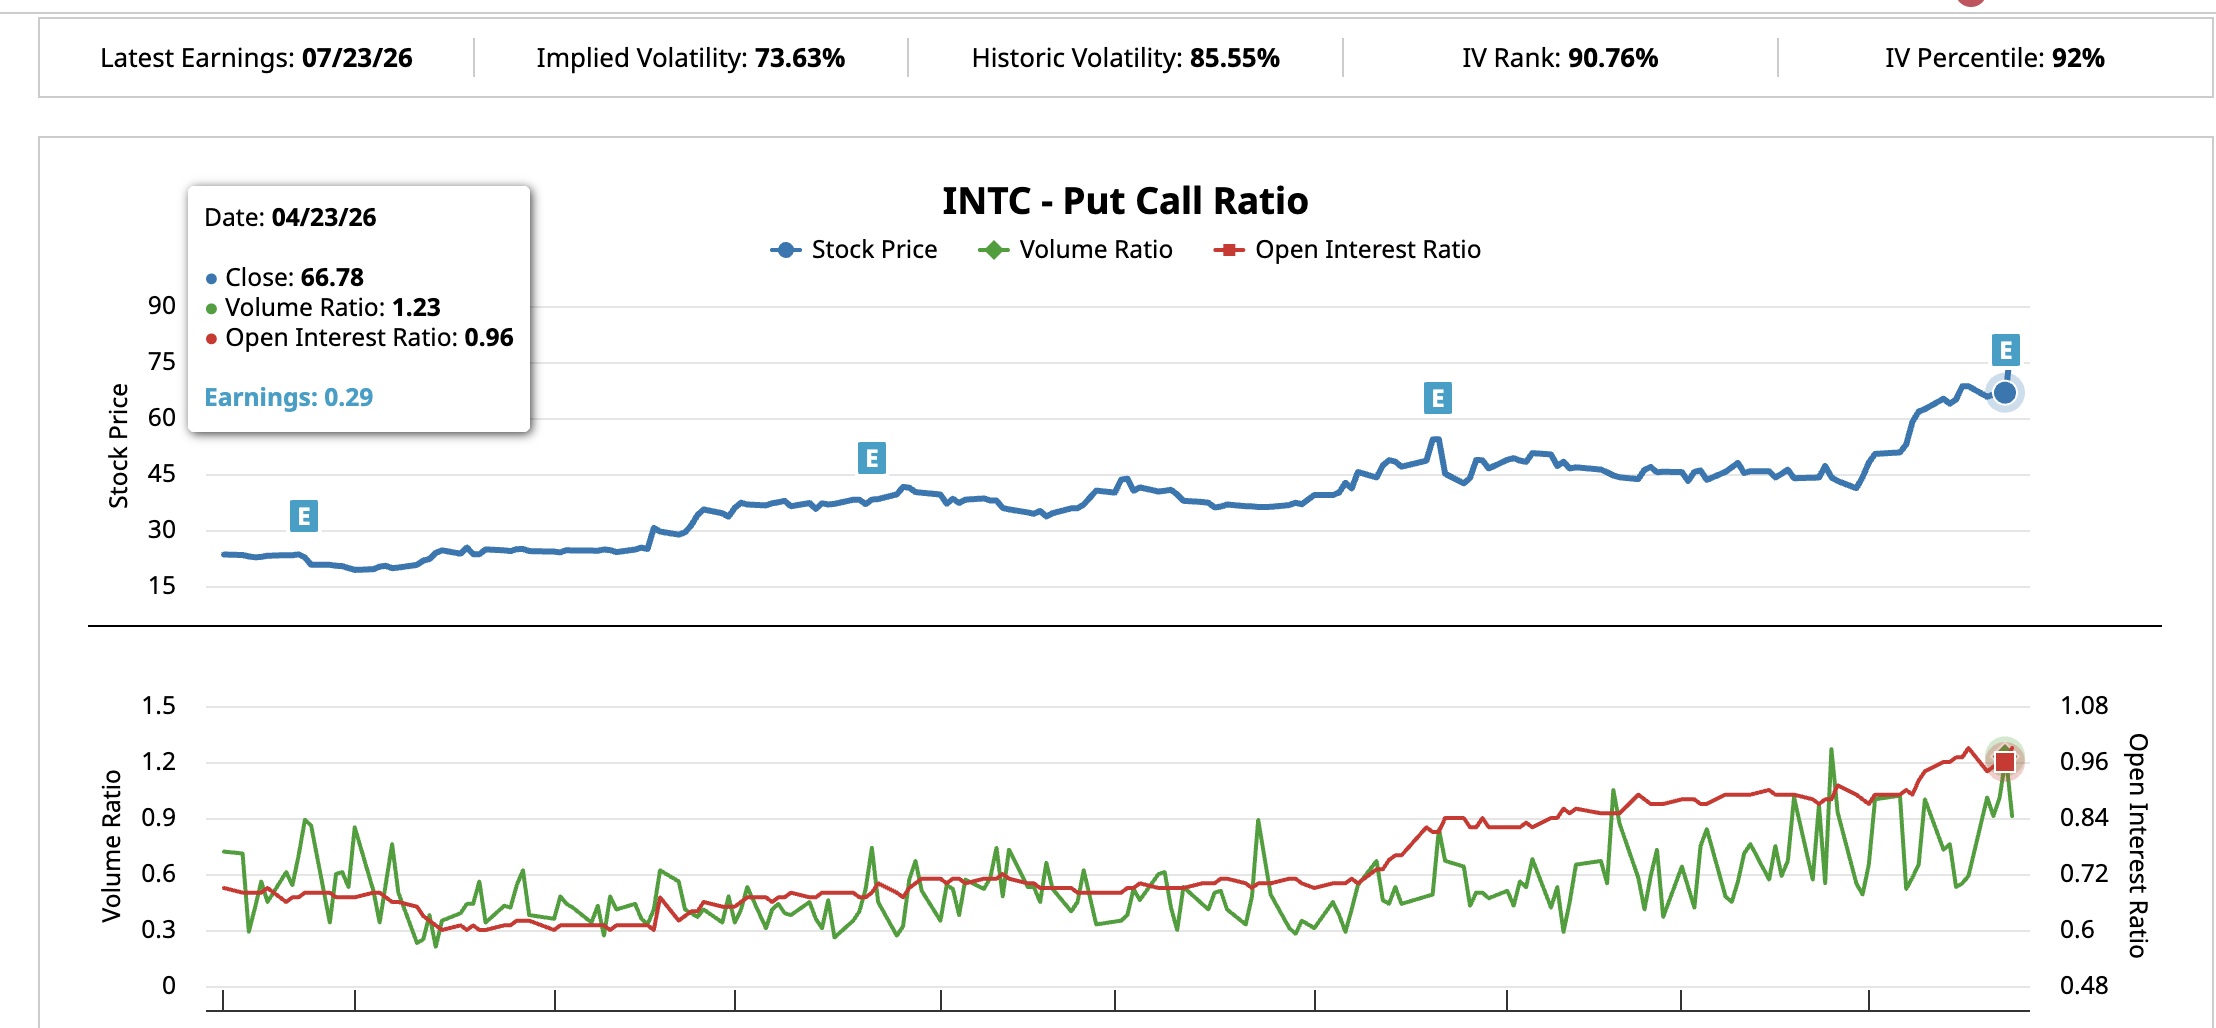
INTC Put-Call Ratio Rises Even as Analysts Stay Cautious
On March 27, when Intel closed at $43.13, the options market sat in balance. The put-call ratio by volume printed 0.93 and the open interest ratio printed 0.91, with neither calls nor puts dominating.
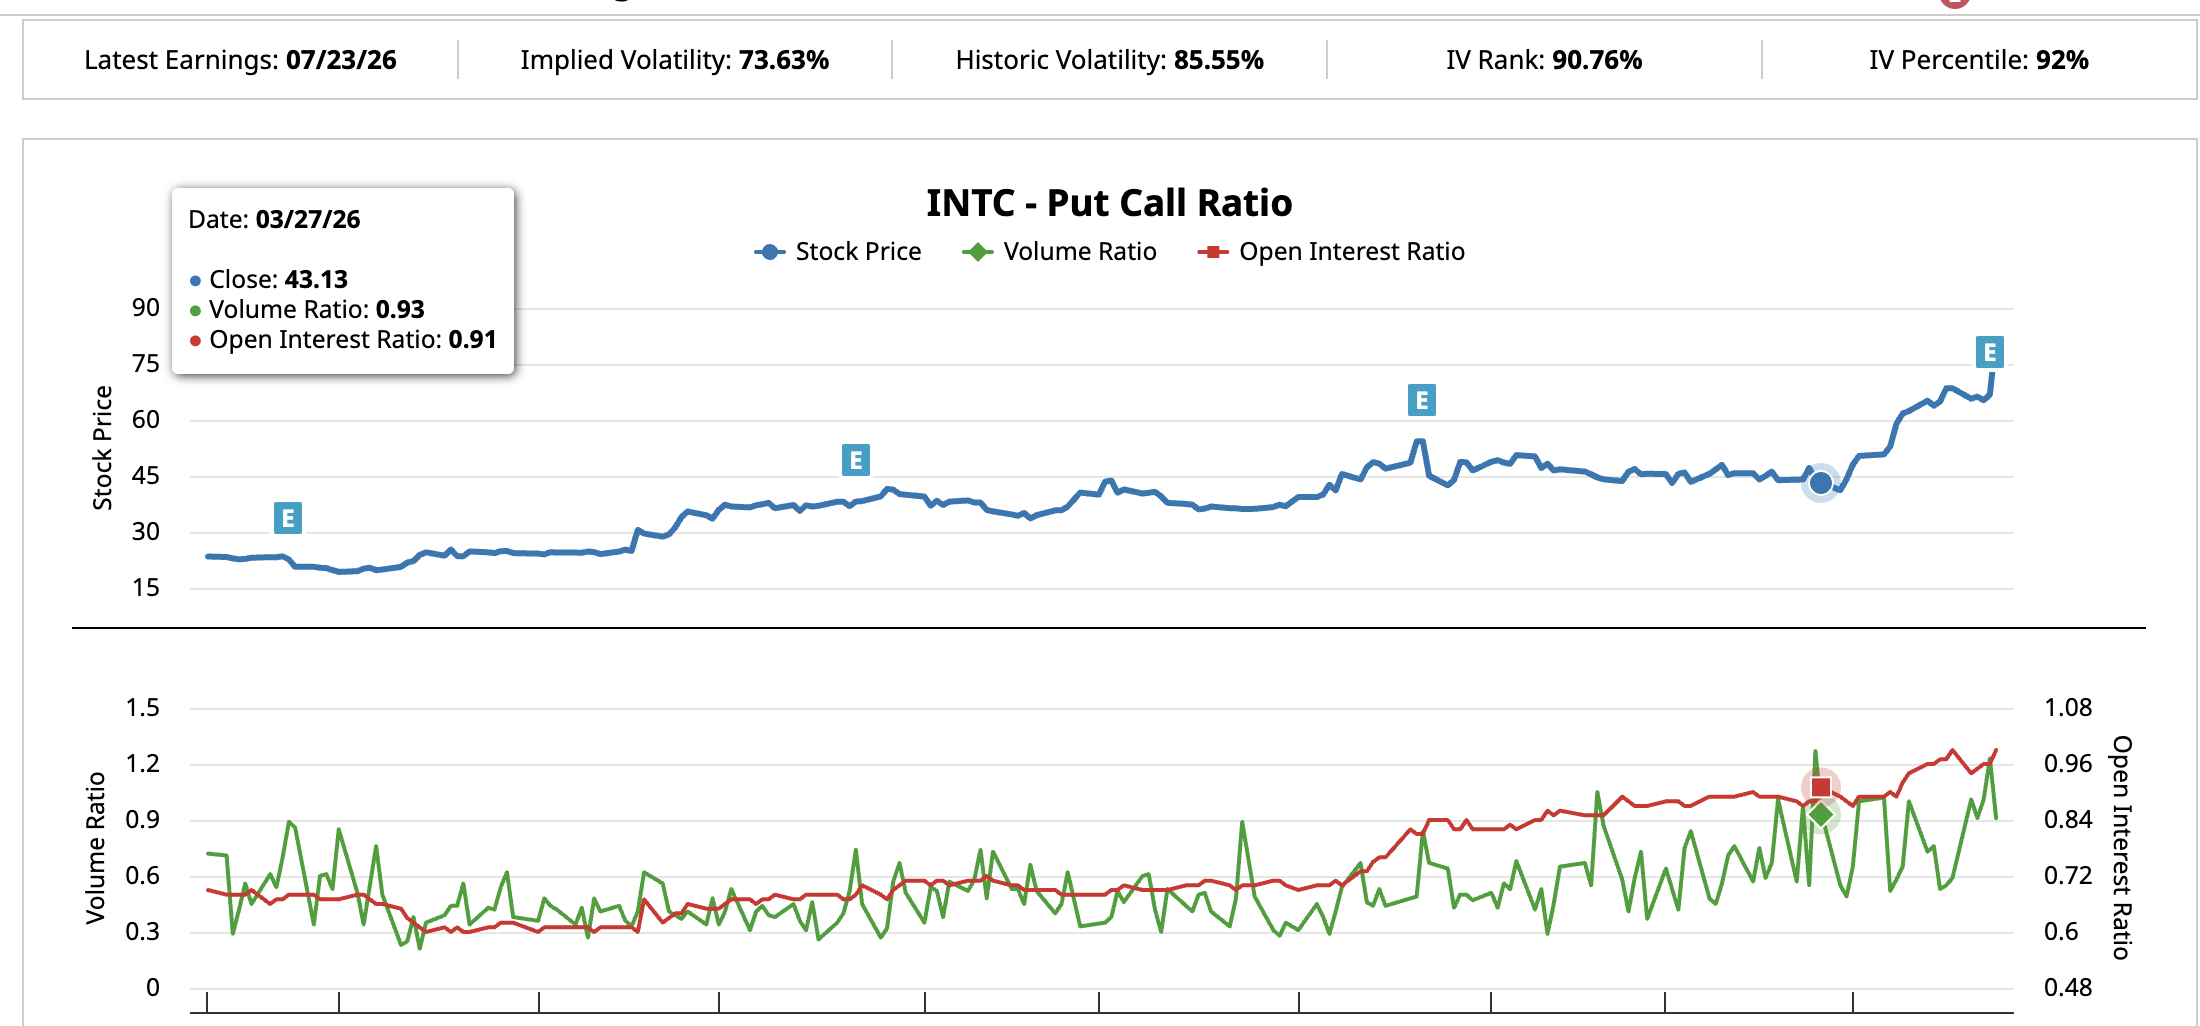
By April 23, the day Intel reported Q1 earnings with the stock at $66.78, the volume ratio had climbed to 1.23 and the open interest ratio to 0.96. Bearish positioning continued to build as the price rose.
That positioning carries two edges. If Intel pushes higher, those bearish bets get caught, and forced covering can amplify the move, the same dynamic that fueled the 24% single-day rip on April 24.
If the stock breaks down instead, the put wall becomes a magnet that pulls the price further down.
Implied volatility, which reflects how big a price move options traders expect over the coming year, sits at 73.63%. The IV Rank of 90.76 shows that reading is near the top of the past year’s range, meaning the market is bracing for one of its largest expected swings in either direction.
Wall Street has not stepped in to defend the rally. Analyst targets were raised across the board after earnings, but most ratings stayed cautious.
Barclays raised its price target to $65 with a Hold rating. Bank of America reiterated Sell at $56, implying roughly 32% downside. Morgan Stanley is rated Hold with a $73 price target. RBC went to $80, also Hold. Only Roth MKM at $100 and Northland at $92 carry a Buy.
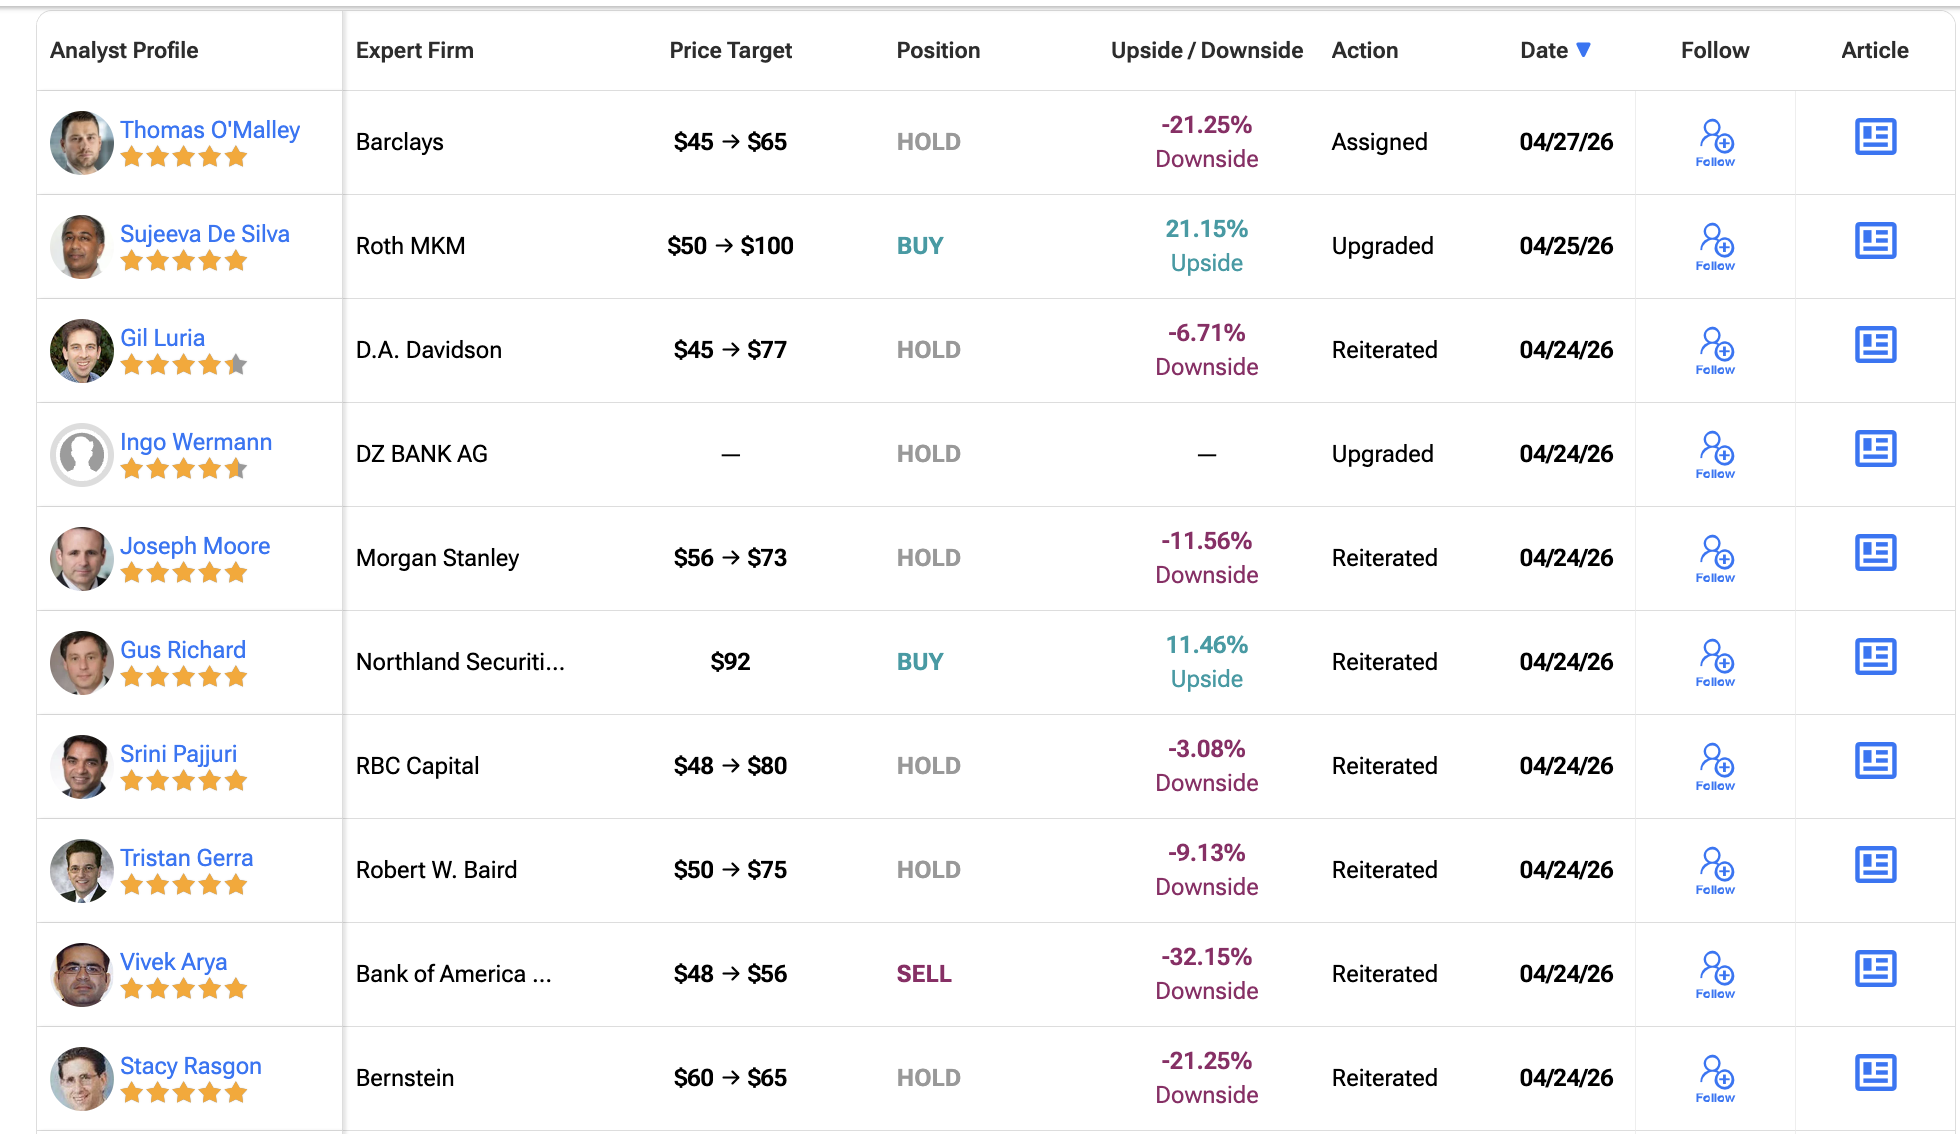
With positioning bearish and most price targets sitting below spot, the price chart itself becomes the decider.
Intel Stock Price Levels and the May $100 Question
The rally from $40.76 to the April 24 peak at $85.37 forms the pole of a potential bull flag pattern. It is a continuation setup where a sharp move higher is followed by a tight sideways drift before the next leg up. Intel stock currently consolidates near $82.54.
The flag stays intact as long as the price holds above $64.84. A 2-day close above $83.10, the 0.618 Fibonacci level, would confirm the breakout.
That can push INTC stock price toward $94.39 and even $112.66, followed by a measured move toward $171.76 over the medium term.
For the May $100 target, the stock first needs to clear $83.10 cleanly, then break $88.07 (0.786 Fib) and the 1.0 Fib at $94.39. Above $94.39, the path to $100 opens through the 1.618 extension at $112.66.
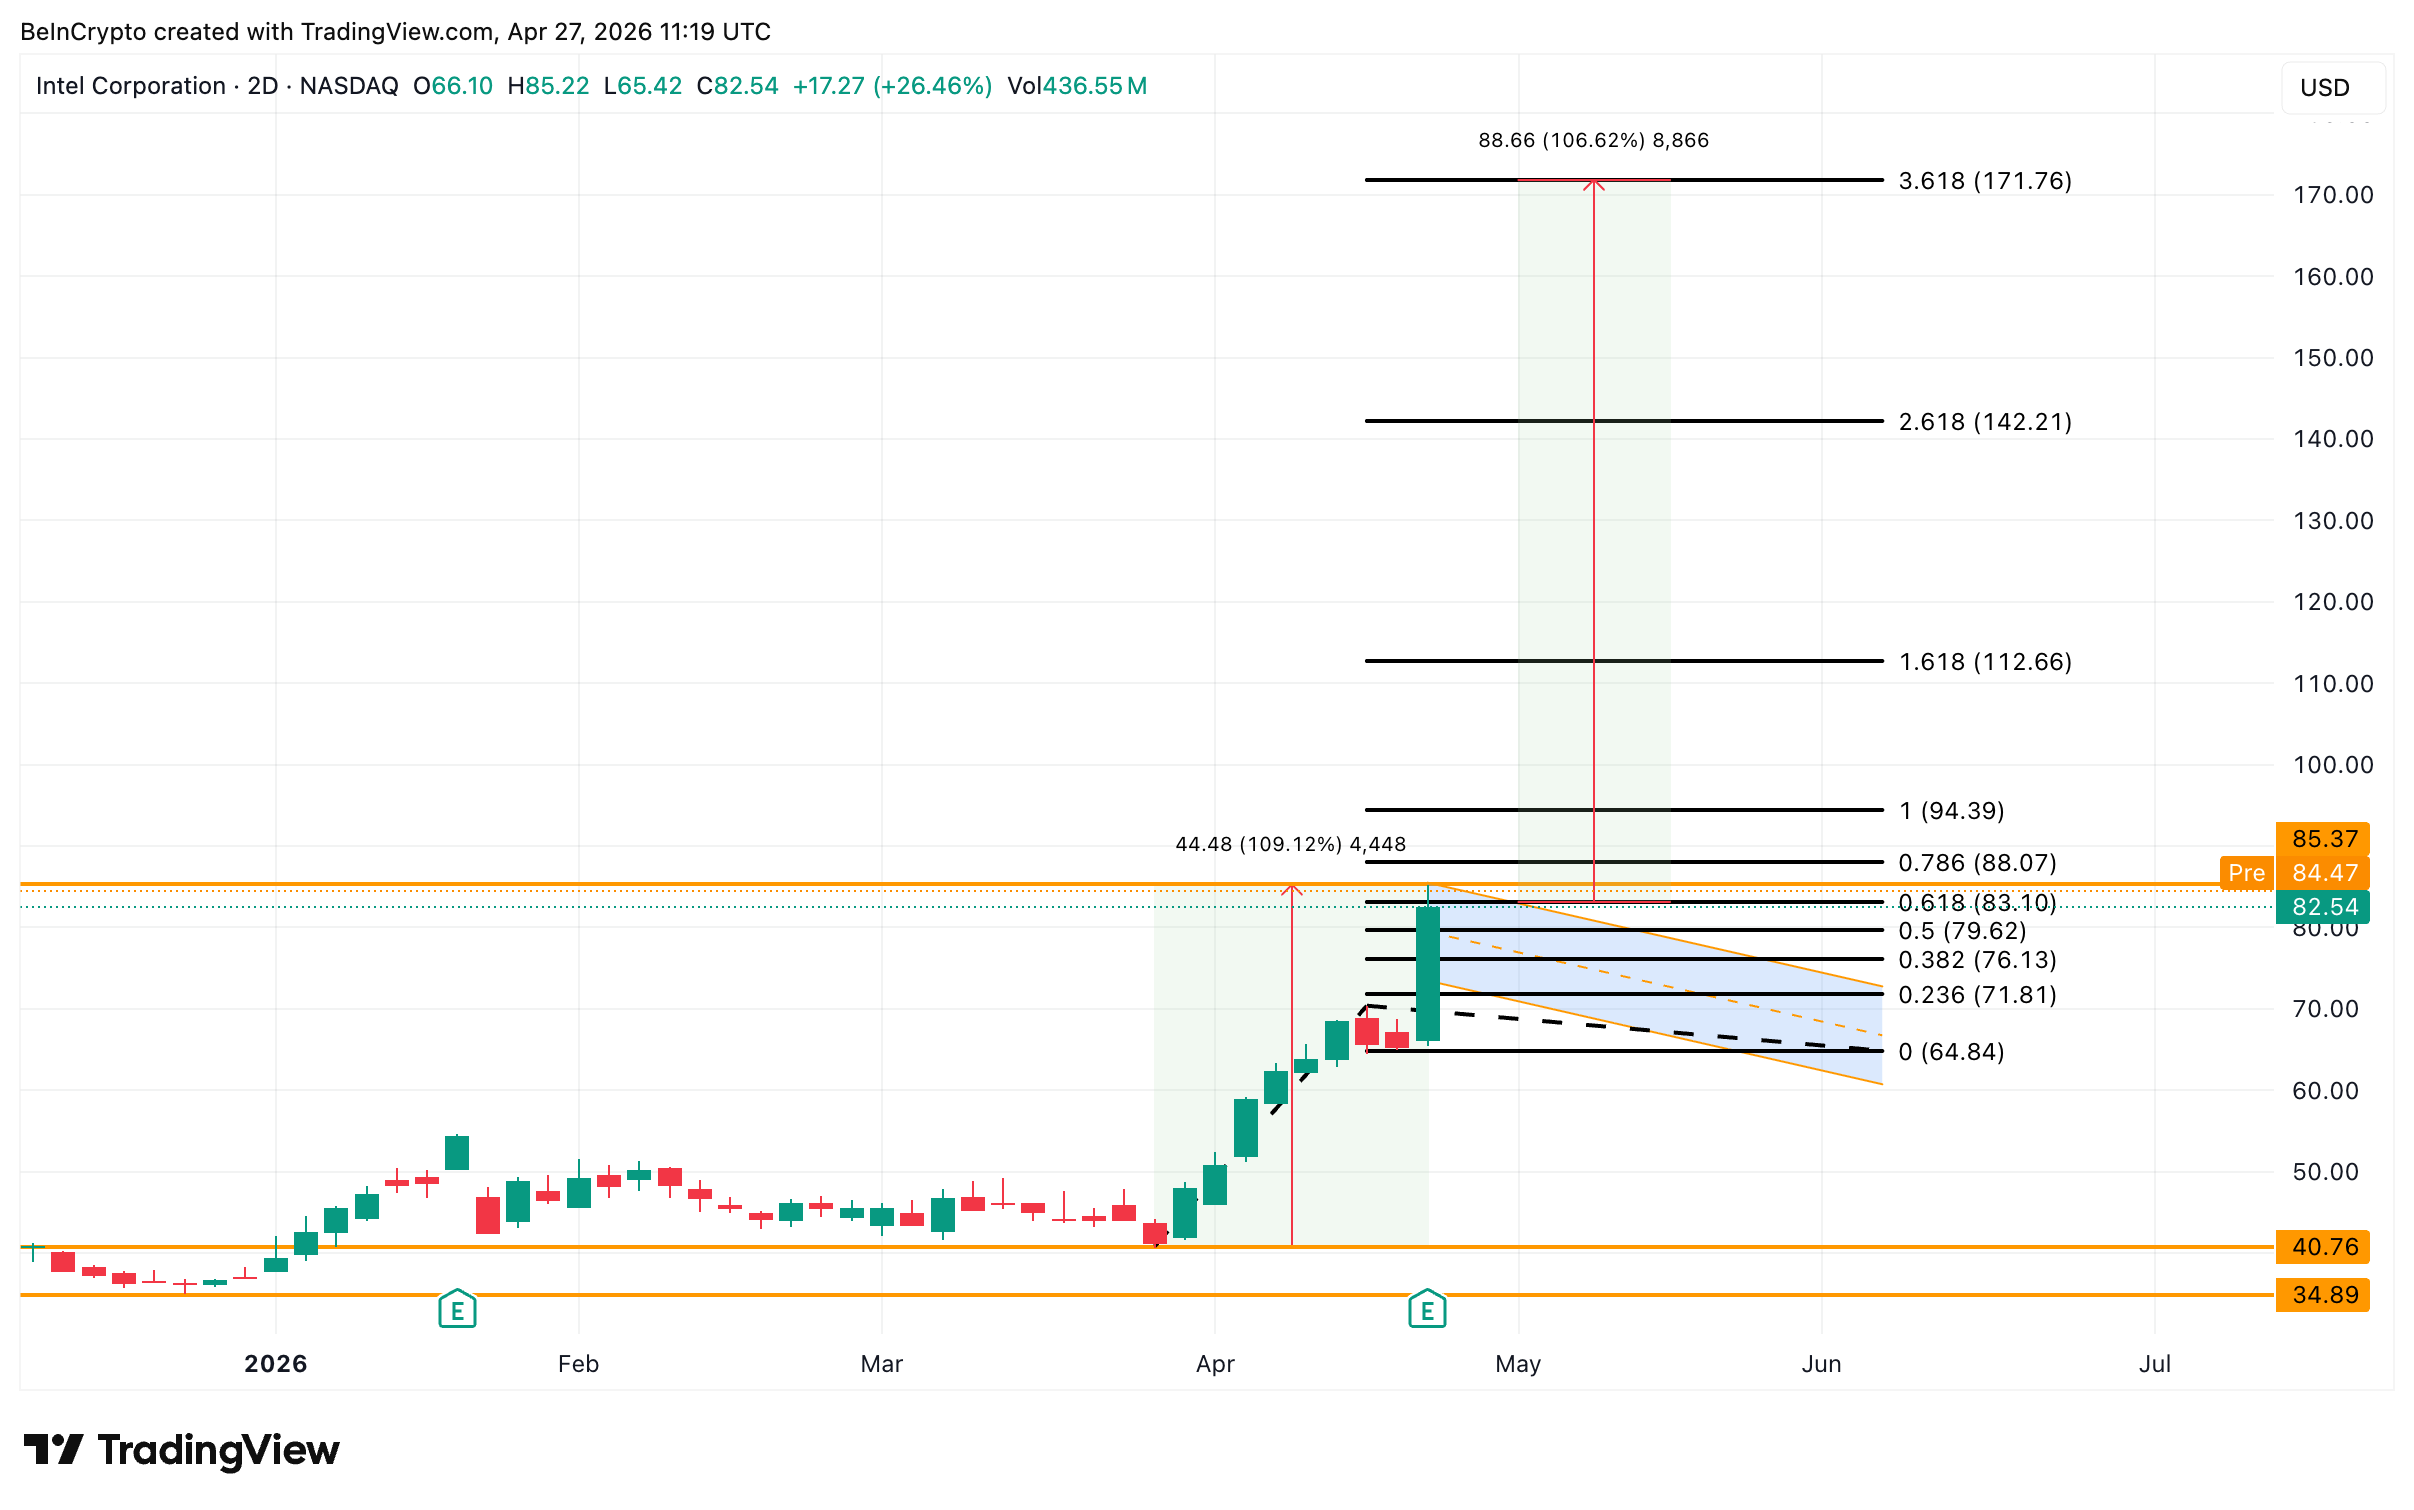
The setup carries a real caveat. With RSI already at 80.92 and volume thinning into the move, a sharp pullback toward $76.13 (0.382 Fib) or even $71.81 (0.236 Fib) remains possible before any clean breakout.
A 2-day close below $64.84 invalidates the bull flag and the bullish thesis. The next major support from there sits all the way down at the $40.76 base from late March, the same level Intel traded at before the rally began.
Below that line, the price is no longer pricing in the AI turnaround at all, just the loss-making business shown in the latest filing.
The $83.10 close is the line in the sand. A clean break sends Intel stock toward $100 in May. A rejection here, with bearish options positioning, an extreme RSI reading, and a foundry segment still losing $2.4 billion a quarter as fuel, opens the door for a 23% pullback that would mirror the last overbought reset.
The post Can Intel Stock Hit $100 in May? appeared first on BeInCrypto.

Le’Veon Bell accuses ex-Jets head coach Adam Gase of cocaine use in office

Engineering Collisions: How NYU Is Remaking Health Research

Taylor Swift applies to trademark her voice and image amid AI concerns
Manchester United reach agreement with Casemiro over contract clause amid transfer speculation

US brings back mandatory military draft registration

Steven Gerrard disagrees with Gary Neville over ‘shock’ Chelsea and Arsenal claim | Football


-

 Politics7 days ago
Gary Stevenson delivers timely reminder to register to vote as deadline TODAY
-

 Fashion3 days ago
Weekend Open Thread – Corporette.com
-
Crypto World2 days ago
Hyperliquid $HYPE Rally Builds Momentum as AI Sector Enters Prove-It Phase
-

 Politics5 days ago
Making troops accountable for war crimes threatens US alliance, ex-SAS colonel warns
-

 Politics5 days ago
Disabled people challenge government SEND proposals over segregation concerns
-
 Tech3 hours ago
Register Renaming | Hackaday
-

 Business4 days ago
Patterson-UTI Energy, Inc. (PTEN) Q1 2026 Earnings Call Transcript
-

 Business5 days ago
Rolls-Royce Voted UK’s Most Iconic Trade Mark as IPO Register Hits 150
-
 Sports1 day ago
IPL 2026: Ruturaj Gaikwad registers slowest fifty of the season, enters all-time unwanted list | Cricket News
-
 Crypto World6 days ago
Five Value Stocks with Recovery Potential in 2026: PayPal (PYPL), Nike (NKE), and More
-

 Politics5 days ago
Starmer handler McSweeney to be dragged from shadows by Foreign Affairs Committee
-

 Politics5 days ago
Zack Polanski responds to home secretary’s taser threat
-
Politics5 days ago
Wings Over Scotland | How To Get Away With Crimes
-

 Crypto World6 days ago
New York sues Coinbase, Gemini over prediction market offerings
-
Entertainment6 days ago
Sydney Sweeney cameo cut from “The Devil Wears Prada 2”, source explains why (exclusive)
-
 Business6 days ago
HCL Tech share price tank over 9% after weak Q4. JPMorgan, HSBC & 3 others cut target price
-

 Politics5 days ago
‘Iran is still a nuclear threat’
-
 Sports5 days ago
Tim Bradley names the current best in the world: “Better than Inoue and Usyk”
-
 Crypto World6 days ago
Crypto’s great hope in Senate’s Clarity Act still has a path to survive tight calendar
-

 NewsBeat2 days ago
LK Bennett closes all stores after entering administration
You must be logged in to post a comment Login