
Crypto World
What Is a Change of Character (CHoCH) in Trading? Definition, Signals, and Examples
In Smart Money Concept (SMC) trading, recognising when market momentum shifts can mean the difference between catching a trend reversal and holding a losing position. The Change of Character (CHoCH) is a price action pattern that can signal these pivotal moments when the balance between buyers and sellers tips. Unlike continuation patterns that confirm ongoing momentum, a CHoCH alerts traders to prepare for directional changes.
This article explores how to identify CHoCH patterns on a chart, explains how they differ from similar concepts like Break of Structure and Market Structure Shift, and demonstrates their practical application through real trading examples.
Takeaways
- CHoCH is a concept that signals potential trend reversals in Smart Money Concept trading. This pattern has two forms: bullish CHoCH and bearish CHoCH. A bullish CHoCH occurs when price breaks above a recent lower high in a downtrend, while a bearish CHoCH happens when price falls below a recent higher low in an uptrend, indicating possible momentum shifts.
- A CHoCH is usually compared to a Break of Structure (BOS). However, these concepts are opposite. BOS confirms trend continuation by breaking in the direction of the existing trend, whereas CHoCH signals a potential reversal by breaking against the prevailing trend.
- Another common pattern the CHoCH is compared to is a Market Structure Shift (MSS). However, MSS is a higher-confluence CHoCH that includes additional confirmation signals like a lower high (bearish) or higher low (bullish) before the break, plus strong displacement.
- Change of Character patterns can be found across all timeframes, from intraday to weekly charts, with higher-timeframe signals generally carrying more significance.
Understanding Breaks of Structure
Before delving into concepts like Change of Character (CHoCH) traders should understand the Breaks of Structure (BOS) pattern. A BOS in trading signifies a continuation within the current trend and is marked by a clear deviation from established swing points that indicate previous highs and lows.
In the context of an uptrend, a BOS is identified when the price exceeds a previous high without moving below the most recent higher low. This action confirms that the upward momentum is still strong and likely to continue as buyers push the market to new heights.
Similarly, in a downtrend, a BOS occurs when prices drop below a previous low without breaking the prior lower high, suggesting that sellers remain in control and the downward trend is set to persist.
By recognising these points where the market extends beyond its former bounds, traders can confirm that the current trend is robust and act accordingly. This foundational concept of BOS may not only help in assessing trend strength but also sets the stage for understanding more complex patterns like CHoCH, where the focus shifts from trend continuation to potential trend reversals.
CHoCH Trading Meaning

In trading, a Change of Character (CHoCH) is a concept that reflects a potential shift in market dynamics, often indicating a reversal from the prevailing trend. It may help traders discern when the momentum is shifting, offering a strategic point to consider adjusting their positions.
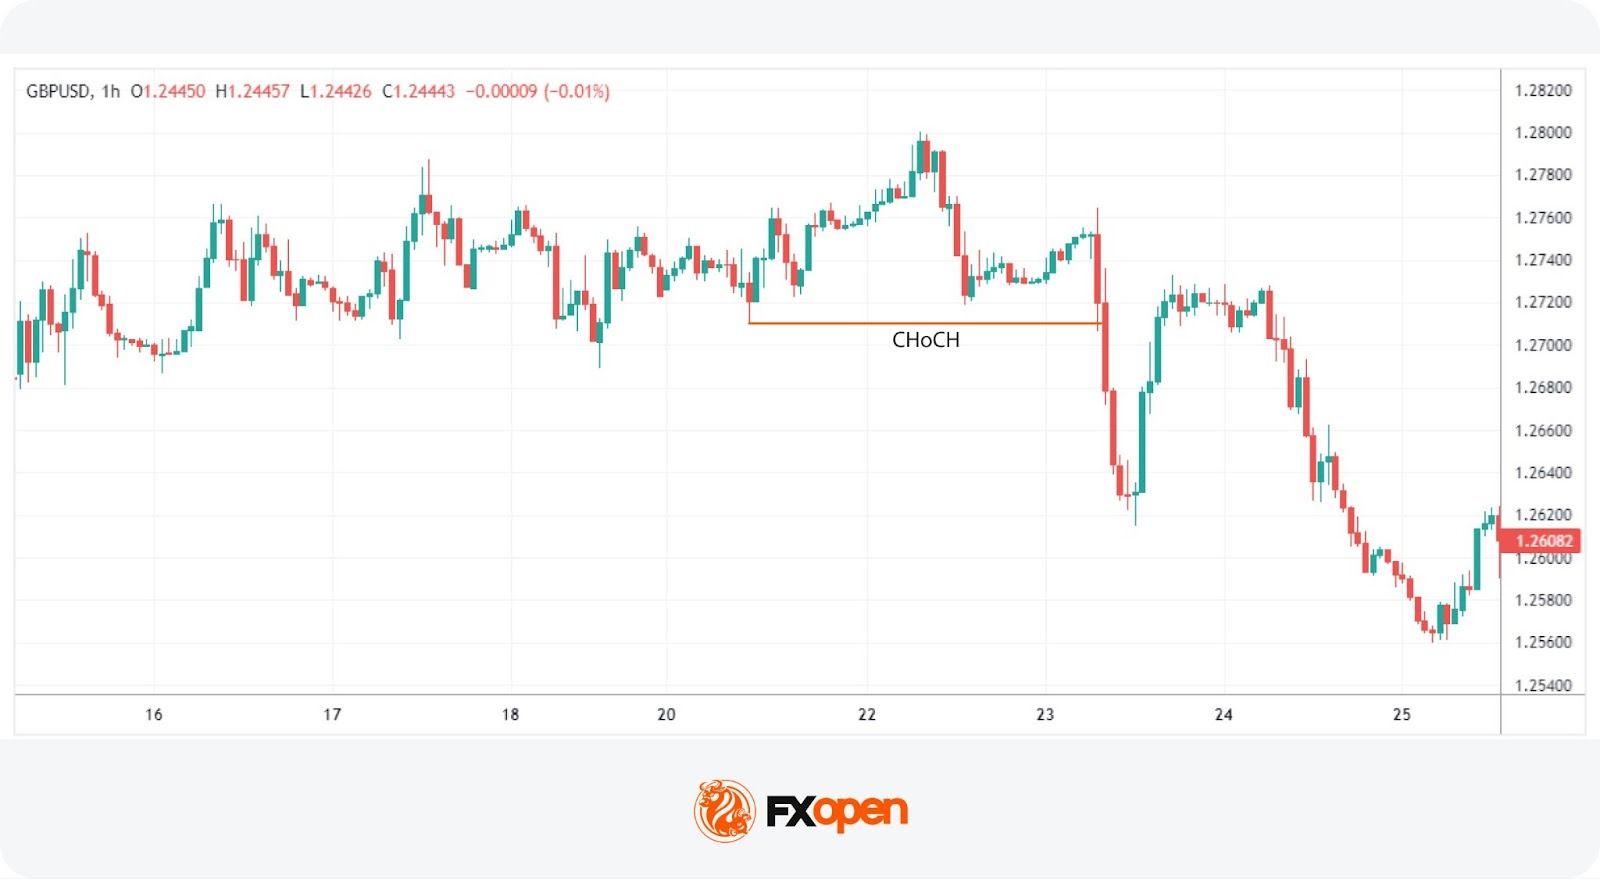
A CHoCH occurs when there’s a noticeable deviation in the market’s price trend. For example, in a bullish trend characterised by a series of higher highs and higher lows, a CHoCH is indicated by the price failing to set a new high and subsequently falling below a recent higher low. This suggests that buyers are losing control, and a bearish trend could be emerging.
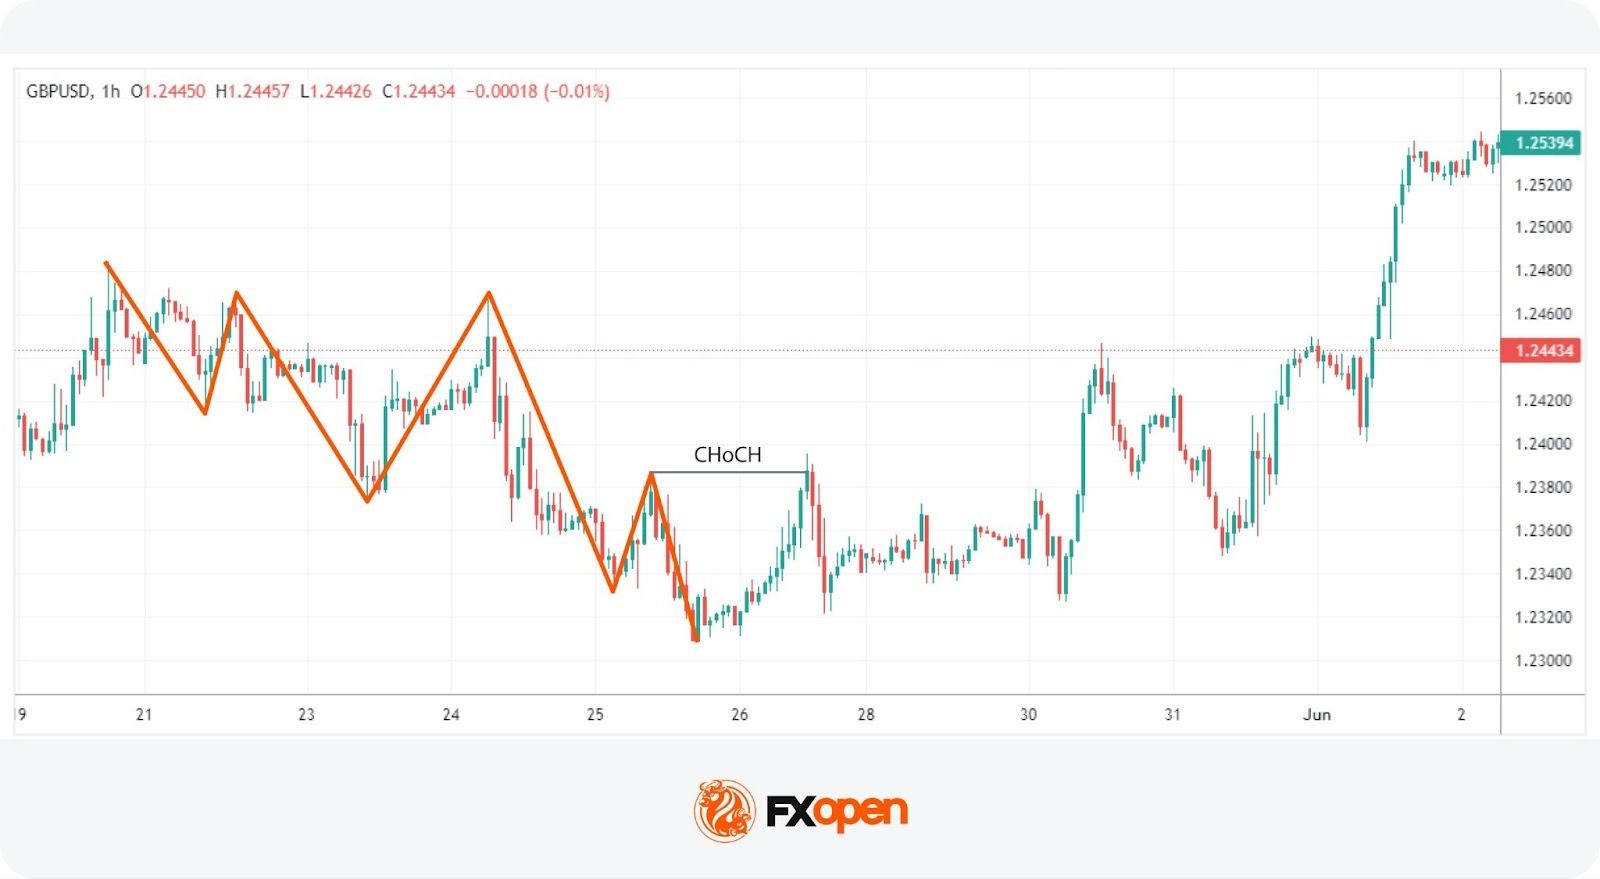
Similarly, during a bearish trend marked by lower highs and lower lows, a bullish CHoCH would occur if the price unexpectedly breaks above a recent lower high. This break indicates that sellers are losing their grip, and a bullish trend may be starting.
The Significance of CHoCHs Across Timeframes
The fractal nature of financial markets means that patterns and behaviours recur across various timeframes, each providing unique insights and implications for trading. Understanding CHoCHs in different timeframes may help traders align their strategies with both short- and long-term trend shifts. This is known as multi-timeframe analysis.
In intraday trading, where decisions are made on lower timeframes (like minutes or hours), a CHoCH can signal a possible short-term trend reversal. For example, if a currency pair in a downtrend on a 15-minute chart suddenly posts a higher high, this could indicate a weakening of the bearish momentum, suggesting a potential bullish reversal.
Traders might use this information to close short positions or to consider a long position, capitalising on the emerging upward trend. These short-term CHoCHs allow traders to respond quickly to market changes, potentially securing returns before larger market shifts occur.
Conversely, CHoCHs observed on higher timeframes, such as daily or weekly charts, are particularly significant because they can indicate a shift in the broader market trend that might last days, weeks, or even months. Such changes can then be used by both long and short-term traders to adjust their positioning and directional bias.
How Is Change of Character Identified?
The initial step to identify a CHoCH in trading involves clearly defining the existing trend on a specific timeframe. This is done by marking the significant swing highs and lows that delineate the trend’s progress. These points should represent somewhat meaningful retracements in the price, providing clear markers of trend continuity or potential reversal points.
According to the Smart Money Concept (SMC) theory, the integrity of an uptrend is maintained as long as the price does not trade through the most recent significant higher low. Conversely, a downtrend is considered intact if the price does not surpass the most recent significant lower high. Therefore, traders focus their attention on these critical points.
To identify a CHoCH, traders watch for a break in these crucial high or low points. For instance, in an uptrend, a bearish CHoCH is indicated when the price achieves a higher high but then reverses to descend below the previous significant higher low.
Similarly, in a downtrend, a bullish CHoCH occurs when the price drops to a lower low before reversing to break above the previous significant lower high, setting a new high. Both types of breaks signal a potential reversal in the trend direction.
To try and spot your own CHoCHs, you can head over to FXOpen’s TickTrader platform to access real-time charts and numerous market analysis tools.
Application of CHoCH
CHoCHs should be integrated with other aspects of the SMC framework. This includes the use of order blocks and imbalances, which are important components in identifying potential reversals.
Order Blocks and Imbalances
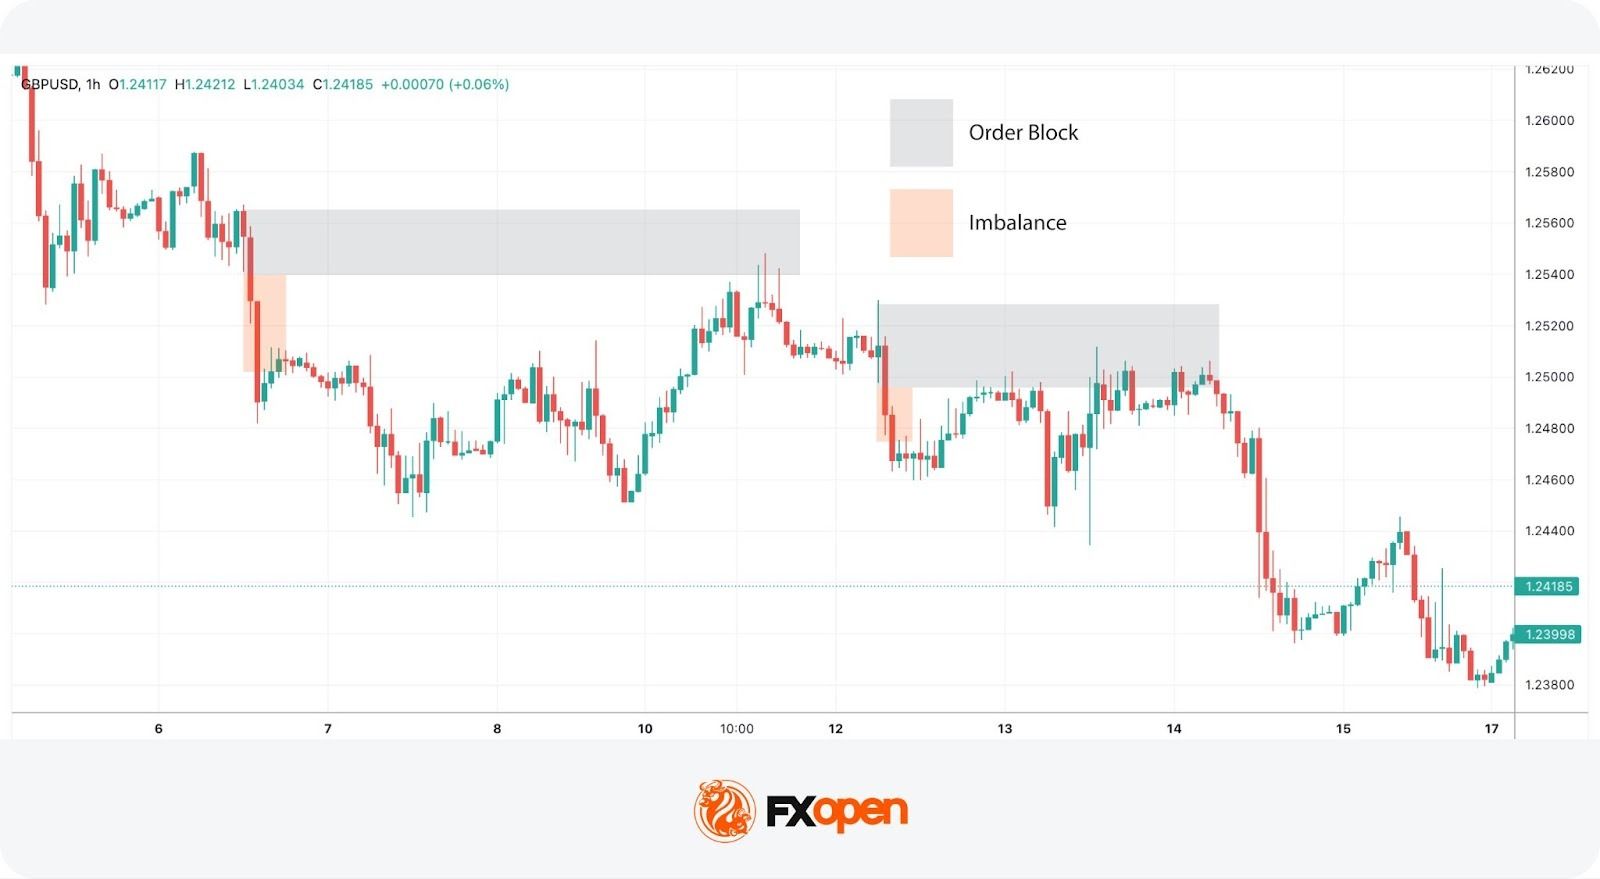
An order block is essentially a substantial consolidation area where significant buying or selling has occurred, and prices often revisit these zones before reversing. These blocks can be seen as levels where institutional orders were previously concentrated.
An imbalance, also known as a fair value gap, occurs when the price moves sharply up or down, leaving a zone that has not been traded extensively. Price often returns to these gaps to ‘fill’ them, establishing equilibrium before a potential reversal happens.
In practice, traders can look for a sequence where the price first approaches an order block and begins to fill any existing imbalances. This setup increases confidence in a potential reversal. As the price meets these criteria and a CHoCH occurs, this indicates that the influence of the order block is likely to initiate a price reversal.
Practical Example on GBP/USD
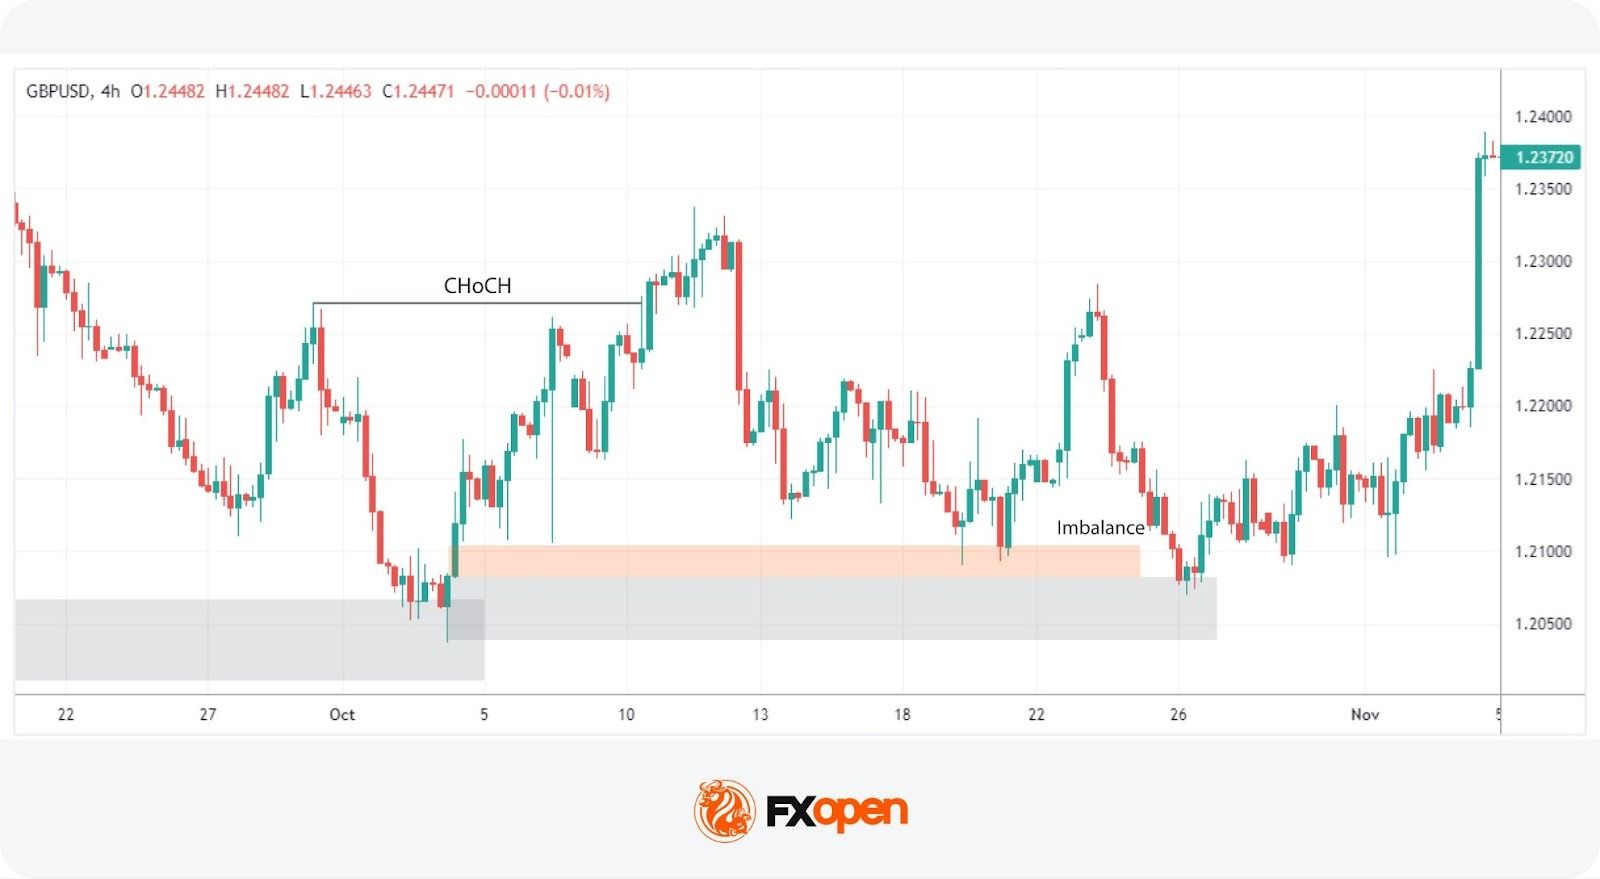
Consider the 4-hour chart of the GBP/USD pair above. We see the pair encounter an order block on the left, one that’s visible on the daily chart. As the price interacts with this block, it begins to retrace, attempting to fill the imbalance but moves away. Eventually, the price completes the fill of the imbalance and meets the previously established order block.
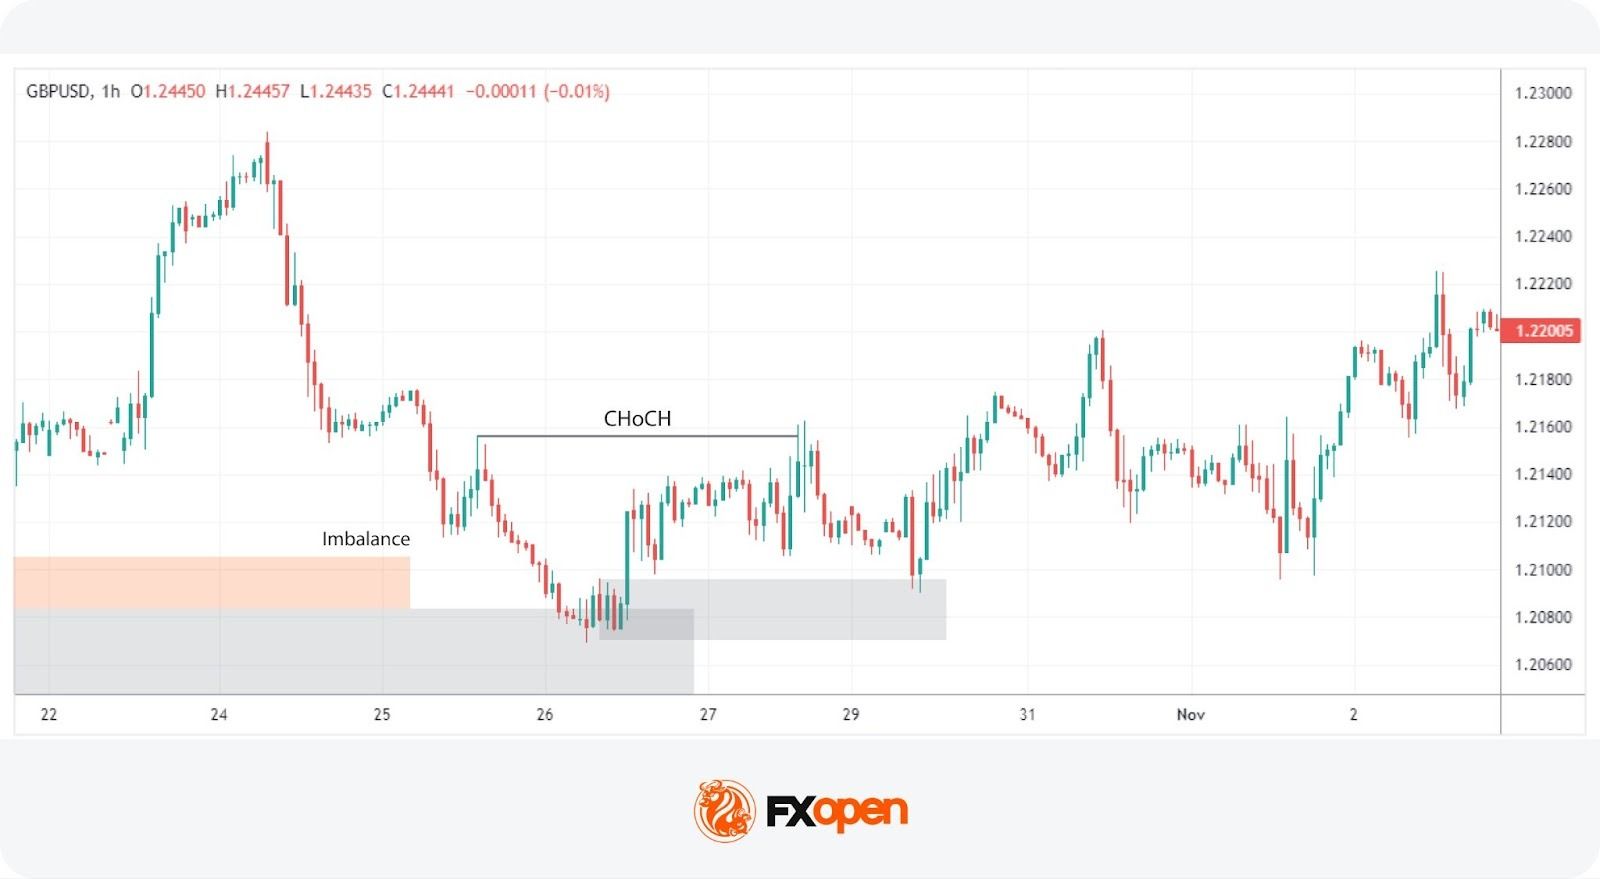
Switching to a 1-hour timeframe, this scenario unfolds similarly. After reaching the order block on the 4-hour chart, another CHoCH occurs, signalling the start of a new uptrend. This lower timeframe CHoCH, following the meeting of the order block, corroborates the potential for a reversal initiated by the higher timeframe dynamics.
This example illustrates how CHoCHs can be utilised across different timeframes, tying back to the fractal nature of markets discussed earlier. By recognising these patterns and understanding their interaction with order blocks and imbalances, traders can strategically position themselves to capitalise on potential market reversals, aligning their trades with deeper market forces at play.
Change of Character vs Market Structure Shift
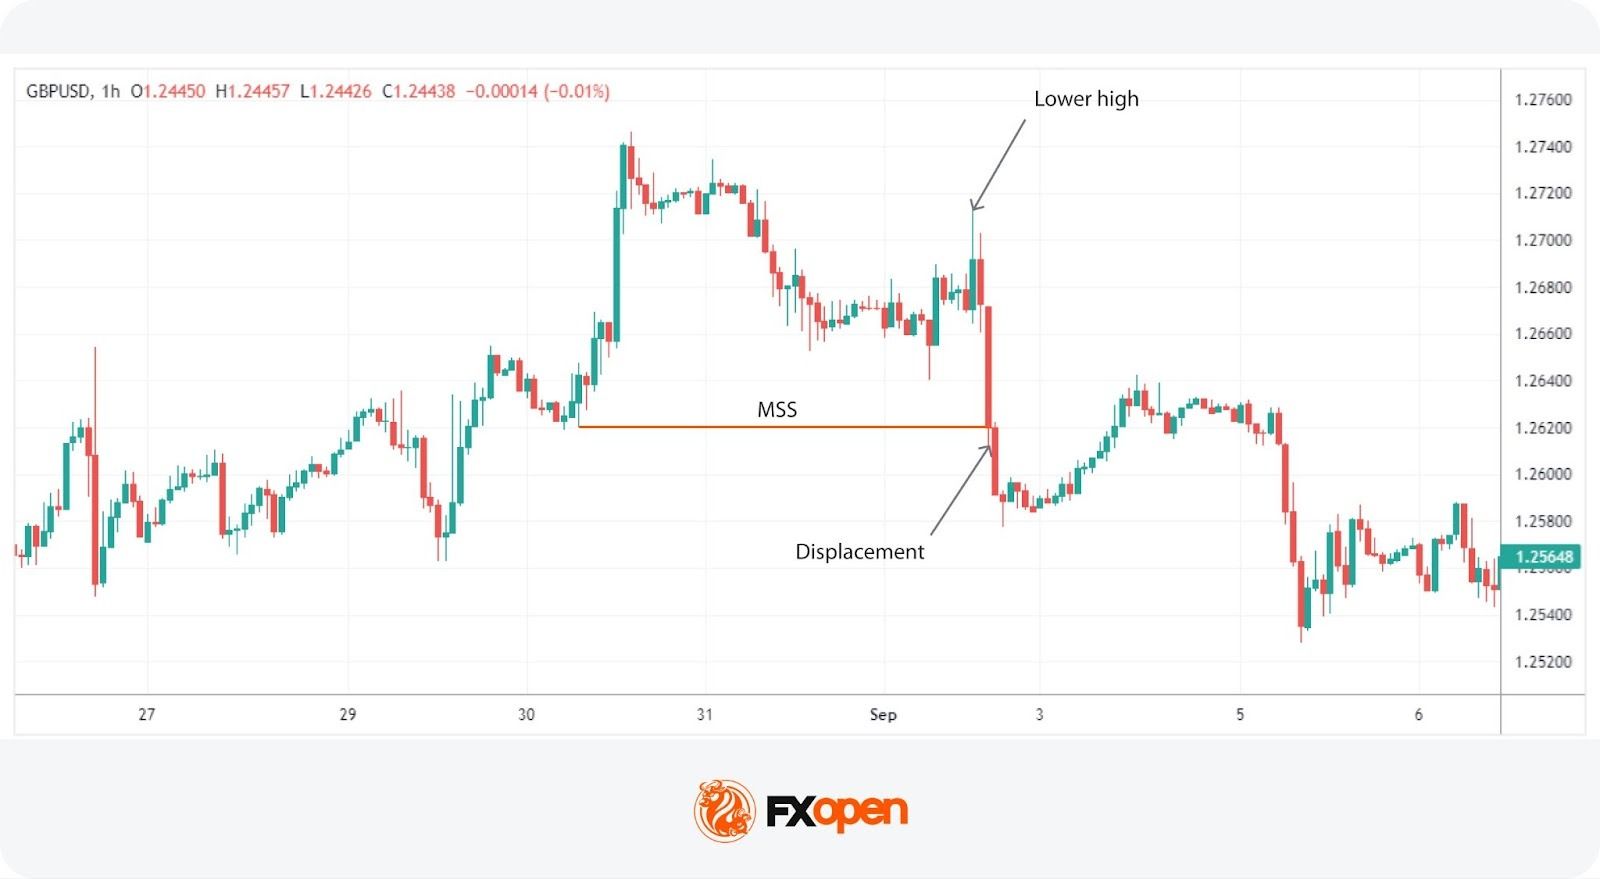
A Market Structure Shift (MSS) is a specific type of Change of Character that includes additional signals suggesting a potential trend reversal. Unlike a straightforward CHoCH that typically indicates a trend is shifting but may also be a false break, an MSS can be seen as a higher confluence CHoCH. An MSS occurs after the market first makes a key movement contrary to the established trend—forming a lower high in an uptrend or a higher low in a downtrend—without plotting a higher high or lower low.
Following these preliminary signals, an MSS is confirmed when there is a decisive break through a significant swing point accompanied by a strong displacement (i.e. impulse) move, creating a CHoCH in the process. This sequence not only reflects that the prevailing trend has paused but also that a new trend in the opposite direction is establishing itself.
Due to these additional confirmations, an MSS can offer added confirmation for traders, indicating a stronger likelihood that a new, sustainable trend has begun. This makes the MSS particularly valuable for traders looking for more substantiated signals in their trading strategy.
The Bottom Line
The Change of Character (CHoCH) is one of the popular Smart Money concepts, offering traders valuable insight into potential market reversals. By learning to identify CHoCH patterns, traders can align their strategies with institutional order flow. However, as with any trading tool, CHoCH isn’t used in isolation but combined with other market analysis techniques.
To test different trading approaches, you can consider opening an FXOpen account and access a wide range of financial assets, low commissions*, and tight spreads* (*additional fees may apply).
FAQ
What Is CHoCH in Trading?
In trading, CHoCH is a technical observation that signifies a change in the trend’s character, where the price movement breaks from its established pattern of highs and lows, suggesting a potential reversal or substantial shift in the market’s direction.
What Is CHoCH in SMC Trading?
In Smart Money Concept (SMC) trading, a Change of Character (CHoCH) refers to a clear shift in market behaviour that indicates a potential reversal of the prevailing trend. This concept is used by traders to detect early signs of a momentum shift that might lead to significant changes in price direction, enabling strategic adjustments to their trading positions.
What Is a CHoCH in the Market Structure?
A CHoCH in market structure is identified when there is an observable deviation from established price patterns — specifically when new highs or lows contradict the current trend. It signifies that the previous market sentiment is weakening, and a new opposite trend may be starting, prompting traders to reassess their strategies.
How Is CHoCH Identified on a Price Chart?
Identifying a CHoCH involves monitoring significant swing highs and lows for breaks that are contrary to the existing trend. For instance, in an uptrend, a CHoCH would be indicated by a failure to reach a new high followed by a drop below the recent higher low, suggesting a shift to a bearish outlook.
What Is ChoCH vs BOS in Trading?
While both CHoCH and Break of Structure (BOS) are critical in assessing market dynamics, they serve different purposes. CHoCH indicates a potential trend reversal by highlighting a significant change in the price pattern. In contrast, a BOS indicates a continuation of the current trend by showing the price surpassing previous significant highs or lows, reinforcing the ongoing direction.
This article represents the opinion of the Companies operating under the FXOpen brand only. It is not to be construed as an offer, solicitation, or recommendation with respect to products and services provided by the Companies operating under the FXOpen brand, nor is it to be considered financial advice.


Oil prices jumped more than 3% on Monday, pushing Brent crude above $116 a barrel. West Texas Intermediate (WTI), the US benchmark, climbed to roughly $102 per barrel.
The latest rise comes as the US-Israel war on Iran entered its fifth week with no signs of abating.
Oil Extends Its War-Fueled Rally
Several escalatory developments over the weekend fueled the surge. President Donald Trump told the Financial Times he could possibly seize Kharg Island, the terminal that handles roughly 90% of Iran’s crude exports.
Follow us on X to get the latest news as it happens
The US president struck a mixed tone on diplomacy with Iran, saying he was “pretty sure” of making a deal with Iran but conceding that talks could still collapse.
Meanwhile, Iran’s parliament speaker warned that Tehran would “set them on fire” when American forces arrived and promised consequences for US-allied nations in the region.
The oil price surge is far from over, according to market analysts, who warn that the prolonged closure of the Strait of Hormuz could drive crude even higher.
“A scenario in which the Strait remains closed for an additional month would be consistent with oil prices rising towards $150/bbl and constraints on industrial consumers of energy supply,” Bruce Kasman, global head of economics at JPMorgan, said.
According to Bloomberg, US officials and Wall Street analysts have also begun discussing the possibility of crude reaching $200 per barrel.
Subscribe to our YouTube channel to watch leaders and journalists provide expert insights
Asian Stocks Tumble, Crypto Feels the Pressure
The energy shock rippled across Asia. Google Finance data showed that Japan’s Nikkei 225 fell over 4.5%, while South Korea’s KOSPI dropped more than 4.3% as import-dependent economies repriced risk.
The volatility has spread to crypto markets, with asset prices dipping early in the morning before rebounding.
“The market briefly crashed just now — ETH dropped below $1,940 and BTC fell below $65,000,” Lookonchain reported.
Oil above $100 per barrel continues to pressure risk assets by fueling inflation expectations and delaying anticipated Federal Reserve rate cuts.
The post Oil Rose 3% to Open the Week: Here’s What Moved the Market on Monday appeared first on BeInCrypto.
Lido’s decentralized autonomous organization is considering a one-off $20 million buyback of its governance token to address so-called price dislocation, which is at “historically depressed levels” relative to Ether, according to the DAO.
The proposal, submitted Friday, seeks permission to swap 10,000 Lido Staked Ether (stETH) tokens, currently worth $20 million from the DAO’s treasury for Lido DAO (LDO), arguing that LDO is undervalued.
“This is not a routine fluctuation. It represents one of the most significant dislocations between LDO’s market price and its underlying protocol fundamentals in the token’s history.”
A token buyback of this size could boost the price of the token, which has fallen roughly 96% from its all-time high. In November, a Lido DAO member pitched an automated buyback mechanism for LDO to improve the token’s price. However, that proposal hasn’t been implemented.

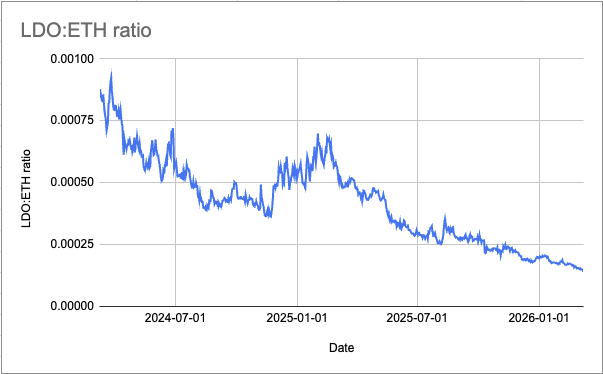
Lido DAO pointed out that LDO is trading at a steep discount to Ether (ETH) at a ratio of 0.00016, roughly 63% below its two-year median.
This is despite the protocol holding the top spot of the Ethereum liquid staking market, with a 23.2% share of staked Ether, according to Dune Analytics data. The protocol’s dominance has even been flagged as a centralization risk to the network in previous years.

Related: Ethereum builders propose ‘economic zone’ to tackle L2 fragmentation
LDO is currently trading at $0.30, down 95.9% from its $7.30 high set in August 2021, according to CoinGecko data. LDO’s $255 million market cap makes it the 141st largest token by value at the time of writing.
“That dislocation is not justified by a proportional deterioration in protocol performance,” Lido DAO said.
Lido DAO proposes buying stETH in batches
Lido DAO proposed buying up to 10,000 stETH in smaller batches of 1,000 to buy LDO.
Lido DAO said it would use limit orders or adopt a dollar-cost averaging strategy to avoid market volatility.
However, each batch would need approval and could be stopped by tokenholders.
After each batch, results would also need to be reported before continuing execution further.
The proposal also comes as Lido’s revenue fell 23% to 40.5 million in 2025, mostly due to staking fees falling 23% to $37.4 million.
Lido DAO argued the protocol’s fundamentals remain strong, noting that rewards declined just 20% amid the broader market pullback, costs improved 13% in 2025 compared with 2024 and Lido’s take rate rose from 5% to more than 6.1%, enhancing fee capture.
Take rate refers to the percentage of staked ETH rewards the protocol keeps as fees.
Magazine: Bitcoin’s ‘narrative vacuum,’ Ethereum now inevitable: Trade Secrets
Crypto World
Bitcoin’s Six-Month Losing Streak: What On-Chain Data Says About the Market’s Next Move

TLDR:
- Bitcoin may close March 2026 negative, marking six straight months of consecutive losses for the first time in years.
- SOPR data shows mild loss realization near the 1.0 level, but lacks the prolonged capitulation seen in the 2018 bear cycle.
- Declining exchange reserves suggest supply is being held off markets, yet weak ETF flows point to absent buyer demand.
- Analysts say recovering ETF inflows, a positive Coinbase Premium, and rising on-chain activity could spark a sharp BTC rebound.
Bitcoin is approaching a rare milestone that has historically preceded major market shifts. If March 2026 closes negative, it would mark six straight months of decline.
This pattern has appeared only a few times across crypto market history. Each instance was tied to a distinct structural event.
Analysts XWIN Research Japan studied this trend using CryptoQuant on-chain data. Their findings indicate the current cycle differs from past downturns in one key way.
Historical Comparisons Reveal Context for Bitcoin’s Extended Decline
Bitcoin’s 2014 four-month decline followed the collapse of the Mt. Gox exchange. That event damaged market trust and caused SOPR to become deeply unstable.
The data reflected a breakdown in market function itself, not a standard correction. It was a structural failure rooted in a single catastrophic exchange collapse.
The six-month decline from August 2018 to January 2019 followed the ICO bubble burst. SOPR stayed below 1 for a prolonged period, indicating widespread capitulation and forced selling.
The market underwent a full reset throughout that phase. A trend reversal followed as buying pressure eventually returned in early 2019.
Today’s SOPR reads near or slightly below 1, but sustained sub-1 behavior has not emerged. Loss realization is occurring, yet full capitulation has not taken place.
This separates the current phase from those earlier structural collapses. The market has not reached the same depth of distress seen in 2018.
In a post on Cryptoquant, analyst XWIN Research Japan noted that prior declines were driven by persistent selling pressure. The current downturn, however, is shaped by absent demand rather than forced exits.
That distinction changes how analysts should interpret this period. The framing of weakness matters when assessing potential recovery paths.
Demand, Absence, and On-Chain Signals Shape the Current Outlook
Exchange reserves are declining, which suggests supply is being held rather than actively sold. Yet weak Coinbase Premium data points to insufficient institutional buying interest in the market.
ETF flows have remained unstable, limiting new capital entry into the space. Together, these readings describe a market in pause rather than in freefall.
XWIN Research Japan noted that institutional infrastructure remains intact despite prolonged price weakness. Capital, however, has not returned in meaningful volume to the market.
Analysts describe this as a structural pause rather than a market breakdown. The market holds its footing but lacks the demand to move higher.
A sustained recovery would require ETF inflows to rebound and Coinbase Premium to turn positive. Rising on-chain activity would also need to accompany those developments.
If these signals align, analysts anticipate a sharp Bitcoin price recovery could follow. The timing of that convergence remains the central question for market participants.
Bitcoin now sits between structural resilience and cyclical weakness. Without full capitulation, further price consolidation is possible in the near term.
However, conditions for a reversal exist if demand returns. Monitoring on-chain data closely will be essential to tracking when the next directional move begins.

A new collaborative framework proposed by developers from Gnosis and Zisk, with support from the Ethereum Foundation, aims to knit Ethereum’s sprawling layer-2 ecosystem into a more cohesive execution fabric. The initiative, dubbed the Ethereum Economic Zone (EEZ), envisions cross-rollup interactions that would allow smart contracts on different rollups to run in lockstep with one another and settle back to Ethereum in a single transaction—without the need for traditional bridges.
Presented in an announcement shared with Cointelegraph, the EEZ would mitigate a central tension in Ethereum’s scaling approach: dozens of rollups have increased throughput, but liquidity, infrastructure, and user activity remain fragmented across separate networks. If realized, the framework could enable shared infrastructure across rollups and streamline settlement to Ethereum, reducing duplication and the burden of cross-chain transfers for developers and users alike.
The effort positions Ethereum researchers and a broader ecosystem behind a formal standard for interoperable rollups, with Gnosis and Zisk among the early contributors. The project also signals a broader push to move beyond isolated scaling layers toward a more unified execution layer architecture. Early participants include infrastructure providers and DeFi protocols exploring a common standard for interoperable rollups.
Key takeaways
- EEZ would allow cross-rollup smart-contract execution to occur synchronously, bypassing bridges and settlement bottlenecks.
- The proposal targets liquidity fragmentation by enabling shared infrastructure and cohesive interaction among rollups and Ethereum mainnet.
- The EEZ Alliance has been formed to coordinate standards and push adoption as Ethereum’s scaling landscape evolves.
- Gnosis and Zisk anchor the initiative, with involvement from Ethereum researchers and other industry actors; Jordi Baylina (Zisk) cites zero-knowledge proving expertise as a key component.
- Technical details and performance benchmarks are slated for release in the coming weeks as the framework moves from concept to design and potential deployment.
Interoperability in the spotlight as scaling debate intensifies
The EEZ proposal arrives amid a long-running discussion within the Ethereum community about the trade-offs of a rollup-centric scaling path. Rollups have pushed throughput higher than base Ethereum, but the field has grown into a tapestry of separate ecosystems, each with its own liquidity and user base. Data from L2BEAT indicates there are more than 20 active layer-2 networks with collectively close to $40 billion in total value locked, distributed across networks like Arbitrum, Base, and Optimism. The outcome has been a parallelized execution environment rather than a single, consolidated scaling layer.
Industry voices have recently highlighted concerns about the architecture of some L2s. Vitalik Buterin suggested in a February X post that the original vision for L2s and their role in Ethereum may require a rethink, pointing to potential weak points in centralized sequencers and trusted bridges. The ensuing discussion among L2 builders underscored a spectrum of views on whether scaling alone remains the priority or if interoperability and unified settlement should take a more central role in the network’s evolution.
Karl Floersch, co-founder of Optimism, has acknowledged the need for L2s to evolve beyond simple scaling mechanics, citing ongoing technical hurdles. Steven Goldfeder, co-founder of Offchain Labs (the team behind Arbitrum), emphasized that scaling remains a core function as rollups continue to handle higher transaction throughput than Ethereum itself. The EEZ concept could be seen as a response to these ongoing debates, offering a pathway to reduce cross-network friction while preserving the performance advantages of rollups.
What changes with EEZ—and what remains uncertain
If the EEZ framework progresses, it would potentially enable applications to share infrastructure across multiple rollups and settle their state to Ethereum in a coordinated fashion. This would reduce duplication of validators, data availability resources, and bridging overhead, while preserving rollups’ high throughput. The defining feature would be a synchronized execution model that subscribes to a common standard, enabling more seamless inter-rollup communication and a more unified user experience.
Several questions remain as the project moves from concept to design. How would a cross-rollup execution model handle security guarantees across diverse rollups with different trust assumptions? What governance and standardization processes would be needed to ensure broad acceptance across the ecosystem? And crucially, what would adoption look like in practice—how quickly would developers and users pivot to a shared framework, and what incentives would drive this transition?
Early work emphasizes collaboration among major ecosystem players, with the EEZ Alliance positioned to coordinate development, testing, and eventual rollout. While concrete technical specifications are not yet public, the timeline anticipates forthcoming detail on implementation strategies, performance benchmarks, and compatibility assurances across major rollups.
What to watch next
Developers expect a more detailed technical outline in the weeks ahead, accompanied by benchmarks illustrating how cross-rollup synchronization would perform under realistic workloads. The EEZ Alliance’s progress will also be a key indicator of whether the broader ecosystem is ready to adopt a shared standard that could reduce cross-network friction while maintaining or enhancing security, reliability, and user experience.
Investors and builders should monitor how the EEZ concept interacts with ongoing efforts to modularize Ethereum’s scaling stack, including cross-layer collaboration, data availability solutions, and zk-based tooling. The question of whether a unified cross-rollup framework can gain rapid traction remains open, but the proposal clearly signals a deliberate shift toward interoperability as a central pillar of Ethereum’s long-term scaling strategy.
As Ethereum’s scaling architecture continues to evolve, the next few quarters could reveal whether the EEZ Alliance becomes a conventional standard, or whether the path toward a truly cohesive rollup economy will require alternative approaches. For now, the industry is watching a select group of core contributors test a bold idea: how to turn multiple high-throughput networks into a single, more efficient ecosystem without surrendering the strengths that have driven their rapid growth.
Readers should stay tuned for technical disclosures and real-world experimentation that would demonstrate the practicality of cross-rollup synchronization and the feasibility of shared infrastructure across rollups—an outcome that could reshape how developers build and users interact with Ethereum’s scaling frontier.
TLDR:
- Brent crude consolidating at $100.66 places 30% of global oil supply under critical logistical risk at the Strait of Hormuz.
- Institutions moved $11.574 billion in Bitcoin through OTC desks, locking supply as a strategic reserve amid cost-push inflation fears.
- Bitcoin’s $65K–$70K structural support zone holds a 65% survival probability, contingent on no global credit market capitulation.
- A systemic stress scenario tied to April 6th liquidity risk could push Bitcoin toward a corrective low of $54,000 per coin.
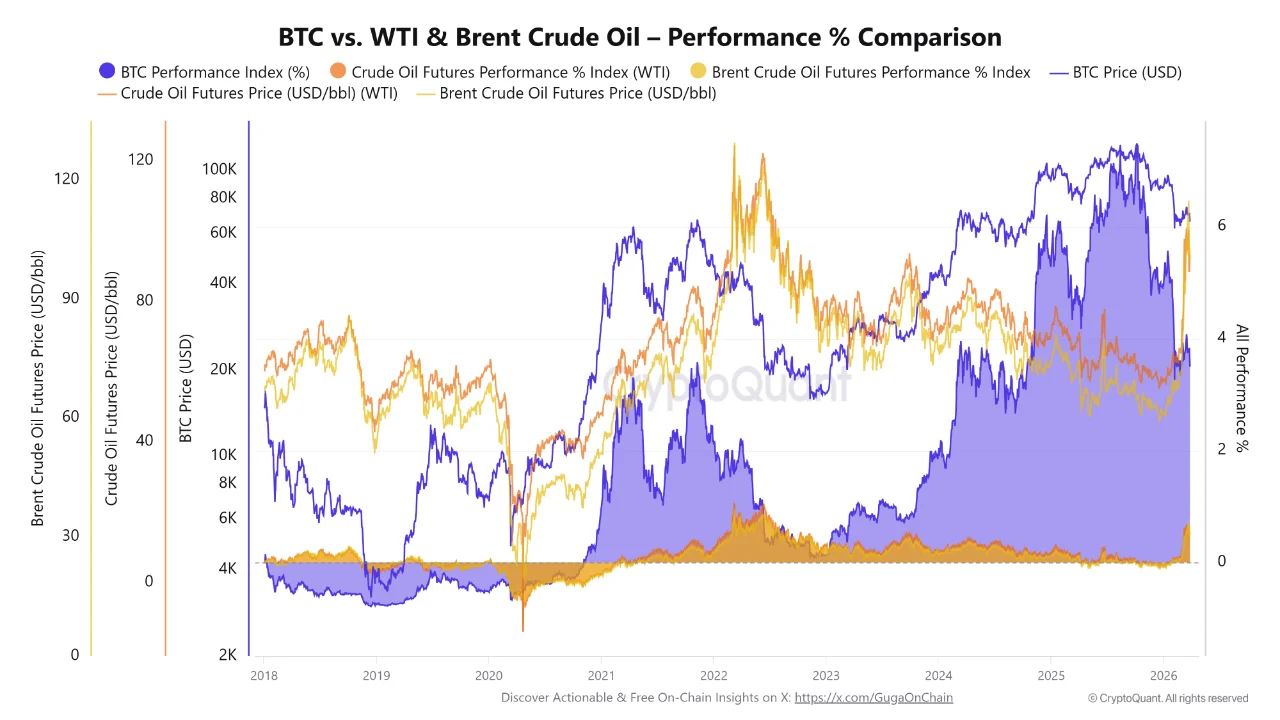
The ghost of 1973 is back, and oil at $100 is forcing a reckoning across global markets. Brent crude has consolidated at $100.66 per barrel as the Strait of Hormuz faces active geopolitical tension.
Roughly 30% of the world’s oil supply now sits under critical logistical risk. Bitcoin, priced at $66,339.88 after a 3.45% weekly decline, is caught in the crossfire.
On-chain data tracked by GugaOnChain reveals $12.3351 billion in institutional movement reshaping how the market absorbs this pressure.
Oil’s 1973 Echo Puts Bitcoin’s Neutral Infrastructure Under the Spotlight
The 1973 oil crisis repriced nearly every asset class as supply disruptions spread across global economies. Today’s energy shock carries a structurally similar fingerprint, with physical logistics facing blockade-level risk at a critical shipping corridor. Unlike oil, Bitcoin moves without ships, pipelines, or territorial dependencies.
GugaOnChain described Bitcoin as a liquidity rail that operates outside physical blockades entirely. This framing positions the asset differently from commodities that rely on geographic infrastructure to settle and clear. When oil freezes at a chokepoint, Bitcoin settlement continues at the same pace.
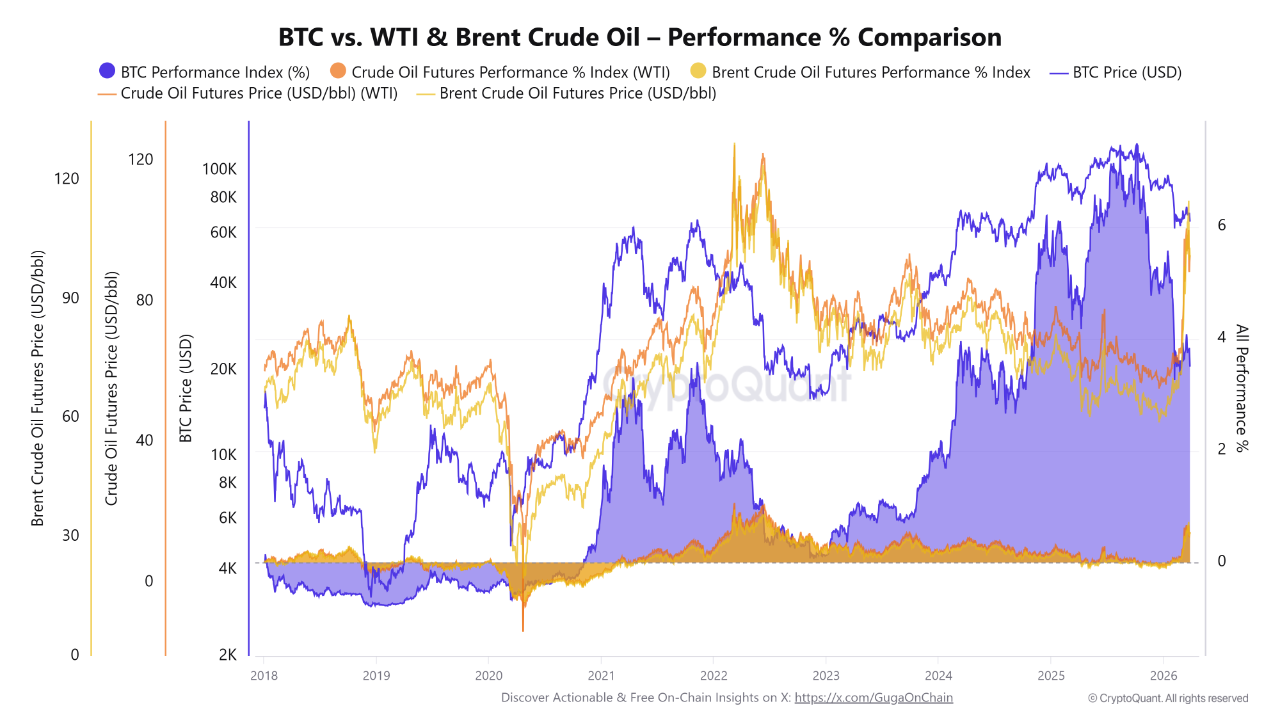
Source: Crptoquant
That distinction becomes relevant as cost-push inflation pressures mount from rising energy prices. Institutions appear to be responding to this dynamic through heavy over-the-counter accumulation.
Of the $12.3351 billion tracked on-chain, 93.83%—approximately $11.574 billion—flowed through OTC desks away from public exchanges.
This volume signals a deliberate strategy to lock Bitcoin as a strategic reserve during the current macro disruption. Smart money is absorbing mobile supply during the panic rather than exiting.
The 1973 parallel holds here too — those who held hard assets through the energy crisis largely preserved purchasing power.
Bitcoin’s $65K–$70K Support Zone Faces a Systemic Stress Test
The $65,000–$70,000 range now serves as a structural support zone anchored by Bitcoin’s realized price. GugaOnChain estimates a 65% probability that this zone holds through the current volatility cycle. That probability, however, depends on global credit markets avoiding a full capitulation event.
The probability of a broader liquidity crunch in traditional markets currently sits between 45% and 50%. Such an event would trigger margin calls across leveraged positions, forcing temporary liquidations even where demand remains fundamentally strong. The shallow exchange order book raises the risk of moves exceeding 8% to above 70% on any geopolitical trigger.
GugaOnChain flagged April 6th as a concentrated risk window, calling it a global liquidity solvency test. A systemic stress scenario during this period could drive a corrective move toward $54,000. Derivative hedges are recommended as active protection around this specific date for exposed portfolios.
The overall asymmetry remains neutral-to-positive given the supply lock-up through OTC channels. Forced scarcity from institutional accumulation creates a structural floor even as downside scenarios remain on the table.
Bitcoin’s trial by fire, much like 1973, will ultimately determine whether the asset earns its place as a credible reserve in an energy-disrupted world.

Ethereum’s effort to reclaim the market’s No. 2 spot is facing a different obstacle this year: a booming stablecoin economy. While Bitcoin remains the dominant benchmark, the faster-growing sector of dollar-denominated crypto assets is reshaping how capital flows through the space, with USDT leading the charge and pulling liquidity away from ETH at the margins.
Five-year data show a striking divergence in growth patterns. ETH’s market capitalization rose by about 11.75% over the past five years to roughly $240 billion, but USDT tallied a far larger ascent, expanding by approximately 622.5% to more than $184 billion in market cap. XRP and USD Coin have also outpaced ETH in growth over the same horizon. That dynamic helps explain traders’ evolving bets on whether ETH can hold or reclaim its No. 2 ranking in 2026. On Polymarket, more than 59% of wagers are currently predicting ETH will drop from the No. 2 position in 2026, up from around 17% at the start of the year, signaling a shift in sentiment as the stablecoin economy strengthens.
Key takeaways
- Stablecoins are reshaping market leadership: ETH’s five-year market-cap growth trails USDT, XRP, and USDC, signaling a broader reallocation of capital away from ETH toward dollar-pegged assets.
- USDT dominates the stablecoin landscape: the total stablecoin market sits near $310 billion, with Tether controlling about 58% of that share.
- Weak ETH demand from institutions: US spot Ethereum ETFs have seen assets under management fall about 65% year-to-date, dipping to roughly $11.76 billion in March from $31.86 billion in October last year.
- Market fragility and risk-off dynamics: macro headwinds—from tariffs to geopolitical tensions and shifting expectations for rate cuts—have amplified demand for liquidity and safety, benefiting stablecoins.
- Technical setup points to potential near-term downside: Ether is forming a bear-flag pattern, with a measured downside target around $1,250 if the breakdown persists into mid-2026.
Why stablecoins are pulling the rug from under ETH
ETH’s price dynamics have historically benefited when risk appetite was broad and capital flowed into sustained growth narratives around decentralized finance and smart-contract infrastructure. But the current macro environment has encouraged more conservative positioning and a preference for liquidity and capital preservation. Stablecoins—crypto dollars designed to maintain peg to the U.S. dollar—serve as a ready-made conduit for capital during risk-off phases. This dynamic helps explain why USDT’s market capitalization has surged while ETH’s growth has lagged behind some of its peers.
Market data show the broader stablecoin sector has grown to about $310 billion, a level that reflects deep liquidity and the willingness of traders and institutions to park cash in a familiar, compliant asset rather than chase the latest DeFi yield. With USDT accounting for the lion’s share of this market, investors gain access to rapid risk management, arbitrage opportunities, and flexibility in a choppy macro backdrop. In contrast, ETH’s value creation remains tethered to the crypto cycle and the willingness of market participants to take on price risk for longer-term network fundamentals.
These forces help explain why ETH’s market cap expansion has not kept pace with the sheer scale and velocity of stablecoins. For traders and builders, the implication is clear: even as Ethereum remains foundational to DeFi and smart contracts, it faces structural headwinds when overall risk sentiment cools and liquidity seeking behavior drives inflows into dollar-pegged assets.
Institutional demand for ETH cools as stablecoins flourish
The narrative around Ethereum ETFs has also shifted. Data tracked by Glassnode show that US spot Ethereum ETF balances have declined sharply, with assets under management sliding from about $31.86 billion in October last year to roughly $11.76 billion in March—a drop of around 65%. This trend underscores how institutional appetite for ETH, whether through spot structures or related products, has cooled in the face of competing liquidity instruments and a more cautious macro environment.
Industry observers point to a few contributing factors: hedging and liquidity preferences during a risk-off cycle, evolving regulatory expectations around ETF products, and a general rotation of capital toward assets with visible liquidity profiles in volatile markets. While Ethereum remains a core infrastructure asset for many users and developers, the near-term flow dynamics suggest that institutional catalysts for a sustained ETH price breakout may be harder to come by without broader risk-on momentum.
What to watch next: price structure and market sentiment
From a technical standpoint, Ether appears to be navigating a bear-flag formation on shorter timeframes. A breakdown below the structure’s lower trendline would, in this reading, increase the probability of a corrective move toward the low-$1,000s region. A commonly cited target sits near $1,250 by June, should the pattern play out as anticipated. Of course, chart-based forecasts carry uncertainty, and headlines—ranging from regulatory developments to macro policy shifts—can alter the trajectory quickly.
Beyond price, the evolving balance between ETH and stablecoins in market liquidity is a critical barometer. If risk appetite improves and demand for ETH returns, the relative performance gap could narrow as DeFi activity, NFT markets, and institutional participation regain steam. Conversely, further strength in the stablecoin market and continued preference for cash-like liquidity could keep ETH price gains muted even as the broader crypto ecosystem remains active in pockets of use and development.
Key signals to watch include: changes in stablecoin issuance and redemption trends, ETF inflows or outflows for ETH-related products, and macro developments that alter risk sentiment or the expected pace of Federal Reserve policy. If the bear-case scenario unfolds, investors will want to monitor whether ETH can anchor a bottom while stablecoins continue to absorb a large share of new liquidity in the crypto space.
Ultimately, the question for 2026 remains partly about ETH’s fundamental resilience and partly about the broader appetite for dollar-denominated liquidity in a volatile market. As the ecosystem evolves, investors, traders, and builders will need to weigh ETH’s role as infrastructure against the advantages that stablecoins offer in terms of liquidity, risk management, and cross-asset flexibility.
Readers should keep an eye on ETF flow patterns, the pace of stablecoin growth, and the macro signals that drive risk-on versus risk-off dynamics. Those factors will help determine whether ETH can reverse the current trajectory or whether stablecoins will continue to crowd out its price drivers in the near term.
TLDR:
- Russia’s monthly oil revenue doubled to $24 billion as Brent crude surpassed $100 per barrel.
- Ukraine’s drone strikes have taken roughly 40 percent of Russian export refining capacity offline.
- Iran’s attack on Ras Laffan removed 17 percent of global LNG and 33 percent of helium supply.
- Western sanctions capped Russian oil at $60 per barrel, but the dual-war supply shock made it void.
Russia’s oil revenue has surged sharply as two concurrent conflicts disrupt global energy supply chains. Ukrainian drone strikes have degraded roughly 40 percent of Russian export refining capacity in recent weeks.
At the same time, Iran’s strikes on Gulf infrastructure pushed Brent crude above $100 per barrel. Russia’s Foreign Minister Lavrov and President Putin have both publicly forecast oil reaching $150 per barrel. Russia appears financially positioned to benefit from both conflicts running simultaneously.
Russia Benefits as Iran’s Gulf Strikes Push Oil Above $100
Russia supplied Shahed drone technology and design upgrades to Iran’s Islamic Revolutionary Guard Corps over recent years. Those drones, combined with Chinese BeiDou-guided ballistic missiles, struck the Ras Laffan complex in Qatar.
The attack removed 17 percent of global LNG export capacity and 33 percent of global helium supply. The energy shock from those strikes quickly pushed Brent crude above $100 per barrel.
Russia’s monthly oil revenue consequently doubled to $24 billion as crude prices climbed. The Western sanctions price cap of $60 per barrel has since become functionally irrelevant at current market levels.
Sanctions were designed to target Russian oil pricing, but both conflicts have instead targeted global supply directly. Supply disruptions have overpowered the sanctions framework that was originally built to limit Russian earnings.
On March 27, Lavrov publicly warned of what he called “the most severe energy crisis in human history.” Putin followed by openly forecasting oil at $150 per barrel shortly after.
Both leaders are stating a price target that enriches Russia with every dollar crude rises above current levels. Social media analyst Shanaka Anslem Perera described it as a self-amplifying feedback loop that continuously benefits Russia.
Perera wrote: “Russia arms Iran. Iran closes Hormuz. Hormuz closure spikes oil. Oil spike enriches Russia.” He further noted that Russia needs neither Hormuz reopened nor its own refineries fully operational.
Russia needs both disruptions to persist so their combined effect drives oil toward $150. The compound supply shock, as a result, overwhelms a sanctions architecture never designed for this dual-war scenario.
Ukraine Retaliates Against Russian Refineries and Builds New Alliances
Ukraine struck the Tuapse refinery complex, one of Russia’s largest, setting it ablaze with precision drones. Combined with weather damage and maintenance backlogs, approximately 40 percent of Russian export refining capacity is now offline.
Each barrel of Russian refined product removed from markets tightens global supply further. Every tightening, in turn, pushes oil closer to the $150 target Russia has publicly forecast.
That same week, Ukrainian President Zelensky traveled to Saudi Arabia for high-level diplomatic engagements. Ukraine offered its battle-tested anti-drone expertise to protect Gulf LNG and helium infrastructure directly.
Ukrainian technology has already proven effective against the same Shahed variants Iran deploys in the broader region. This opened an unexpected military technology export market for Ukraine among the world’s wealthiest nations.
The OECD revised US inflation projections upward to 4.2 percent, directly linking the change to the Iran-driven energy shock. BlackRock CEO Larry Fink stated publicly that $150 oil would likely trigger a global recession.
Ukraine’s strikes on Russian refineries and Iran’s pressure on Gulf supplies are tightening markets from opposite directions.
Russia, however, continues collecting elevated revenue from price premiums generated by both disruptions running at once.
Perera closed his widely shared analysis with a sharp observation: “Two wars. One price. One beneficiary. The arsonist is selling fire insurance.”
The feedback loop connecting both conflicts shows no sign of breaking under current conditions. Russia’s oil earnings continue to grow beyond what any sanctions cap was structured to contain.
As long as both wars persist, Russia’s financial position remains stronger than at any prior point since invading Ukraine.
TLDR:
- Dogecoin is printing a consistent accumulation-markup-pullback cycle near $0.09, signaling structured price behavior.
- Analysts note shallow pullbacks and tight consolidation zones that point to underlying demand supporting DOGE price.
- A long-term MACD crossover is forming on macro timeframes, a signal that has historically preceded DOGE rallies.
- The $0.05 support level remains critical, as a hold with MACD confirmation could trigger a broader bullish reversal.
Dogecoin is once again following a recurring cycle pattern that analysts say could fuel fresh rally expectations. The token has been trading near $0.09, where chart structures show a consistent sequence of accumulation, markup, and pullback phases.
Adding to the outlook, a long-term MACD signal is now forming on macro timeframes. These two developments are drawing close attention from traders watching for the next directional move in DOGE.
Recurring Accumulation Cycle Points to Potential Markup Phase
Dogecoin has been printing a recognizable cycle structure that technical analysts describe as methodical. Crypto analyst Bitcoinsensus recently outlined the pattern, noting three repeating phases: accumulation, markup, and pullback. The consistency of this structure across multiple cycles is what separates it from typical sideways price action.
Each accumulation phase begins with a contraction in volatility. Price trades within a tight range as buyers absorb available supply at lower levels. This compression phase tends to persist until a liquidity event triggers the next move upward.
The markup phase that follows is typically sharp and measured. Bitcoinsensus noted that these moves often begin with stop hunts, clearing out weak hands before price advances. Rather than forming a sustained trend, these bursts reflect structured participation, likely algorithmic in nature.
After each markup, Dogecoin enters a shallow pullback that respects prior breakout zones. These retracements hold above key support areas, reinforcing the presence of underlying demand. If the current consolidation near $0.09 maintains this structure, the next markup phase could be forming.
MACD Signal on Macro Chart Strengthens Rally Expectations
Beyond the micro-cycle structure, a broader technical signal is now building on Dogecoin’s macro chart. Crypto Logic Lab flagged a developing MACD crossover forming on longer-term timeframes, not the daily, but higher macro charts. This type of signal has historically preceded sustained rallies in DOGE.
Bears are currently targeting the $0.05 level as a key zone to test before the crossover confirms. The strategy involves pushing price lower to shake out long positions and trigger stop losses. Both sides of the market are watching this level, making it the central battleground for this cycle.
Crypto Logic Lab noted that the MACD signal is forming ahead of any price breakout, which represents the optimal positioning window.
A hold at $0.05 combined with MACD confirmation would strengthen the case for a reversal and a broader rally. A breakdown below that level, however, would cancel the bullish setup entirely.
The convergence of the recurring cycle pattern and the developing macro MACD signal gives rally expectations a stronger technical foundation.
Traders are watching for a breakout above the recent local high as confirmation. Until then, the $0.05 support zone remains the critical level to monitor for directional clarity.

The crypto market is buzzing again, are you watching closely or missing out? With Bitcoin showing renewed strength and Solana gaining momentum from recent ecosystem growth, investors are actively hunting for the best altcoins to invest before the next breakout wave hits.
While Bitcoin holds dominance and Solana continues scaling with faster transactions, a new contender is quietly building explosive potential. Enter APEMARS ($APRZ), currently in presale and already generating serious buzz. As major coins make headlines, smart investors are positioning early in projects like APEMARS that could deliver life-changing returns before hitting exchanges.
APEMARS: The Best Altcoins To Invest Before The Next Surge
If you’re searching for the best altcoins to invest, timing is everything, and APEMARS is right at that sweet spot. Still in presale, it offers a rare early-entry opportunity that most investors only wish they had with projects like Solana or even Bitcoin in their early days.
APEMARS is currently in Stage 14 (Drift King) of its presale, priced at $0.00017238, with a projected listing price of $0.0055. That’s a massive 3,090% ROI potential from this stage alone. With over 1,505 holders, $345K+ raised, and 22.84 billion tokens sold, the momentum is undeniable. The numbers aren’t just stats, they signal growing demand and shrinking opportunity.
Staking System Powering Long-Term Growth
One of the strongest features of APEMARS is its staking system, known as the APE Yield Station. Offering an impressive 63% APY, it allows investors to grow their holdings passively. Inspired by Mars’ extreme conditions, this mechanism isn’t just creative, it’s strategic. With a mandatory 2-month lock post-launch, it helps stabilize early trading and reduces sell pressure, giving the project a stronger foundation right out of the gate.
Orbital Boost Referral System Driving Viral Expansion
APEMARS also introduces a powerful referral system called the Orbital Boost System. Once you contribute at least $22, you unlock the ability to earn 9.34% rewards for both you and your referrals. This creates a community-driven growth engine where users are incentivized to spread the word, fueling organic expansion and increasing demand as the presale progresses.
How To Buy APEMARS
Getting started with APEMARS is simple:
- Visit the official presale platform
- Connect your crypto wallet (like MetaMask)
- Choose your investment amount
- Confirm the transaction
- Secure your tokens before the next stage price increase
Turn $2,000 Into A Massive Win: APEMARS ROI Breakdown
Let’s talk real numbers, because this is where things get exciting.
If you invest $2,000 today at Stage 14 price ($0.00017238), you’ll receive approximately 11.6 million tokens.
- At launch price ($0.0055): Your $2,000 becomes approximately $63,800
- If APEMARS reaches $1: Your investment skyrockets to $11.6 million
- At $5: You’re looking at a jaw-dropping $58 million+
This is why early investors hunt presales. While others chase trends, you position yourself before the wave hits. If you’ve ever regretted missing early Bitcoin or Solana, this is your second chance.
Solana Surges With Ecosystem Growth And Institutional Attention
Solana has recently been gaining traction again, fueled by increased developer activity and institutional interest. Faster transaction speeds and lower fees continue to make it a strong competitor in the smart contract space.
With growing adoption in DeFi and NFTs, Solana is proving its resilience after past challenges. Many analysts are optimistic about its future, and it often appears in discussions around Bitcoin price prediction and broader altcoin market movements. However, while Solana offers stability, its explosive growth phase may already be partially priced in.
Bitcoin Holds Strong As Market Confidence Returns
Bitcoin remains the backbone of the crypto market. Recent bullish sentiment, ETF developments, and macroeconomic factors have helped it maintain strong price support.
As always, Bitcoin is seen as a safer long-term hold, especially during uncertain times. But for investors seeking exponential returns rather than steady growth, Bitcoin’s size limits its upside compared to emerging projects. It sets the tone for the market, but smaller caps like APEMARS create the real wealth opportunities.
Conclusion
The search for the best altcoins to invest often leads investors to established names like Bitcoin and Solana, but the biggest gains usually come from getting in early. APEMARS is still in its presale phase, offering a rare opportunity to enter before exchange listings drive prices higher. With strong tokenomics, staking rewards, and viral growth mechanisms, it’s designed for momentum.
If you’re serious about finding the best crypto to buy now, APEMARS stands out as a high-potential contender. Opportunities like this don’t stay open forever. As stages progress and prices rise, early access disappears. Don’t wait until it trends, position yourself now and be part of the journey before the masses arrive.
Using the information curated by best crypto to buy now, this analysis presents an overview of crypto rankings and growth opportunities.
For More Information:
Website: Visit the Official APEMARS Website
Telegram: Join the APEMARS Telegram Channel
Twitter: Follow APEMARS ON X (Formerly Twitter)
Frequently Asked Questions About Best Altcoins To Invest
What Are The Best Altcoins To Invest In 2026?
The best altcoins to invest include emerging presale projects like APEMARS, alongside established coins. Early-stage investments often provide higher ROI potential compared to already matured cryptocurrencies.
Is APEMARS ($APRZ) A Good Investment?
APEMARS ($APRZ) offers strong presale metrics, staking rewards, and referral incentives. Its early entry price and structured growth model make it appealing for high-risk, high-reward investors.
How Does Bitcoin Price Prediction Affect Altcoins?
Bitcoin price prediction often reflects broader market sentiment. When XRP and major altcoins rise, it signals bullish momentum that can positively impact smaller projects like APEMARS.
Can APEMARS Compete With Solana And Bitcoin?
While Solana and Bitcoin are established, APEMARS has higher growth potential due to its early stage. It targets exponential returns rather than stability.
When Is The Best Time To Buy APEMARS?
The best time is during presale stages like Stage 14, where prices are still low. Early participation increases potential ROI before exchange listings.
Disclaimer: This is a Press Release provided by a third party who is responsible for the content. Please conduct your own research before taking any action based on the content.

Crypto gambling has grown steadily over the past few years, and 2026 has brought more competition to the space than ever. Stake.com remains one of the biggest names in the industry, but it is no longer the only platform drawing serious attention. ZunaBet entered the market this year and has quickly become a talking point among crypto gamblers. This comparison looks at both platforms across bonuses, game selection, loyalty rewards, and overall value.
What Stake.com Brings to the Table
Stake.com has been around since 2017. It operates under a Curaçao license and has grown into one of the most visited crypto gambling sites in the world. The platform covers both casino games and sports betting, with support for Bitcoin, Ethereum, Litecoin, Dogecoin, and several other cryptocurrencies.
A big part of Stake’s identity is its library of original games. Titles like Plinko, Crash, Mines, and Dice are provably fair and have developed a loyal following. Outside of originals, Stake carries slots and live dealer tables from well-known providers including Pragmatic Play, Hacksaw Gaming, and Evolution.

The sportsbook side covers major leagues and sports globally, including football, basketball, tennis, MMA, and a solid esports section. Stake has earned a reputation for sharp odds and a straightforward betting experience.
Where Stake stands apart from most competitors is its approach to bonuses. There is no welcome bonus. No deposit match, no free spins for signing up. Instead, Stake operates an invite-only VIP program where rewards are unlocked based on wagering volume over time. Benefits at higher tiers include rakeback, weekly and monthly bonuses, and tailored offers. This setup favors players who are already planning to bet frequently and in larger amounts.
What ZunaBet Offers as a Newcomer
ZunaBet went live in 2026 under the ownership of Strathvale Group Ltd. It holds an Anjouan gaming license and was built by a team with more than 20 years of combined experience in online gambling. The platform was designed from the ground up as crypto-first, meaning crypto is the primary way to deposit and withdraw rather than a secondary option bolted onto a fiat system.
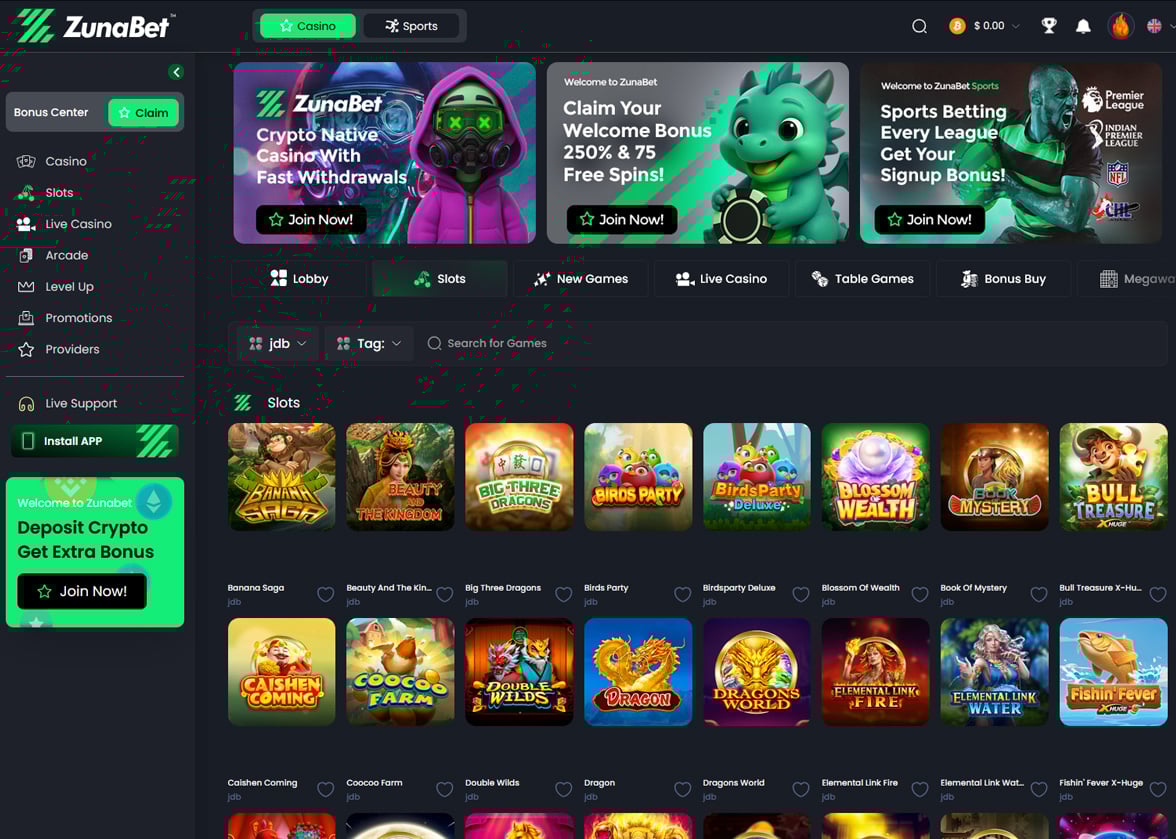
The game library is hard to ignore. ZunaBet lists over 11,000 games from 63 different providers. That roster includes Pragmatic Play, Hacksaw Gaming, Yggdrasil, BGaming, and Evolution, covering slots, table games, and live dealer options. With 60+ providers feeding into one platform, the variety is among the widest available in the crypto casino market right now.
Sports betting is fully integrated. The sportsbook covers football, basketball, tennis, NHL, and combat sports, along with esports markets for CS2, Dota 2, League of Legends, and Valorant. Virtual sports are included too. Everything sits under one account, so switching between casino and sports is seamless.
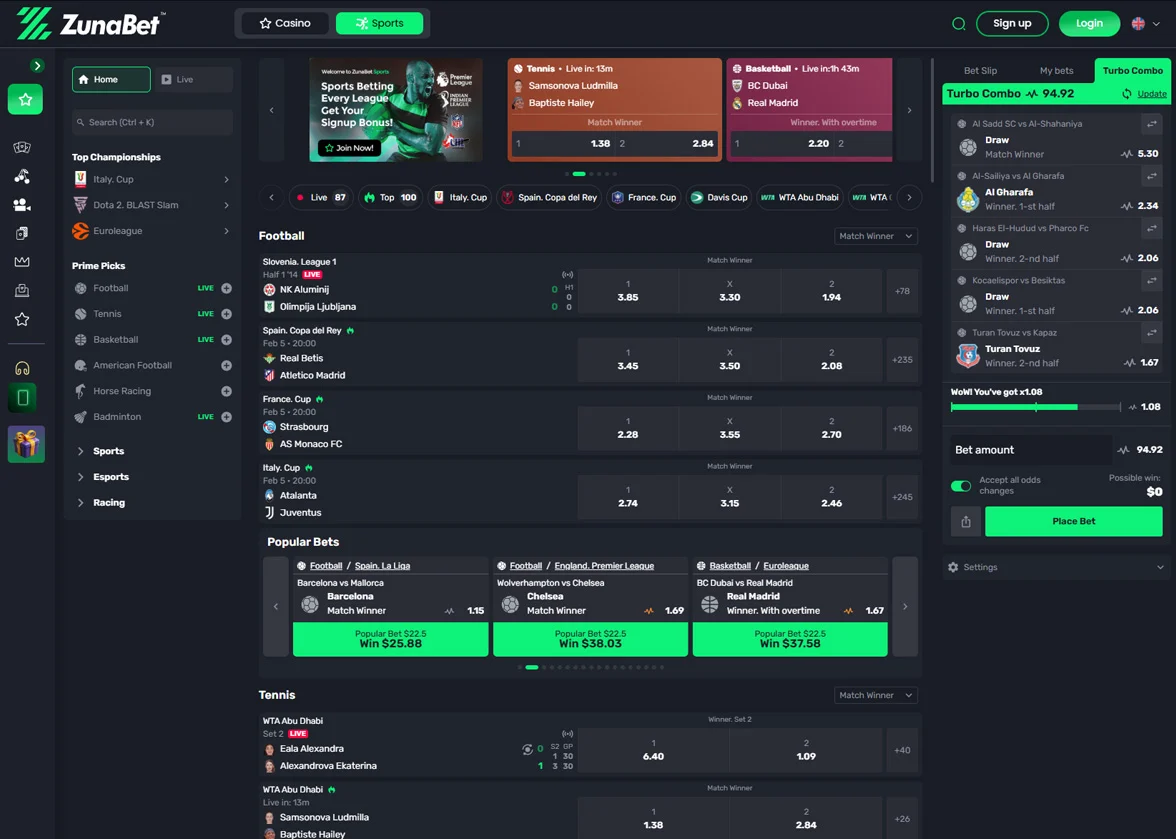
ZunaBet supports more than 20 cryptocurrencies. The list includes BTC, ETH, USDT on multiple chains, SOL, DOGE, ADA, XRP, and others. The platform charges no processing fees on its end, and withdrawals are built to process quickly. Apps are available for iOS, Android, Windows, and MacOS, and live chat support runs around the clock.
Welcome Bonus: A Clear Split
The most obvious difference between these two platforms is what happens when you first sign up.
Stake gives you nothing upfront. There is no deposit match and no free spins. You start playing, and if you wager enough over time, you may eventually get invited into the VIP program. That works for a certain type of player, but it asks for commitment before giving anything back.
ZunaBet goes in the other direction with a welcome package worth up to $5,000 plus 75 free spins. It breaks down like this: the first deposit is matched at 100% up to $2,000 with 25 free spins, the second deposit is matched at 50% up to $1,500 with 25 spins, and the third deposit is matched at 100% up to $1,500 with another 25 spins. Spreading the bonus across three deposits keeps players coming back rather than dumping everything into one session.
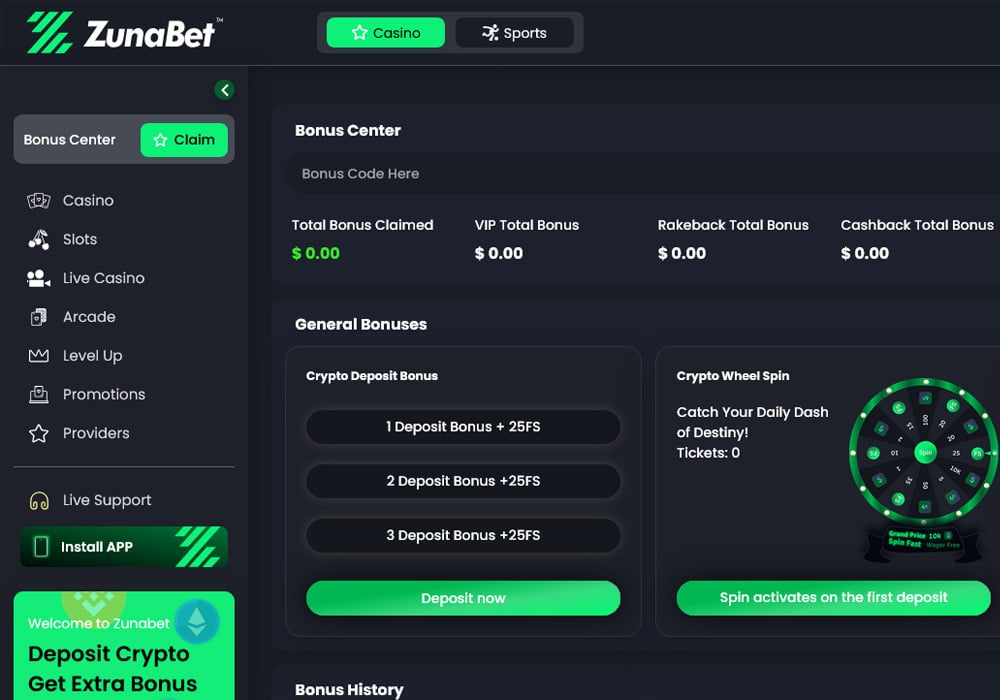
For anyone who wants value from day one, ZunaBet has the clear edge here. A $5,000 bonus ceiling gives players real room to explore the library and sportsbook with extra funds backing them up.
Loyalty Rewards: Open vs Invite-Only
Stake runs a closed VIP system. Players are invited based on their activity, and the exact thresholds are not publicly listed. Once you are in, the rewards — rakeback, reload bonuses, and personalized offers — can be significant. But if you are a casual or mid-level player, you may never see the inside of that program.
ZunaBet handles loyalty differently. Its system is themed around dragon evolution and has six named tiers: Squire, Warden, Champion, Divine, Knight, and Ultimate. Rakeback starts at 1% at the lowest level and climbs to 20% at the top. Other perks include up to 1,000 free spins depending on tier, VIP club access, double wheel spins, and a gamified experience built around a dragon mascot called Zuno.
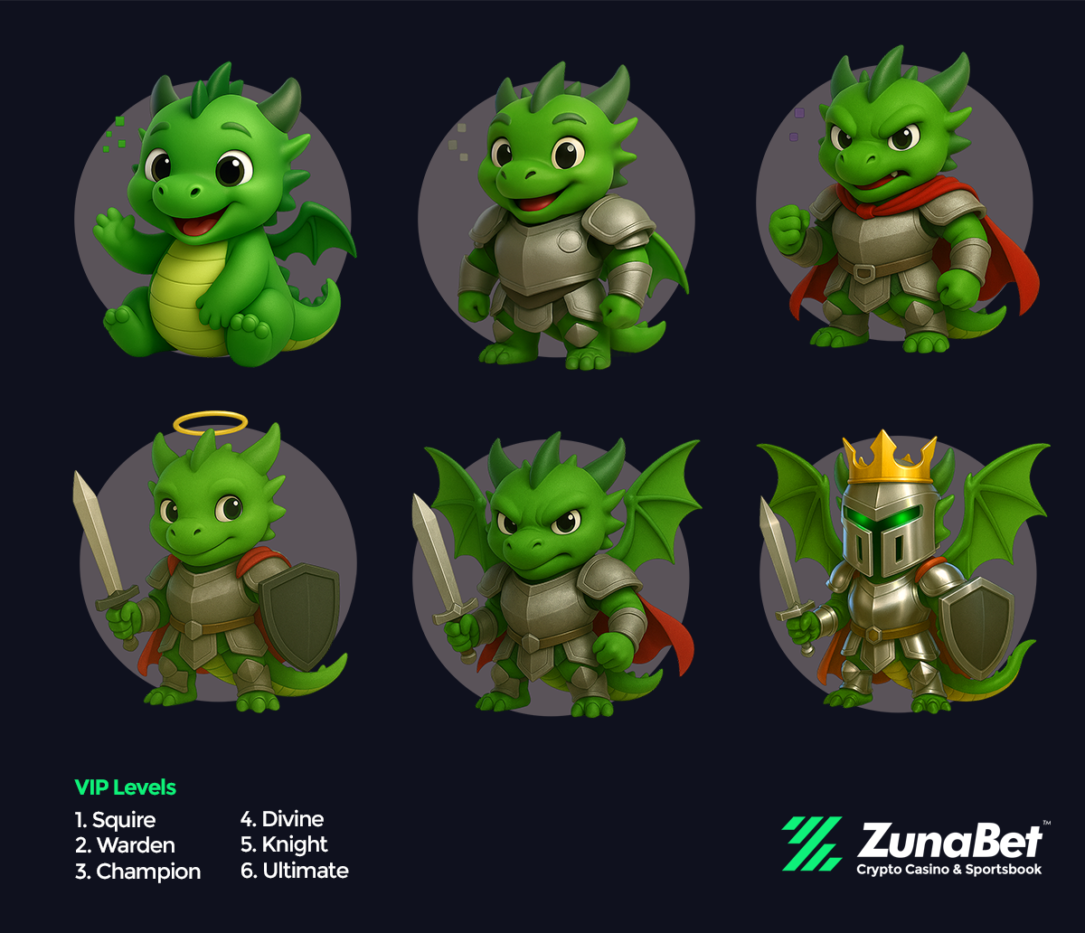
The important distinction is that ZunaBet’s system is transparent and open to everyone from the start. You can see the tiers, see the rewards, and track your own progress. There is no guessing about whether you qualify or waiting for an invitation that may not come. For most players, that openness is more motivating than a mystery system operating behind the scenes.
The Crypto Advantage Over Traditional Operators
Both Stake and ZunaBet sit firmly in the crypto camp, which already separates them from traditional operators like DraftKings, BetMGM, FanDuel, and Caesars. Those platforms were built around bank transfers, credit cards, and regulated fiat currencies. Withdrawals can take days. Fees add up. Payment options are limited by region.
Crypto platforms skip most of that. Transactions are faster, fees are lower, and players have more control over their funds. ZunaBet pushes this further with support for 20+ coins and zero platform processing fees. For players who already live in the crypto world, this is how they expect a gambling platform to work.
Traditional platforms still hold advantages in terms of regulatory trust and brand recognition in markets like the US and UK. But for players outside those tightly regulated markets, or for anyone who simply prefers crypto, platforms like Stake and ZunaBet are the more practical choice.
Where Things Stand
Stake.com has years of trust built up. It has a massive user base, a recognizable brand, and a VIP system that delivers real value to its most active players. If you already know you are going to wager heavily and consistently, Stake rewards that over time.
ZunaBet is making a pitch to everyone else — and doing it well. A generous welcome bonus, a game library with over 11,000 titles, broad crypto support, and a loyalty program that does not hide behind an invite wall add up to a compelling package. It feels built for the current moment, designed for players who grew up with crypto and expect their gambling platform to reflect that.
Stake set the standard for crypto casinos. ZunaBet is showing what the next version of that standard could look like — more games, better upfront value, and a rewards system that treats every player like they matter from the first deposit. For anyone shopping for a new platform in 2026, ZunaBet is the one generating the most buzz right now.
Disclaimer: This is a Press Release provided by a third party who is responsible for the content. Please conduct your own research before taking any action based on the content.
Olivia Munn Says John Mulaney Helped Her Face ‘Death’

Tottenham parts ways with interim coach Igor Tudor after just 7 matches
Asia stocks sink as Iran fears weigh; Japan leads losses after BOJ comments

Smart energy pays enters the US market, targeting scalable financial infrastructure

Why Israel is blocking foreign journalists from entering

Bitcoin: We’re Entering The Most Dangerous Phase

“This time it’s yo’ money”: Trump’s signature to be added to U.S. paper currency

How and WHAT to invest in! #investing #stockmarket #money #finance #recession #inflation #wallstreet

This Machine Turns Paper into Money! #moneytips #gadgetsshorts #artshorts
-
 NewsBeat5 days ago
Manchester United reach agreement with Casemiro over contract clause amid transfer speculation
-

 News Videos4 days ago
Parliament publishes latest register of MPs’ financial interests
-

 Sports7 days ago
Gary Kirsten Accuses Pakistan Cricket Board Of ‘Interference’, Mohsin Naqvi Responds
-

 Sports7 days ago
Remo Stars and Kano Pillars Strengthen Survival Hopes in NPFL
-

 NewsBeat2 days ago
The Story hosts event on Durham’s historic registers
-

 News Videos7 days ago
Ch 9 Financial Management Part 1 | Detailed One Shot | Class 12 Business Studies Boards 2026
-

 Business3 days ago
Instagram, YouTube Found Responsible for Teen’s Mental Health Struggle in Historic Ruling
-
 NewsBeat5 days ago
Tesco is selling new Cadbury Dairy Milk bar and people can’t wait to try it
-
 Entertainment7 days ago
Cynthia Bailey Dishes on ‘RHOA’ Season 17, Discusses Kandi
-

 Tech6 days ago
Samsung will soon let you control smart home devices from your car’s dashboard
-
 Entertainment1 day ago
Lana Del Rey Celebrates Her Husband’s 51st Birthday In New Post
-

 Business6 days ago
More women enter wealth management, but few in advisory roles: study
-
 NewsBeat7 days ago
Colombian military plane with 110 soldiers onboard crashes following takeoff
-

 Fashion6 days ago
Does It Matter What You Wear When You’re Laid Off and Looking?
-

 Fashion7 days ago
Fringe Bags for the Season
-

 Business6 days ago
Late-paying firms face multimillion-pound fines under new crackdown
-

 NewsBeat5 days ago
Entrepreneurs Forum survey reveals optimism in North East
-

 Politics6 days ago
How Media Platforms Balance Performance and Accessibility in Image Delivery
-

 Sports5 days ago
Fantasy Baseball Week 1 Preview: Top sleeper hitters for both five- and 12-day period led by Munetaka Murakami
-
 NewsBeat6 days ago
NASA Artemis II Astronauts enter 14-Day quarantine as moon rocket reaches launchpad
You must be logged in to post a comment Login