Performance data shown represents past performance. Investment returns and principal value will fluctuate, so that fund shares, when redeemed, may be worth more or less than the original cost. Past performance does not guarantee future results and current performance may be lower or higher than the performance data shown. Visit Madison Funds or call 800.877.6089 to obtain performance data current to the most recent month-end.
Tickers
Portfolio Management
Faraz Farzam, CFAPortfolio Manager, AnalystIndustry since 1999
Advertisement
Aaron Garcia, CFAPortfolio Manager, AnalystIndustry since 2002
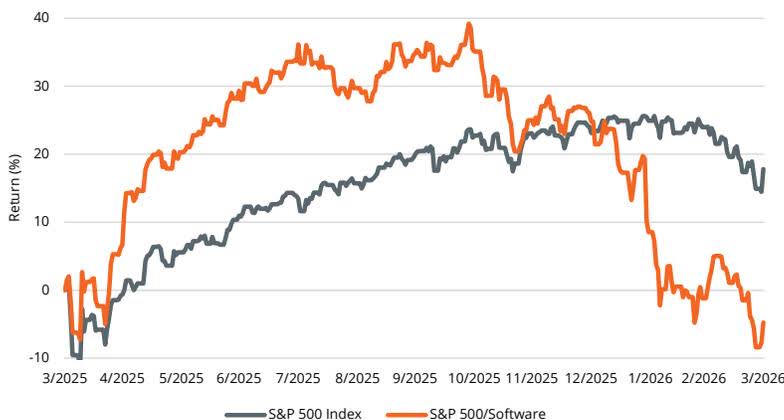
Software vs. S&P 500 Index
Although the information in this report has been obtained from sources that the firm believes to be reliable, we do not guarantee its accuracy, and any such information may be incomplete or condensed. All opinions included in the report constitute the authors’ judgment as of the date of this report and are subject to change without notice. This report is for informational purposes only and is not intended as an offer or solicitation with respect to the purchase or sale of any security and is not investment advice.
Madison Asset Management, LLC does not provide investment advice directly to shareholders of the Madison Funds. Opinions stated are informational only and should not be taken as investment recommendation or advice of any kind whatsoever (whether impartial or otherwise).
Advertisement
Why Madison Small Cap Fund?
High-quality portfolio of quality, durable, and growing small companies
Concentrated portfolio with a flexible mandate ($100M to $15B market cap)
Proprietary Risk Portal and valuation discipline framework help manage downside risk
Advertisement
Average Annual Total Returns ¹,² (%)
3-Months
YTD
1-Year
3-Year
5-Year
10-Year
Since Inception
Class R6
0.10
0.10
2.38
7.75
—
—
2.08
Class I
0.10
0.10
2.29
7.67
1.19
—
1.74
Class Y
0.10
0.10
2.19
7.58
1.07
7.68
11.93
Class A without sales charge
0.00
0.00
1.94
7.31
0.83
—
7.55
Class A with sales charge
-5.76
-5.76
-3.88
5.20
-0.36
—
6.59
Russell 2000
0.89
0.89
25.72
13.05
3.77
9.88
—
Russell 2500
2.04
2.04
23.45
13.25
5.48
10.58
—
Calendar Year Returns ¹,² (%)
2016
2017
2018
2019
2020
2021
2022
2023
2024
2025
Class Y
18.04
8.90
-12.09
24.67
23.09
20.52
-24.36
16.05
21.94
-7.12
Russell 2000
21.31
14.65
-11.01
25.52
19.96
14.82
-20.44
16.93
11.54
12.81
Russell 2500
17.59
16.81
-10.00
27.77
19.99
18.18
-18.37
17.42
12.00
11.91
Performance data shown represents past performance. Investment returns and principal value will fluctuate, so that fund shares, when redeemed, may be worth more or less than the original cost. Past performance does not guarantee future results and current performance may be lower or higher than the performance data shown. Visit Madison Funds or call 800.877.6089 to obtain performance data current to the most recent month-end.
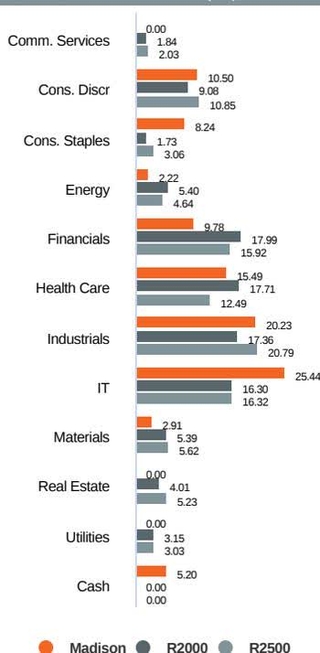
Sector Allocation (%)
Advertisement
5-Year Risk Metrics (%) – Class Y
Madison
R2000
Standard Deviation
17.17
19.98
Up Capture
77.47
100.00
Down Capture
85.10
100.00
Beta
0.80
1.00
5-Year Risk Metrics (%) – Class Y
Advertisement
Madison
R2500
Standard Deviation
17.17
18.67
Up Capture
79.37
100.00
Down Capture
93.18
100.00
Beta
0.88
1.00
Investment Objective
The Madison Small Cap Fund seeks long-term capital appreciation.
Class
Ticker
Inception
Exp. Ratio
R6
MSCRX
02/28/22
0.92%
I
MSCIX
02/26/21
1.00%
Y
BVAOX
12/16/96
1.10%
A
MASMX
08/31/19
1.35%
Expense ratios are based on the fund’s most recent prospectus.
Advertisement
Fund Characteristics
Number of Holdings
49
EPS Growth Rate (Trailing 3-Year, %)
8.14
Price/Earnings Ratio (Trailing 1-Year)
25.20
Price/Earnings Ratio (Forward 1-Year)
17.16
Annual Portfolio Turnover (%)
35.00
Active Share vs. R2000 (%)
97.40
Active Share vs. R2500 (%)
96.83
Wtd. Avg. Market Cap ($ billions)
5.88
Net Assets ($ millions)
146.53
Distribution Frequency
Annual
Portfolio Management
Faraz Farzam, CFAPortfolio Manager, AnalystIndustry since 1999
Advertisement
Aaron Garcia, CFAPortfolio Manager, AnalystIndustry since 2002
Madison FundsP.O. Box 219083Kansas City, MO 64121-9083800.877.6089
Consultant andAdvisor Services
550 Science DriveMadison, WI 53711888.971.7135
This material is authorized for use only when preceded or accompanied by the current prospectus. Before investing, please fully consider the investment objectives, risks, charges and expenses of the fund. This and other important information is contained in the current prospectus, which you should carefully read before investing or sending money. For more complete information about Madison Funds® obtain a prospectus from your financial adviser, by calling 800.877.6089 or by visiting Madison Funds to view or download a copy.
Advertisement
Performance results prior to August 30, 2019 for the Class Y shares are based on the performance of the Predecessor Fund, which was reorganized into the Class Y shares of the Fund on August 30, 2019. Performance for Class A shares was deemed to be new effective August 31, 2019 as a result of the reorganization. Madison waived 0.04% of the Fund’s annual services fee from August 31, 2019 through February 27, 2021. Investment returns reflect this fee waiver, without which returns would have been lower.
Madison lists the performance of the Predecessor Fund and accounting survivor of the Reorganization for the following reasons: Continuity of Fund portfolio managers through the Reorganization; Substantially the same investment objective and investment strategies between the Fund and the Predecessor Fund; Substantially similar investment policies between the Fund and the Predecessor Fund; A similar expense ratio (excluding acquired fund fees and expenses).
Madison Asset Management, LLC does not provide investment advice directly to shareholders of the Madison Funds.
Madison Funds are distributed by MFD Distributor, LLC, member of FINRA. Portfolio data is as of the date of this piece unless otherwise noted and holdings are subject to change.
Advertisement
“Madison” and/or “Madison Investments” is the unifying tradename of Madison Investment Holdings, Inc., Madison Asset Management, LLC (“MAM”), and Madison Investment Advisors, LLC (“MIA”). MAM and MIA are registered as investment advisers with the U.S. Securities and Exchange Commission. Madison Funds are distributed by MFD Distributor, LLC. MFD Distributor, LLC is registered with the U.S. Securities and Exchange Commission as a broker-dealer and is a member firm of the Financial Industry Regulatory Authority. The home office for each firm listed above is 550 Science Drive, Madison, WI 53711. Madison’s toll-free number is 800-767-0300.
Any performance data shown represents past performance. Past performance is no guarantee of future results.
This report is for informational purposes only and is not intended as an offer or solicitation with respect to the purchase or sale of any security and is not investment advice.
Non-deposit investment products are not federally insured, involve investment risk, may lose value and are not obligations of, or guaranteed by, any financial institution. Investment returns and principal value will fluctuate.
Advertisement
An investment in the Fund is subject to risk and there can be no assurance the Fund will achieve its investment objective. The risks associated with an investment in the Fund can increase during times of significant market volatility. The principal risks of investing in the Fund include mid cap risk, equity risk, growth and value risks, capital gains realization risks to taxpaying shareholders, foreign security and emerging market risk, depository receipt risk, and market risk. Investing in small, mid-size or emerging companies involves greater risks not associated with investing in more established companies, such as business risk, significant stock price fluctuations and illiquidity. More detailed information regarding these risks can be found in the Fund’s prospectus.
Upon request, Madison may furnish to the client or institution a list of all security recommendations made within the past year.
Indices are unmanaged. An investor cannot invest directly in an index. They are shown for illustrative purposes only, and do not represent the performance of any specific investment. Index returns do not include any expenses, fees or sales charges, which would lower performance.
Russell 2000 Index: small cap market index that measures the performance of the smallest 2,000 companies in the Russell 3000® Index.
Advertisement
Russell 2500 Index: broad index, featuring 2,500 stocks that cover the small and mid-cap market capitalizations of the U.S. equity universe.
Russell Investment Group is the source and owner of the trademarks, service marks and copyrights related to the Russell Indexes. Russell® is a trademark of Russell Investment Group.
EPS Growth (Trailing 3-yr): the annual rate at which a company’s earnings have grown over the past three years.
Price-to-Earnings Ratio: measures how expensive a stock is. It is calculated by the weighted average of a stock’s current price divided by the company’s earnings per share of stock in a portfolio.
Advertisement
Portfolio Turnover: a measure of the trading activity in an investment portfolio—how often securities are bought and sold by a portfolio.
Active Share: the percentage of a portfolio that differs from its benchmark index. It can range from 0% for an index fund that perfectly mirrors its benchmark to 100% for a portfolio with no overlap with an index.
Wtd Avg. Market Cap: the size of the companies in which the fund invests. Market capitalization is calculated by the number of a company’s shares outstanding times its price per share.
Standard Deviation: a statistical measurement of dispersion about an average, which, for a portfolio, depicts how widely the returns varied over a certain period of time. Investors may use the standard deviation of historical performance to understand the range of returns for a portfolio. When a portfolio has a higher standard deviation than its benchmark, it implies higher relative volatility. Standard deviation has been calculated using the trailing monthly total returns for the appropriate time period. The standard deviation values are annualized.
Advertisement
Upside Capture Ratio: a fund’s performance in up markets relative to its benchmark. The security’s upside capture return is divided by the benchmark’s upside capture return over the time period.
Downside Capture Ratio: a fund’s performance in down markets relative to its benchmark. The security’s downside capture return is divided by the benchmark’s downside capture return over the time period.
Beta: a measure of the fund’s sensitivity to market movements. A portfolio with a beta greater than 1 is more volatile than the market, and a portfolio with a beta less than 1 is less volatile than the market.
LOS ANGELES — Los Angeles Lakers superstar Luka Doncic remains sidelined with a Grade 2 left hamstring strain suffered more than a month ago, casting uncertainty over his availability in the Western Conference semifinals against the top-seeded Oklahoma City Thunder as his recovery follows a cautious, week-to-week timeline.
Doncic has not played since April 2, when he exited a lopsided loss to the Thunder. The injury has forced the Lakers to advance through the first round against the Houston Rockets without their leading scorer, relying on LeBron James, Austin Reaves and a resilient supporting cast. Now, with Game 1 against Oklahoma City looming, the Slovenian phenom’s status looms large over the series.
Multiple reports confirm Doncic is progressing but remains far from game action. He has begun limited on-court work, including movement drills and shooting, yet has not advanced to full-fledged running, one-on-one sessions or contact scrimmages. Lakers coach JJ Redick described the process as deliberate, with no firm timeline established.
Slow Path to Return
Advertisement
ESPN’s Shams Charania reported that Doncic will miss the start of the Thunder series, with the team evaluating him on a week-to-week basis. Sources described it as a “slow path” toward recovery, echoing concerns about re-injury risk for a Grade 2 hamstring strain.
Brian Windhorst of ESPN emphasized the challenge: “He’s not close. There is a whole ramp up that is required when you are coming back from a hamstring. He has not started that contact ramp up yet.” Windhorst noted the Lakers benefit from series rest but still face a significant hurdle without their MVP-caliber talent.
Doncic traveled to Spain earlier in his rehab for specialized treatment, including injections aimed at accelerating healing. He has since returned to Los Angeles, rejoining the team in a limited capacity and appearing on the bench during playoff games. His presence has boosted morale, but physical limitations persist.
Typical recovery for a Grade 2 hamstring strain ranges from four to six weeks or longer, depending on severity and individual response. Doncic’s history of soft-tissue concerns has prompted extra caution from the Lakers’ medical staff.
Advertisement
Impact on Lakers’ Playoff Run
The Lakers secured advancement past Houston without Doncic, showcasing depth and veteran leadership from James. Reaves returned from his own oblique injury, providing a timely boost. Yet the absence of Doncic — who averaged a league-leading 33.5 points, 8.3 assists and 7.7 rebounds during the regular season — remains glaring against a Thunder team that defeated the Lakers soundly earlier.
Oklahoma City posted a dominant regular-season record and handed Los Angeles one of its worst defeats on the night of Doncic’s injury. Without their primary playmaker and scorer, the Lakers enter the series as significant underdogs, relying on defensive intensity, James’ all-around brilliance and timely contributions from role players.
Doncic’s Season in Context
Advertisement
The 2025-26 campaign represented a new chapter for Doncic after his trade to the Lakers. He thrived alongside James, elevating the team’s offense to elite levels and positioning Los Angeles as a legitimate Western Conference contender. His absence has highlighted both the team’s resilience and the massive void left by one of the NBA’s most dynamic talents.
Prior hamstring issues have dotted Doncic’s career, raising questions about load management and long-term durability for the 27-year-old. This latest setback sidelined him for the remainder of the regular season, rendering him ineligible for certain end-of-season awards unless granted an exception.
Expert Analysis and Recovery Outlook
Injury specialists note that hamstring strains demand patience. Rushing back risks chronic problems, particularly for a player of Doncic’s size and playing style, which relies on explosive changes of direction and deceleration. Current reports suggest he is weeks away from full integration, with potential return scenarios ranging from mid-to-late series or beyond.
Advertisement
Physical therapists monitoring public updates describe his on-court movement as encouraging but preliminary. Controlled drills mark progress from earlier standstill work, yet full basketball activities remain distant. The Lakers continue to monitor daily, balancing optimism with realism.
Team officials and medical experts stress individualized protocols. Doncic’s trip to Europe reflected a proactive approach, seeking cutting-edge treatments unavailable or less accessible domestically. His agent, Bill Duffy, highlighted the shared goal of maximizing playoff availability.
Broader Implications for Lakers and NBA
The injury has reshaped the Western Conference playoff picture. Oklahoma City enters with momentum and health advantages, while other contenders watch closely. For the Lakers, success without Doncic would cement their depth; failure could intensify scrutiny on roster construction and injury management.
Advertisement
Fans and analysts debate the best path forward. Some advocate aggressive return timelines if the series tightens, while others prioritize long-term health, especially with future seasons in mind. James, at 41, continues defying age, but the burden on him increases without Doncic’s facilitation.
Social media and sports talk shows buzz with speculation, from optimistic projections of a Game 3 or 4 return to concerns of a prolonged absence. Official updates remain measured, avoiding concrete dates to manage expectations.
What Lies Ahead
As the Thunder series begins, all eyes remain on Doncic’s rehab milestones. Any advancement to live contact or scrimmages could accelerate his timeline. Conversely, setbacks would push hopes toward later rounds or next season.
Advertisement
The Lakers organization expresses confidence in their medical team and Doncic’s dedication. Redick and front-office leaders have praised his work ethic during recovery. For now, the focus stays on preparation without their star, while holding out hope for his eventual return.
Doncic’s resilience has defined his career. From international prodigy to NBA MVP candidate, he has overcome challenges before. This hamstring recovery tests that mettle once more, with high stakes for the Lakers’ championship aspirations.
The situation remains fluid. Updates will continue as the playoffs unfold, with every practice report and sideline sighting scrutinized. For Lakers Nation, the wait continues — hopeful for a swift but safe return from one of basketball’s brightest talents.
New ABS data has revealed a sharp uptick in household spending across the nation in March, and comes as markets await the Reserve Bank’s call on rates later today.
With an investment banking cash and derivatives trading background, Binary Tree Analytics (‘BTA’) aims to provide transparency and analytics in respect to capital markets instruments and trades. BTA focuses on CEFs, ETFs and Special Situations, and aims to deliver high annualized returns with a low volatility profile. We have been investing for over 20 years after obtaining a Finance major at a top university.
Analyst’s Disclosure: I/we have a beneficial long position in the shares of HELO either through stock ownership, options, or other derivatives. I wrote this article myself, and it expresses my own opinions. I am not receiving compensation for it (other than from Seeking Alpha). I have no business relationship with any company whose stock is mentioned in this article.
Seeking Alpha’s Disclosure: Past performance is no guarantee of future results. No recommendation or advice is being given as to whether any investment is suitable for a particular investor. Any views or opinions expressed above may not reflect those of Seeking Alpha as a whole. Seeking Alpha is not a licensed securities dealer, broker or US investment adviser or investment bank. Our analysts are third party authors that include both professional investors and individual investors who may not be licensed or certified by any institute or regulatory body.
STMicroelectronics N.V. (STM) Shareholder/Analyst Call May 4, 2026 9:30 AM EDT
Company Participants
Jerome Ramel – Executive VP of Corporate Development & Integrated External Communication Remi El-Ouazzane – President of Microcontrollers, Digital ICs & RF Products Group
Advertisement
Conference Call Participants
Stephane Houri – ODDO BHF Corporate & Markets, Research Division Sandeep Deshpande – JPMorgan Chase & Co, Research Division Gianmarco Bonacina – Banca Akros S.p.A., Research Division Didier Scemama – BofA Securities, Research Division Joshua Buchalter – TD Cowen, Research Division Jakob Bluestone – BNP Paribas, Research Division Domenico Ghilotti – Equita SIM S.p.A., Research Division
Presentation
Advertisement
Operator
Ladies and gentlemen, welcome to the ST The LEO Opportunity Conference Call and Live Webcast. I am Sandra, the Chorus Call operator. [Operator Instructions] The conference must not be recorded for publication or broadcast. At this time, it is my pleasure to hand over to Jerome Ramel, EVP, Corporate Development and Integrated External Communications. Please go ahead, sir.
Jerome Ramel Executive VP of Corporate Development & Integrated External Communication
Advertisement
Thank you. Thank you, everyone, for joining ST the LEO Opportunity Conference Call. Hosting the call today is Remi El-Ouazzane, President, Microcontrollers, Digital ICs and RF product groups. This live webcast and presentation materials can be accessed on the ST Investor Relations website. A replay will be available shortly after the conclusion of this call. This call will include forward-looking statements that involve risk factors that could cause ST results to differ materially from management expectations and plans. We encourage you to review the safe harbor statement contained in the press release , the financial results this morning and also in ST’s most recent regulatory filings for a full description of these risk factors. [Operator Instructions] I’d like now to turn the call over to Remi El-Ouazzane.
Remi El-Ouazzane President of Microcontrollers, Digital ICs & RF Products Group
Mumbai: Shares of several companies headquartered in West Bengal rose Monday as the BJP emerged victorious in the state assembly polls, defeating the ruling Trinamool Congress (TMC).
Analysts, however, cautioned investors against buying into the sentiment-driven frenzy, instead advising them to wait for clarity on policy implementation by the incoming administration and impact on company earnings.
Shares of CESC, the Kolkata-based flagship company of the RP-Sanjiv Goenka Group, which supplies electricity to the state capital and other parts of West Bengal, rallied over 6.5%. West Bengal-based tea companies McLeod Russel India, and Dhunseri Tea saw their share prices rise 5% and 3%, respectively. Bandhan Bank jumped 3.4%, while Emami climbed 2.6%.
Agencies
“This looks like a classic sentiment-driven rally rather than a structural rerating,” said Gautam Duggad, head of research – institutional equities at Motilal Oswal Financial Services. “The trigger appears to be a sentiment booster which has led to a sharp uptick in West Bengal-headquartered names. However, such moves tend to be transient unless backed by earnings visibility.”
Live Events
Assuming that the BJP will be taking charge of West Bengal, the policy will be pro-growth, which could help industries based out of Kolkata or West Bengal in the medium-tolong-term perspective, said Sunny Agrawal, head of fundamental research at SBI Securities. “The rising stock price today is predominantly on the back of positive sentiment on account of this election outcome,” he said. “The actual impact in terms of changes in the policy and its impact on the businesses will be seen over a medium to long term.”Most analysts say it could take 18–24 months for any policy or structural changes to get fully implemented. Only thereafter, clarity will emerge on whether the policy moves would positively impact earnings of companies that have rallied on expectations tied to the election outcome.
In terms of outlook, Agrawal believes that for the new government, the low-hanging fruit in terms of policy changes can be in sectors like aquaculture, fisheries and ports as West Bengal is a coastal belt.
Advertisement
“BJP is known for creating state of-art infrastructure in any state, so infrastructure like roads, bridges and railways can be another focus area for a new incoming government,” said Agrawal. In addition, companies can benefit from a pro-industrial and pro-growth policy in existing businesses across sectors.
Duggad said from the medium to long-term perspective, sustainability of share prices will hinge on core fundamentals and earnings. “Investors should be careful not to extrapolate this momentum blindly, as stock-specific performance will ultimately converge with earnings delivery rather than sentiment alone.”
SBI Securities recommended investors to focus on fundamentals of West Bengal-based company stocks in the coming 12 to 36 months. “We continue to maintain apositive stance on few large established businesses like Emami, Britannia, ITC or CESC, which is more of a power-related sector and constructive on Bandhan Bank.”
Hancock Prospecting has referred an $850 million gas plant to regulators, outlining a Perth Basin gas vision beyond the assets it acquired from Mineral Resources in 2024.
Fund investors can thank the big tech stocks for getting the second quarter off to a better start than the first.
Powered by gains in Nvidia and Google parent Alphabet, the stock market in April logged its best month since 2020, shaking off declines in the first quarter when the war in Iran started. That in turn, powered the average U.S.-stock mutual fund or exchange-traded fund to a total return of 10.3% for April, according to statistics from LSEG. (See Mutual-Fund Yardsticks table.)


You must be logged in to post a comment Login