

Crypto World
Market Structure Shift (MSS) in Trading

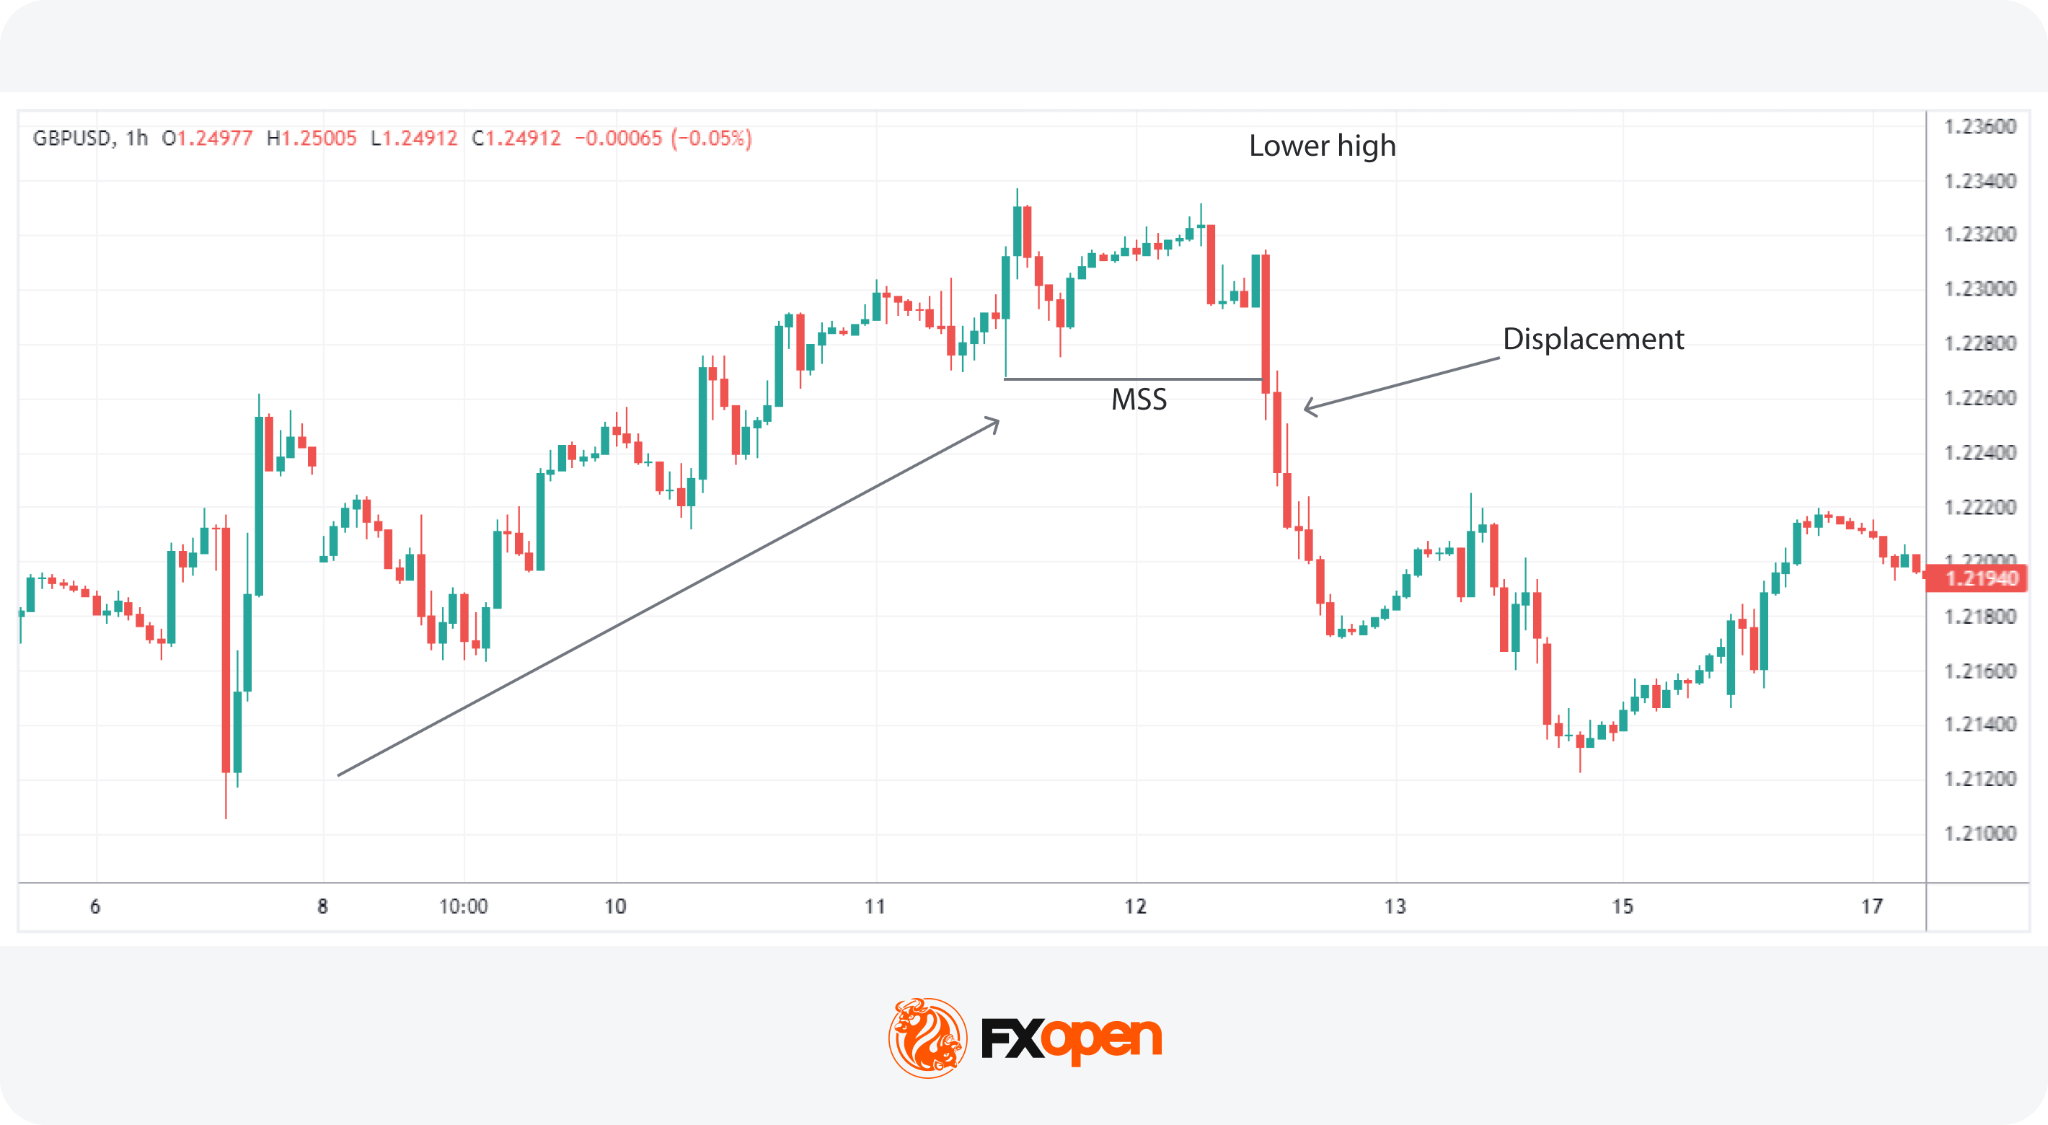
A Market Structure Shift (MSS) is an ICT trading concept used to identify potential changes in market direction. It typically occurs when price fails to maintain the existing structure and breaks a key swing level with strong momentum, known as displacement.
Traders use MSS across forex and CFD markets to analyse possible reversals and shifts in momentum. This article explains what MSS means in trading, how traders identify it, and how it differs from BOS and CHoCH.
What Is an MSS in Trading? Key Takeaways
- Market Structure Shift (MSS) is used to identify potential reversals in price action.
- A valid MSS usually includes both structure failure and displacement.
- BOS often signals continuation, while MSS focuses on reversal confirmation.
- CHoCH may appear before MSS as an early warning of weakening trend structure.
- ICT traders often combine MSS with liquidity sweeps, Order Blocks, and Fair Value Gaps.
- MSS can appear across forex and CFDs on indices, commodities, and cryptocurrencies*.
What Is a Market Structure Shift (MSS)?
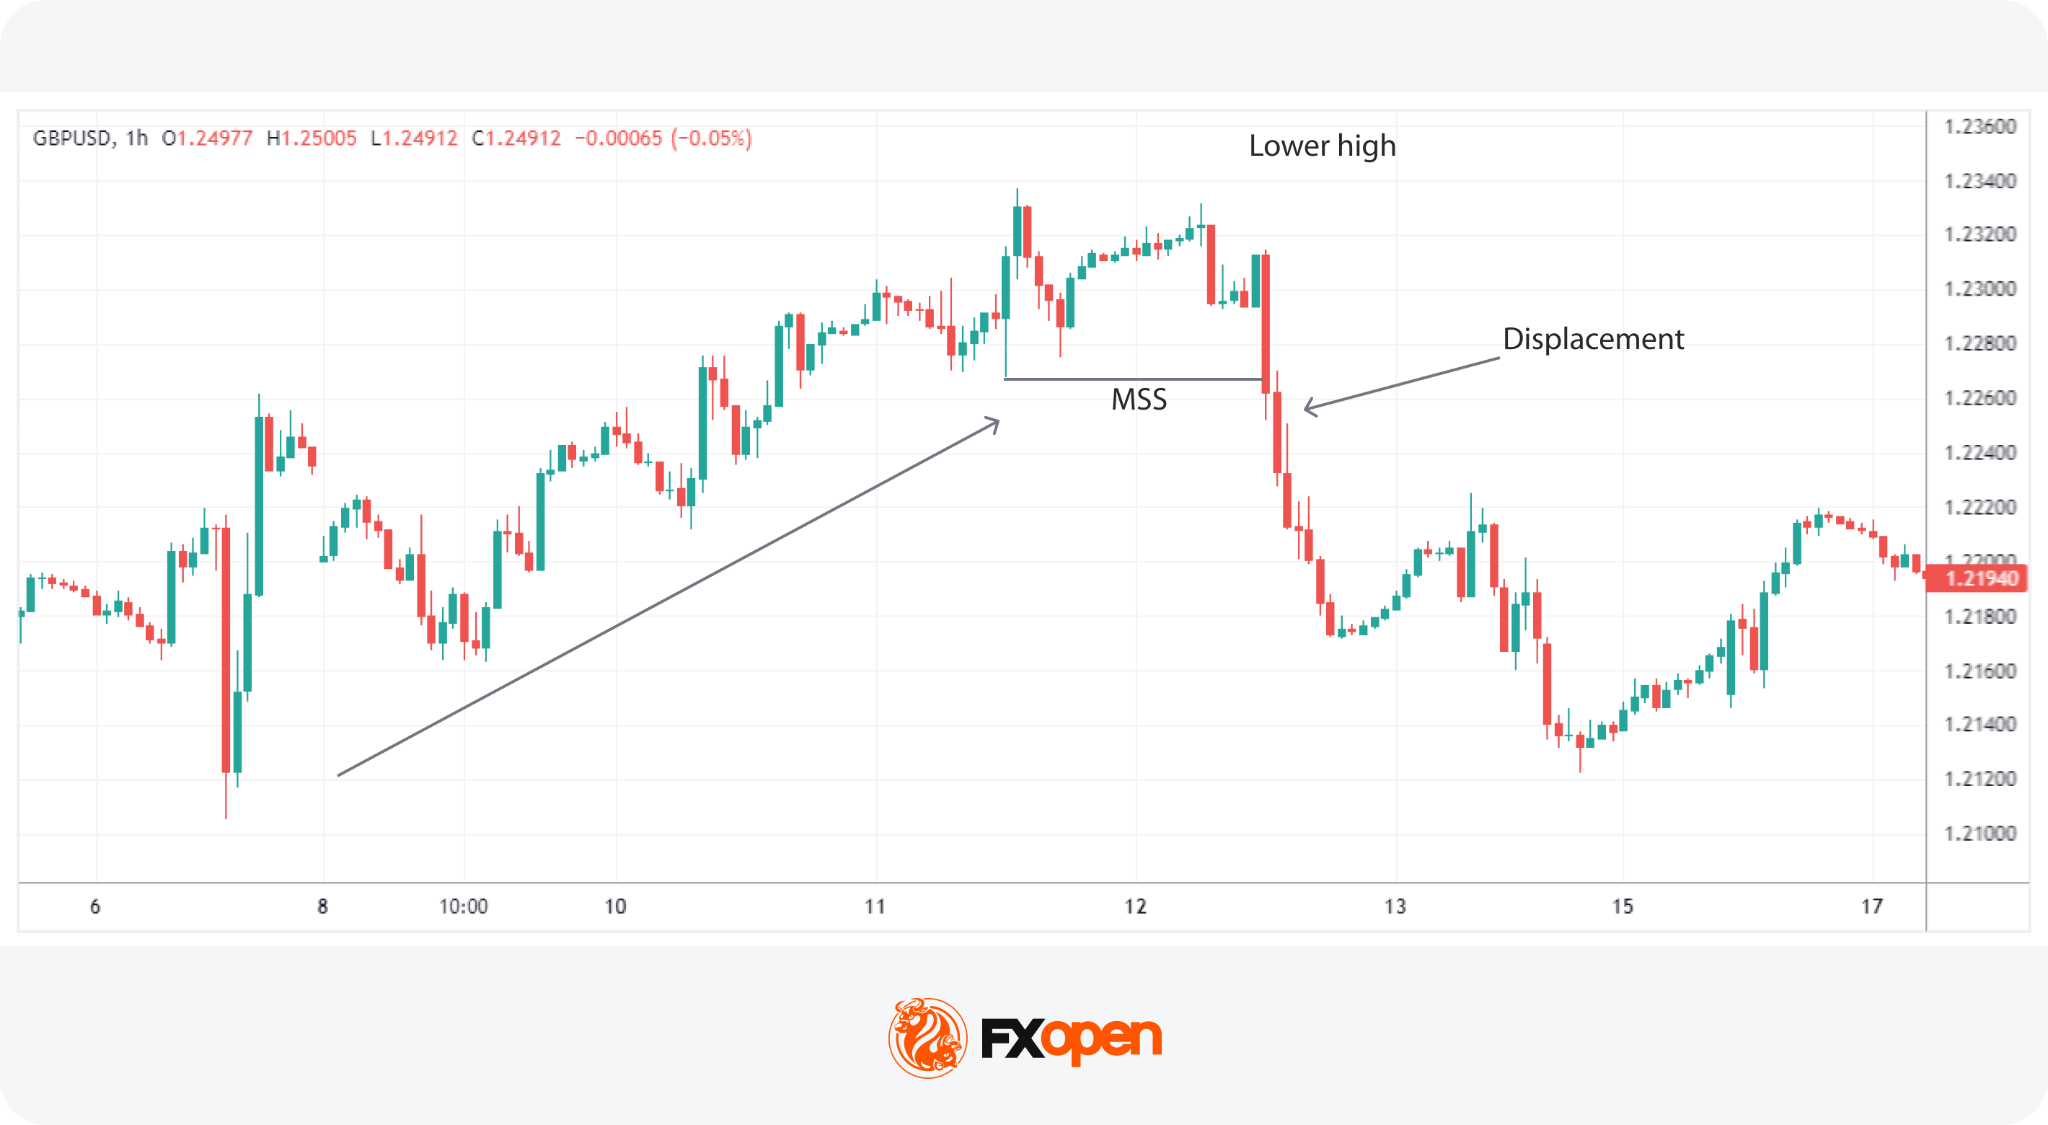
A Market Structure Shift (MSS) is an indicator of a significant change in the prevailing trend, marked by a series of patterns that may point to a reversal. An ICT MSS forms when a market fails to extend its current trend and then breaks a key swing point with displacement. The break must be decisive, not a shallow probe of the level.
The process begins with a shift in market structure that fails to sustain the ongoing trend. For example, during an uptrend, the market might fail to make a new higher high, instead forming a lower high. This initial deviation raises a caution flag about the trend’s strength.
The confirmation of an MSS in trading occurs when there is a decisive break of a significant swing point, known as a displacement move. This displacement is critical—it’s not merely a slight breach but a robust move that clearly indicates a shift. Without displacement, the pattern is closer to a CHoCH than a confirmed Market Structure Shift.
A bullish MSS forms when a downtrend loses momentum and reverses upward. In MSS trading, the bullish setup begins when price prints a higher low. That higher low hints that selling pressure may be weakening. The bullish MSS confirms once price breaks above the most recent swing high with a clear displacement candle.
A bearish MSS is the mirror pattern. An uptrend forms a lower high, indicating buying pressure may be fading. The bearish MSS confirms once price breaks below the most recent swing low with a strong downward displacement candle. That sequence often signals a shift from a bullish structure toward a potential bearish leg.
MSS Confirmation Signals
A valid Market Structure Shift depends on more than a single broken level. Traders typically look for several confirmation signals stacking together before treating the pattern as confirmed. The aim is to filter out shallow probes and false breaks that lack genuine momentum.
Common ICT MSS confirmation criteria include:
- A failed higher high in an uptrend or a failed lower low in a downtrend, indicating early structural weakness.
- A decisive break of the most recent counter-trend swing point, not a wick-only breach.
- A clear displacement candle showing strong momentum expansion through the broken level.
- A prior liquidity sweep above a swing high in an uptrend or below a swing low in a downtrend, which may add weight to the setup.
- Alignment with the higher timeframe directional bias, which traders often use as a contextual filter.
No single signal confirms an MSS on its own. The combination of failed structure, counter-trend swing break, and displacement is typically what separates a confirmed MSS trading setup from a routine fluctuation.
Market Structure Concepts in ICT Trading
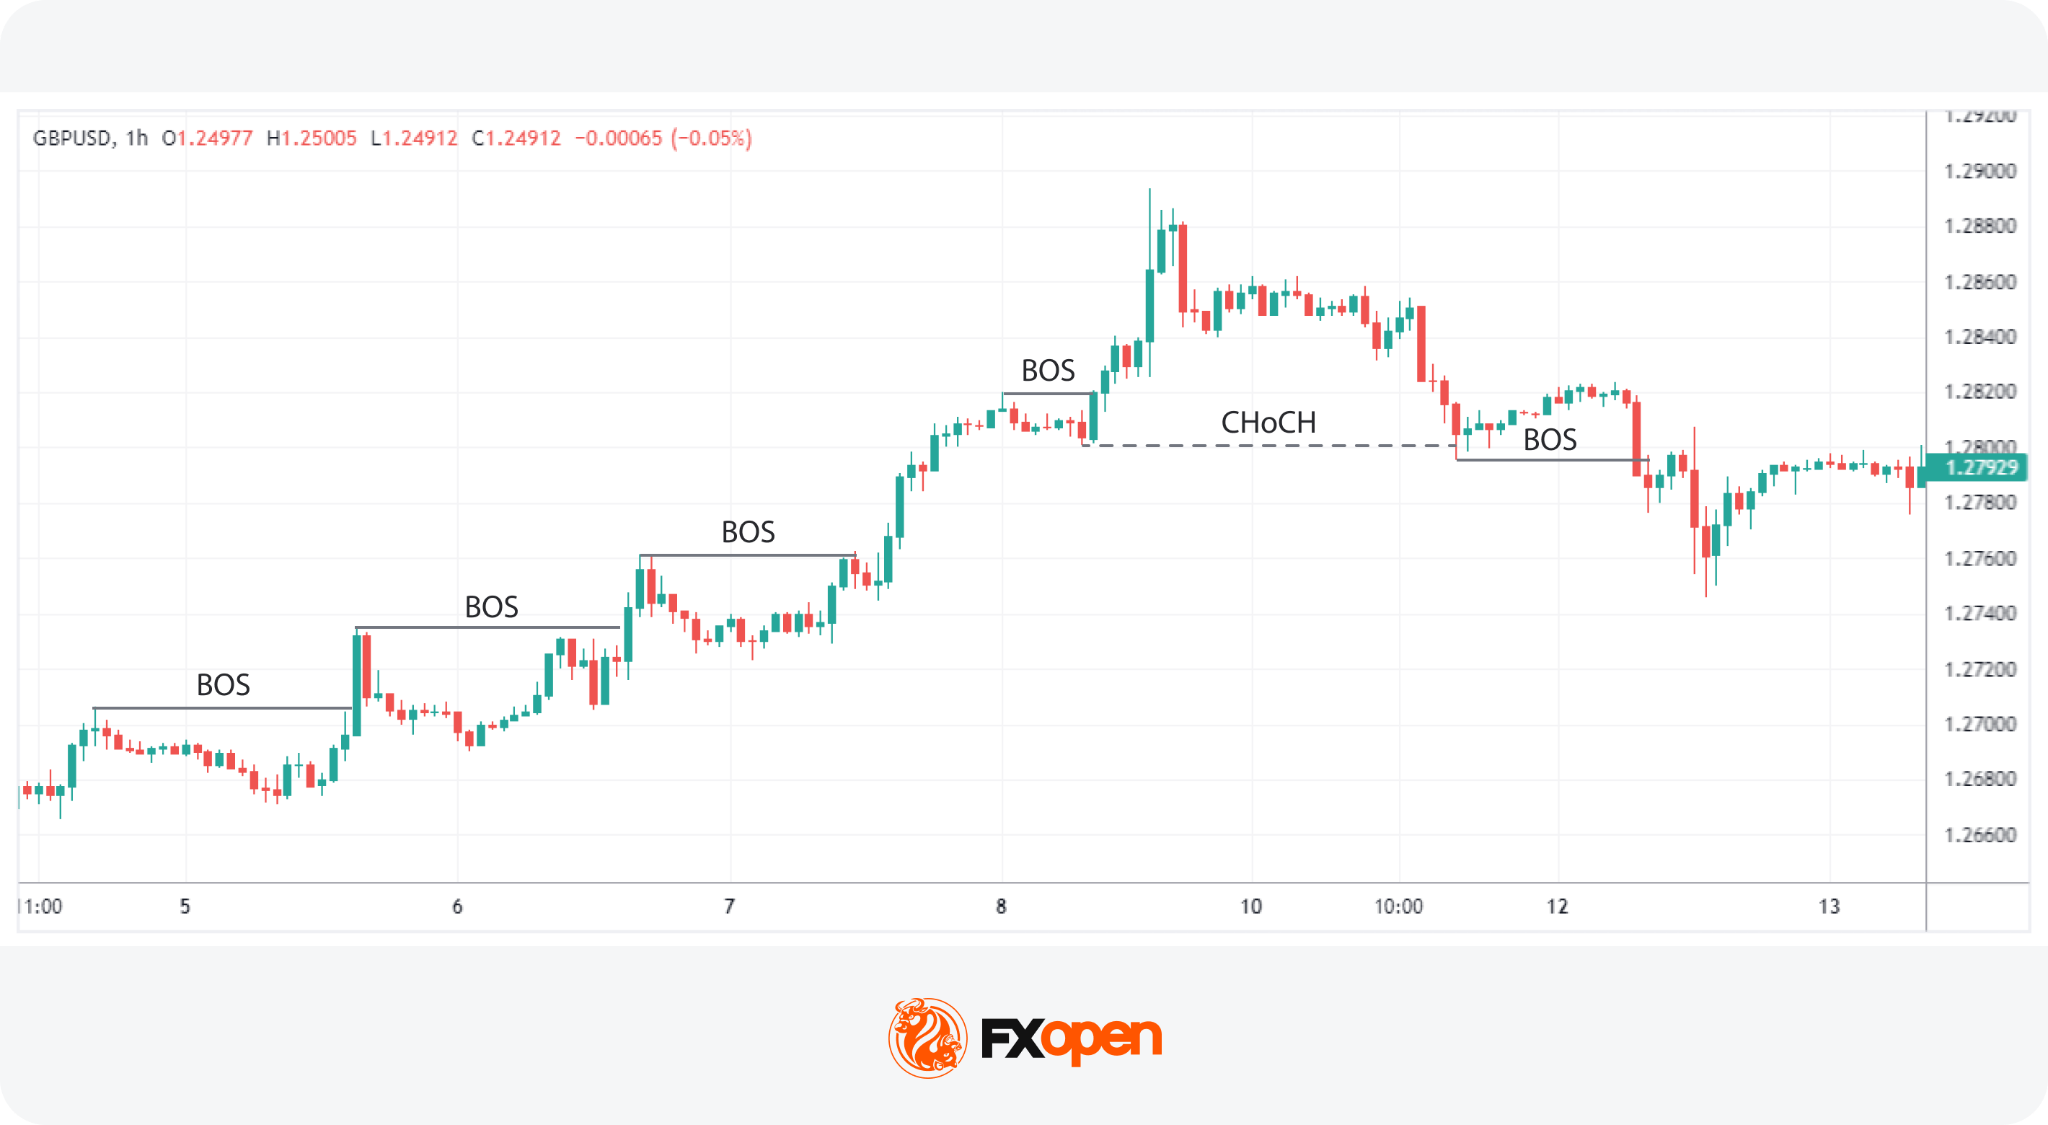
Break of Structure (BOS) and Change of Character (CHoCH) are two core concepts in ICT trading. They describe how price interacts with previous swing highs and swing lows. Both sit alongside the broader ICT Market Structure Shift framework.
A BOS occurs when price breaks beyond a recent swing point in the direction of the existing trend. The pattern typically signals trend continuation rather than reversal.
A CHoCH forms when price breaks against the prevailing trend, taking out the most recent counter-trend swing point. Traders often treat it as an early warning of a potential reversal, not a confirmed one.
MSS vs BOS vs CHoCH
Traders often confuse these three patterns because each involves a break of structure. The distinction lies in what the break signals and what confirmation it requires. Understanding MSS vs BOS and MSS vs CHoCH may help traders interpret price action more accurately.
A BOS confirms continuation of the existing trend. A CHoCH offers an early reversal warning when price breaks counter-trend structure for the first time. An MSS goes further, requiring both a failed swing point and a displacement move through the broken level.
How Traders Identify MSS
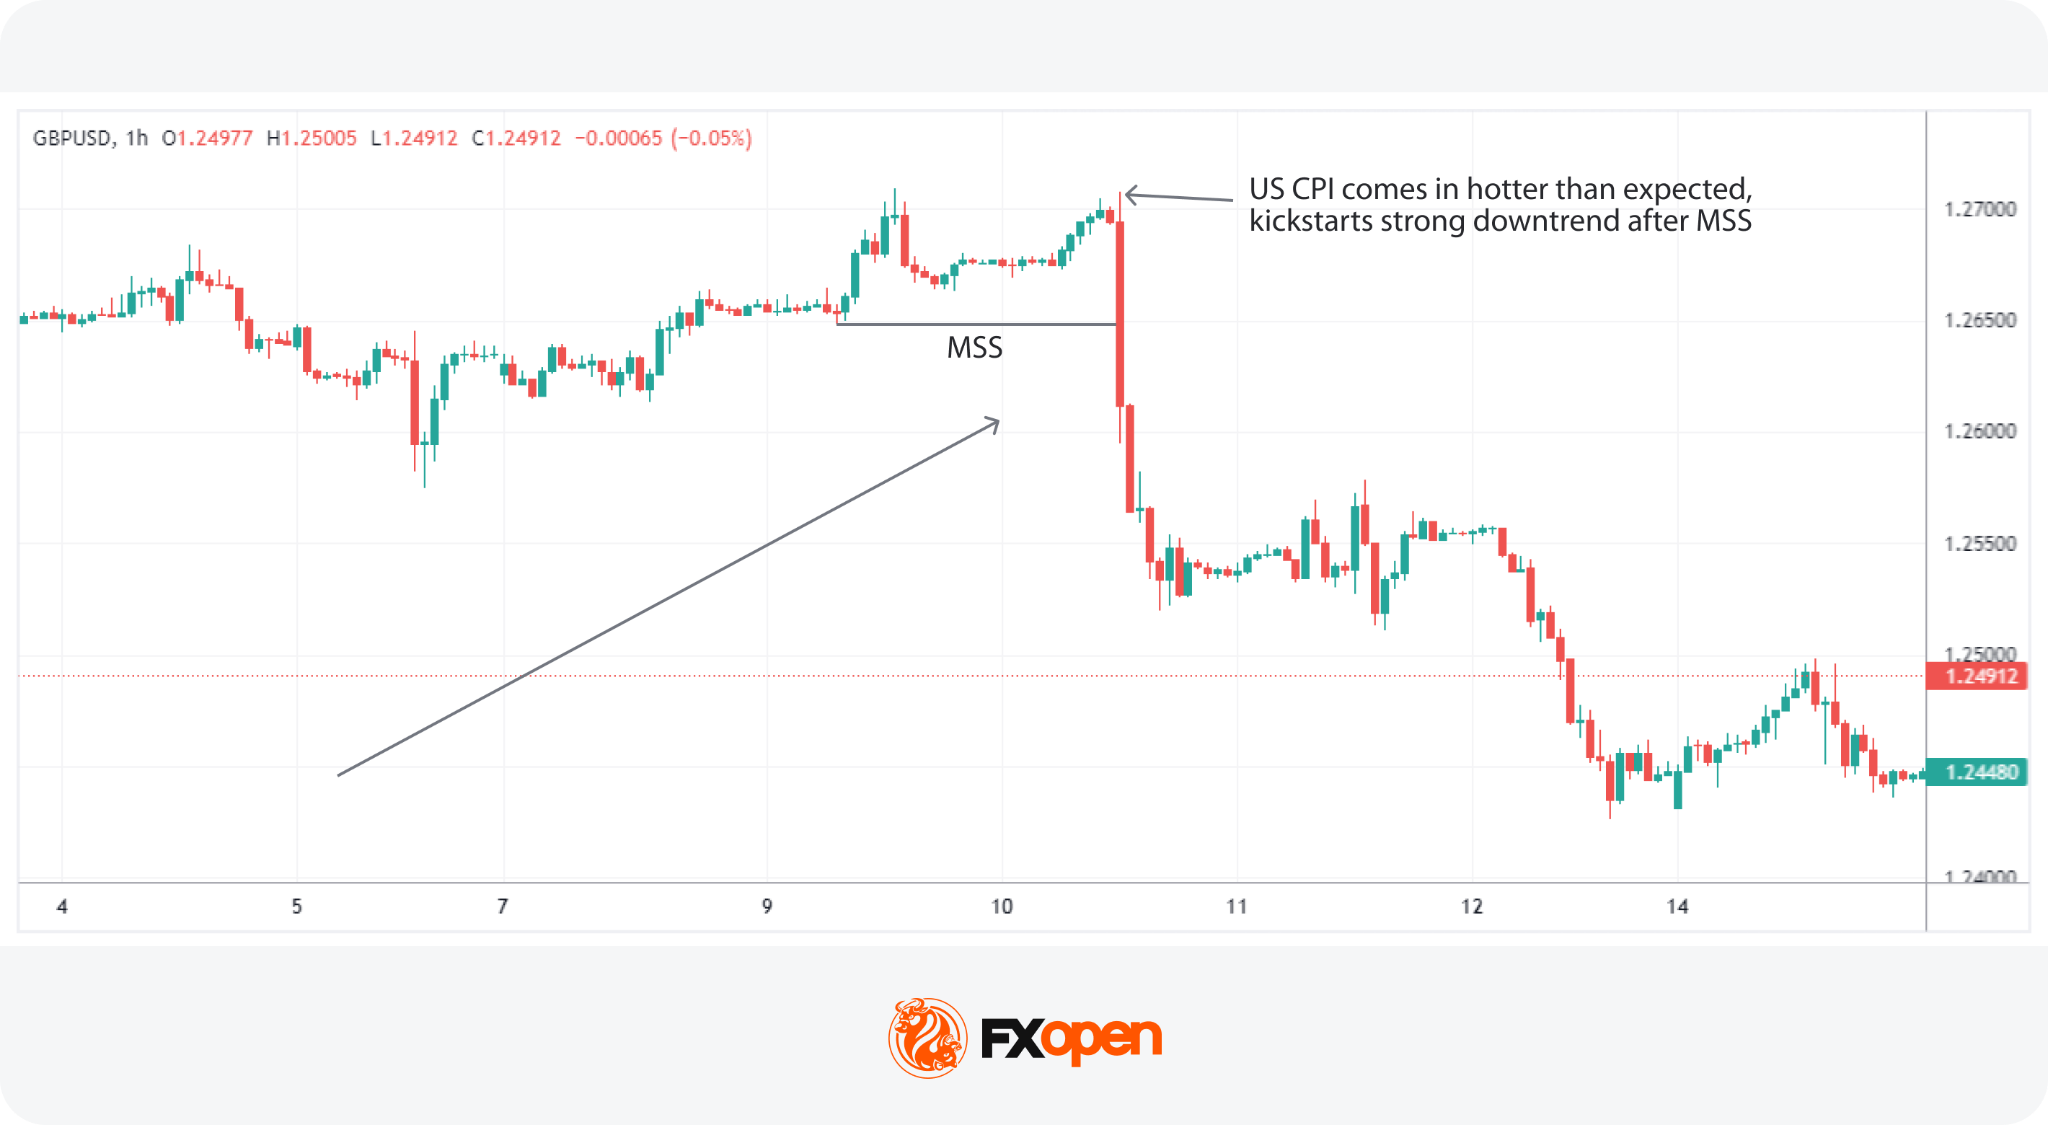
An MSS in price action trading functions as a directional tool. Identifying one is a process rather than a single observation. Traders typically work through three stages: read the existing structure, define the relevant swing points, and verify both a structural break and a displacement candle.
MSS Identification Checklist
To use an MSS in trading, traders often follow these steps:
- Read the existing structure: Establish whether price is in an uptrend, downtrend, or sideways range by mapping recent higher highs and higher lows or lower highs and lower lows.
- Watch for failed structure: Look for a lower high in an uptrend or a higher low in a downtrend, which may signal that the current trend is losing momentum.
- Mark the relevant swing highs and lows: Identify the most recent counter-trend swing point. That level becomes the line price must break for an MSS to develop.
- Confirm with a displacement candle: The break of the swing point should occur with a strong expansive candle. A wick-only breach typically does not qualify.
- Check higher timeframe bias: Cross-reference the setup against the higher-timeframe structure. Setups aligned with the higher timeframe direction tend to carry more weight.
- Account for liquidity context: A liquidity sweep above a swing high or below a swing low ahead of the break may add additional confirmation to the MSS trading setup.
MSS and Economic News
Market Structure Shift trading patterns sometimes form around scheduled releases on the economic calendar, such as central bank decisions, inflation prints, or employment data. The volatility around these events may accelerate displacement moves through key swing points. Traders typically treat news-driven breaks with extra caution, since whipsaws are common before the move resolves in either direction.
MSS With Other ICT Components
An ICT Market Structure Shift rarely sits in isolation. Traders typically pair it with other ICT trading concepts such as Break of Structure, Order Blocks, Fair Value Gaps, and Smart Money Concepts to build a fuller read of market intent. Each component adds a different layer to the analysis.
To see how these pieces interact on live charts, you can explore FXOpen’s TickTrader platform.
MSS and Break of Structure
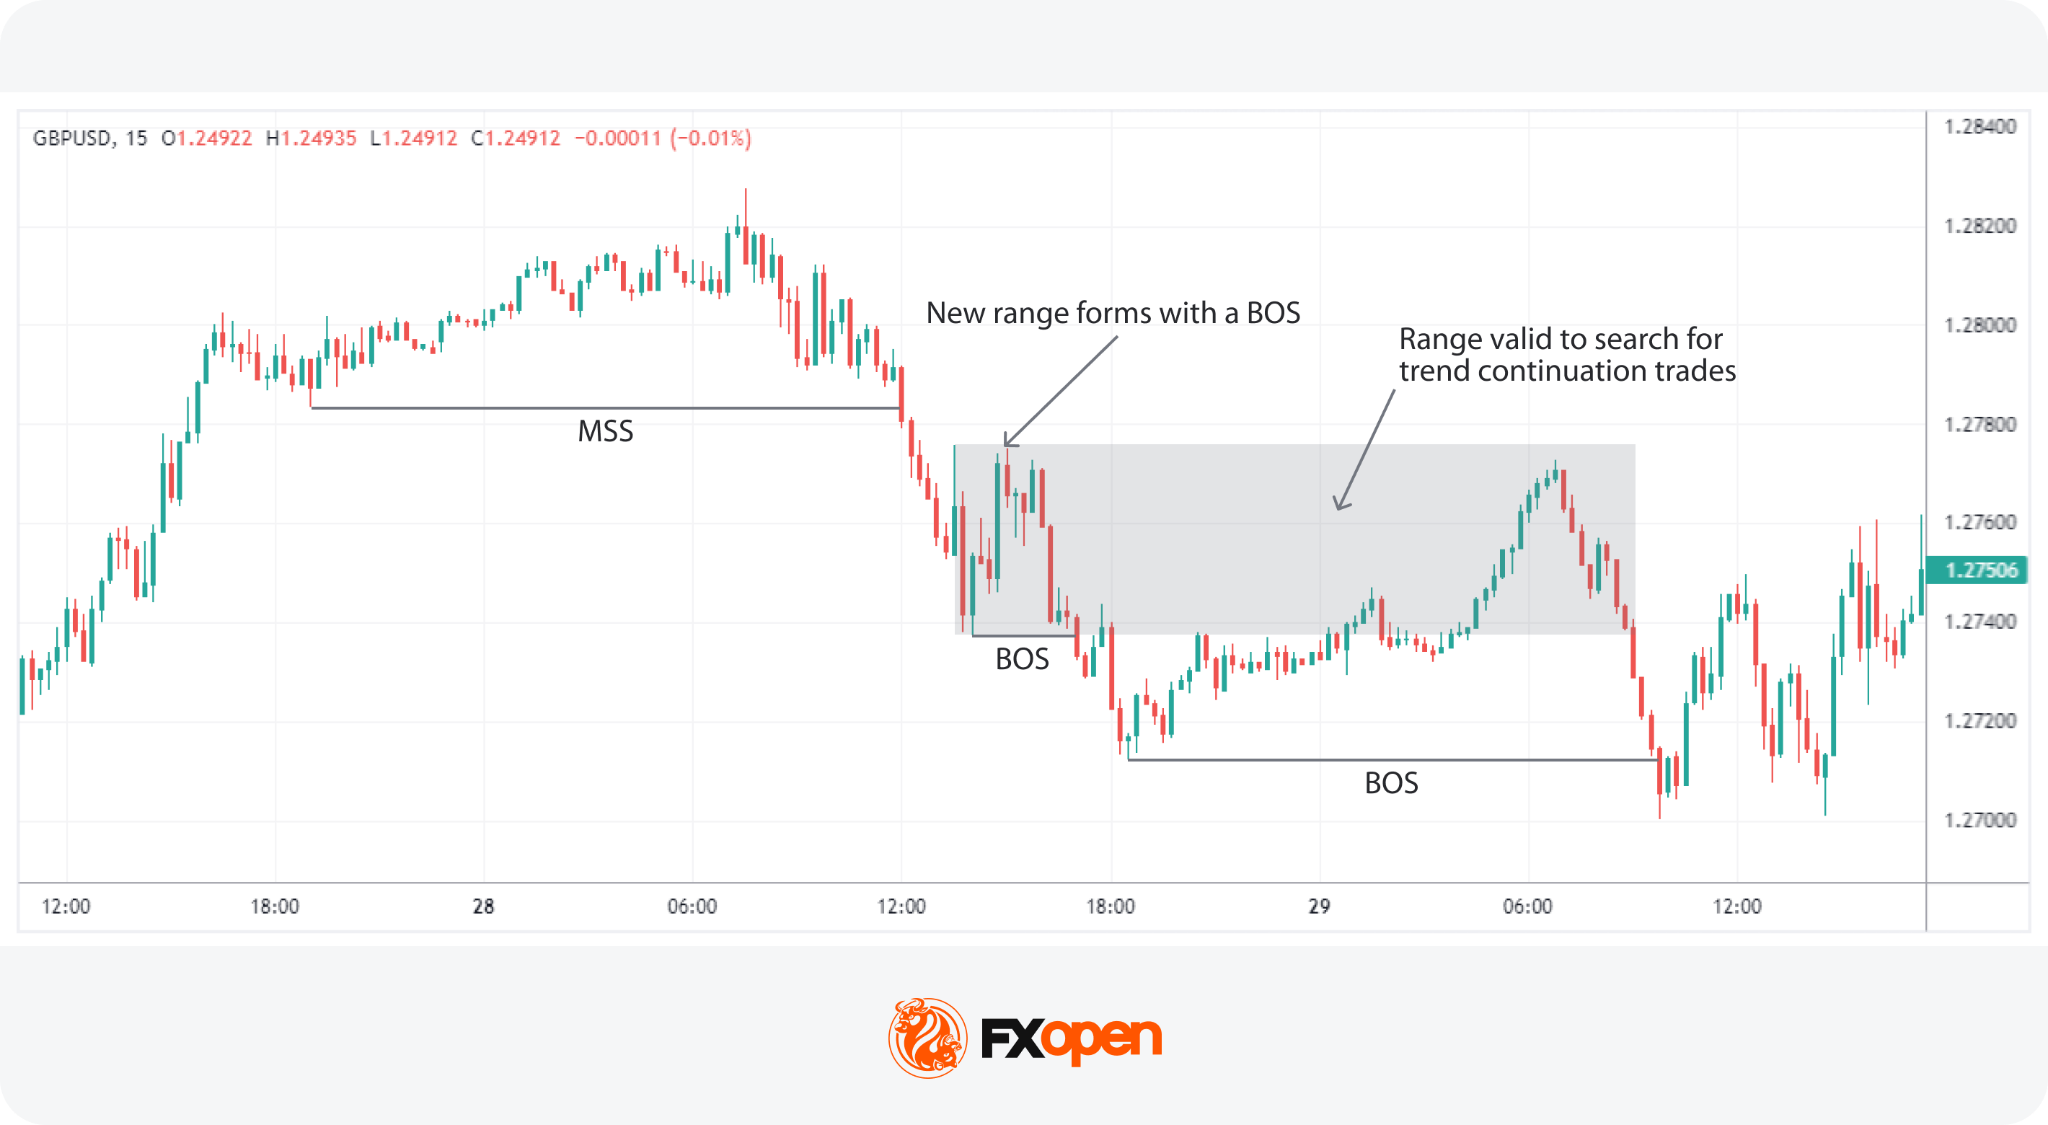
MSS and BOS sit at different points in the same lifecycle. A common sequence runs Market Structure Shift and then BOS.
Take an uptrend that begins to weaken. Price forms an MSS once a displacement candle drives decisively through a recent higher low.
From there, price establishes a new range, and a subsequent break of the new swing low registers as a BOS in the new bearish direction. Each stage carries different confirmation weight, and traders typically wait for the displacement before treating the reversal as confirmed.
MSS With Order Blocks and Fair Value Gaps
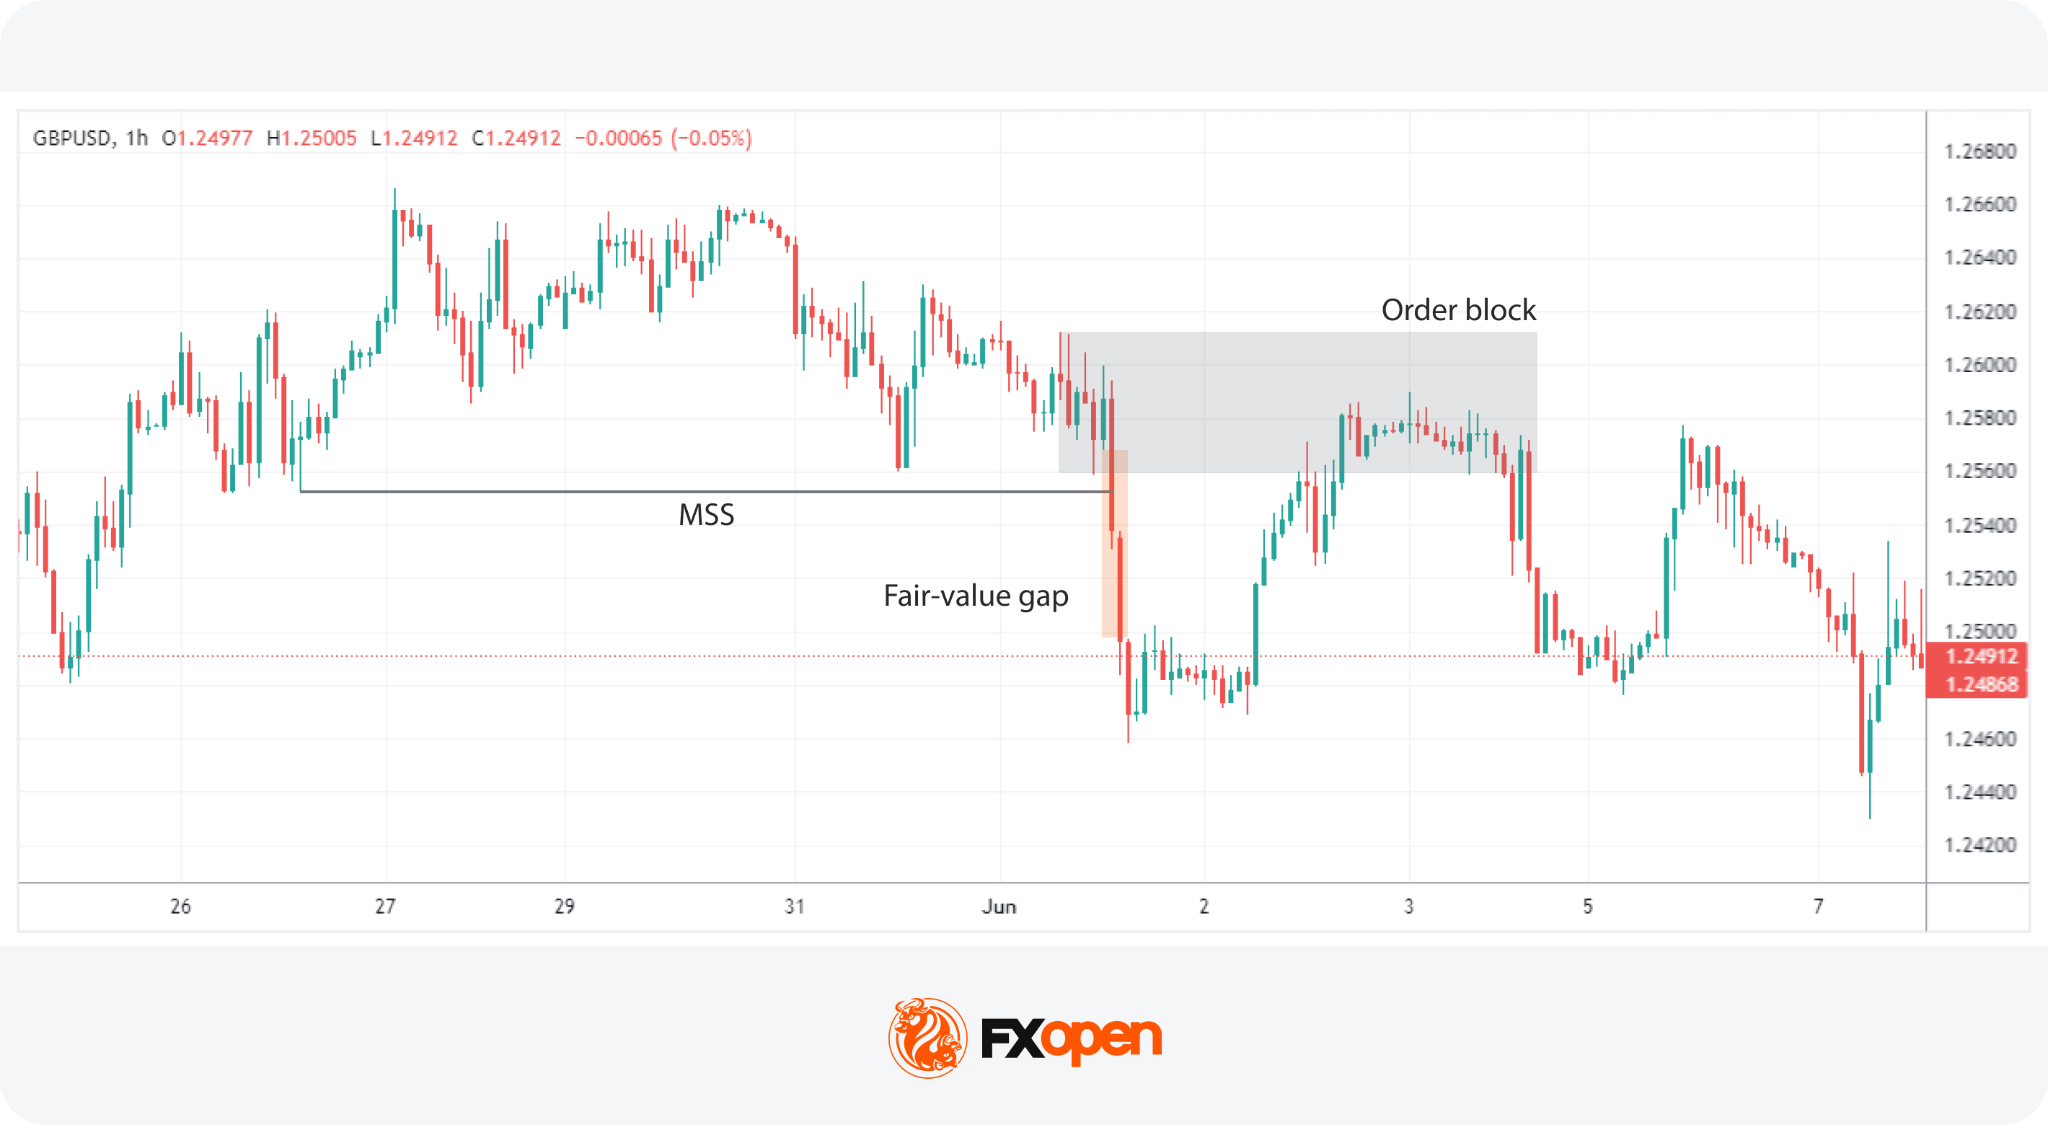
Traders combine Market Structure Shift trading with Order Blocks and Fair Value Gaps as the MSS confirms a structural shift, while the Order Block and FVG point to specific zones where price may return before the new trend extends. The displacement that confirms the Market Structure Shift almost always leaves both footprints behind, which makes them a natural follow-on reference for analysing the move.
- Fair Value Gap: This is a price range that the market skips over quickly during a displacement, leaving it untested by typical market trading. It often acts like a vacuum, drawing the price back to fill in the gap at a later stage.
- Order Block: An Order Block is a consolidation area that precedes a strong price move and is considered a footprint left by institutional traders. It represents levels where significant buying or selling occurred, potentially acting as support or resistance in future price movements.
If the price returns to fill a Fair Value Gap and enters the Order Block, this scenario can provide a potent setup for a reversal. Traders might look for confirmatory signals at these levels to enter trades that anticipate the market returning to its previous course or extending the reversal initiated by the MSS.
A compact order block trading workflow that pairs with an MSS typically follows this sequence:
- Identifying the confirmed MSS, noting the swing point that was broken with displacement.
- Marking the Fair Value Gap left inside the displacement candle range.
- Marking the Order Block at the origin of the displacement move, usually the last opposing candle before the impulse.
- Watching for price to retrace towards the FVG or Order Block.
- Looking for additional confirmation at the level, such as a smaller reaction candle or further structural alignment.
MSS in Forex and CFD Markets
The Market Structure Shift in forex is one of its most common applications, given the deep liquidity and clean swing structure of major currency pairs. The pattern also forms regularly across index CFDs such as the S&P 500 and DAX 40, commodity CFDs including gold and crude oil, and cryptocurrency* CFDs like Bitcoin and Ethereum.
MSS is a price action pattern, which means it is not tied to a specific market or timeframe. The same logic of failed swing point plus displacement applies on a 5-minute chart and a daily chart alike. Lower timeframes tend to produce more frequent setups but with weaker individual signals. Higher timeframe MSS patterns appear less often, but typically carry greater structural weight when they form.
Common MSS Mistakes
Several recurring errors weaken MSS trading results. Awareness of them may help traders apply the pattern in an ICT trading strategy more selectively.
- Trading without displacement. A swing break alone is not an MSS. Without a strong displacement candle, the pattern is closer to a CHoCH and carries less conviction.
- Ignoring higher timeframe bias. A bullish MSS on a 30-minute chart against a clear daily downtrend often resolves as a short-lived retracement rather than a sustained reversal.
- Acting before confirmation. Wicks through swing points without a closed displacement candle frequently lead to false signals. Patience for the candle close typically filters out the noise.
- Overusing MSS in ranging markets. The pattern is designed for trending-to-reversing conditions. In tight consolidation, traders often see clustered swing breaks that mean little structurally.
Key Takeaways
Market Structure Shift (MSS) is used in ICT trading to identify potential changes in market direction after the existing structure begins to weaken. Rather than acting as a standalone entry signal, MSS is typically analysed alongside displacement, liquidity context, higher timeframe structure, and other ICT concepts such as Order Blocks and Fair Value Gaps.
Understanding the difference between MSS, BOS, and CHoCH may help traders interpret whether the market is signalling continuation, early reversal conditions, or a confirmed structural shift. As with all trading approaches, risk management and confirmation remain essential, particularly during volatile market conditions.
If you are looking to put these strategies into practice, you may consider opening an FXOpen account, where advanced tools and resources are readily available to support your trading journey.
FAQs
What Is a Market Structure Shift?
A Market Structure Shift (MSS) is an ICT concept that indicates a potential reversal in market trends. It’s marked initially by a lower high in an uptrend or a higher low in a downtrend, followed by a displacement—a significant and rapid price movement that decisively breaks through a key market level.
How Are Market Structure Shifts Identified?
Identifying an MSS involves observing for early signs of trend weakening (lower highs in an uptrend or higher lows and downtrend) and waiting for a subsequent displacement that confirms the shift. This displacement should significantly penetrate a key swing point, clearly indicating a new direction in market momentum.
What Is the ICT Method of Trading?
The ICT (Inner Circle Trader) method of trading is a comprehensive approach that utilises various trading concepts such as Market Structure Shifts, Order Blocks, and Fair Value Gaps, focusing on how institutional traders influence the market. It emphasises understanding and leveraging these components to align trading strategies with probable market movements.
What Is the Difference Between MSS and BOS in ICT?
In ICT, a Market Structure Shift (MSS) refers to a potential trend reversal, confirmed by a lower high (uptrend) and higher low (downtrend) followed by a displacement. A Break of Structure (BOS), however, simply indicates the continuation or acceleration of the current trend, marked by the breach of a key high or low point within the ongoing trend direction.
What Confirms a Valid MSS?
A valid Market Structure Shift typically requires three elements stacking together. First, a failed swing point such as a lower high in an uptrend or a higher low in a downtrend. Second, a decisive break of the most recent counter-trend swing high or low. Third, a clear displacement candle showing strong momentum through the level.
Can MSS Appear on All Timeframes?
Yes. MSS is a price action pattern, so the same swing-failure-plus-displacement logic applies on a 5-minute chart, a 4-hour chart, and a daily chart alike. Lower timeframes typically produce more frequent setups but with weaker individual weight. Higher timeframe MSS patterns appear less often, but often carry stronger structural significance when they form.
Is MSS Used in Forex Trading?
Yes, the Market Structure Shift is widely used in forex trading, particularly on major pairs such as EUR/USD, GBP/USD, and USD/JPY where liquidity is deep and swing structure tends to be cleaner. It also applies to forex crosses and exotic pairs, though clarity of structure varies. MSS additionally appears across index, commodity, and cryptocurrency* CFDs.
Can MSS Signal Trend Continuation?
No. An MSS is specifically a reversal pattern. Continuation in the direction of the existing trend is signalled by a Break of Structure (BOS), not an MSS. Confusing the two is one of the most common analytical errors in ICT trading. An MSS requires a failed swing point that runs counter to the prevailing trend, which is what distinguishes it from a BOS.
*Important: At FXOpen UK, Cryptocurrency trading via CFDs is only available to our Professional clients. They are not available for trading by Retail clients. To find out more information about how this may affect you, please get in touch with our team.
This article represents the opinion of the Companies operating under the FXOpen brand only. It is not to be construed as an offer, solicitation, or recommendation with respect to products and services provided by the Companies operating under the FXOpen brand, nor is it to be considered financial advice.



Brian Armstrong fired back at Jamie Dimon on Friday with a meme, after the JPMorgan CEO attacked him on live TV.
Summary
- Jamie Dimon appeared on Fox Business on May 29, calling Armstrong “full of sh!t” and vowing that banks will fight the Clarity Act’s stablecoin provisions.
- Armstrong responded on X with a hockey-themed meme depicting himself and Dimon facing off, while Galaxy CEO Mike Novogratz publicly backed Armstrong.
- Dimon’s core objection is that the Clarity Act lets crypto firms effectively pay interest on stablecoin deposits without bank-level oversight.
Coinbase CEO Brian Armstrong posted a hockey-themed rivalry meme on X on Friday, hours after JPMorgan Chase CEO Jamie Dimon appeared on Fox Business’s Mornings with Maria and called Armstrong “full of sh!t” over his lobbying push for the Digital Asset Market Clarity Act.
The exchange escalated a months-long public feud between Wall Street’s largest bank chief and crypto’s most prominent exchange CEO, now centred on a single sticking point: whether crypto platforms should be allowed to pay yield on stablecoin balances without submitting to bank-style regulation.
What Dimon said and what it means
Appearing on Fox Business on May 29, Dimon said: “It allows cryptocurrency firms to effectively pay interest on deposits, stablecoins or something like that, without the protection that they should have. The banks will not accept it that way.” He warned the system would “eventually blow up” if passed as written, and accused Armstrong of spending hundreds of millions of dollars in Washington to push the bill. “No one is going to bow down to this guy,” Dimon said.
Galaxy Digital CEO Mike Novogratz joined the response on X, writing: “Since when do banks get to decide on legislation?” Novogratz argued that lawmakers, not financial institutions, should determine the framework for digital assets.
The friction between Dimon and Armstrong is not new. At the World Economic Forum in Davos in January 2026, Dimon reportedly told Armstrong directly “you are full of sh!t” in a private meeting that also included former UK Prime Minister Tony Blair. Bank of America CEO Brian Moynihan also reportedly told Armstrong at Davos: “If you want to be a bank, just be a bank.” Coinbase pulled its support for the Clarity Act in January after a Senate draft included provisions that would have effectively banned yield on stablecoin balances, a withdrawal that forced Senate Banking Committee Chair Tim Scott to cancel a scheduled vote.
By May, a compromise had emerged allowing activity-based rewards while banning passive yield. As crypto.news reported, Armstrong backed the updated bill ahead of the Senate Banking Committee’s May 14 markup, which advanced the legislation 15 to 9. Despite that progress, Dimon’s Friday comments signalled that JPMorgan and allied banks intend to push back on the floor vote.
For Coinbase, the stakes are direct. Coinbase reported $1.35 billion in stablecoin revenue in 2025, making the yield provisions a revenue variable as much as a policy preference. Galaxy Research head Alex Thorn currently gives the Clarity Act 70% odds of passing before August recess, while Polymarket traders price it at 61%. Dimon’s public opposition, backed by the weight of America’s largest bank, adds institutional friction at precisely the moment the bill’s floor timeline is most compressed.

The rapidly evolving Bitcoin treasury space finds itself at a crossroads, split between funds with deployable capital strategies and a wave of promotional narratives. In a candid interview at BitcoinVegas, Sean Bill, co-founder of the Bitcoin treasury vehicle BSTR alongside Adam Back, warned that many peers may be overpromising and underdelivering on practical deployment of Bitcoin.
“A lot of them don’t have the right capital structure to actually deploy Bitcoin,” Bill told Cointelegraph in a YouTube interview published this week. “They’re really planning on having Bitcoin do all the talking for them. I do think that you have a lot of carnival barkers in this space.”
Bill argued that the value proposition for a treasury-focused firm hinges on more than simply holding Bitcoin. While cheap and easy leverage can prop up value, a company without a credible mechanism to deploy capital risks losing investor interest to simpler products—such as Bitcoin exchange-traded products—when price makes the narrative harder to justify after the initial hype fades.
The ongoing debate surrounding Bitcoin treasuries has become one of the cycle’s most-discussed narratives. While corporate holdings have driven demand and visibility for Bitcoin, they also raise questions about systemic risk and market integrity as the sector matures.
In a June 3, 2025 note to investors, Geoff Kendrick, head of digital assets at Standard Chartered Bank, warned that a sharp drop in Bitcoin’s price could trigger sizable liquidations within treasury-linked strategies. He also noted that regulatory developments and broader market maturation may erode the premium that has historically accompanied Bitcoin proxy stocks. The takeaway for market participants is clear: a shift from speculative hype to disciplined capital deployment could redefine how these vehicles are valued in the years ahead.
Bitcoin treasury data underscores the sector’s scale and concentration. According to BitcoinTreasuries, 198 public companies collectively hold about 1.25 million BTC. Among them, Michael Saylor’s Strategy is listed as the largest public corporate holder, with a treasury of 843,738 BTC.
Recent coverage has highlighted the fragility of some listed vehicles. Cointelegraph reported that Nakamoto (NAKA) stock, a prominent Bitcoin treasury-listed company, slid roughly 67% year-to-date and more than 99% from its May 2025 peak of around $34 per share. The stock traded near $0.16 in April before a reverse stock split, a move that drew attention from investors and market observers. Nasdaq had warned of possible delisting after trading below $1 for 30 consecutive days, according to an SEC filing.
These dynamics illuminate the tension between narrative-driven momentum and the realities of capital markets. As more capital programs come online, the sector’s ability to deploy capital prudently—and to withstand downside risk—will increasingly determine which players survive the next cycle.
For readers tracking this space, the broader question remains: will the Bitcoin treasury model evolve into a disciplined, capital-allocating ecosystem that stands on its own merits, or will it rely on continued price momentum and promotional narratives to attract capital?
Key takeaways
- The Bitcoin treasury sector is bifurcating between firms with credible capital deployment strategies and those leaning on promotional narratives without robust capital structures.
- Without real deployment options, some companies risk losing investor interest to straightforward Bitcoin products like ETFs, especially in softer macro conditions.
- Analysts warn that a sharp price decline could trigger forced liquidations in treasury strategies, while regulatory and market maturation may erode premium pricing for Bitcoin proxy stocks.
- BitcoinTreasuries tallies show 198 public companies holding about 1.25 million BTC; the largest holder is described as Michael Saylor’s Strategy with 843,738 BTC.
- Illustrative cases like Nakamoto (NAKA) illustrate liquidity and delisting risks in this niche, underscoring the need for robust corporate governance and sustainable capital plans.
A split in the Bitcoin treasury landscape
Sean Bill’s critique centers on the structural viability of treasury programs. He contends that a credible firm must demonstrate an actionable plan to deploy Bitcoin into productive use—whether through yield-generating mechanisms, strategic hedging, or disciplined capitalization—rather than relying on Bitcoin’s price appreciation alone to justify value. In his view, “carnival barkers” may generate short-term buzz but fail to deliver durable value for long-term investors.
The industry’s narrative is closely tied to Bitcoin’s own price journey and the broader appetite for crypto exposure via listed vehicles. As Treasury strategies proliferate, the question becomes whether the market will reward tangible capital deployment and governance rigor or reward spectacle and marketing hype. This debate matters for investors seeking diversification within crypto and for builders crafting transparent, risk-aware treasury programs.
Regulatory and market maturation: what changes the calculus?
Market observers point to the Standard Chartered assessment as a reminder that the space cannot remain purely narrative-driven. A potential price shock could trigger liquidity events that ripple through treasury portfolios, particularly when leverage and margin facilities are employed. At the same time, regulatory clarity and market maturation could compress the premium that investors have historically paid for Bitcoin proxy exposure, pushing capital toward products and protocols that demonstrate resilience beyond hype.
The evolving regulatory backdrop is thus as important as Bitcoin’s price action for treasury strategies. As this segment matures, investors will demand greater transparency on reserve management, risk controls, and the ability to deploy capital productively under varied market conditions.
Scale, concentration, and the Nakamoto case
The BitcoinTreasuries dataset paints a picture of scale and concentration. With nearly 1.25 million BTC across 198 public companies, the sector remains dominated by a few large holders. The largest, described in industry data as Michael Saylor’s Strategy, holds 843,738 BTC, underscoring how a small number of large treasury positions can shape market perception and capital flows.
The Nakamoto case provides a cautionary counterpoint. The stock’s steep decline and the delisting risk highlighted the fragility that can accompany publicly traded Bitcoin treasury vehicles. The intersection of stock market mechanics and crypto exposure remains a delicate space where governance, liquidity, and valuation interact in complex ways.
As readers monitor these developments, it’s worth noting that the broader Crypto markets are watching not only Bitcoin’s price but also how treasury programs adapt to regulatory expectations and evolving investor protections. For now, the sector’s fate hinges on disciplined capital deployment, clear governance, and a credible path to real value creation beyond mere price narratives.
Further coverage on related dynamics, including market reactions to the latest regulatory signals and new treasury deployments, will help investors gauge which players are likely to endure as the space consolidates.
Sources and data references include BitcoinTreasuries’ ongoing public-company BTC holdings ledger and market notes discussing the Nakamoto stock situation, including the SEC filing and Nasdaq delisting considerations. For context on BTC treasury metrics, see BitcoinTreasuries data.


Coinkite launched the Coldcard MK5, its first hardware upgrade to the flagship Bitcoin wallet since 2022.
Summary
- The Coldcard MK5 features a 1.54-inch Gorilla Glass display, redesigned tactile buttons, and improved NFC for smoother Bitcoin transactions.
- The wallet retains the MK4’s dual secure element architecture from two different chip vendors, keeping private keys fully air-gapped.
- Coinkite’s NVK said the MK5 is a reimagining of the user experience while preserving the security standards the community has relied on for years.
Coinkite launched the Coldcard MK5 on March 10, 2026, marking the company’s first hardware revision to the MK line since the MK4 arrived in 2022 and introducing five significant user experience improvements to its Bitcoin-only signing device.
“The MK5 isn’t just an update; it’s a reimagining of the user experience,” said NVK, co-founder of Coinkite. “More durable, visible, and intuitive, all while preserving the rock-solid security our users depend on to protect their Bitcoin.”
What changed from MK4
The headline hardware change is a 1.54-inch display protected by Gorilla Glass, replacing the previous screen with one that is visibly sturdier and more legible. The MK4 used recessed buttons that required fingertips to press into a socket to register a click. The MK5 redesign brings buttons nearly flush with the chassis, giving clear tactile feedback without the awkward finger positioning of the previous model.
NFC capability has also been upgraded, improving the reliability of wireless signing workflows introduced in the Coldcard Q. The device retains the dual secure element design, pairing chips from two different manufacturers alongside a microcontroller, the same security architecture that set the MK4 apart when it launched. The MK5’s transparent case allows users to visually inspect the device’s internals for hardware implants, a feature Coinkite has emphasised as a physical security advantage over opaque designs.
All five upgrades are focused on usability rather than the security core. The MK5 continues to run the same open-source firmware that has been audited by the Bitcoin community for years and remains designed exclusively for Bitcoin, in line with Coinkite’s Bitcoin-only product philosophy.
The hardware wallet market has grown more competitive in 2026, with Trezor releasing the Safe 7 in late 2025 and several manufacturers adding touchscreens and wireless features. Coinkite’s deliberate choice to avoid touchscreens and prioritise physical button feedback signals a specific design philosophy: tactile clarity over interface modernity.
The Coldcard MK5 is available through Coinkite’s official store in multiple colours, including orange and a glow-in-the-dark variant. Pricing was not disclosed in the announcement but the device is positioned as a premium option for self-custody Bitcoin holders who prioritise air-gapped security.
Ripple’s XRP has recovered by around 2% over the past 24 hours, climbing back toward $1.34.
The move comes as institutional demand via spot XRP ETFs continues to stand in contrast to the broader market weakness.
XRP ETFs Extend Positive Inflow Streak
According to data from SoSoValue for today, spot XRP ETFs recorded $11.88 million in daily net inflows, bringing the cumulative total to $1.42 billion or $1.12 billion in net assets.
The figure represents 1.37% of the total XRP market cap.

That follows yesterday’s positive reading, when these products saw about $1.77 million in inflows despite the broader crypto market downturn.
The inflows may not be massive, but they do indicate a temporary trend, with institutions continuing to accumulate XRP amid market instability.
The continued streak gives bulls a positive narrative, but ETF demand alone has definitely not been enough to fully reverse the broader downtrend observed in XRP’s price.
XRP Price Outlook: Key Levels to Watch
From a technical perspective, XRP’s 2% daily bounce is encouraging, but it is far from being a signal for a confirmed trend reversal. The token has recently slipped toward its lowest level since March, with the $1.20 region continuing to serve as a key support level.
The first major upside level to watch is around $1.4.
As we recently reported, XRP’s 100-day moving average sits near that zone, making it a key resistance level for buyers to reclaim. A successful breakout above it could open the door to a move toward $1.5-$1.6 and improve short-term sentiment.
On the downside, a clean break below $1.20 would be a bearish signal, potentially exposing the altcoin to a deeper correction. This becomes especially true if Bitcoin and the broader crypto market resume their decline.
For now, however, XRP’s price outlook remains cautious.
The post Ripple (XRP) Price Bounces 2% on Continued ETF Inflows: What’s Next? appeared first on CryptoPotato.


Attackers drained roughly $5.4 million from the Gravity Bridge Ethereum-side contract early on May 30. On-chain investigators point to a compromised signing key rather than a smart-contract flaw.
The exploit removed $4.3 million in USD Coin (USDC) and 274 ether (ETH) worth $553,000. PeckShield also recorded $434,000 in Tether (USDT) and PAYG tokens worth $64,000.
Inside the Gravity Bridge hack
The drain came from the bridge’s verified Ethereum contract, with privileged access enabling withdrawals that appeared authorized. On-chain analyst Specter flagged the incident first, listing two attacker addresses tied to the theft.
PeckShield said the hacker moved part of the proceeds through ChangeNow and Binance to obscure origins. Cyvers Alerts and other on-chain monitors confirmed the figures shortly after.
Follow us on X to get the latest news as it happens
The attacker swapped most stablecoins into ETH and now controls about 2,102 ETH worth roughly $4.23 million.
Bridges Remain Crypto’s Weakest Link
Gravity Bridge connects Ethereum to the Cosmos ecosystem through IBC, letting assets such as USDC move between chains. The bridge held roughly $11.5 million in total value locked before the drain.
Past cross-chain bridge attacks like Ronin and Poly Network exposed how concentrated keys become a single point of failure.
PeckShield previously tallied eight major bridge exploits totaling $328.6 million in May alone.
Earlier incidents include the Meter bridge hack and a broader pattern of validator key failures across the sector.
Stablecoin issuers can blacklist addresses in minutes. Funds routed through non-custodial services like ChangeNow are harder to retrieve.
The remaining ETH stash is fully traceable on Etherscan but can still be split, mixed, or bridged to other chains.
The Gravity Bridge team has not issued a public response.
The post Gravity Bridge Loses $5.4 Million in Suspected Signing Key Compromise appeared first on BeInCrypto.

The Bitcoin treasury company space is becoming more divided between firms with actual financial strategies and those leaning more on promotion, according to one industry executive.
“I think a lot of them don’t have the right capital structure, right. They don’t have the ability to actually deploy Bitcoin,” Sean Bill — co-founder of Bitcoin treasury company BSTR, alongside Adam Back — said during an interview with Cointelegraph published to YouTube on Tuesday.
“They’re really planning on having Bitcoin do all the talking for them,” Bill said. “I do think that you have a lot of carnival barkers in this space,” Bill said.

Sean Bill spoke to Cointelegraph at BitcoinVegas. Source: Cointelegraph
Bill said that works well to an extent if a company has “cheap and easy access to leverage in the marketplace.” If not, companies must engage in other activities to add value beyond just holding Bitcoin, Bill explained. “Otherwise, investors will go to an ETF, you know, and just use a simple product like that, Bill said.
Bitcoin treasury companies have been one of the most talked-about narratives of the cycle, but questions have lingered over whether the sector is forming a bubble. While corporate Bitcoin treasuries have helped drive demand, they also introduce systemic risks. In a June 3, 2025, note to investors, Geoff Kendrick, head of digital assets at Standard Chartered Bank, said that a sharp price drop could trigger significant liquidations, while regulatory and market maturation may erode the premium for Bitcoin proxy stocks.
Related: Bitcoin plums new six-week lows as analyst eyes BTC price dip ‘end’ at $72K
There are 198 public companies collectively holding around 1.25 million Bitcoin, according to BitcoinTreasuries data. Michael Saylor’s Strategy is the largest public corporate holder, with a treasury of 843,738 Bitcoin.
On Wednesday, Cointelegraph reported that Bitcoin treasury company Nakamoto (NAKA) stock is down by about 67% year-to-date (YTD) and by more than 99% since its May 2025 peak of about $34 per share, reaching a low of about $0.16 per share in April before the reverse stock split on Friday.
Nasdaq warned the company in December that its shares would be delisted after trading below $1 for at least 30 consecutive days, according to a Securities and Exchange Commission (SEC) filing.
Magazine: HYPE chases $100 target, ETH could dump below $1800: Market Moves
The Ethereum Foundation is facing its most concentrated wave of internal criticism in years, eight high-profile departures since January 2026, a contested public mandate, and an open debate over whether the Switzerland-based nonprofit still serves a coherent purpose inside the ecosystem it helped build. The conflict is no longer a background murmur.
It is now a front-page governance crisis for the network securing trillions of dollars in on-chain assets.
What makes this moment distinct is not the departures alone. It is the collision of competing visions for what the Ethereum Foundation is supposed to be, and, by extension, what Ethereum itself is supposed to become.
Ethereum Foundation: What’s Behind the Governance Conflict
The immediate flashpoint was the foundation’s March 13, 2026 “Mandate” publication, described internally as “part constitution, part manifesto, and part guide”, which explicitly reframed the EF as a steward rather than Ethereum’s “parent, ruler, or final authority.”
The document sharpened an old fault line: should the foundation stay narrowly focused on public-goods research, or evolve into a more execution-oriented institution capable of competing in an increasingly commercial blockchain landscape?
The departures accelerated criticism that had been building for months. Zak Cole, a longtime Ethereum contributor, delivered the sharpest public verdict on Laura Shin’s Unchained podcast: “The EF is completely out of touch.
They’re funding hippos in Asia and doing a bunch of stuff nobody in the world gives a s*** about other than Vitalik and his little cabal.” Cole framed the stakes plainly: “Ethereum is no longer a startup. It’s a mature and robust ecosystem. There’s billions, trillions of dollars on the line. Livelihoods are dependent on that.”
Former EF researcher Dankrad Feist went further, publicly floating the idea of a separate $1 billion ETH-aligned organization to improve execution and value capture, a direct challenge to the foundation’s public-goods model.
The foundation’s internal agenda has also been shifting: new protocol team leadership has been tasked with raising the gas limit to 200 million, advancing proposer-builder split work, and pushing mainnet-grade zkEVMs toward 128-bit provable security.
Vitalik Buterin pushed back last week in a lengthy post, arguing critics misread the EF’s intended role. “EF is not a ‘center of Ethereum,’” Buterin wrote. “Rather EF is ‘one node, with a defined purpose, alongside other nodes.’”
He framed the foundation’s current narrowing around its core values – censorship resistance, openness, privacy and security, internally labeled “CROPS”, as a deliberate strategic choice: “The EF is choosing to use its remaining resources to pursue longevity over breadth.”
Discover: The Best Crypto to Diversify Your Portfolio
Why Ethereum Foundation Governance Affects ETH Investors
The transmission mechanism from foundation-level conflict to market impact is indirect but real. Developer sentiment drives protocol credibility; protocol credibility drives institutional confidence; institutional confidence shapes ETH’s positioning as both a financial asset and an infrastructure bet.
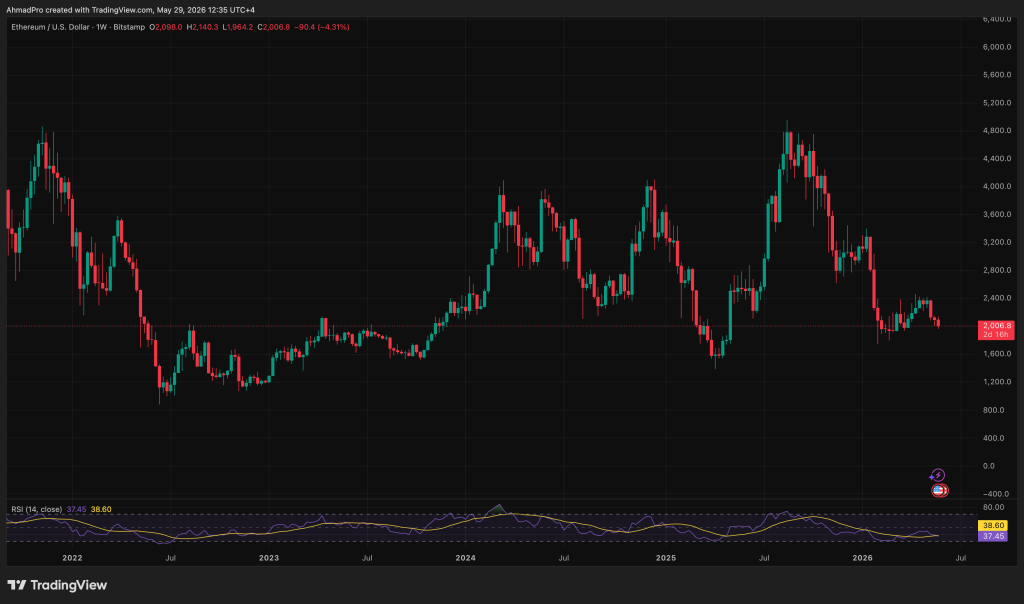
ETH has already been under price pressure, and governance uncertainty adds a credibility drag that is difficult to quantify but easy to feel in ecosystem momentum.
Chris Buolos, president of Dromos Labs, the main developer firm behind decentralized exchange Aerodrome on Ethereum layer-2 network Base, acknowledged the valid criticism while defending the foundation’s residual value: “The substantive critique, that direction has been unclear and wasteful and that the app layer has been a secondary concern, is fair.
The EF has tried to be many things to many constituencies at once.” His defense of the EF centers on its neutrality: “Having a neutral party in the room when otherwise-competing teams need to align on best practices is worth more than it sometimes gets credit for.”
This is not a directly tradeable development in the way an ETF approval or enforcement action would be. But sustained governance uncertainty at the foundation level does matter for a network where coordination on upgrades, roadmap credibility, and developer retention are competitive advantages, particularly as rival L1s aggressively court Ethereum’s developer base.
Discover: The Best Token Presales
The post Ethereum Foundation Returns to Spotlight Amid Governance and Culture Tensions appeared first on Cryptonews.
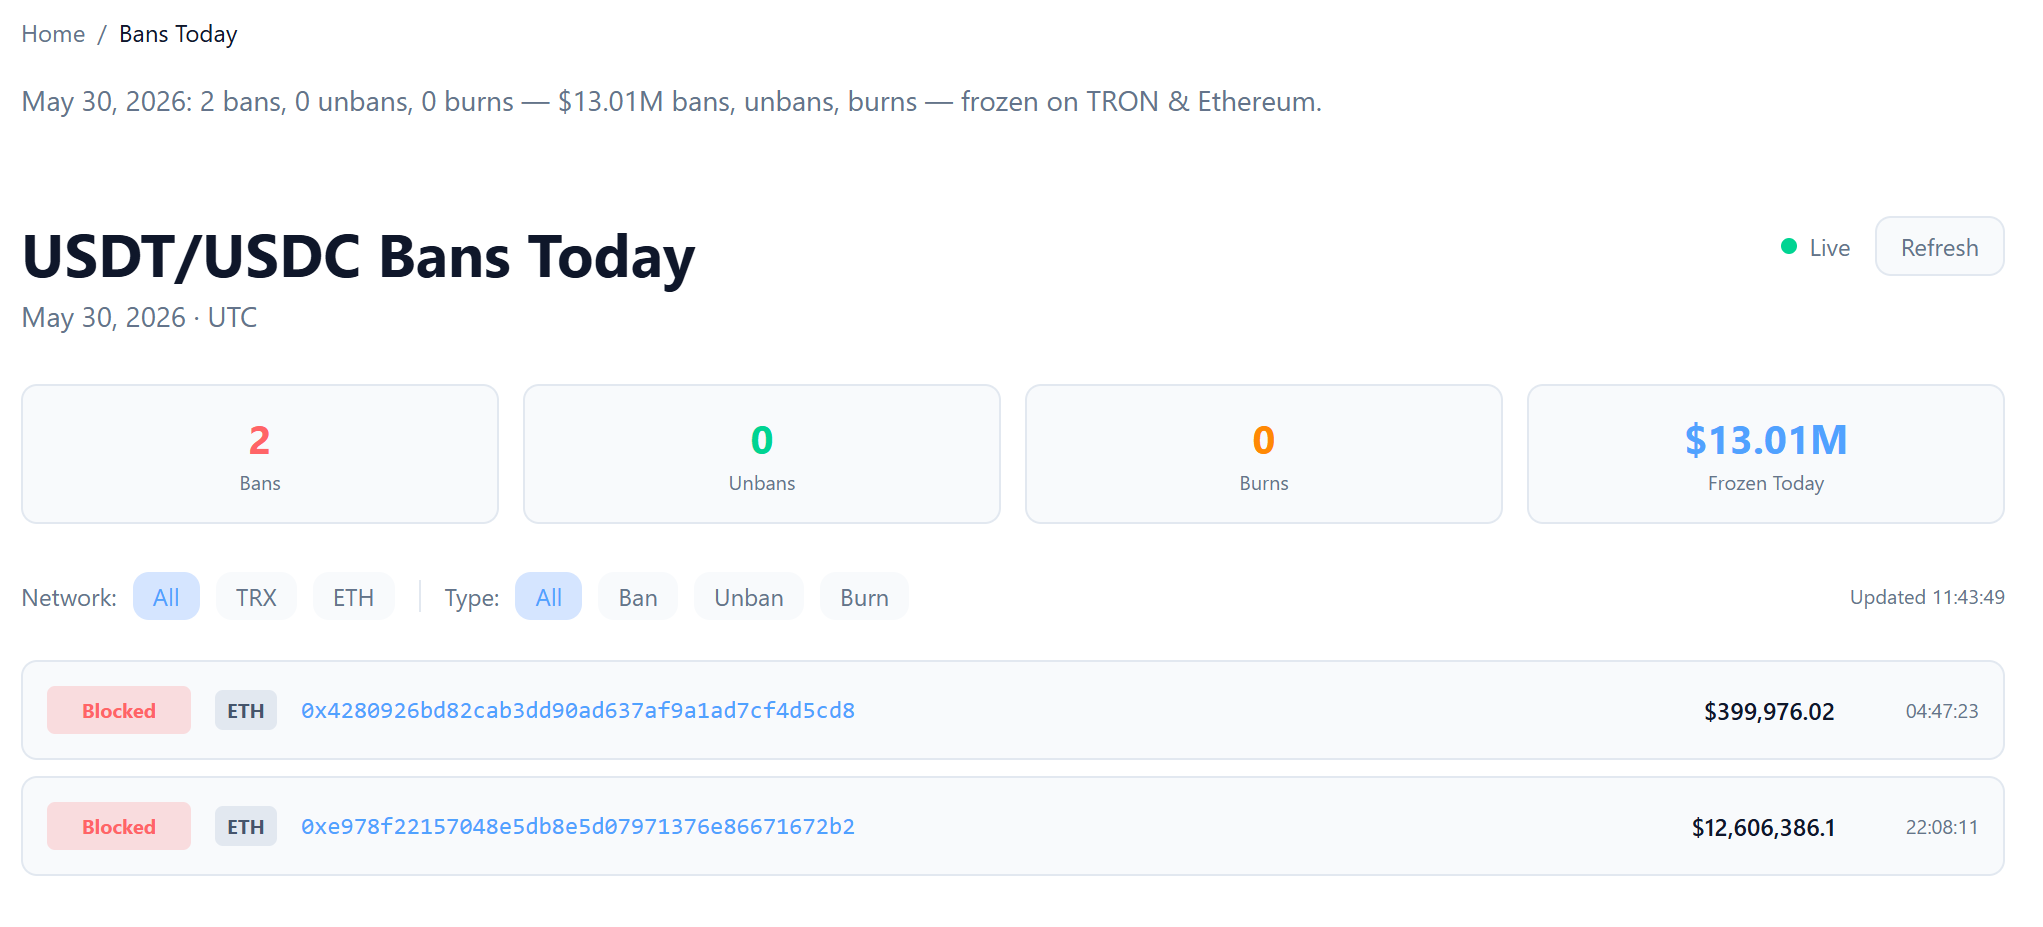
Circle blacklisted Zama’s confidential USDC contract on Ethereum on May 30. The blacklist freezes roughly $12.6 million held in a cUSDC token contract.
The freeze prevents holders of confidential USDC (cUSDC) from redeeming the tokens for standard USDC. The action raises fresh questions about issuer control over privacy-focused Decentralized Finance (DeFi) protocols.
Circle Blacklist Halts cUSDC Redemptions
Circle, the issuer of USDC, maintains a built-in blacklist on the USDC smart contract. Authorized Circle accounts add addresses, and blacklisted addresses cannot send or receive the stablecoin.
The frozen contract is an ERC-1967 proxy that holds USDC on behalf of cUSDC token holders. Zama’s privacy protocol uses fully homomorphic encryption (FHE) to conceal balances and transfer amounts on public chains.

Follow us on X to get the latest news as it happens
Circle has not publicly explained the decision.
Past freezes have followed sanctions orders, court directives, or suspected illicit activity. The company blacklisted Tornado Cash-linked USDC in 2022 after the U.S. Treasury sanctioned the mixer.
ZachXBT Links Freeze to Overnight Finance
On-chain investigator ZachXBT traced the underlying funds to a wallet, which deposited 12.4 million USDC into Zama on May 11. The wallet appears to belong to Overnight Finance.
Overnight Finance recently held a Snapshot governance vote to distribute treasury funds after holders alleged the team was preparing to rug pull. The dispute may have triggered the freeze.
Regardless, it’s precedent-setting to unilaterally freeze the contracts or addresses of a protocol where funds have been commingled with Zama users.
The commingling means innocent cUSDC holders may be locked out alongside any targeted address.
Stablecoin Control Returns to Focus
The freeze exposes a recurring tension between privacy protocols and fiat-backed stablecoins. Circle retains unilateral power to freeze funds despite its decentralized infrastructure.
Critics have long warned that centralized issuers create chokepoints. The debate intensified this year after Circle floated reversible USDC plans that would allow transaction rollbacks under certain conditions.

Similar concerns surround Coinbase’s ability to blacklist staked Ethereum through its smart contracts.
Holders of cUSDC have no clear path to recover their funds while the freeze remains in place.
Zama and Circle have yet to issue public statements addressing the affected users.
Circle could reverse the action or provide justification, with the decision expected to shape how privacy projects evaluate building atop centrally issued stablecoins.
The post Circle Freezes $12.6 Million in Confidential USDC, Exposing Surveillance Risks appeared first on BeInCrypto.


CryptoQuant CEO Ki Young Ju warns the Bitcoin bear market could extend into early 2027, based on on-chain PnL data.
Summary
- Ki Young Ju cited CryptoQuant’s PnL Index Signal, which shows investor profitability typically falls for 18 months after profit-taking cascades begin.
- The trend began in October 2025, placing a potential bear market bottom in early 2027 based on historical patterns.
- A true reversal requires unrealized profits to rise while realized profits fall simultaneously, a signal that has not yet appeared.
CryptoQuant CEO Ki Young Ju posted on X this week warning that Bitcoin’s current downturn mirrors the extended bear cycles of 2014, 2018, and 2022, and may not resolve until early 2027.
“Once profit-taking cascades, Bitcoin investors’ PnL typically falls for about 18 months,” Ju wrote. “Since the trend change started in October 2025, the bear market could last until early 2027. The trend only changes when unrealized profits rise and realized profits fall. We’re not there yet.”
What the PnL Index shows
Ju’s analysis is grounded in CryptoQuant’s PnL Index Signal, a 365-day moving average that tracks investor profitability cycles. The indicator peaked in late 2025 in a pattern closely matching the tops recorded before the prolonged bear phases of 2014, 2018, and 2022. Each of those periods saw steep sustained declines once the signal rolled over from its peak.
Bitcoin was trading near $73,000 at the time of the post, down roughly 30% from its 2025 highs, amid rising macroeconomic pressure from elevated US Treasury yields and broader risk-off sentiment across markets. As crypto.news reported, bearish social commentary on Bitcoin hit its highest level in 2026 earlier in April as spot demand weakened.
The reversal signal Ju describes requires a specific combination that has not yet materialised: unrealized profit margins must begin rising while realised profits fall simultaneously, indicating that selling pressure is exhausting itself and buyers are regaining control. Until that pattern appears, Ju views the bear case as intact.
Not all analysts share the extended timeline. VanEck CEO Jan van Eck told CNBC earlier this year that Bitcoin may be forming a cycle bottom, pointing to options market stabilisation and slowing long-term holder selling as early constructive signs. Coinbase noted in its April 2026 monthly report that price support may emerge between May and June, potentially setting up a stronger third quarter.
How Bitcoin recovers from this level
For a sustained recovery, Ju flagged two critical demand drivers: renewed inflows from spot Bitcoin ETFs and increased activity from over-the-counter institutional desks, both of which have slowed in recent months. ETF flows have remained positive but at a normalised pace relative to the surge seen in early 2025.
On-chain data from CryptoQuant shows that capital inflows into Bitcoin continue to rise, but market capitalisation has not responded proportionally. That divergence, where money enters the market but prices stagnate or decline, is the defining signature of a bear market in Ju’s framework.
Bitcoin’s current price is consolidating near the $73,000 level, with CoinGlass identifying $74,200 and $74,500 as key resistance zones where large sell orders are clustered. The Clarity Act’s potential passage remains one of the most cited institutional catalysts that analysts believe could shift sentiment, though Ju’s PnL model operates independently of policy timelines.
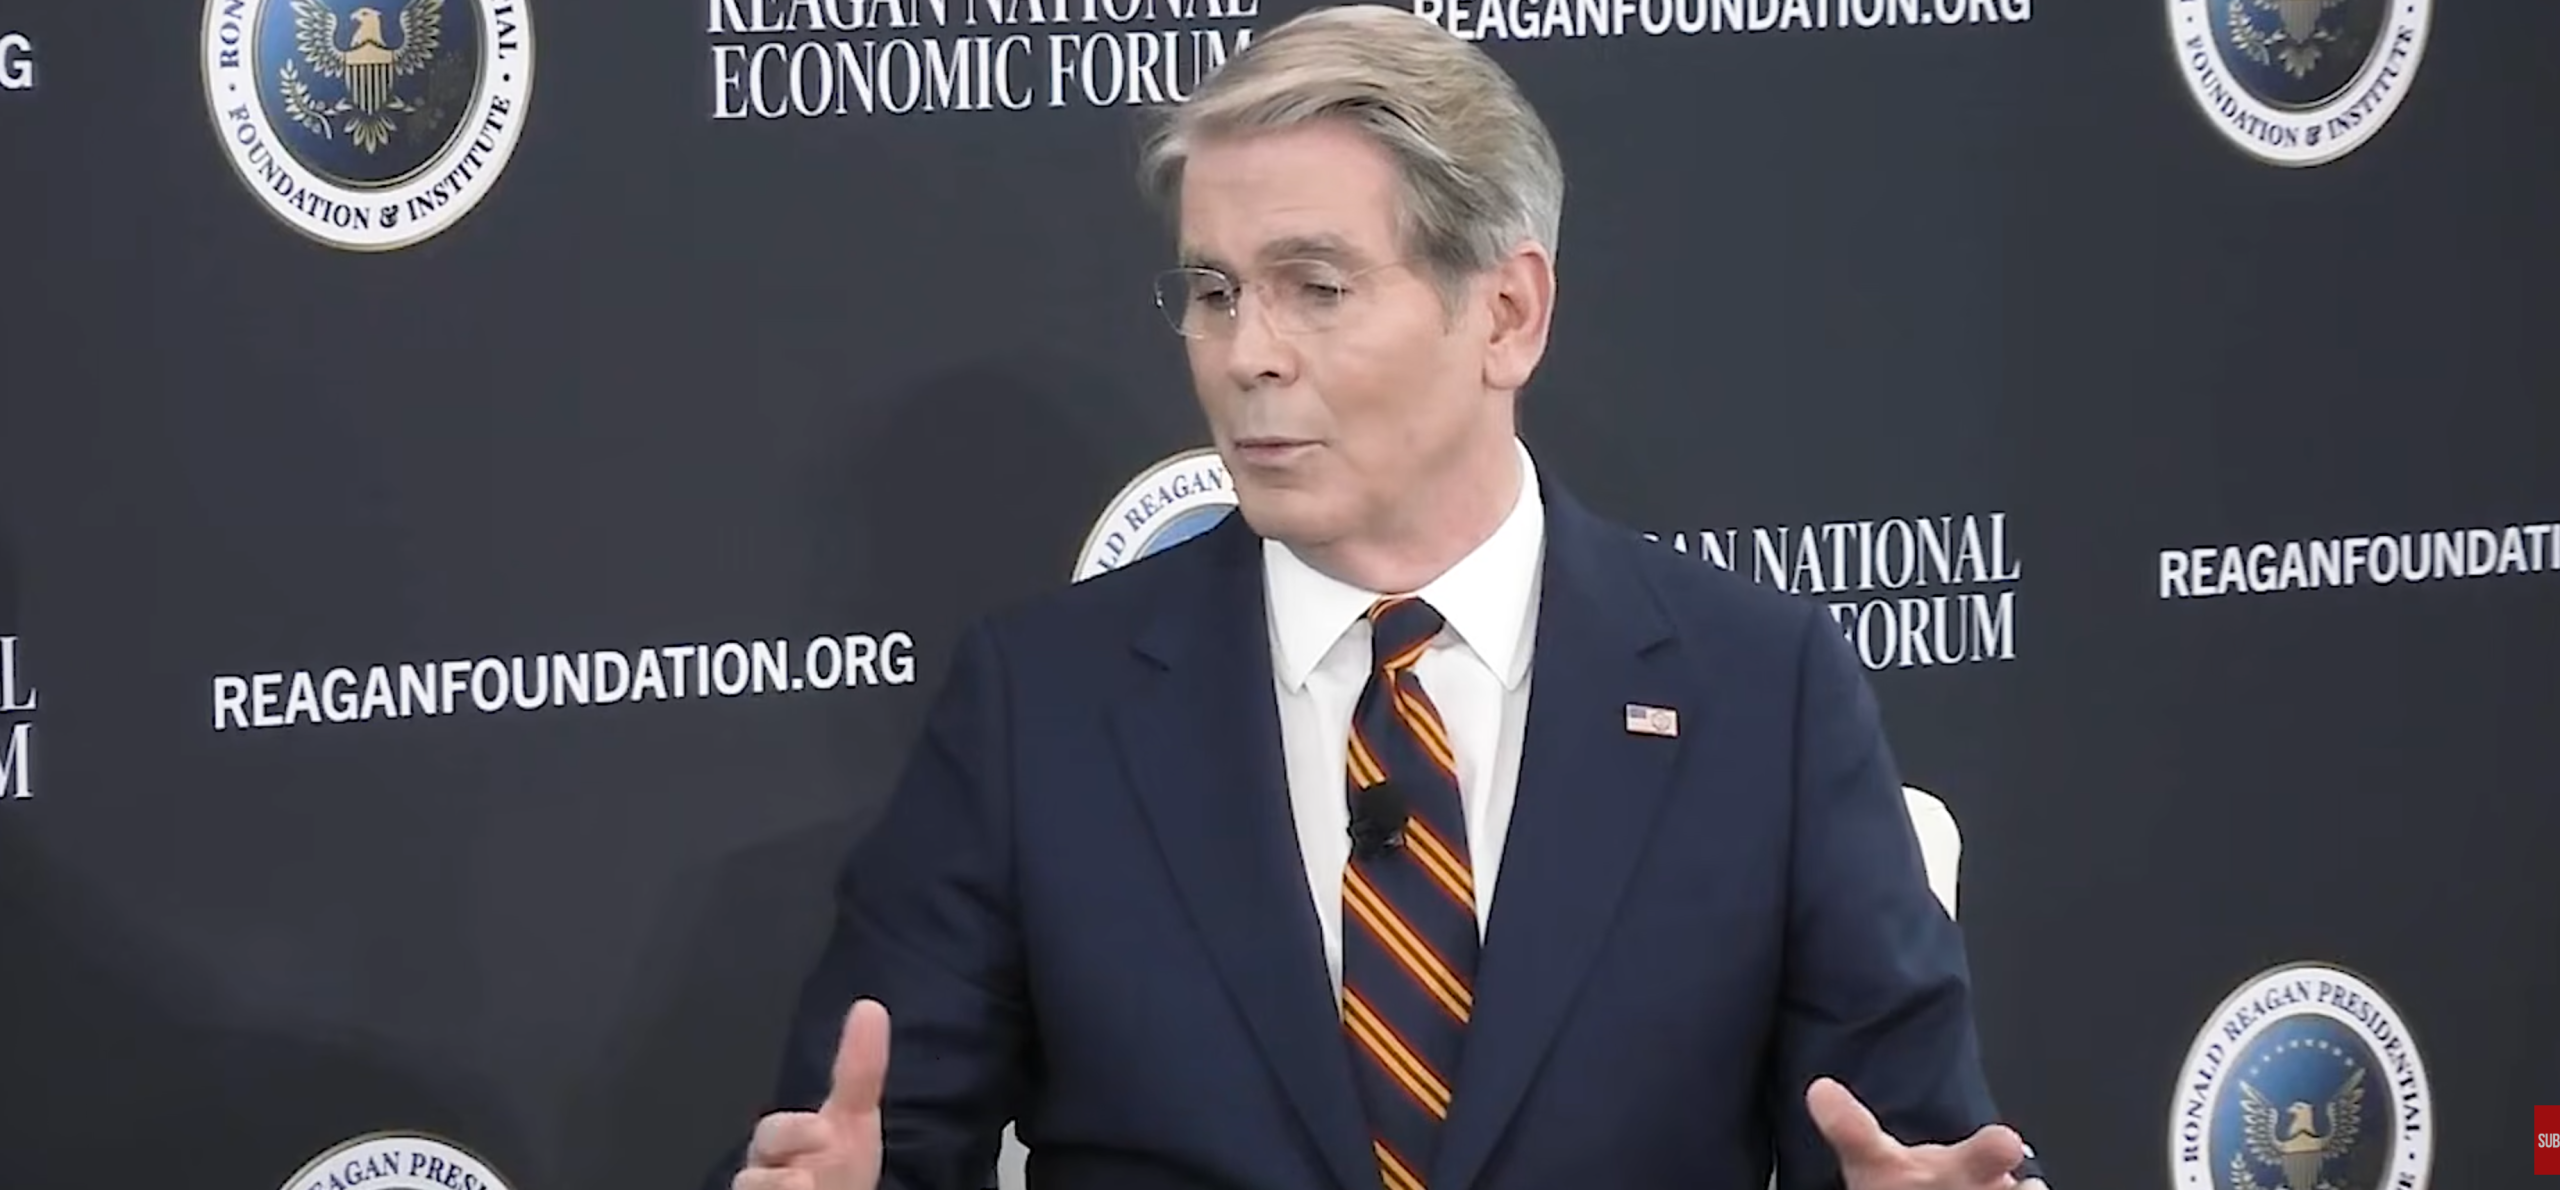
The United States has seized roughly $1 billion in Iranian crypto assets, Treasury Secretary Scott Bessent said Friday, adding that some of the wallet owners may not yet know the funds are gone.
“I believe that we have seized about a billion dollars of their crypto,” Bessent said while speaking at the Reagan National Economic Forum. “Just outright grabbed the wallets. Some of them may be typing in right now and not have realized that their wallet had been grabbed,” he added.
Bessent said the seizures are part of the US financial pressure campaign against Iran, known as Operation Economic Fury. Launched in March 2025, the operation has targeted Iranian assets across multiple fronts, seizing cryptocurrency, freezing bank accounts and working with European allies to confiscate properties.
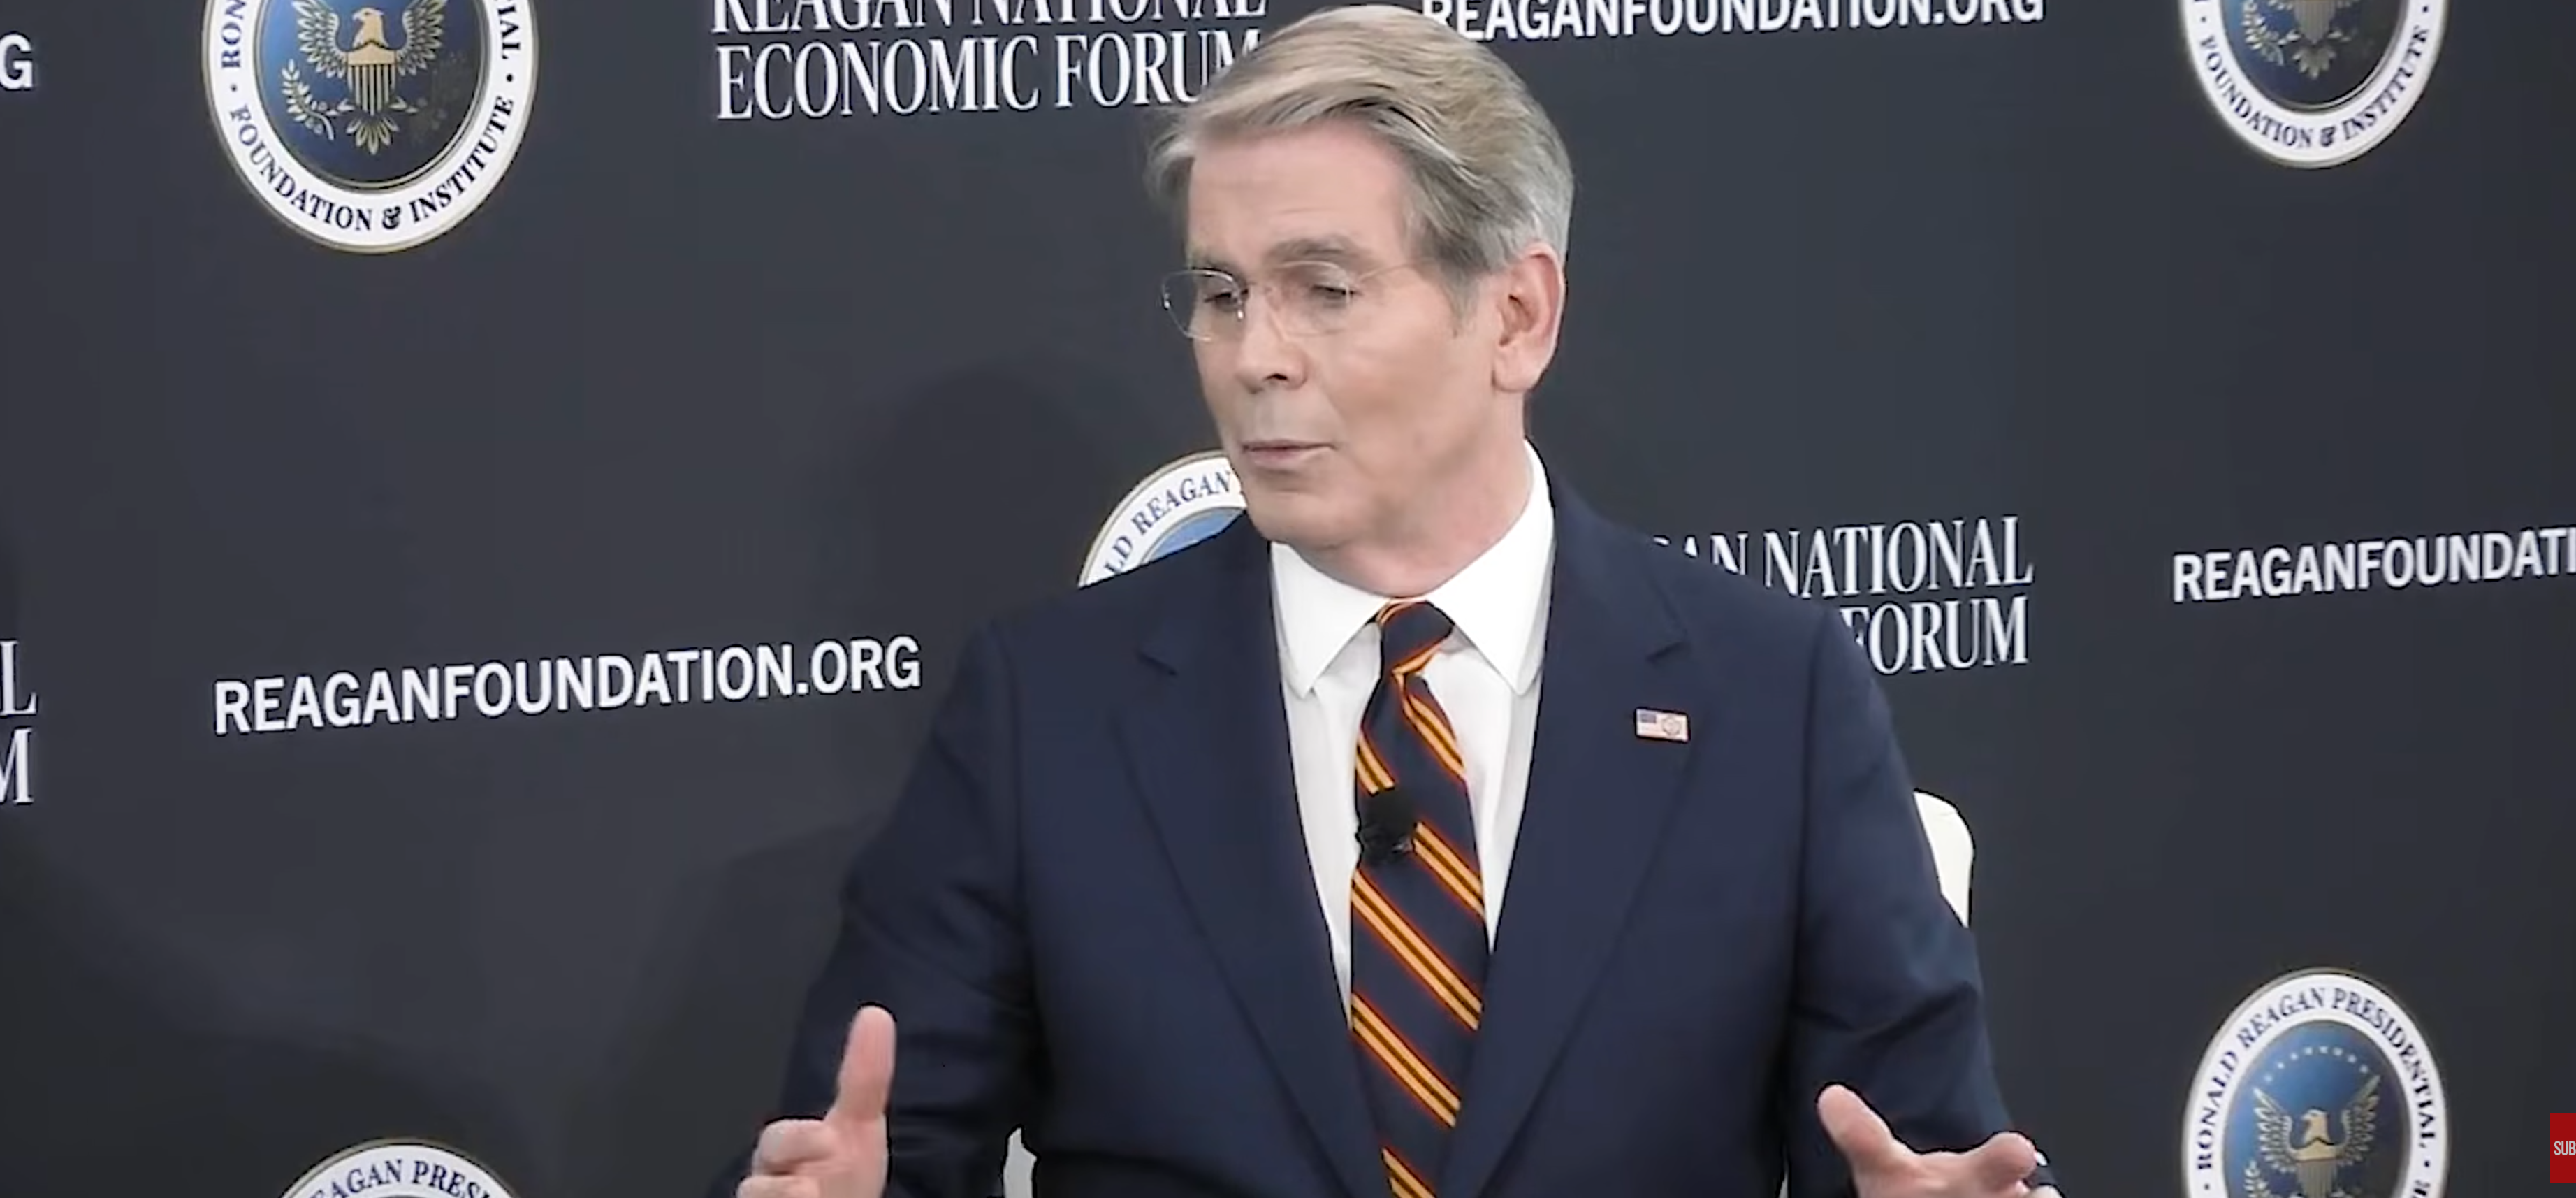
Scott Bessent at the Reagan National Economic Forum. Source: YouTube
“I think between five and a half to six weeks of an incredibly successful military campaign and Operation Economic Fury, where we have really cut them off. They are at the end of their Tether now financially,” he said.
Related: Crypto markets shed $80B after fresh US strikes on Iran
Iran’s financial state is dire
The Treasury secretary said the regime had been siphoning $400 to $500 million a month and dividing the proceeds among roughly 80 leaders before the US intervened. He said inflation in Iran has likely surpassed 200%, food vouchers are being distributed, the internet has been shut down and 40 to 50% of Iranian troops are not getting paid.
Bessent also addressed ongoing negotiations with Iran, noting the complexity of dealing with a fractured leadership structure following US and Israeli strikes on senior regime figures.
The newly disclosed $1 billion figure is roughly double the $500 million in Iranian cryptocurrency assets the Treasury Department announced it had seized in late April, and much higher than the $344 million in seized crypto assets disclosed earlier in the month.
Related: Bitcoin bounces as Trump prepares to announce ‘negotiated’ Iran deal
Iran eyes Bitcoin-powered insurance scheme for Hormuz
As Cointelegraph reported, Iran is weighing a plan to monetize control of the Strait of Hormuz through a Bitcoin-based insurance model. A state document cited by Fars News Agency, an outlet closely affiliated with the Islamic Revolutionary Guard Corps, outlined a platform called “Hormuz Safe,” which would sell digital marine insurance paid in Bitcoin and settled on the blockchain, potentially generating over $10 billion in revenue for the country.
In early April, a spokesperson for Iran’s Oil, Gas and Petrochemical Products Exporters’ Union said certain ships would be able to pass through the strait provided that they pay a tariff of $1 per barrel of oil in Bitcoin.
Magazine: Guide to the top and emerging global crypto hubs — Mid-2026

Triveni Engineering Q4 profit falls to Rs 167.4 crore; FY26 profit rises 12.8%

Brian Armstrong rebukes Dimon’s stablecoin attack

Four solo shots, Justin Wrobleski’s pitching lift Dodgers past Phils


-

 Business6 days ago
NYT Strands Answers May 24 2026 Revealed for Puzzle No. 812 Theme Summer Essentials
-

 NewsBeat3 days ago
Israel says it has killed new Hamas military leader in Gaza City airstrikes
-

 Politics5 days ago
Bridgerton Season 5: Cast, Release Date And Everything We Know So Far
-

 Business3 days ago
Selena Gomez Reportedly Upset Over Benny Blanco’s Comments on Her ‘Terrible’ Diet
-
 Crypto World4 days ago
Micron Crosses $1 Trillion Market Cap as AI Demand Reshapes Memory Sector
-

 Tech5 days ago
Microsoft’s quiet Claude Code retreat and the real cost of enterprise AI
-

 Business5 days ago
BTS Sells Out Four Las Vegas Shows at Allegiant Stadium for ARIRANG World Tour
-
 Tech4 days ago
China assigns ID codes to 28,000+ humanoid robots
-

 News Videos3 days ago
XRP *JUST* SUCCEEDED!!!! CLARITY ACT EXPOSED!!! (SHE EXPOSED IT)
-
Tech3 days ago
The Samsung pay deal is the moment Korean unions changed register
-

 Tech1 day ago
Waymo dominates autonomous vehicle registrations as Tesla trails behind
-

 Tech5 days ago
Westone Audio and Etymotic Acquired by Fidelity Collective in Major IEM Market Move
-

 Tech3 days ago
Millions of AI agents imperiled by critical vulnerability in open source package
-
Crypto World6 days ago
Brian Armstrong Outlines Crypto Vision for the Future Financial System
-
 Entertainment4 days ago
‘Breaking Bad’ Star’s Easy-to-Binge 6-Part Crime Series Spin-Off Is Finally Heading to Free Streaming
-
Crypto World3 days ago
SpaceX’s $2 Trillion IPO: Why Tech Giants Nvidia (NVDA), Apple (AAPL), and Microsoft (MSFT) May Face Pressure
-
 Crypto World5 days ago
Nvidia (NVDA) CEO Calls on Super Micro to Strengthen Export Controls Amid Smuggling Probe
-

 Tech3 days ago
NASA taps Blue Origin to deliver lunar rovers for Moon Base initiative
-
 NewsBeat5 days ago
Hottest May day ever as London hits 34.8C in 2C leap from previous records
-
 Entertainment4 days ago
Taylor Swift Fans Label Travis Kelce’s Beer-Chugging A ‘Red Flag
You must be logged in to post a comment Login