

Crypto World
Jes Staley interview about Jeffrey Epstein with House Oversight set


Former CEO of Barclays, Jes Staley, arrives at the High Court in London, United Kingdom, on March 14, 2025. Staley is challenging his ban from the UK finance sector over his ties to Jeffrey Epstein.
Tayfun Salci | Anadolu | Getty Images
Jes Staley, the former JPMorgan Chase executive and ex-Barclays CEO, has agreed to be interviewed on about his relationship with notorious sex offender Jeffrey Epstein on July 23 by the House Oversight and Government Reform Committee, a spokesman for the panel confirmed Sunday.
The Financial Times first reported that Staley accepted the invitation for a voluntary transcribed interview extended to him three weeks ago by Oversight Chairman Rep. James Comer, R-Ky.
The Oversight panel has been conducting a series of interviews with high-profile people about Epstein, including former President Bill Clinton, former Secretary of State Hillary Clinton, and Commerce Secretary Howard Lutnick.
Former Attorney General Pam Bondi was interviewed by the committee on Friday about the Department of Justice’s handling of the release of its files about Epstein.
Microsoft co-founder Bill Gates is scheduled to be interviewed by the Oversight committee on June 10 about his dealings with Epstein.
Billionaire Leon Black is reportedly scheduled to be interviewed by the panel on June 26, and Goldman Sachs general counsel Kathryn Ruemmler is reportedly scheduled to be interviewed on July 15.
Staley was a friend of Epstein, who had been a major client of JPMorgan’s private wealth and asset management divisions when Staley ran them.
Epstein, a former friend of President Donald Trump, died from a jailhouse suicide in New York in August 2019, weeks after being arrested on federal child sex trafficking charges.
JPMorgan in 2023 agreed to pay victims of Epstein $290 million to settle a lawsuit that the bank had facilitated sex trafficking by Epstein, who was a client of JPMorgan.
That same year, the bank agreed to pay $75 million to settle a similar lawsuit by the government of the U.S. Virgin Islands, and separately agreed to a confidential settlement with Staley to resolve the bank’s claims that he was responsible for any civil damages and costs associated with Epstein-related litigation.
In both public settlements, JPMorgan did not admit wrongdoing in its dealings with Epstein.
Staley served as CEO of Barclays from October 2015 until his resignation in late 2021.
His departure came after a probe by the United Kingdom’s Financial Conduct Authority into how he had characterized his relationship with Epstein to Barclays and the subsequent description of that relationship in Barclays’ response to the FCA.
That regulator fined Staley more than $2 million and permanently banned him from holding a management role in the sector in 2023.
Barclays noted at the time that the investigation “makes no findings that Mr Staley saw, or was aware of, any of Mr Epstein’s alleged crimes, which was the central question underpinning Barclays’ support for Mr Staley following the arrest of Mr Epstein in the summer of 2019.”
Staley, in 2020, said, “Obviously, I thought I knew him well, and I didn’t. For sure, with hindsight, with what we know now, I deeply regret having any relationship with Jeffrey.”
— CNBC’s Garrett Downs contributed to this article.


Key Insights
- Solana stays dominant thanks to rapid transactions, low cost, and a thriving DeFi and gaming ecosystem.
- Cardano remains focused on security, governance enhancement, and robust blockchain infrastructure.
- Dogecoin gains an advantage through robust community backing, expanding payment usage, and high liquidity.
- Each cryptocurrency presents its own advantages that can put it ahead of the curve during the next bull run.
Top Crypto Coins to Buy Ahead of the Next Bull Run
The cryptocurrency sector is poised for another big break and investors are seeking coins with solid fundamentals, continuous development, and growing adoption. Despite the large number of digital tokens, only a few manage to survive each market cycle.
Solana (SOL), Cardano (ADA), and Dogecoin (DOGE) are notable cryptocurrencies worth watching in 2026. They play significant roles in blockchain technology and address diverse needs, from decentralized finance and smart contracts to payment systems.
Solana (SOL) High Speeds And Scalability Fuel Success
Solana is a blockchain network with remarkable performance capabilities. As a high-speed platform, Solana can process hundreds of transactions per second while keeping very low fees. The network’s speed and cost efficiency make it suitable for DeFi applications, NFT markets, blockchain games, and trading environments.
Continuous development by the community keeps Solana competitive. Several updates aim to increase scalability, security, and efficiency. The much-awaited Firedancer update is set to boost network resilience by introducing an independent validator client.
Advancements like Alpenglow aim to reduce transaction finality time and enhance the user experience. Faster transaction times and increased computing power may support the emergence of new decentralization applications and blockchain projects.
Solana’s active developer community and infrastructure upgrades make it an attractive option for investors looking to capitalize before the next bull market.
Cardano (ADA) Built For The Long Run
Cardano takes an academic and systematic approach to blockchain development. While many networks pursue rapid growth, Cardano emphasizes security, formal research, and long-term sustainability.
The platform uses the proof-of-stake consensus algorithm Ouroboros, which is energy efficient and enables developers to build decentralized applications. Cardano’s research-driven model has contributed to its reputation as a secure blockchain solution.
Recent governance changes have improved decentralization by increasing community participation and giving ADA holders greater influence over decision-making.
Scalability remains a challenge, with Hydra proposed to increase transaction throughput and reduce costs for decentralized applications. Projects like Midnight add privacy features aimed at enterprises and finance-oriented use cases. Investors seeking a sustainable blockchain project may consider Cardano for its focus on security, governance, and advanced technology.
Dogecoin (DOGE) Community Advantages And Payment Use
Dogecoin began as a meme-based cryptocurrency but has become one of the most recognized digital assets. It has remained relevant across market cycles thanks to strong support from retail and crypto communities.
The community behind Dogecoin is a key factor in its success. Unlike many short-lived meme tokens, DOGE benefits from widespread recognition and ongoing engagement.
Dogecoin is also practical for small payments due to low transaction fees and fast confirmations. It is commonly used for tipping, payments for goods and services, and international transfers.
High liquidity and significant daily trading volumes help DOGE maintain market presence and allow traders to enter and exit positions more easily. If adoption as a payment method continues to grow, Dogecoin could attract further attention in the next crypto rally.
Crypto World
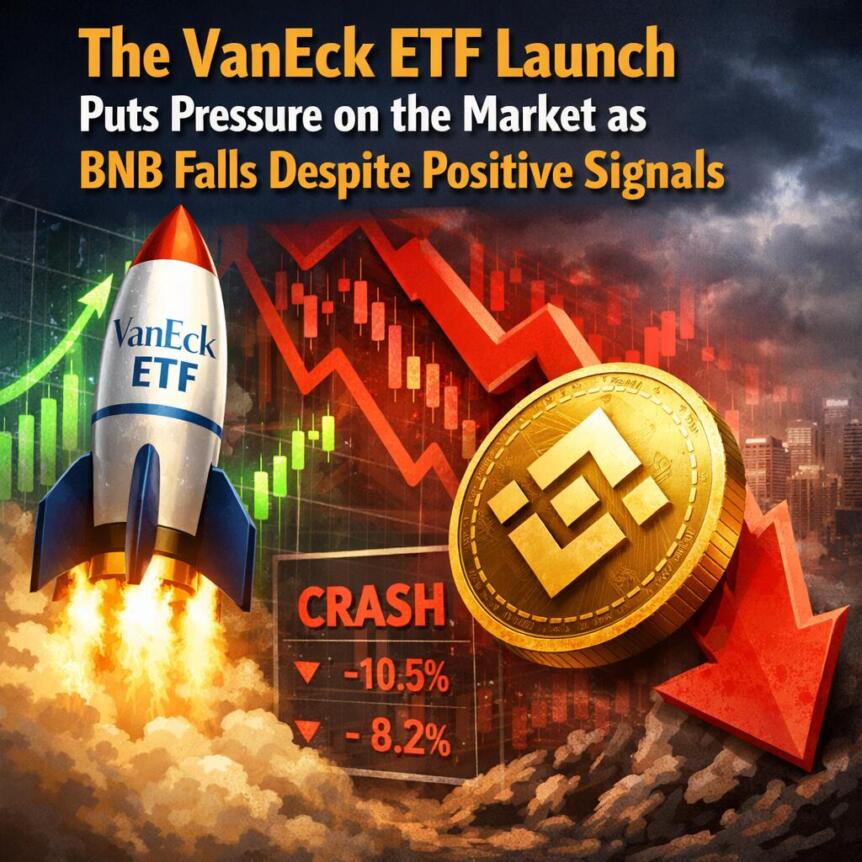
The VanEck ETF Launch Puts Pressure on the Market as BNB Falls Despite Positive Signals
Key Insights
- The ETF was developed by VanEck and is the first U.S. spot BNB ETF traded as VBNB.
- Despite the bullish news of the BNB ETF launch, the token has fallen by over 2%.
- The cryptocurrency faces downward pressure due to poor technical signals, futures’ lower interest rate, and macro issues.
Debut of the VanEck ETF Leaves BNB Price Rallying Behind
Investor sentiment hit an all-time high after the VanEck ETF that tracks BNB made its debut in the United States. Expectations for the price to rally following such a major move were high, but the market decided otherwise as the token declined throughout the session during which the ETF debuted.
Such an outcome may leave a number of cryptocurrency traders puzzled as ETF approvals have previously proven to be a bullish trigger for the asset class in general. The lack of positive impact left by the ETF approval on the token may point toward a situation in which other factors carry more weight than the underlying event itself. In another recent development, BNB’s founder, Changpeng Zhao (CZ), made a donation using the token.
ETF Provides Access Without Extra Incentives
The official BNB ETF has been listed on NASDAQ under the ticker symbol VBNB. The ETF has an annual management fee of 0.39%. The ETF was created under the Investment Company Act of 1940 to provide a regulated way of accessing BNB in traditional financial markets.
One of the advantages of the BNB ETF is that it tracks the spot price of BNB, making it easy for investors who do not want to store their cryptocurrencies. On the other hand, one of the shortcomings is that there are no staking incentives. Though staking incentives can be added by a third party at some point in the future, no definite plan has been provided yet.
The absence of incentives to generate income may have lowered its appeal. However, VanEck still sees positive potential in BNB and expects it to perform well in the coming years due to its strong fundamentals, including over 14 million transactions per day and over 2.5 million active users.
Despite this, the BNB token was trading at around $631 to $635 when the ETF debuted. Moreover, it closed over 2% lower on the day of the listing. It currently has lost more than 26% year-to-date.
Technical Indicators and Risks Persist Despite Improvements
The technical picture still indicates that BNB faces significant weakness. The coin is trading below many important resistance points, such as the $645 and $663 levels represented by 50-period and 100-period EMAs, respectively. The Bollinger Band median at $657 is also proving to be an impenetrable defense against all upward moves.
Momentum indicators point to negative sentiment. In particular, the MACD histogram persists in showing values below zero, highlighting continued bearishness, and the RSI has not moved above the crucial 50 mark. Derivatives metrics also back up the bearish outlook. Open interest in futures contracts has fallen from almost $1 billion to $961 million.
The support is currently around $634 and near the lower Bollinger band. A breach of this support level would increase the probability of further declines for the coin. Furthermore, the uncertainties in the market environment, including political risks and risk aversion among other factors, also contribute to reduced appetite.
Despite BNB becoming one of the coins whose exposure can now be traded via an ETF based in the United States, the VanEck ETF launch indicates that regulatory developments will not automatically translate into positive price movements under current circumstances.

TLDR:
-
- Sui Network’s v1.72 upgrade introduced a gas charging bug that caused three mainnet halts within 48 hours in May 2026.
- No user funds were lost during the outages, and validators restored full network activity by May 30, 2026, after emergency fixes.
- The SUI token dropped roughly 8% during the disruptions, falling below $0.89 and liquidating nearly $2M in long positions.
- This marks Sui’s second major outage of 2026, raising ongoing concerns about upgrade testing and Layer-1 infrastructure reliability.
Sui Network suffered three mainnet halts within 48 hours, from May 28 to May 30, 2026. The disruptions traced back to a crash bug introduced in the v1.72 software upgrade.
No user funds were lost during any of the three stalls. Validators coordinated emergency fixes and restored block production by May 30.
However, the repeated downtime pushed the SUI token sharply lower and renewed questions about the chain’s infrastructure reliability.
Three Halts in 48 Hours: What Triggered the Outages
The root cause of the first outage was a crash bug in the gas charging logic introduced in version v1.72. Sui had improved gas charging in this release to more accurately estimate fees based on transaction complexity.
However, the new logic contained an edge-case defect. When a specific transaction structure appeared on the network, gas calculation would error out. This caused all validators to crash and enter a loop, halting the entire network completely.
The first halt began on May 28, 2026, at 13:48 UTC. SuiScan showed no new checkpoints, and the outage lasted five hours and 55 minutes. Validators then worked to deploy a corrected version.
Restoring the network required manual coordination across the entire validator set. Node operators identified the divergence point, purged incorrect consensus data, and deployed corrected logic.
The second and third halts followed shortly after. The outages originated from an interaction conflict between the Address Balances feature and gas billing logic introduced in version 1.72.
A temporary fix deployed earlier carried a known issue that could trigger outages with an extremely low probability — a calculated risk that backfired when epoch transition problems piled on.
The third Sui mainnet outage hit on May 29, 2026, at approximately 4:30 PM EDT. The trigger was the rollout of the long-term patch itself.
As validators restarted to deploy the new version, a latent bug in epoch transition handling froze user transactions all over again.
Sui’s official account confirmed the situation on X, stating: “Sui mainnet stopped accepting user transactions due to an issue during the epoch change beginning at ~1:30PT. Validators are up and creating system transactions, but user transactions are not currently being accepted.”
SUI Price Falls as Market Reacts to Repeated Downtime
The price of SUI dropped across all three outage periods. The SUI token dropped 8% during the incident, trading at $0.91 after falling from $0.99.
Approximately $1 billion in on-chain assets were temporarily frozen while all validators entered a crash loop. Trading activity across decentralized finance protocols on the network came to a full stop during each halt.
CoinGlass confirmed $1.88 million in network positions were liquidated in the latest wave alone. SUI traded at $0.874 as of May 31, 2026, per CoinGECKO data.
The token broke below the $0.89 level, which crypto analyst Crypto Patel noted was near the cycle low, adding that SUI was down roughly 37% in 20 days with approximately $2 million in long positions liquidated.
A complete halt in block production created operational risk considerations for exchanges, liquidity providers, and institutional participants integrated with the network.
While no funds were reported lost, the inability to process transactions for nearly six hours intensified scrutiny around infrastructure stability.
This incident marks the second major stall for Sui in 2026, following the January 14 consensus-related issue that forced the network to be deliberately paused.
In both cases, the disruptions stemmed from bugs introduced during software upgrades, with no loss or risk to user funds.
Validators completed the emergency upgrade by May 30, and network activity resumed. A full incident review from the Sui core team is expected in the coming days.

TLDR:
- Bitcoin’s final weeks of the month trend downward, while the first weeks historically push prices higher.
- No trade was triggered over the weekend as slim price action failed to meet van de Poppe’s entry conditions.
- BTC dominance printed a false break above resistance, a classic bearish signal that traps late buyers.
- Falling Bitcoin dominance historically drives capital into altcoins, setting the stage for a broader altseason.
Bitcoin traders are watching closely as the market approaches a familiar pattern at the month’s end. Analysts are identifying key trade setups while Bitcoin dominance shows signs of a reversal.
Weekend price action remained quiet, with no major trades triggered. Meanwhile, technical signals suggest capital may soon rotate into altcoins, setting the stage for broader market movement in the days ahead.
Bitcoin Trade Setup Holds Firm Amid Quiet Weekend Price Action
Crypto analyst Michaël van de Poppe noted that his Bitcoin trade outlook remains unchanged. He pointed to a recurring seasonal pattern playing out in the market right now.
According to van de Poppe, the final weeks of the month tend to produce downward price pressure. The first weeks, however, tend to see upward movement return to the market.
Van de Poppe shared his view on X, stating the markets follow a pattern of “final weeks of the month — down only” and “first weeks of the month — up only.”
He added that a brief sweep at the start of June is possible before any upward move. This means traders should stay patient and wait for confirmation before entering. Because weekend movements were slim, none of his identified scenarios triggered a trade entry.
With no trade executed yet, van de Poppe’s strategy remains on the long side. He continues to monitor the setups he has already outlined for the coming sessions.
The lack of weekend volatility kept conditions subdued but did not change his overall bias. Traders following his analysis are advised to watch for triggers early in the new month.
The setup reflects a measured approach, relying on pattern recognition rather than reactive trading. Van de Poppe’s framework gives traders clear conditions to watch before committing to a position.
This disciplined method avoids chasing price moves that lack confirmation. It is a strategy well-suited to the current uncertain macro environment.
Bitcoin Dominance False Break Signals Potential Altcoin Season Ahead
Trader Tardigrade flagged a key development on the Bitcoin dominance weekly chart. He reported that BTC dominance printed a false break above a major overhead resistance level.
The price spiked above resistance, then rejected sharply and closed back below it. That type of price action is widely regarded as a bearish signal for dominance.
A false break above resistance traps buyers who entered too late on the breakout. Once price reverses, those trapped positions add selling pressure that pushes dominance lower.
When Bitcoin dominance falls, capital historically rotates from Bitcoin into altcoins. This rotation is the typical precursor to what markets call altseason.
Tardigrade stated clearly on X: “False breaks above resistance are classic bearish signals for dominance. They trap late buyers, then reverse hard.” He added that when BTC dominance drops, capital flows into altcoins.
His post concluded that the false break is now formed, calling it the setup that precedes an altcoin rally. The weekly candle close gave technical traders the confirmation they were waiting for.
Both analysts, though focused on different instruments, point toward a similar near-term outcome. A potential Bitcoin dip early in June could align with falling dominance and rising altcoin interest. Traders are now watching both setups in tandem as the new month begins.
TLDR:
- Google engineer Michele Spagnuolo allegedly used confidential data to profit $1.2M on Polymarket.
- Spagnuolo operated under the alias “AlphaRaccoon” and risked approximately $2.75M in total bets.
- The DOJ charged him with commodities fraud, wire fraud, and money laundering across three counts.
- Combined maximum sentencing across all three federal charges totals up to fifty years in prison.
The U.S. Department of Justice has charged Michele Spagnuolo, a Google software engineer, with commodities fraud, wire fraud, and money laundering.
Prosecutors allege he used confidential company data to place bets on Polymarket, a prediction market platform.
Operating under the alias “AlphaRaccoon,” Spagnuolo allegedly generated over $1.2 million in profits between October and December 2025, risking approximately $2.75 million in total wagers tied to nonpublic Google information.
Federal Authorities Allege Misuse of Internal Google Data
Spagnuolo, 36, is an Italian citizen currently residing in Switzerland. He held a software engineering role at Google that granted him access to internal data systems.
One tool he allegedly used displayed a “Google Confidential” banner in red text. He had also signed confidentiality and ethics agreements with the company.
Prosecutors say he created his Polymarket account in May 2024 under the name “AlphaRaccoon.” He then began accessing internal Google data before placing trades on the platform. The bets were reportedly tied directly to nonpublic information he accessed through his role.
The alleged trading activity ran from October 15 to December 4, 2025. Shortly after Google publicly announced the relevant information, the markets resolved in his favor. His account then collected profits exceeding $1.2 million from those resolved bets.
U.S. Attorney Jay Clayton addressed the case directly, stating that “today’s charges reinforce a decades-old message: corporate insiders cannot use confidential business information to turn a profit in our markets.”
He added that Spagnuolo violated duties owed to his employer and that “insider trading compromises the integrity of our markets.”
Charges Carry a Combined Maximum Sentence of 50 Years
Spagnuolo now faces three separate federal charges. The first is one count of violating the Commodity Exchange Act, carrying a maximum sentence of ten years. The second is one count of wire fraud, which carries up to twenty years in prison.
The third charge is money laundering, also carrying a maximum of twenty years. Together, the charges carry a combined maximum exposure of fifty years in federal prison. The actual sentence, however, will be determined by a judge.
FBI Assistant Director James C. Barnacle, Jr. stated that Spagnuolo “allegedly abused his elevated access to confidential trends to place bets with nonpublic information.”
He further confirmed that “the FBI remains dedicated to searching for fraudsters who betray their employer for personal financial gains.”
The case is being handled by the Office’s Securities and Commodities Fraud Task Force. Assistant U.S. Attorneys Thomas Burnett, Ryan B. Finkel, and Allison Nichols are leading the prosecution.
Spagnuolo was presented before U.S. Magistrate Judge Sarah Netburn in the Southern District of New York following the unsealing of the complaint.
TLDR:
- A one-of-one DVN configuration on the Kelp rsETH bridge created a single point of failure that attackers exploited.
- The attacker borrowed 82,650 WETH and 821 wstETH using 89,567 stolen rsETH across eight Aave V3 positions.
- DeFi United coordinated over $300 million in recovery commitments from Lido, Ethena, Mantle, and other contributors.
- Aave’s LayerZero OFT adapter was fully refilled across five tranches, restoring 116,131 rsETH backing in full.
The April 18, 2026 rsETH incident exposed a critical vulnerability in third-party bridge infrastructure connected to Aave’s markets.
A forged cross-chain message on the Kelp rsETH LayerZero V2 bridge released 116,500 rsETH on Ethereum without any matching burn on Unichain.
The attacker then used those tokens as collateral across Aave V3 positions. A coordinated recovery effort later restored full backing and returned all affected markets to normal.
The Bridge Vulnerability That Triggered the Exploit
The Kelp rsETH LayerZero V2 bridge from Unichain to Ethereum relied on a single verifier to sign all inbound cross-chain messages.
That configuration, known as a one-of-one Decentralized Verifier Network, created a single point of failure. When that verifier was targeted by an RPC-poisoning attack, the attacker manipulated its view of the source-chain state entirely.
At 17:35 UTC on April 18, the Ethereum endpoint accepted inbound nonce 308 and released 116,500 rsETH from the RSETH_OFTAdapter.
At that same moment, Unichain’s source endpoint still showed only outbound nonce 307. No burn had occurred on the source chain, yet the Ethereum side processed the message as legitimate.
The root cause was not a flaw in Aave’s smart contracts. Instead, it was the bridge’s reliance on a single verifier and that verifier’s susceptibility to external manipulation. That dependency sat entirely outside the Aave protocol.
How the Attacker Moved Through Aave’s Markets
Once the 116,500 rsETH was released, the attacker moved fast. The stolen tokens were dispersed across seven recipient addresses within minutes of the exploit. From there, 89,567 rsETH was deployed across eight Aave V3 positions on Ethereum Core and Arbitrum.
Against that collateral, the attacker borrowed 82,650 WETH and 821 wstETH. Health factors across the eight positions were kept between 1.01 and 1.03, just above liquidation thresholds. That positioning allowed the attacker to hold the borrowed assets while avoiding automatic liquidation.
Aave’s exposure came from rsETH being listed as collateral on its markets under standard overcollateralization terms. That listing created a direct dependency on the bridge’s verification path, infrastructure that Aave does not control.
The Immediate Containment Steps That Followed
The Aave Protocol Guardian responded within hours. By 19:00 UTC on April 18, rsETH and wrsETH were frozen across Aave V3, and LTV was set to zero.
On Aave V4, the Kelp Spoke was fully frozen across both WETH and rsETH reserves, and WETH borrowing on the Spoke was deactivated immediately.
Between 18:00 and 19:00 UTC, Kelp paused 43,373 rsETH connected to the exploit. That action prevented further movement of those specific tokens and limited additional damage during the early response window.
Over the following two days, additional protections were layered across the affected markets. WETH was frozen across Ethereum Core, Ethereum Prime, Arbitrum, Base, Mantle, and Linea on April 20.
The Arbitrum Security Council then froze 30,766 ETH linked to the attacker on April 21. By April 23, rsETH reserves were fully paused across multiple deployments, preserving the ability to liquidate attacker positions and recover assets for affected users.


Retail investing platforms have spent a number of years racing to become “everything apps” for finance, piling on stocks, crypto, banking and payments in a bid to keep users inside a single ecosystem.
But for moomoo, the next battle isn’t about who offers the most assets.
It’s about who gives retail investors the same level of intelligence and execution long reserved for Wall Street institutions.
“We want to democratize access to the best tools that have historically only been available to institutional investors,” Albi Mema, director of crypto operations at moomoo U.S., told CoinDesk in an interview. “A decade ago the issue was access. Now it’s the quality of access.”
“Moomoo is built for the retail investor who has outgrown basic trading apps. Today’s retail investors are more informed, more engaged, and more demanding than ever,” according to Mema. “They do not just want access to markets, they want better data, better tools, better education, and more context around the decisions they make,” he added.
Global platform
Moomoo is a global trading platform that offers retail investors access to stocks, options, exchange-traded funds (ETFs) and cryptocurrencies through a single app. The company focuses on combining low-cost trading with institutional-grade market data, analytics and investing tools for self-directed traders.
The New York-based firm, which says it has more than 30 million global users, $156 billion in client assets and nearly $1.9 trillion in annual trading volume, is betting that retail traders increasingly want sophisticated analytics, AI-assisted trading and institutional-style execution tools rather than simply another crypto venue.
That positioning comes as brokerages across both crypto and traditional finance push toward the “one-stop shop” model. Robinhood (HOOD), Kraken and Coinbase (COIN) have all expanded beyond their original products in recent years, blending equities, derivatives, payments and digital assets into broader financial platforms.
Mema argues moomoo’s differentiator is not aggregation alone, but the depth of tooling layered on top of it.
“The next generation of retail investors won’t be defined by who offers the most assets,” he said. “It will be about who helps investors make the best decisions across those assets.”
Retail traders
Retail investors are increasingly seeking institutional-grade analytics, execution capabilities, and AI-powered trading tools which drive trading assistance into the platform.
“Retail investors are building positions, measuring volatility and thinking long term,” he said. “They’re trading alongside some of the best and brightest.”
The company’s no-code algorithm builder allows users to scan markets for technical patterns, backtest strategies and automate trading signals.
Traders can also share strategies with the broader community, creating what Mema described as a collaborative “trading floor” dynamic for over 30 million retail participants.
Mema says retail crypto traders often experience significantly worse execution speeds and slippage than institutions, with some retail orders taking hundreds of milliseconds to settle compared with institutional systems that operate in tens of milliseconds or faster.
“If you’re getting rinsed on slippage, that puts you at a disadvantage as a crypto user,” he said. “We are bringing institutional-level execution to retail.”
The firm is also pushing deeper into tokenization. Moomoo recently joined Figure Markets’ onchain public securities initiative and partnered with Figure (FIGR) and BitGo (BTGO) on tokenized secondary market offerings.
“We think the future is hybrid. Traditional markets are not disappearing. Blockchain-native markets are not replacing everything tomorrow,” Mema says. “But the two are starting to converge, and platforms that can bridge those worlds responsibly will be well positioned,” he added.
Read more: Gemini taps SpaceXAI to build a personalized prediction markets feed

Key Takeaways
- Rocket Lab has evolved from a pure launch provider into a comprehensive space systems company with satellite production capabilities and government partnerships, earning 8 Buy and 4 Hold ratings from analysts
- AST SpaceMobile aims to deliver space-based cellular connectivity to standard mobile devices through strategic alliances with major carriers including AT&T and Verizon
- Redwire operates across multiple space infrastructure segments, providing satellite technology, manufacturing solutions, and engineering services to NASA and defense customers
- Each company maintains analyst consensus favoring buy recommendations, yet all three present significant risk profiles with ongoing losses
- Accelerating public and private sector investment in satellite technology, defense applications, and space-based systems continues fueling market enthusiasm
As the commercial space sector gains momentum, Rocket Lab, AST SpaceMobile, and Redwire have emerged as three closely monitored investment opportunities spanning satellite technology, national security, and orbital infrastructure development.
Rocket Lab: Evolving Into a Full-Spectrum Space Company
Rocket Lab has transformed from its origins as a launch services provider into a multifaceted space enterprise.
While the Electron launch vehicle remains central to operations, the organization has broadened its scope to encompass satellite production, integrated space systems, and substantial government contracting work. Wall Street increasingly recognizes the company as a comprehensive space infrastructure provider rather than merely a rocket manufacturer.
The firm maintains revenue streams from both private sector clients and federal agencies. This balanced customer portfolio has strengthened earnings predictability and drawn institutional capital.
Development continues on the Neutron vehicle, a larger-capacity rocket engineered for substantial payload requirements. Successful deployment would significantly expand the company’s addressable mission profile.
National security and defense appropriations have provided additional momentum. Current analyst sentiment reflects 8 Buy recommendations, 4 Hold positions, and zero Sell ratings.
AST SpaceMobile: Ambitious Vision Meets Execution Challenge
AST SpaceMobile ranks among the most discussed equities within the space investment landscape.
The enterprise is constructing a satellite constellation designed to provide cellular broadband service. The innovative approach enables standard smartphones to connect directly with orbital assets, eliminating ground-based infrastructure requirements.
Collaborations with telecommunications giants AT&T and Verizon underscore commercial validation. The company has been progressively launching satellites to validate technology and expand network coverage. These operational milestones have generated considerable market enthusiasm.
Share price volatility remains pronounced. Market participants respond aggressively to launch schedules, capital raises, and technical achievements. Critics highlight execution uncertainty and the substantial funding requirements necessary to complete the constellation.
Believers envision AST potentially operating among the planet’s most extensive space-based communications platforms. Analyst coverage shows 5 Buy ratings, 1 Hold, and no Sell recommendations.
Redwire: Infrastructure Provider Behind the Scenes
Redwire operates with less fanfare than Rocket Lab or AST SpaceMobile, yet has established meaningful traction across the space economy.
The organization specializes in satellite subsystems, orbital infrastructure, digital engineering platforms, and manufacturing capabilities for the space environment. Client relationships span NASA programs, military applications, and commercial space ventures.
This diversified business model reduces dependence on any single revenue source or mission category. Income generation flows from varied contracts across distinct segments of the space marketplace.
Analysts express measured optimism regarding the path to sustained profitability. Coverage currently stands at 4 Buy ratings, 2 Hold positions, and zero Sell recommendations.
Understanding the Risk Profile
None of these three companies currently generates net profits. Valuations depend heavily on projected growth trajectories and continuing success in contract acquisition.
Mission postponements, capital constraints, or contract losses can trigger sharp downward price movements. Prospective investors must acknowledge and accept substantial volatility.
Nevertheless, global government agencies and commercial entities continue expanding budgets allocated toward satellite systems, defense technologies, and space-based infrastructure, sustaining long-term sector demand fundamentals.

Bitcoin (BTC) is staging a technical rebound after testing a critical on-chain support zone tied to the realized price of coins held by short- to mid-term investors. The pop back toward the mid-$70,000s comes as the market eyes whether the 3–6 month realized price around $71,400 can act as a durable floor, potentially paving the way for a move back toward higher levels, including a suggested target near $78,200 and, in a more bullish scenario, a possible climb toward $100,000 by year-end.
Key takeaways:
- Bitcoin is eyeing a rebound toward $78,200, the realized price for BTC held 3–6 months, which could mark a pivotal turning point if breached.
- A sustained move above this cost basis could set the stage for a potential rally toward $100,000 by year-end, according to on-chain and technical readings.
- On-chain data place the 3–6 month realized price near $71,400, a level described by analysts as a strong near-term support that has historically underpinned medium-term conviction.
- Past breakouts above the 3–6 month cost basis have tended to precede stronger gains over longer horizons, though the near-term path remains constrained by a bear-flag pattern.
On-chain support under the microscope
Bitcoin’s weekend rebound was modest but notable, advancing roughly 2.5% to hover near the $74,000 mark after touching a local trough just above $72,500. The move reflects a familiar dynamic: a bounce from a price zone that coincides with the realized price of coins held for three to six months. This cohort is widely watched because it represents capital that has remained in the market long enough to reflect genuine medium-term conviction.
Glassnode’s analysis of realized prices across different aging cohorts shows that the 3–6 month group sits around $71,400. In a Sunday note, analyst Marcus Corvinus described this level as Bitcoin’s “strongest near-term support,” arguing that holders within this band may defend the area to avoid a broader pullback.
“This cohort is still holding profits, creating a strong incentive to defend the level,” Marcus Corvinus said in a Sunday post.
The near-term target around $78,200 aligns with the same 3–6 month realized price, a level sometimes invoked by traders as a gauge for the next phase of upside. The rationale is that regaining the cost basis of this cohort could restore confidence among holders who have been sitting on unrealized gains as BTC navigates a choppy macro environment. Analysts have pointed to the $78,200 mark as a potential hurdle that, once cleared, could reframe the path toward higher targets.
For perspective, this threshold sits not far from a historical point of reference: the time when BTC briefly cleared the 3–6 month realized price in previous cycles often preceded more extended periods of strength. A prior technical breakdown that saw BTC slice through the $78,000 area in October 2025 is cited in market commentary as a reminder that structure and price discipline often dictate the next leg of the journey.
In addition to the on-chain picture, recent coverage from Cointelegraph has highlighted the significance of this level within broader narratives around reclaiming psychological milestones, including the idea that BTC does not necessarily require a fresh narrative to retake $100,000, a view echoed by several analysts this year.
What the numbers imply for upside potential
Beyond the immediate price action, the signal from the 3–6 month realized-price breakouts has, historically, translated into meaningful upside over longer horizons. Data points compiled by Glassnode suggest a pattern: after similar breakouts, BTC has averaged a 2.3% gain over the next 30 days, a 21.9% gain after 90 days, and roughly a 36.6% gain after six months. While past performance does not guarantee future results, the sequence underscores how on-chain dynamics around holder cost bases can foreshadow multi-week to multi-month cycles of upside.
Applying this framework to Bitcoin’s current setup, the implication is that a sustained move above $71,400 and then $78,200 could imply a broader re-rating of prices over the coming months. With Bitcoin hovering near $74,000, even moderate alignment with these historical patterns would translate into notable upside over the next several weeks to months.
Yet the market is navigating a delicate balance. The analyst view is that the signal is strongest when the price sits above the 3–6 month realized price and remains above it for a meaningful period, confirming a shift in holder sentiment. In practice, that means watching not just the level itself but the price action around it—especially as a dynamic bear-flag pattern develops on the daily chart.
Bear flag reality checks: upside capped or vulnerable to a deeper decline?
On the technical side, Bitcoin’s rebound is taking place near the bear-flag’s lower boundary, a configuration that has become a point of cautious optimism for bulls but also a source of downside risk if the pattern fails.
The bear flag formed after BTC’s retreat from the late-2026 highs around $98,000. The price is now testing the rising support line associated with the flag, with the upper boundary near $90,000 serving as a nearby probe for bulls. If price can sustain a move toward that upper limit, the chart would align with a bullish reversion scenario in the months ahead.
Analysts point out that the $90,000 zone sits at a confluence of technical factors, including proximity to the 0.786 Fibonacci retracement level and the 3–6 month holder cost basis. A successful push past the flag’s upper boundary could renew momentum toward higher targets, while any daily close below the lower trend line would rekindle bearish pressure and leave a path toward a much deeper pullback—potentially into the $50,000–$60,000 range, depending on the exact breakdown point and the market’s reaction to it.
In this context, the balance of probabilities favors careful risk management. The scenario that holds the line at or above the lower boundary and pushes toward or through $90,000 would imply a meaningful shift in sentiment, especially if on-chain indicators confirm sustained demand among holders who benefited from the recent bounce. Conversely, a decisive break lower would reframe the narrative around the durability of on-chain support levels and could signal a renewed phase of volatility as traders reassess risk exposure.
Market observers are also watching how macro factors—rates, liquidity conditions, and risk appetite—interact with this on-chain signal. While the analytics point to a potentially constructive path if fundamentals align, the immediate horizon remains sensitive to trend-line dynamics and the price’s ability to defend the current support area.
For readers seeking a cross-check on the latest thinking, Cointelegraph’s coverage in related pieces has highlighted that patience and clarity around price action, rather than chasing a single target, may define the next phase for Bitcoin. In particular, analyses discussing whether a fresh narrative is necessary to reclaim $100,000 have noted that existing on-chain and technical signals can be sufficient to sustain a longer-term uptrend if they cohere with favorable market conditions.
What to watch next: the day-to-day price action around the $71,400–$78,200 zone will be telling. A clear close above $78,200 would strengthen the case for a continued rally toward the $90,000–$100,000 region, while a sustained break below the lower bear-flag line would raise the odds of a deeper retracement toward the $50,000–$60,000 area. Traders and investors should monitor on-chain metrics, especially the behavior of the 3–6 month cohort, and remain mindful of the broader macro backdrop that could amplify or dampen the next phase of BTC’s trajectory.
As outlined in recent market notes, the path forward remains nuanced. The indicator suite suggests a potential for upside, but the bear-flag framework keeps downside risk in play. The coming weeks should reveal whether on-chain support can translate into a durable uptrend or if the market will test lower levels before finding a more convincing leg higher.
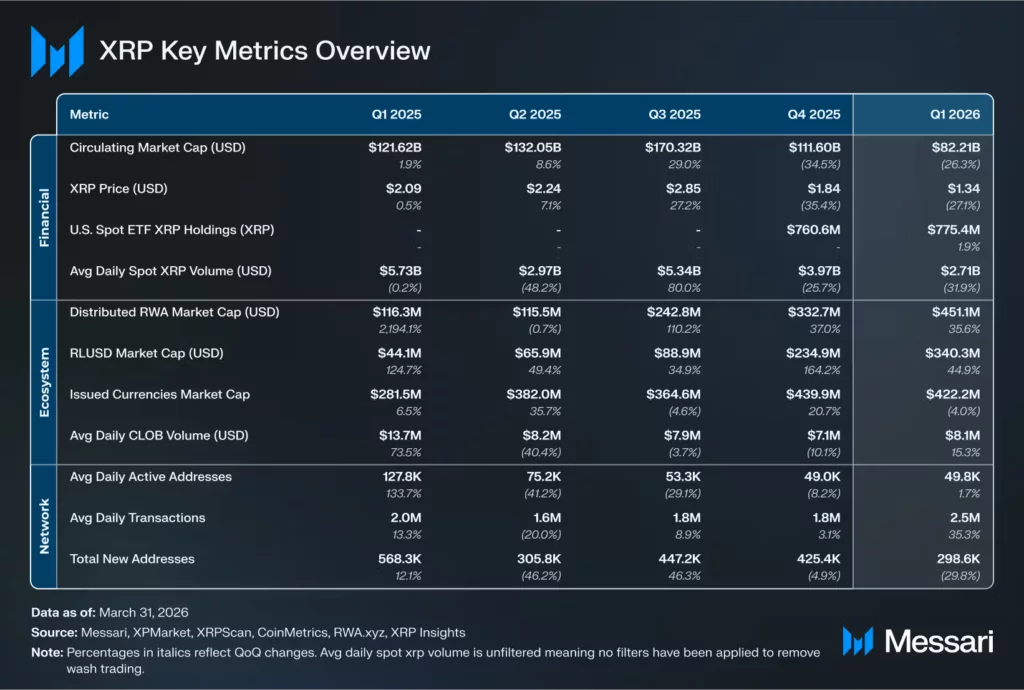
XRP had a weak start to 2026 from a market view, but activity on the XRP Ledger rose sharply during the same period, according to Messari’s State of XRP Q1 2026 report.
Summary
- XRP price fell 27% in Q1, but XRPL daily transactions rose 35.3% to 2.48 million.
- RLUSD reached $340.3 million on XRPL, making it the network’s largest stablecoin by quarter-end.
- XRPL’s RWA market cap jumped 124.1% QoQ to $2.25 billion, reaching a new quarterly high.
XRP price fell as trading cooled
Messari said XRP ended Q1 as the fourth-largest non-stablecoin crypto asset by market value, behind Bitcoin, Ethereum and BNB. Even so, the token followed the wider market lower during the quarter.
XRP’s market cap fell 26.3% quarter-over-quarter to $82.21 billion. Its price also dropped 27.1% to $1.34, while circulating supply rose 1.1% to 61.34 billion XRP.
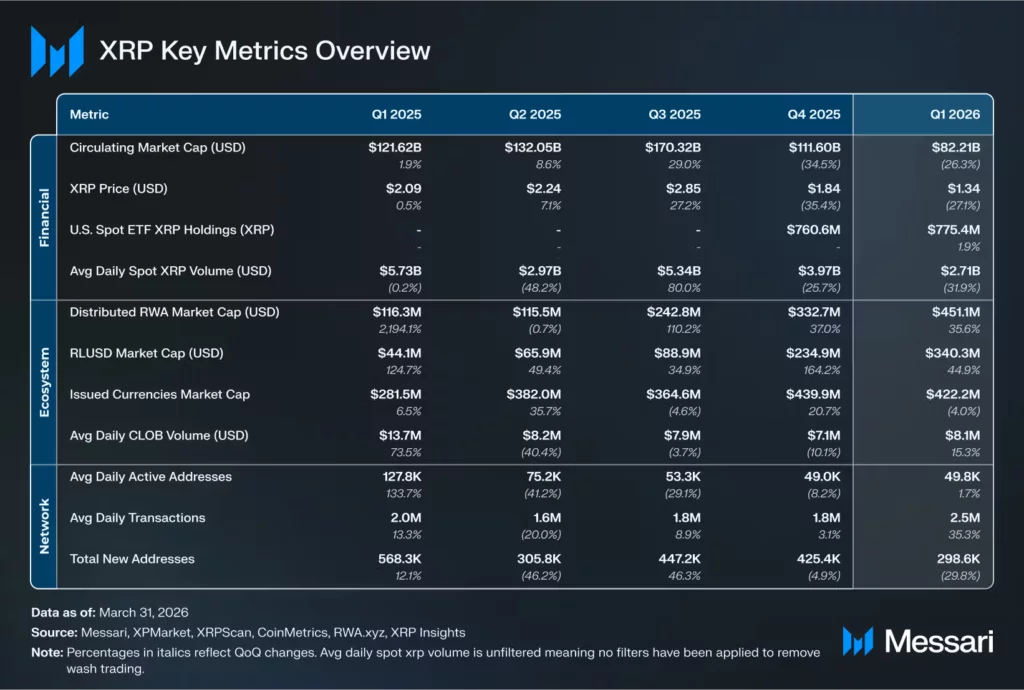
Trading activity also slowed. Messari said average daily spot volume fell 32%, while perpetual futures volume declined 28.6% during the quarter.
The report said U.S. spot XRP ETFs ended Q1 holding 775.4 million XRP. That represented 1.26% of circulating supply and was up 1.9% from the previous quarter.
XRPL transactions moved higher
While XRP price weakened, network activity moved in the opposite direction. Messari said average daily transactions on the XRP Ledger increased 35.3% quarter-over-quarter.
Daily transactions rose from 1.83 million to 2.48 million. The increase suggests that XRPL usage expanded even as token price and trading activity cooled.
The report tied that growth to the network’s wider feature set. XRPL continues to support payments, token issuance, decentralized liquidity, real-world assets and stablecoins.
Messari also noted that XRP remains tied to network use through transaction fees, account reserves, liquidity, asset ownership and bridging across currencies.
RLUSD and tokenized assets lead growth
Ripple’s RLUSD stablecoin grew during the quarter. Messari said RLUSD closed Q1 with a $340.3 million market cap on XRPL, up 44.9% quarter-over-quarter.
That made RLUSD the largest stablecoin on the XRP Ledger. The report also said RLUSD had more holders on XRPL than Ethereum by quarter-end, although Ethereum still handled larger transfer volume.
XRPL’s real-world asset market cap also rose sharply. Messari said RWA market cap on the network climbed 124.1% quarter-over-quarter to $2.25 billion.
The growth pushed XRPL into the top group of public blockchains for tokenized assets. The report said the network ranked seventh by RWA market cap at the end of Q1 and fourth by the time of publication.
Institutional finance tools expand
Messari said new institutional finance tools also moved forward during the quarter. Permissioned Domains, Permissioned DEX and Token Escrow went live on XRPL.
Native lending and asset vault features remained in voting. If approved, those tools could support lending, borrowing and more structured use of XRP and other assets on the network.
As previously reported by crypto.news, Morgan Stanley recently disclosed small positions in two XRP-focused ETFs. XRP funds also attracted $85.8 million in inflows over three weeks, showing continued demand through regulated products.
Separate coverage has also noted a key market tension. RLUSD can help grow XRPL usage, but stablecoin settlement does not always create the same direct demand for XRP as a bridge asset.
Messari said its report was commissioned by Ripple, while Messari retained editorial control. The report still shows a clear Q1 split: XRP price and trading activity fell, while XRPL transactions, RLUSD adoption and tokenized asset growth moved higher.

Trump fires Iran deal back with ‘tougher peace terms’ and says he’s in no hurry to end war

Best Cryptos to Purchase Right Now Prior to the Next Bull Run

Gervonta Davis offered fast track to another world title under one condition

Steven Gerrard disagrees with Gary Neville over ‘shock’ Chelsea and Arsenal claim | Football

US brings back mandatory military draft registration

Register Renaming | Hackaday

Stock Market Will RISE in June 2026 | Vedic Financial Astrology Prediction

When The Customer Thinks It’s An Open Bar #bartender #customer #money #shorts

Lyn Alden :”A TSUNAMI Is Coming For Bitcoin & Ethereum” | 2026 Crypto Prediction
-

 Business7 days ago
NYT Strands Answers May 24 2026 Revealed for Puzzle No. 812 Theme Summer Essentials
-

 NewsBeat4 days ago
Israel says it has killed new Hamas military leader in Gaza City airstrikes
-

 Tech4 days ago
NASA taps Blue Origin to deliver lunar rovers for Moon Base initiative
-

 Politics6 days ago
Bridgerton Season 5: Cast, Release Date And Everything We Know So Far
-

 Sports6 days ago
2026 NBA Finals schedule, odds: Knicks await Thunder or Spurs after winning East
-

 News Videos5 days ago
XRP *JUST* SUCCEEDED!!!! CLARITY ACT EXPOSED!!! (SHE EXPOSED IT)
-
Crypto World5 days ago
Micron Crosses $1 Trillion Market Cap as AI Demand Reshapes Memory Sector
-
Crypto World7 days ago
Brian Armstrong Outlines Crypto Vision for the Future Financial System
-

 Business5 days ago
Selena Gomez Reportedly Upset Over Benny Blanco’s Comments on Her ‘Terrible’ Diet
-

 News Videos2 days ago
This is BROKEN! INSANE 5x MONEY CAR WASH WEEK! The NEW GTA Online UPDATE Today! (GTA5 New Update)
-

 Business6 days ago
BTS Sells Out Four Las Vegas Shows at Allegiant Stadium for ARIRANG World Tour
-
 Tech6 days ago
China assigns ID codes to 28,000+ humanoid robots
-
 NewsBeat6 days ago
Hottest May day ever as London hits 34.8C in 2C leap from previous records
-

 Tech6 days ago
Microsoft’s quiet Claude Code retreat and the real cost of enterprise AI
-

 Tech3 days ago
Waymo dominates autonomous vehicle registrations as Tesla trails behind
-

 Business6 days ago
Nikkei 225 Surges Past 65,000 for First Time as Iran Peace Hopes Fuel Record Rally
-
Tech4 days ago
The Samsung pay deal is the moment Korean unions changed register
-

 NewsBeat6 days ago
Crowds find riverside shade in York as temperatures soar
-

 Tech6 days ago
Westone Audio and Etymotic Acquired by Fidelity Collective in Major IEM Market Move
-
 Entertainment6 days ago
‘Breaking Bad’ Star’s Easy-to-Binge 6-Part Crime Series Spin-Off Is Finally Heading to Free Streaming
You must be logged in to post a comment Login