

Crypto World
Stellar Lumens (XLM) Momentum Strengthens After Key Trendline Break


TLDR:
- Stellar Lumens (XLM) breaks multi-year trendline as weekly structure shifts into bullish phase.
- RSI rises above long-term resistance, confirming momentum alignment with the price breakout move.
- Key support at 0.2263 and resistance at 0.2730 define XLM’s short-term trading range.
- MACD strength and overbought RSI signal volatility risk after a sharp weekly rally expansion.
Stellar Lumens (XLM) is showing a notable shift in market structure after breaking a multi-year resistance trendline, as traders reassess momentum, volatility, and key price levels shaping its short-term and long-term direction across broader crypto market conditions today phase unfolding
Breakout Structure and Trendline Reversal
Stellar Lumens (XLM) has confirmed a breakout above its long-standing descending trendline on the weekly chart, marking a structural shift that traders have monitored across multiple market cycles.
The move follows repeated rejection phases where the price failed to sustain gains under persistent seller pressure at the same resistance zone.
Recent weekly candles show stronger bullish engagement, supported by volume expansion that suggests absorption of supply near critical levels.
RSI movement above multi-year resistance further confirms momentum alignment, as the indicator approaches mid-to-overbought territory while price holds structure.
Market structure now reflects a transition from prolonged accumulation into early markup conditions across higher timeframes.
Traders note that the breakout zone has acted as a multi-year ceiling, where liquidity has repeatedly concentrated during prior rejection phases.
With the trendline now breached, attention shifts toward whether the price can maintain weekly closes above this level without reversal pressure.
Volume data across exchanges reflects increasing participation, suggesting that buyers are gradually gaining control in the current structure.
Earlier consolidation near lower support zones created a base that has supported the recent upward expansion. Market participants are monitoring whether momentum can extend beyond historical resistance without losing weekly structure integrity.
Volatility Expansion and Key Price Levels
Following the breakout, Stellar Lumens (XLM) experienced sharp volatility, with intraday movements reflecting rapid shifts in sentiment.
Price action showed a 17 percent correction after a strong weekly rally that previously pushed momentum to new highs.
Despite the pullback, weekly performance remained positive, supported by elevated trading volume across major exchanges. Support at 0.2263 has become a key level, with traders closely watching for sustained defense of this zone.
Resistance near 0.2730 defines the upper boundary of the current short-term trading range. If price breaks above resistance, momentum could extend toward higher targets established on prior chart structures.
Conversely, failure to hold support may expose lower demand zones that previously absorbed selling pressure. MACD indicators have turned positive, showing early signs of trend strengthening on daily timeframes.
At the same time, RSI has moved above 70, placing Stellar Lumens (XLM) in overbought conditions. Such readings often align with heightened volatility and potential consolidation phases in the near term.


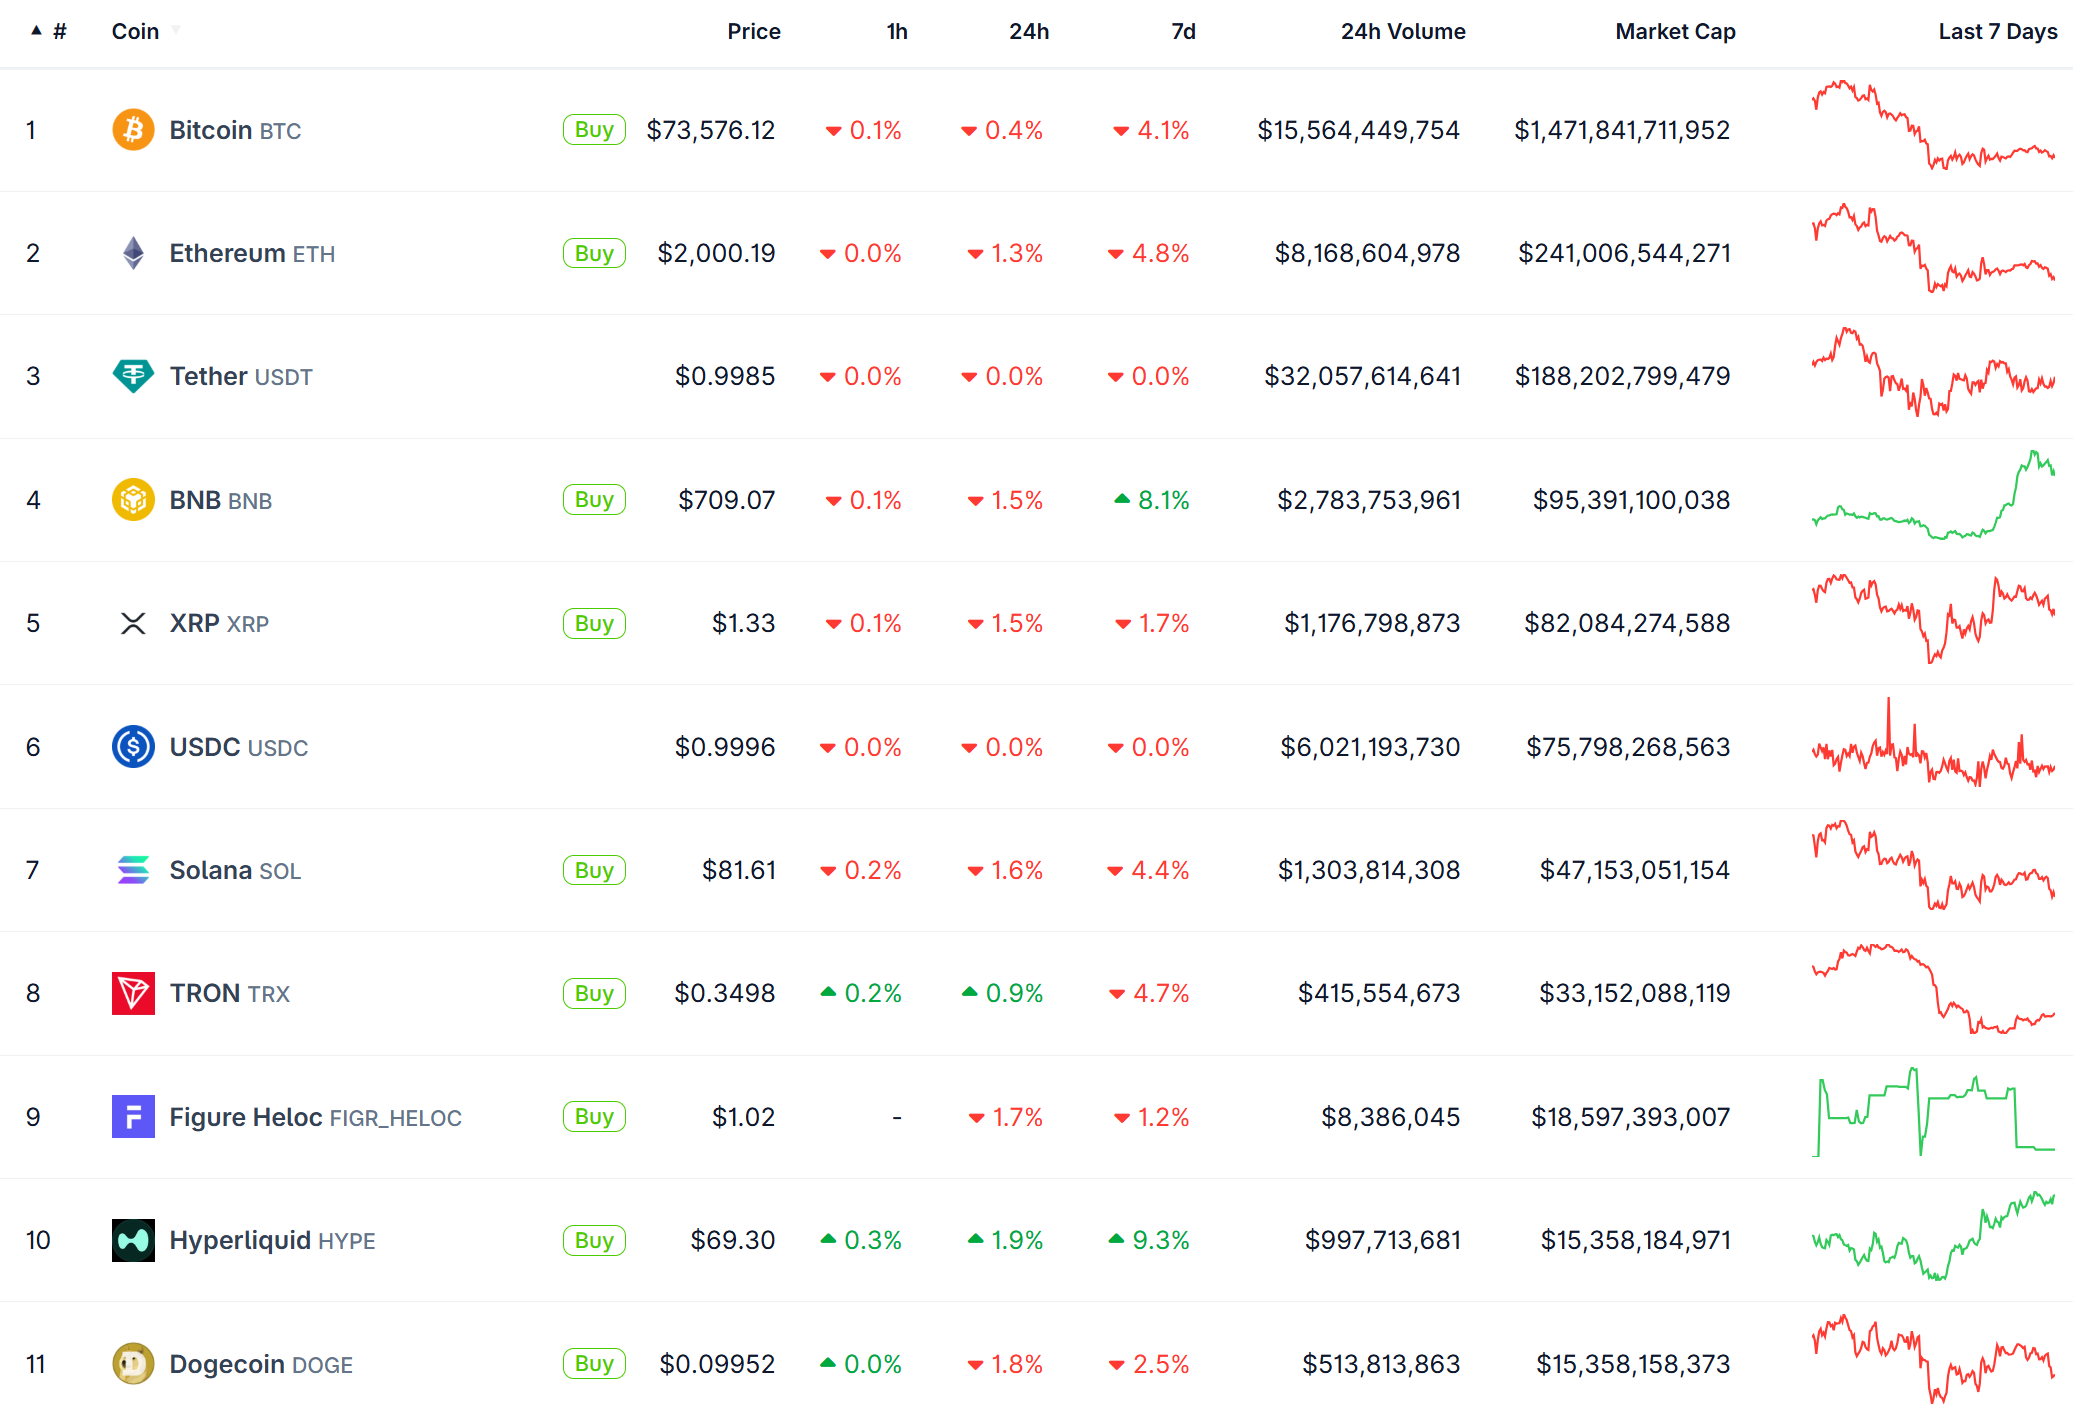
Hyperliquid’s HYPE token has officially surpassed Dogecoin in market capitalization, securing a top-10 spot and marking a major victory for utility-driven assets over meme coins.
As of late May 2026, HYPE trades around $69, with a market cap hovering near $15.4 billion to $17 billion depending on intraday moves, briefly pushing it as high as #9. Dogecoin sits just behind at #11 with a nearly identical valuation.

HYPE Flips DOGE: Hyperliquid Enters Top 10 Crypto by Market Cap
Hyperliquid operates a high-performance Layer-1 blockchain optimized for decentralized perpetual futures and spot trading.
It delivers sub-second finality, an on-chain central limit order book, and gasless trading, rivaling centralized exchange speed while remaining fully decentralized.
The platform has processed trillions in cumulative volume and generated over $1.16 billion in revenue since launch.
Nearly all trading fees flow into an Assistance Fund for continuous HYPE buybacks and burns, creating powerful token value accrual.
Recent catalysts include CFTC approval for regulated U.S. perps, inflows into spot ETFs like Bitwise’s BHYP, and strong user growth exceeding 2 million addresses.
Unlike pure meme coins driven by sentiment, HYPE benefits from real usage metrics: daily volumes often exceeding $1 billion, high open interest, and a deflationary mechanism tied directly to platform success.
Experts note this shift highlights 2026’s preference for tokens with clear revenue streams and on-chain utility. HYPE’s 7-day performance shows strong green momentum, contrasting DOGE’s relative stagnation.
With HyperEVM expanding the ecosystem for broader DeFi applications and ongoing buyback programs, analysts watch for sustained momentum.
Key milestones ahead include further ETF developments, potential governance proposals, and continued competition in the derivatives sector.
This milestone reflects a maturing crypto market where product-market fit and cash flow increasingly determine rankings.
Follow us on X to get the latest news as it happens
The post HYPE Flips DOGE: Hyperliquid Cracks Top 10 Crypto As Price Nears $70 appeared first on BeInCrypto.
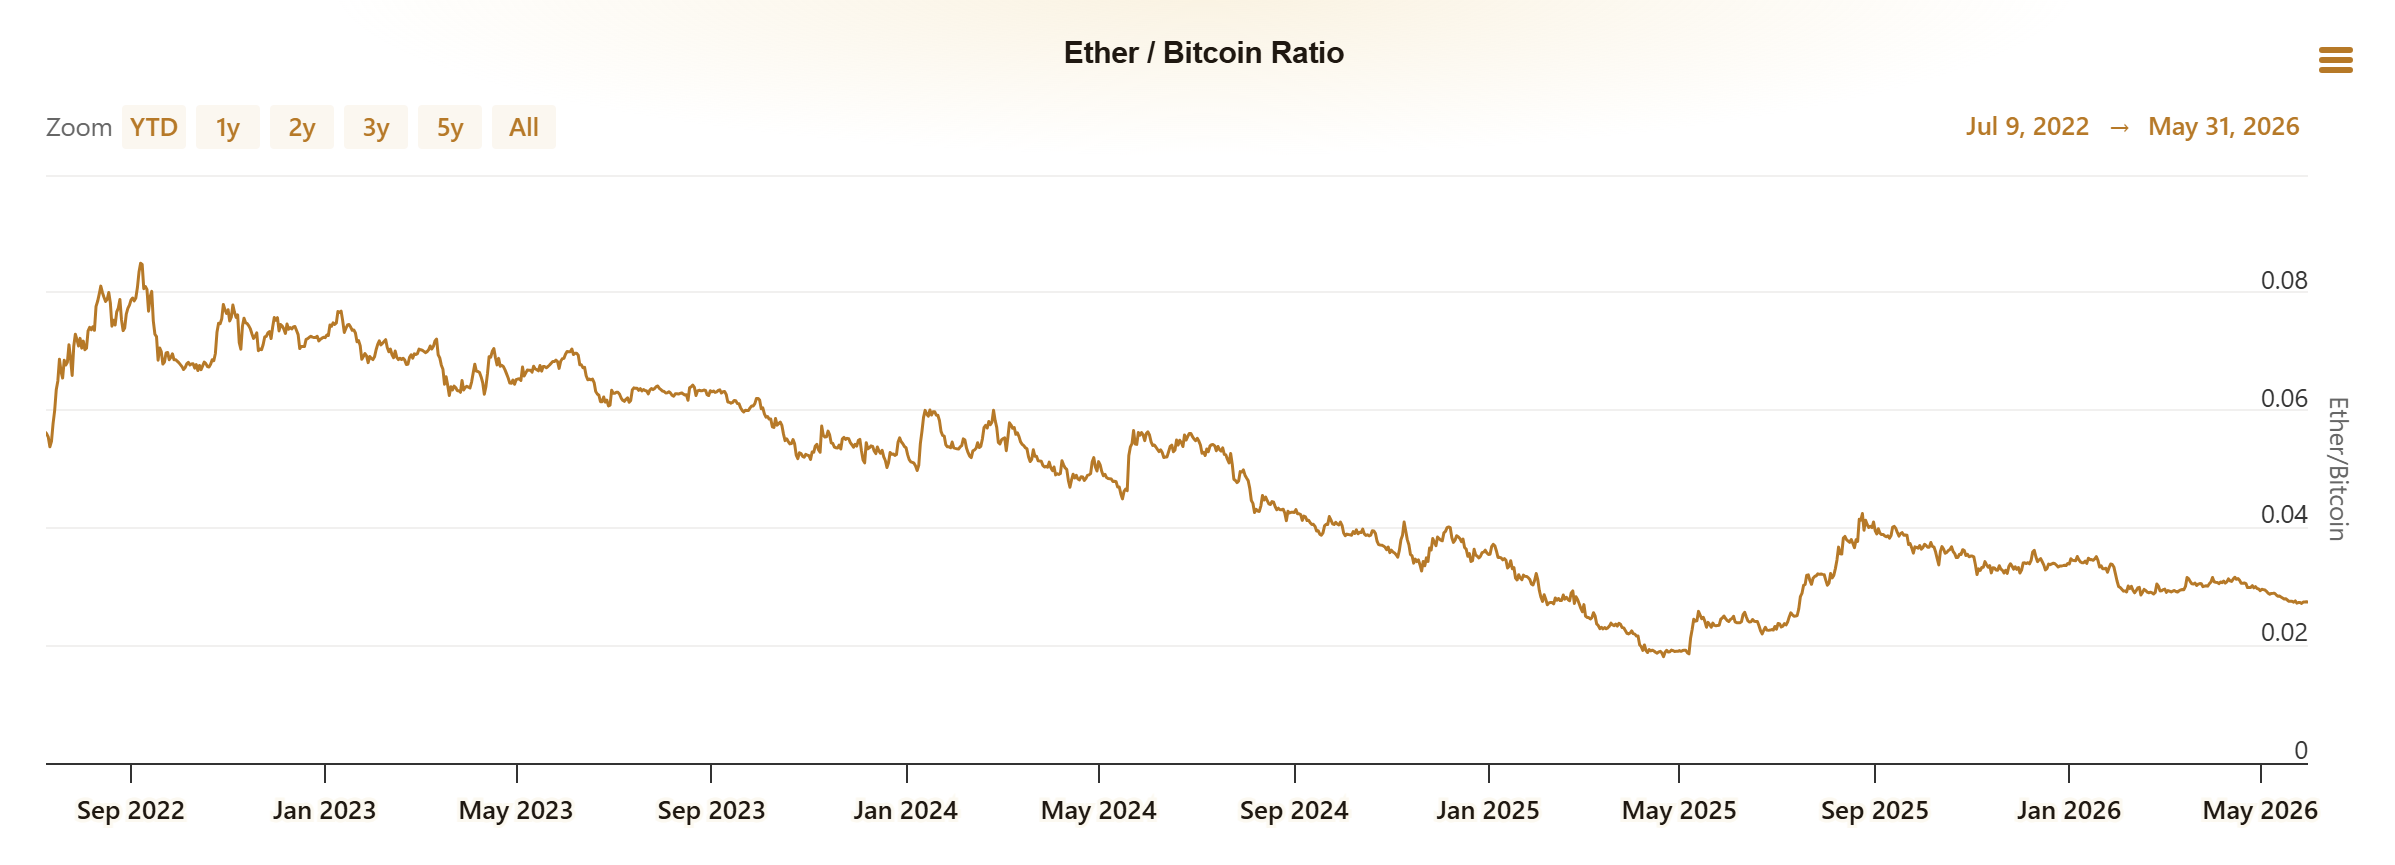
A pointed critique from inside Ethereum’s developer ranks argues that ether’s 65% slide against Bitcoin (BTC) since the Merge stems from specific execution failures at the Ethereum Foundation, not from broad market cycles or coordination problems.
Reid, an ICO-era participant who still builds on Ethereum (ETH), published the indictment, framing the underperformance as accumulated execution debt with names, dates, and missed product calls.
A 65% Drop With Names Attached
Reid’s central data point lines up with public market data. The ETH/BTC ratio peaked near 0.085 around the Merge in September 2022.
It has fallen to roughly 0.028 by late May, capturing ether’s underperformance against Bitcoin. Ether currently trades below $2,000, down 21% over the past year.

Reid rejects Bankless co-founder David Hoffman’s framing of ether’s “deserved cap” as a noble ceiling. He argues the cap sits lower than bulls expected, for reasons with names and dates rather than coordination theory.
Reid covers credit and real-world assets at firms including Figure and Securitize, and discloses he is still long ether.
ESG Marketing and a Missing Staking Interface
Reid argues the Merge’s 99.95% energy-reduction message answered questions capital allocators never asked.
Institutions wanted yield, developers wanted finality, and users wanted cheaper transactions. Solana sold raw speed during the same window.
Proof-of-stake sat on the roadmap from 2015 and took seven years to ship. Solana launched mainnet beta in March 2020 and shipped wallets, decentralized exchanges, and money markets while Ethereum debated specs.
Vitalik Buterin’s writing through 2024 and 2025 shifted from Casper specs toward pluralism and network states.
Reid reads that tone as an established Ethereum cultural posture rather than an active competitive one.
The smoking gun, in Reid’s read, is the absence of a first-party staking app three years after the Merge.
The official path still requires running a validator with at least 32 ETH. Most users route through Lido, which holds about 24% of staked ETH despite repeated centralization warnings from developers.
“‘We don’t pick winners’ is what an organization says when it does not want to compete,” Reid remarked.
Follow us on X to get the latest news as it happens
Rollups as Managed Decline
The rollup-centric roadmap drained the base layer. EIP-4844 went live in March 2024 and pushed blob fees near 1 wei through most of 2024 and 2025.
Ethereum’s quarterly transaction fee revenue has fallen roughly 95% from a Q4 2021 peak of $4.3 billion.

Arbitrum has marketed 90% to 98% operating margins on its L2s. Base captured close to 70% of rollup profits by mid-2025.
Every major L2 issued its own token, fragmenting capital flows inside the ecosystem.
Reid contrasts this with Solana’s integrated L1, which has shown fee capture accruing directly to its native token.
The remaining question is whether Foundation product cadence shifts. The ETH/BTC ratio’s path through the rest of the cycle will reflect the answer.
The post Insider Reveals Real Reason Ethereum Is Down 65% vs Bitcoin Since The Merge appeared first on BeInCrypto.
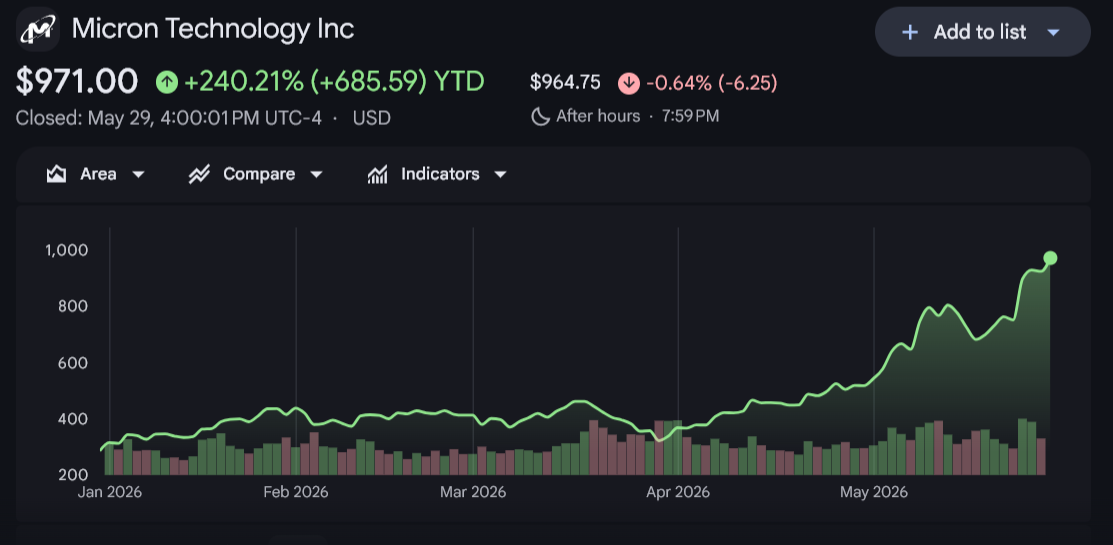
Micron Technology surged to a record high on May 26, jumping nearly 23% intraday before closing up more than 19% at $895.88. The rally briefly pushed the company’s market capitalization above $1 trillion, marking a milestone that places Micron among the largest technology firms globally.
In overnight trading, shares extended gains toward $920 as momentum continued.
The explosive move was fueled by two major catalysts: accelerating AI memory demand and an aggressive price target upgrade from UBS. With MU now trading at historically elevated levels, the key question for investors is whether the rally represents the early stages of a structural re-rating or a short-term momentum surge.

AI Memory Boom Reshapes Micron’s Outlook
Micron’s rally reflects the broader expansion of artificial intelligence infrastructure, which continues to reshape the semiconductor sector.
AI model training and inference require enormous volumes of high-performance memory, particularly advanced DRAM and high-bandwidth memory solutions.
Supply constraints across the industry have tightened pricing power for leading memory producers. Micron sits at the center of this cycle as one of the few global players capable of delivering advanced memory at scale.
The company recently began full-scale operations at its new $2 billion manufacturing facility in Manassas, Virginia, producing 1-alpha DRAM. The site strengthens domestic US memory production and supports critical sectors such as aerospace, defense, automotive, industrial systems, and healthcare.
Management has framed this expansion as part of a broader $200 billion long-term investment strategy to reinforce domestic semiconductor manufacturing capacity.
Chairman and CEO Sanjay Mehrotra described the facility as a strategic milestone in securing advanced memory production within the United States while supporting long-lifecycle enterprise customers.
UBS Price Target Adds Fuel to the Rally
Investor enthusiasm intensified after UBS raised its price target on Micron to $1,625 from $535, representing one of the most aggressive analyst revisions in the semiconductor space this year.
The new target implies roughly 80% upside from recent levels. UBS analyst Timothy Arcuri expects AI-driven memory shortages to persist through at least the second quarter of 2028. Prolonged supply tightness would strengthen Micron’s pricing power and potentially stabilize historically volatile earnings cycles.
UBS also projects Micron could generate more than $100 per share in annual profits between 2027 and 2029 if current industry conditions persist. That outlook significantly reshapes long-term valuation assumptions.
The upgrade triggered broader gains across semiconductor stocks and reinforced the narrative that memory producers are becoming primary beneficiaries of AI infrastructure spending, alongside GPU manufacturers.
Financial Performance Reflects AI Cycle Acceleration
Micron’s recent financial results already reflect this structural shift. In the quarter ended February 26, revenue reached $24 billion, nearly tripling year over year. Adjusted net income surged almost eightfold to $14 billion, driven by improved pricing and AI-related demand strength.
Stock performance has mirrored that momentum. Shares are up more than 200% year to date and have gained over 800% in the past 12 months, dramatically outperforming the broader S&P 500.
Such rapid appreciation, however, raises questions about sustainability. Markets now price in continued supply shortages, stable margins, and durable AI demand. Any moderation in those assumptions could introduce volatility.
Technical Outlook: Elevated but Supported
After its sharp breakout, MU is entering a potential consolidation phase. Parabolic moves often lead to short-term cooling before continuation. If the stock holds above recent breakout levels near $870–$890, the broader bullish structure remains intact.
However, extended rallies can produce profit-taking as momentum indicators approach overbought territory. Traders will monitor whether volume remains elevated during pullbacks, as strong volume support would reinforce institutional participation.
The broader semiconductor ETF strength suggests sector-wide momentum remains supportive, reducing the probability of isolated weakness.
The post Micron Stock Forecast: Can MU Sustain Its AI-Driven Breakout After Record High? appeared first on BeInCrypto.
Strategy chairman Michael Saylor on Sunday signaled the Bitcoin treasury company would be announcing fresh purchases of the cryptocurrency in the coming days.
The social media post comes just days ahead of a proxy vote that depends in large part on retailer shareholders to enable semi-monthly dividend payouts on the company’s STRC perpetual preferred stock.
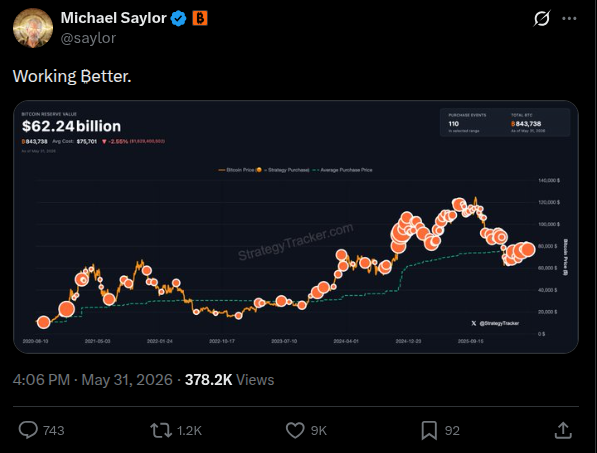
“Working Better” was Saylor’s tweet late Sunday morning to accompany a bubble chart tracking Strategy’s Bitcoin (BTC) purchases over the past nearly six years. That chart, from Iceland-registered StrategyTracker.com, has been consistently posted by Saylor in the days ahead of news of a purchase by the biggest publicly traded Bitcoin holder.
To be sure, any purchases to be announced will likely reflect the company bought at or below the average cost of previous BTC purchases. While, the average cost of Strategy’s 843,738 Bitcoin is $75,701 apiece, the biggest cryptocurrency by market cap has lost 3.65% of its value during May and was trading at about $73,566 at the time of publication, according to CoinMarketCap data.
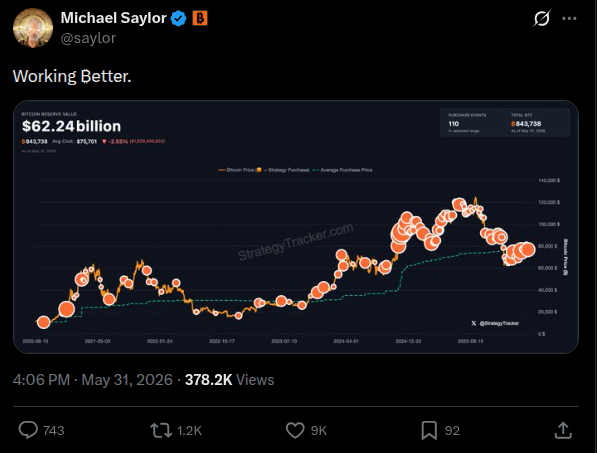
“Working Better” tweet. Source: Michael Saylor
Blockstream CEO Adam Back highlighted on Sunday that BTC’s 200-week moving average has pushed far above the $61,000 mark. That moving average is seen by some technical investors as a signal of a long-term upward price trend.
Related: Strategy situation ‘out of hand,’ says Arca exec on $15B preferred stock burden
Retail investors get pressed to vote on STRC dividend change
Strategy is proposing to pay semi-monthly dividends on STRC, instead of monthly. The company claims that if approved and adopted, it will lead to reduced reinvestment lag, enhanced liquidity, market efficiency and increased price stability.
Just days ahead of the June 7 proxy vote deadline, Saylor and Strategy are making a full press to get retail shareholders to return their proxy votes. On an internal company channel, Strategy’s investor relations team posted a message to all employees concerning the company’s 2026 annual meeting and provided links to the proposals under consideration by shareholders.

Part of message to Strategy employees from internal website. Source: Company filing on Edgar
“The amendment for STRC to pay semi-monthly dividends, needs 50% of all 85M shares outstanding as of April 17, 2026, to pass, which means every single vote counts,” read a May 28 post on Strategy’s verified feed on X.com.
CEO Phong Le posted a video a day earlier thanking STRC shareholders for their trust. “I wanted to personally walk you through the proposed amendment and what it means for you,” he said as an introduction to the minute-and-a-half video.
Retail investors have shown limited interest in casting proxy votes. A November research note from The Harvard Law School Forum on Corporate Governance revealed data that showed retail investors have consistently voted only about 29% of their owned shares during the past five proxy voting seasons. Institutional holders have voted about 77%.
Magazine: Guide to the top and emerging global crypto hubs — Mid-2026
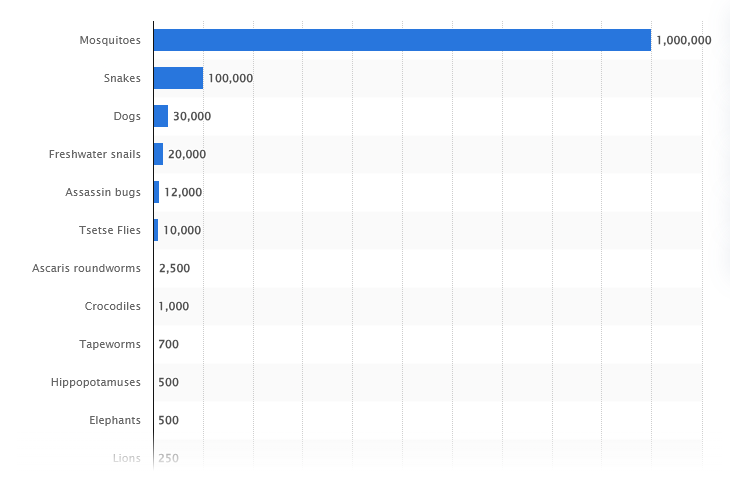
Google’s Debug initiative has asked the US Environmental Protection Agency to approve the release of up to 32 million Wolbachia-treated male mosquitoes in Florida over two years.
The proposal sits under EPA docket EPA-HQ-OPP-2025-3951. The public comment period closes on June 5, after which the agency will decide whether to approve, deny, or place conditions on the test.
The application is part of a wider experimental-use request from Google LLC. It also includes a similar release plan for California.
In Florida, Google proposes releasing up to 16 million male mosquitoes in the first year and another 16 million in the second year. California would see the same maximum release volume under the same application.

What Google’s EPA Filing Covers
The EPA notice identifies the mosquitoes as male Culex quinquefasciatus carrying Wolbachia pipientis wAlbB.
Culex quinquefasciatus, often called the southern house mosquito, is linked to the spread of mosquito-borne diseases, including West Nile virus.
The Florida test would help Google collect field data for a possible future product registration under federal pesticide law.
The word “pesticide” can sound confusing here. In this case, the EPA is reviewing Wolbachia as a biological control method because it is being used to suppress a pest population.
That makes the proposal a regulated field test, even though it does not involve conventional chemical spraying.
How Debug’s Wolbachia Technology Works
Debug uses male mosquitoes carrying Wolbachia, a bacterium found naturally in many insect species.
When these treated males mate with wild females that do not carry the same Wolbachia strain, the resulting eggs do not hatch. Repeated releases can gradually reduce the local mosquito population.
Only male mosquitoes are released. That matters because male mosquitoes do not bite or spread disease.
The difficult part is sorting males from females on an industrial scale. Debug uses artificial intelligence and automation to separate mosquitoes by sex, rear them in large numbers, and release them across target areas.
This is where Google’s role becomes important. The project depends on software, robotics, AI-based sorting, and field logistics, not just mosquito biology.
The Idea Has a Real-World Example in Singapore
Debug’s strongest real-world reference point is Singapore.
Since 2018, Debug has worked with Singapore’s National Environment Agency on Project Wolbachia. The program uses Wolbachia-carrying male mosquitoes to suppress Aedes aegypti, the main dengue vector in Singapore.
Singapore’s results have been significant. Official program data show 80% to 90% suppression of Aedes aegypti populations in treated areas and more than 70% lower dengue risk among residents after sustained releases.
Debug has also expanded its Singapore site into its first international research and development hub. The facility now supports AI-based sex sorting, robotics, and large-scale mosquito production.
The company says more than 10 million male Wolbachia mosquitoes are now released weekly in Singapore.
AI is Moving into Public Health Field Work
The Florida application also shows how AI is moving beyond software products and into biological field operations.
Debug’s system uses AI to solve a practical bottleneck: sorting mosquitoes accurately and quickly enough for mass release. Without that, Wolbachia programs cannot scale safely.
Automation also helps with consistency. Large mosquito-control programs need predictable production, reliable sex separation, and repeatable release patterns across neighborhoods.
That makes this proposal part of a wider trend. AI is increasingly being used to manage physical-world systems, from agriculture to public health.
What Happens Next
The EPA will review public comments after the June 5 deadline.
If the agency approves the permit, Google could begin a two-year field test in Florida and California under federal conditions. If the EPA denies the request, the company would need to revise or abandon the proposed trial.
A positive decision would give Debug its first large-scale US regulatory pathway for this type of mosquito-control deployment.
It could also shape how future biological interventions are reviewed in the US, especially as mosquito-borne disease risks rise and cities look for alternatives to chemical control.
For now, the decision rests with the EPA.
The post Why Google Wants to Release 32 Million Mosquitoes in Florida appeared first on BeInCrypto.
Crypto World
A massive $1.26 billion sale of BlackRock’s IBIT was likely a rapid exit by a large investor, NYDIG says
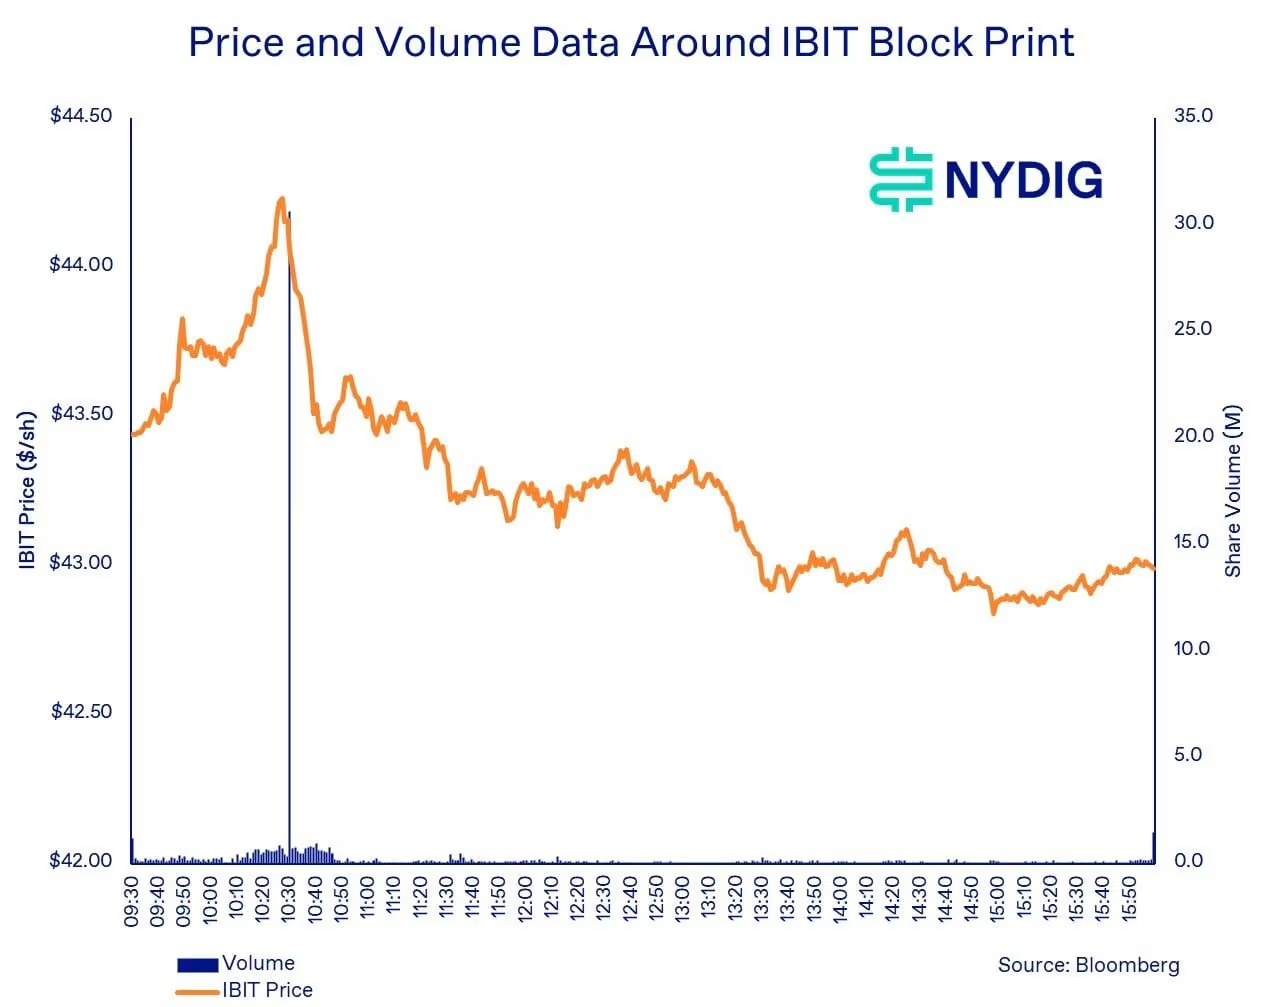
A $1.26 billion block sale of BlackRock’s iShares Bitcoin Trust (IBIT) this week might have been driven by a large investor seeking a rapid exit from bitcoin exposure rather than the unwinding of a common hedge-fund trading strategy.
That’s according to an analysis published by crypto investment firm NYDIG.
The transaction took place on May 26, when 29.21 million IBIT shares changed hands off-exchange at $43.16 per share. The trade was executed at a $1.01 discount to IBIT’s market price of $44.17 at the time, representing a 2.3% concession and roughly $29.5 million in execution costs.

NYDIG said the size of the discount suggests the seller prioritized certainty and speed over maximizing price. The trade was reported through the FINRA/Nasdaq TRF Carteret facility, which is commonly used for privately negotiated off-exchange transactions.
Some market participants had speculated the block could have been tied to a bitcoin basis trade, in which investors hold spot bitcoin exposure while shorting futures contracts.
NYDIG rejected that explanation, arguing that the discount would have significantly reduced the strategy’s expected returns.
The firm also pointed to activity in CME bitcoin futures. The IBIT position represented exposure equivalent to roughly 3,700 CME bitcoin futures contracts.
Yet only 91 contracts traded during the minute in which the block was executed, with no unusual spike in futures volume.
“The size of the trade, the 2.3% execution discount, the absence of corresponding CME futures activity, and the limited universe of potential sellers collectively weigh against the view that the transaction represented a contemporaneous basis-trade unwind,” NYDIG’s global head of research, Greg Cipolaro, wrote.
The sale came as U.S. spot bitcoin ETFs see sustained outflows. According to SoSoValue data, the funds recorded daily net outflows on every trading day from May 15 through May 29. Total assets across the category fell from $107.75 billion on May 14 to $94.17 billion by May 29. Meanwhile, the bitcoin price fell 16% this year, while most other assets, such as equities and commodities, have surged as capital continues to flow out of crypto.
Read more: Bitcoin drops to 13th largest asset as capital flees to AI and precious metals
Difficult to identify
While IBIT recorded about $720 million in net redemptions across May 26 and May 27, NYDIG said ETF flow data cannot be used to directly identify the seller or link specific redemptions to the block transaction.
NYDIG noted that the position exceeded the reported holdings of every disclosed IBIT investor in recent 13F filings, making identification difficult.
The firm said public data cannot determine whether the sale was driven by investor redemptions, risk-management constraints or a discretionary decision to reduce bitcoin exposure.
Still, NYDIG said the transaction stands out because a large holder chose to accept a significant discount to exit a bitcoin-linked position worth more than $1 billion during a period of persistent outflows and as the price of bitcoin remains below $80,000.
TLDR:
- Solana captured 97% of cumulative tokenized equities spot trading volume, setting a new market record this week.
- SoFi launched the first stablecoin from a U.S. nationally chartered bank, SoFiUSD, natively on Solana.
- Cash App rolled out USDC support on Solana, opening stablecoin access to millions of everyday retail users.
- Mayan bridged over one million external wallets and moved $2.5 billion in stablecoins across Solana this week.
Solana recorded a busy week of launches, integrations, and milestones across payments, tokenized assets, and developer infrastructure.
Major financial institutions and consumer apps moved onto the network. Stablecoin support expanded through platforms familiar to everyday users.
Tokenized equities trading on Solana also reached a new record. The week’s activity covered traditional finance, decentralized lending, privacy tools, and educational initiatives, reflecting broad momentum across the ecosystem.
Institutional Finance Finds a Home on Solana
SoFi launched SoFiUSD, marking a notable moment for the network. It became the first stablecoin issued by a U.S. nationally chartered bank on Solana. This move signals growing confidence from regulated financial institutions in the chain’s infrastructure.
Cash App also rolled out stablecoin support during the week, including USDC on Solana. The integration brings Solana-based payments to a widely used consumer application. Millions of everyday users now have a path to interact with Solana-based assets.
Solana also captured 97% of cumulative tokenized equities spot trading volume. Onchain tokenized stock holders surpassed 200,000, setting a new record high. These numbers reflect strong institutional and retail demand for regulated assets on the network.
New Protocols and Platforms Expand Solana’s Utility
Jupiter Exchange opened the public beta of its Offerbook during the week. The platform is a fixed-rate credit tool that supports borrowing against tokens, NFTs, and trading cards. It adds a structured lending layer to Solana’s growing DeFi ecosystem.
Streamex and Orca also launched 24/7 onchain secondary liquidity for tokenized securities. This addresses a long-standing gap in regulated asset trading on public blockchains. WalletConnect further added Solana compatibility to its Pay feature for merchant stablecoin spending.
Exponent Finance activated Exponent v2, which introduced strategy vaults and risk-tranching swaps. ONRefinance expanded fixed-rate infrastructure through integrations with Exponent and Loopscale. These releases together push Solana’s fixed-rate and structured finance capabilities further forward.
Ecosystem Growth Reaches Across Education, Privacy, and Infrastructure
Solana Foundation joined the Open Transaction Layer as a founding partner. The initiative focuses on developing cross-chain standards across the broader blockchain industry. AlmaU also signed an MOU to bring Solana blockchain development into its academic curriculum.
SheFinance partnered with Solana to launch its largest educational cohort to date. This effort aims to onboard more participants into Web3 through structured learning. Alongside this, Umbra Privacy launched its wallet app on the iOS App Store.
Mayan crossed one million external wallets bridged to Solana during the week. The protocol also moved over $2.5 billion in stablecoins across more than 600,000 transactions. Solstice Finance surpassed $500 million in total value locked, adding another milestone to the week’s record.


X Head of Product Nikita Bier debunked a persistent social media myth on May 31, directly telling the Vatican’s account that embedding a link in an X post does not reduce its reach.
The exchange followed @Pontifex, the Vatican’s official account, which posted an excerpt from Pope Leo XIV’s encyclical Magnifica Humanitas, with a link to the full text on vatican.va. A user replied, advising the Pope to append the URL in a threaded reply for better algorithmic performance.
X Head of Product Steps In
Bier entered the thread with a single-line response addressed to the head of the Catholic Church:
“Hey Pope, this isn’t true. Links will not deboost your post.”
As Head of Product, Bier thus oversees X’s ranking and recommendation architecture. His correction, therefore, carries as much official weight as any public statement on the subject can carry.
The belief that linking to off-platform destinations suppresses a post’s reach has circulated widely for years. This has pushed many social media teams toward workarounds like reply-threading links.
Bier joined X in mid-2025 after building TBH and Gas, two viral social apps acquired by Facebook and Discord. His first year on the platform has been eventful, and not entirely on his own terms.
Earlier in 2026, he became the center of claims of crypto content suppression by cryptocurrency creators, who reported declining reach. A creator monetization rollback followed when Elon Musk paused a revenue-sharing overhaul within hours of announcement.
Bier has also said the crypto bot spam problem may be unsolvable with existing technology. More recently, he previewed a crypto product on X to rebuild the platform’s relationship with digital assets.
The document he was commenting on carries different concerns. Pope Leo XIV signed Magnifica Humanitas on May 15, the 135th anniversary of Rerum Novarum, Pope Leo XIII’s foundational text on labor and industrialization.
The 42,300-word encyclical on artificial intelligence argues that technological progress without corresponding ethical development produces only an increase in means, without genuine human betterment.
Leo presented the text alongside Anthropic co-founder Christopher Olah at the Vatican. The product chief’s one-line reply may serve as a small footnote to that argument.
The post X Debunks Popular Engagement Myth on Pope Leo’s Tweet appeared first on BeInCrypto.
TLDR:
- Binance holds 85.1M LINK worth $766M, representing 66.4% of all exchange-held supply across platforms.
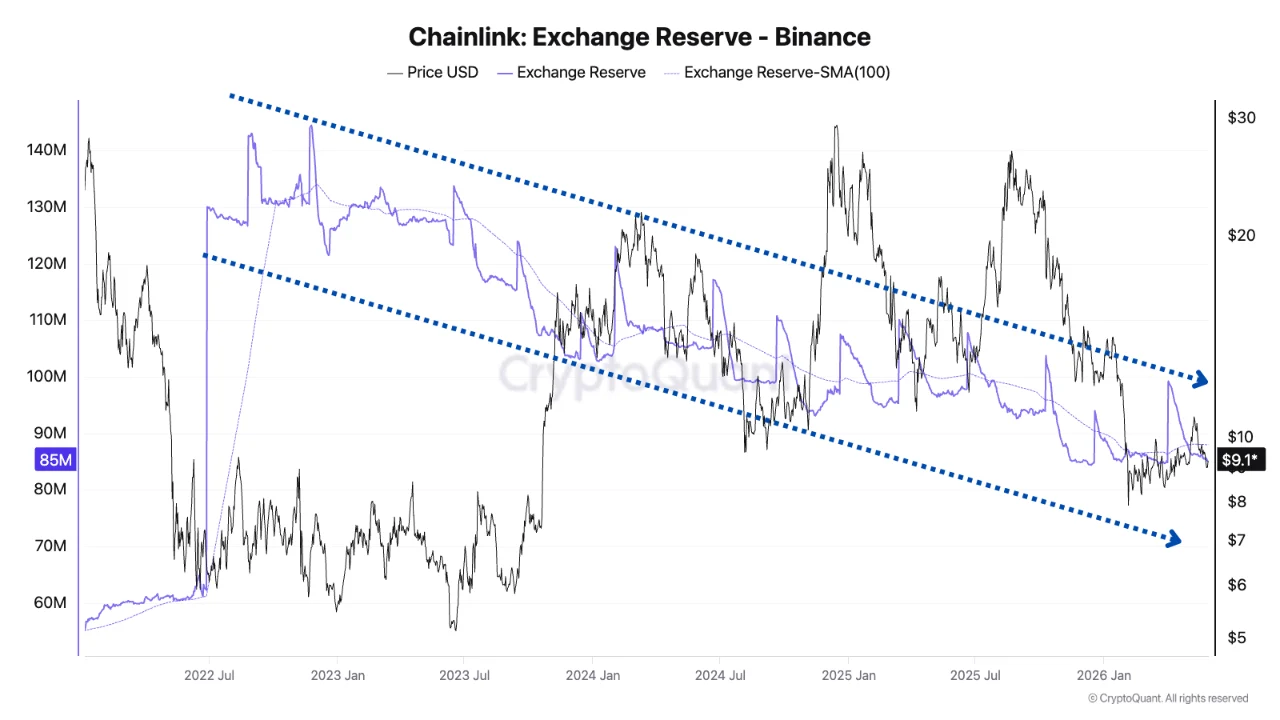
- LINK exchange reserves have declined from a 2022 peak of 145M tokens to roughly 85M, following a descending channel.
- Spot LINK ETFs recorded $8.29M in May net inflows, their weakest monthly figure since launching in late 2024.
- Spot LINK ETF products have never recorded a single day of net outflows and hold 1.69% of total supply.
Chainlink’s exchange supply is growing more concentrated, with Binance now holding the majority of LINK available across all trading venues.
On-chain data shows 85.1 million LINK tokens sitting on Binance alone, valued at roughly $766 million. That figure represents 66.4% of the 128.26 million LINK held across all exchanges combined.
Meanwhile, spot LINK ETFs continue attracting capital, though May marked their weakest month since launch.
Binance Controls the Venue-Level Supply Tone for LINK
Binance’s dominance over LINK exchange reserves means its netflow activity shapes broader market perception. When extreme deposit or withdrawal days occur, they reflect Binance-specific behavior rather than a market-wide shift. This distinction matters for anyone reading on-chain signals as indicators of sentiment.
Reserve data since 2022 tells a consistent story. LINK holdings on exchanges peaked near 145 million tokens and have since followed a descending channel.
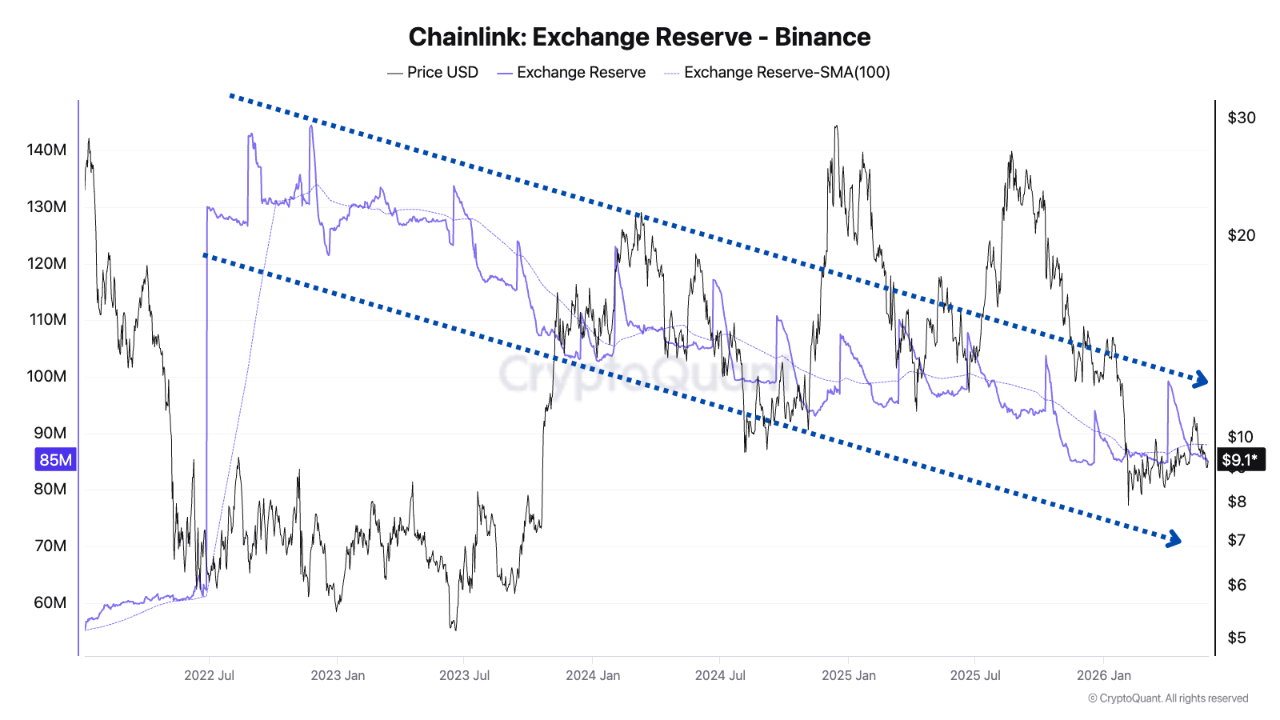
Source: Cryptoquant
Today, reserves sit near the lower band of that range at around 85 million tokens. That structural decline reflects a multi-year trend of coins moving off exchanges.
Short-term spikes in reserves appear periodically but do not alter the overall direction. These bursts are temporary in nature and tend to reverse quickly. The broader pattern remains one of steady outflows over time, not accumulation building on platforms.
Netflow data adds further context to those spikes. Positive inflow events often align with periods of elevated price volatility.
Rather than signaling fresh buying, these deposits have more frequently preceded weaker closes over the following one to three days.
Spot LINK ETF Inflows Slow but Remain Positive in May
Turning to ETF markets, spot LINK products recorded $8.29 million in net inflows during May. According to a post from BSCNews on X, this marks the weakest monthly performance since the products launched late last year. However, the products have yet to record a single day of net outflows since inception.
Spot LINK ETFs currently hold 1.69% of the asset’s total circulating supply. That level of institutional custody, while modest, represents steady structural demand building outside of exchange order books. It also removes supply from immediate sell-side availability.
The slowdown in May inflows reflects caution rather than outright rejection. Inflow figures are still positive on a monthly basis, which keeps the streak of net-positive months intact. The trend, though, is worth monitoring as market appetite for altcoin ETF products continues to be tested.
Taken together, both the on-chain reserve data and ETF flow figures point to a market where LINK supply is gradually moving toward longer-term custody.
Whether that continues depends on broader market conditions and sustained demand from institutional channels.
Crypto World
Bitcoin Price At Crossroads: Will BTC Fill the $73K CME Gap or Trigger a $78K Short Squeeze Next?
TLDR:
- BTC trades near $74K, leaving a CME gap at $73.4K–$73.5K.
- Liquidation heatmap shows dense leverage near $78K–$79K, while downside liquidity thins below $72K
- Market structure shows higher lows but stretched momentum as BTC holds near the $74K consolidation zone
- Weekend liquidity shows CME gap attraction below, while Binance heatmap flags upside liquidity imbalance
Bitcoin stands at a critical crossroads as traders weigh two powerful liquidity magnets. A lingering CME gap near $73,400 is pulling attention lower, while an enormous liquidation cluster around $78,000 is building pressure above. The two are setting the stage for a potentially volatile week ahead.
CME Gap Formation and Spot Price Divergence
A CME gap is recorded around the $73.4K to $73.5K range, forming a liquidity pocket that traders monitor closely. Bitcoin CME gap liquidation heatmap conditions note that price often revisits such inefficiencies over time.
The current structure shows higher lows forming, yet the price remains stretched above the unfilled futures discontinuity zone.
Momentum continues to build while liquidity distance from the CME gap expands across intraday trading sessions.
Traders referencing Bitcoin CME gap liquidation heatmap data observe that extended deviations often precede corrective rotations. Weekend conditions amplify attention on gaps due to reduced liquidity and thinner order book participation.
This environment increases sensitivity to CME gap narratives as traders position for early-week volatility. Liquidity models indicate that gaps act as reference zones where price discovery temporarily stabilises.
In this case, the Bitcoin CME gap liquidation heatmap reinforces the probability of revisit scenarios. Order flow data across futures markets suggests that unfilled gaps near $73K continue to influence short-term positioning.
Especially as leveraged traders reopen conditions and liquidity providers rebalance order books across major exchanges into early weekly volatility phases ahead of market open.
Binance Liquidation Heatmap and Upper Liquidity Wall
Binance liquidation heatmap data aligned with Bitcoin CME gap liquidation heatmap shows concentrated liquidity forming above current price levels.
A dense liquidation cluster is positioned near $78K to $79K, representing the largest visible leverage zone on the chart.
This zone remains unfilled while lower liquidity regions have already been partially cleared during recent selloffs. Analysts have noted that the Bitcoin CME gap liquidation heatmap upper cluster is a potential magnet.
Liquidation mechanics suggest that upward moves into dense short positioning can trigger cascading forced closures. Such movements often accelerate momentum as automated liquidations add buy pressure to the market.
The framework indicates asymmetry between unfilled upside and reduced downside liquidity. Downside liquidity below $72K has already been significantly absorbed in prior trading sessions.
This leaves the upper zone as the primary unresolved liquidity concentration in the current structure. Traders spot momentum aligns with futures positioning, and market makers seek efficient execution pathways across exchange order books. Some traders are anticipating potential breakout continuation scenarios next week.

York to Italian Riviera – a 5-star luxury travel guide

Berkshire Hathaway to buy US homebuilder Taylor Morrison for $8.5 billion

Rod Stewart Cancels Las Vegas Show On ‘Doctor’s Advice’

Steven Gerrard disagrees with Gary Neville over ‘shock’ Chelsea and Arsenal claim | Football

US brings back mandatory military draft registration

Register Renaming | Hackaday

WALL STREET JUST SAID IT: XRP =THE FINANCIAL SYSTEM! Clarity Act Senate Floor Vote Drops July 2026

Ripple XRP – XRP Will Hit $10,000? (Realistic XRP Price Prediction 2026)

When The Promised Financial Genius Crashes Your Economy
-

 NewsBeat4 days ago
Israel says it has killed new Hamas military leader in Gaza City airstrikes
-

 Tech5 days ago
NASA taps Blue Origin to deliver lunar rovers for Moon Base initiative
-

 Politics6 days ago
Bridgerton Season 5: Cast, Release Date And Everything We Know So Far
-
Crypto World7 days ago
Brian Armstrong Outlines Crypto Vision for the Future Financial System
-

 News Videos5 days ago
XRP *JUST* SUCCEEDED!!!! CLARITY ACT EXPOSED!!! (SHE EXPOSED IT)
-

 Sports6 days ago
2026 NBA Finals schedule, odds: Knicks await Thunder or Spurs after winning East
-
Crypto World5 days ago
Micron Crosses $1 Trillion Market Cap as AI Demand Reshapes Memory Sector
-

 Business5 days ago
Selena Gomez Reportedly Upset Over Benny Blanco’s Comments on Her ‘Terrible’ Diet
-

 News Videos2 days ago
This is BROKEN! INSANE 5x MONEY CAR WASH WEEK! The NEW GTA Online UPDATE Today! (GTA5 New Update)
-

 Business6 days ago
BTS Sells Out Four Las Vegas Shows at Allegiant Stadium for ARIRANG World Tour
-
 Tech6 days ago
China assigns ID codes to 28,000+ humanoid robots
-
 NewsBeat6 days ago
Hottest May day ever as London hits 34.8C in 2C leap from previous records
-

 Tech6 days ago
Microsoft’s quiet Claude Code retreat and the real cost of enterprise AI
-

 Tech3 days ago
Waymo dominates autonomous vehicle registrations as Tesla trails behind
-

 Business6 days ago
Nikkei 225 Surges Past 65,000 for First Time as Iran Peace Hopes Fuel Record Rally
-
Tech4 days ago
The Samsung pay deal is the moment Korean unions changed register
-

 NewsBeat6 days ago
Crowds find riverside shade in York as temperatures soar
-

 Tech6 days ago
Westone Audio and Etymotic Acquired by Fidelity Collective in Major IEM Market Move
-
 Entertainment6 days ago
‘Breaking Bad’ Star’s Easy-to-Binge 6-Part Crime Series Spin-Off Is Finally Heading to Free Streaming
-

 Tech5 days ago
Millions of AI agents imperiled by critical vulnerability in open source package
You must be logged in to post a comment Login