

Crypto World
NVDA Shares Approach Strong Resistance

Production of NVIDIA processors is concentrated in Taiwan via TSMC, making the company sensitive to US trade policy. In the first quarter of fiscal 2026, NVIDIA recorded a $4.5bn write-down due to restrictions on H20 chip exports to China. At the same time, the revenue structure remains resilient — around 69% of revenue comes from the US domestic market, where hyperscalers continue to increase purchases of accelerators for data centres.
In the fourth quarter of fiscal 2026, revenue reached $68.1bn, representing a 73% year-on-year increase, while full-year revenue totalled $215.9bn (+65%). In late March, the company announced an expansion of its strategic partnership with Marvell Technology, including a $2bn investment and integration via the NVLink Fusion ecosystem, further extending its presence in the Physical AI and robotics segment. However, the overall macroeconomic backdrop remains subdued.
Technical picture
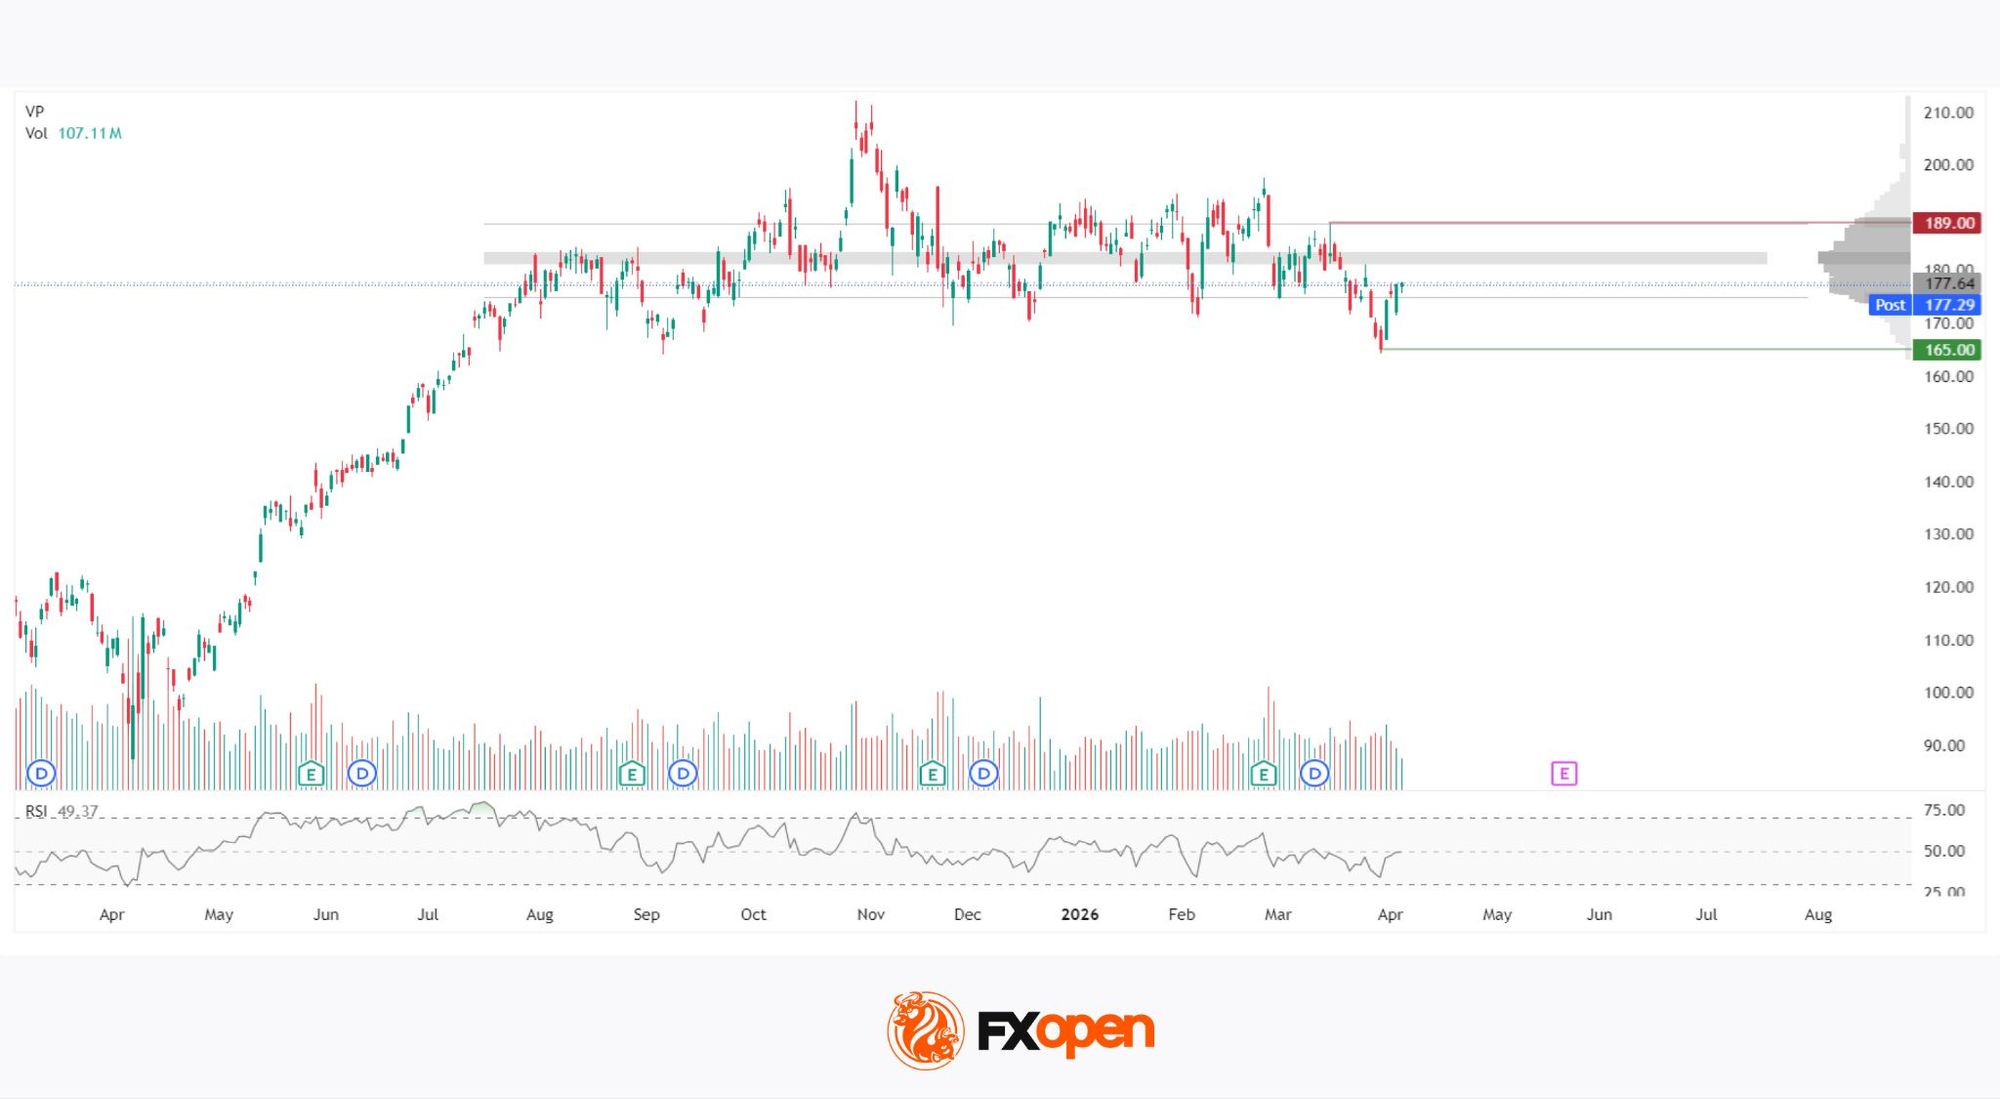
After reaching an all-time high near 210 in November 2025, the stock entered a corrective phase. The low of this correction was marked at 165 on 30 March 2026. A rebound followed from this level; however, the price remains around 177, without showing a convincing recovery. The horizontal volume profile provides further clarity.
The highest concentration of trading activity over the period under review is located in the 181–183 zone, where the point of control (POC) is situated. This area reflects the most active trading over several months, making it a key reference zone for market participants. Above current levels, the volume profile remains dense up to 189, which coincides with the local highs from the second half of 2025 and acts as the nearest resistance level.
The RSI stands at 49.37 and remains in neutral territory, offering no clear directional advantage. The latest session’s volume reached 107.11 million shares, indicating sustained market participation. However, it should be noted that the most pronounced spikes in volume and volatility have historically occurred ahead of and following quarterly earnings releases. As a result, the stock may continue to consolidate within the current range until new fundamental catalysts emerge.
Key takeaways
NVIDIA remains in a prolonged consolidation phase, supported by strong operational performance but a muted macroeconomic backdrop. The volume profile shows a significant supply overhang above current price levels, while the RSI does not favour either side. Market participants continue to assess incoming signals without committing to a sustained directional bias.
Buy and sell stocks of the world’s biggest publicly-listed companies with CFDs on FXOpen’s trading platform. Open your FXOpen account now or learn more about trading share CFDs with FXOpen.
This article represents the opinion of the Companies operating under the FXOpen brand only. It is not to be construed as an offer, solicitation, or recommendation with respect to products and services provided by the Companies operating under the FXOpen brand, nor is it to be considered financial advice.

Solana (SOL) dropped to its lowest price since December 2023 this week, sliding toward $68 as more than $88 million in leveraged positions were wiped out across the market.
Long traders absorbed almost all of the damage. On-chain activity and social interest had been weakening for months before the breakdown, which suggests the selloff reflected fading demand rather than a single shock.
Long Liquidations Account for 94% of the Damage
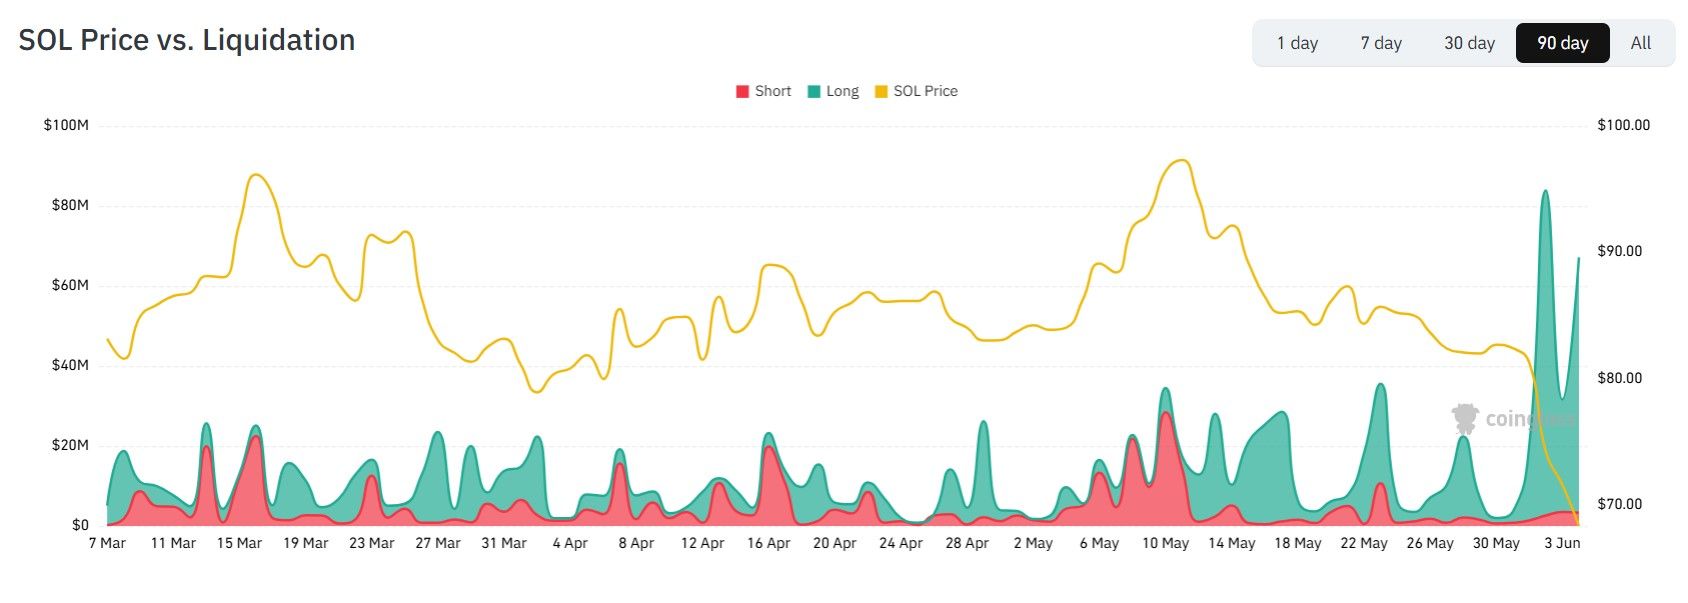
The market liquidated $88.45 million in SOL positions over 24 hours, according to Coinglass data. Of that total, $83.53 million came from long positions against just $4.91 million in shorts.

That split means bullish traders accounted for roughly 94% of the losses. The data also shows 12,084 traders liquidated worldwide as SOL volatility passed 12% on the day.
The 90-day comparison makes the move stand out. The long liquidation spike near $84 million was the tallest reading on the entire chart, and it landed exactly as the price collapsed toward the lows.

Active Addresses Have Fallen Since February
The leverage flush did not happen in isolation. Solana network usage has been declining steadily, which points to weaker underlying demand.
Daily active addresses peaked near 5.5 million in early February, according to Santiment. The metric now sits around 2.91 million, roughly half the February high.
This matters because price held a consolidation range between $78 and $95 through spring, while usage kept falling. That divergence often warns that a sideways market lacks real support. The recent break toward fresh lows followed the same pattern flagged in earlier unstaking analysis.

Social Interest Fades as Rallies Get Sold
Crowd attention tells a similar story. Social volume has trended lower, with the latest reading down at 39, near the bottom of its three-month range.
Social dominance gained briefly in mid-May when SOL staged a short bounce, yet it has since rolled over to 0.687. The token now commands a smaller share of overall crypto conversation.
The pattern is telling. Bursts of chatter did not put a floor under price, and each spike in attention was sold into rather than bought. Fading interest leaves little fresh demand to defend support.

SOL Weekly Chart Confirms the Breakdown
The weekly chart ties the data together. SOL closed the latest candle near $68.46, down almost 17% on the week, its lowest level since December 2023.
Price has lost the 0.786 Fibonacci retracement at $73.31, turning former support into resistance. It was also rejected at the long-term resistance zone around $100, a shelf that previously acted as support in early 2024.
Weekly volume has been declining throughout the descent, which signals thin conviction behind every rally attempt. The weekly RSI has rolled into bearish territory, confirming weak momentum on the highest timeframe.
At the time of writing, Solana traded near $68.53, down about 9% over 24 hours, with a market cap close to $39.6 billion at rank seven.

For now, all four data sets point the same direction. A rebound in network usage and steady spot demand would offer the first evidence that selling pressure is starting to ease.
The post Solana (SOL) Hits Lowest Level in 2.5 Years as $88 Million in Longs Get Liquidated appeared first on BeInCrypto.


- Catapult Trade has appointed Claire “Cookie” Dang as VP of Growth and Co-Founder.
- Dang previously held growth and business development roles at Binance, KuCoin, and Crypto.com.
- The expansion is being funded in part by the KuCoin Ventures investment.
Catapult Trade has appointed Claire “Cookie” Dang as VP of Growth and Co-Founder, the latest in a series of moves that have widened the trading platform’s operations following an investment from KuCoin Ventures.
Dang held growth and business development roles at Binance, KuCoin, and Crypto.com before joining and will lead community growth and international expansion.
Her arrival has come alongside a broader push on the company’s external presence.
Catapult Trade has launched a sponsored podcast, Terminally Online, featuring Web3 founders and operators, and has assembled a media network from acquired social channels with a combined reach of over 20 million followers.
The company has also run trading activity collaborations with the exchange Gate.
The expansion is being funded in part by the KuCoin Ventures investment, disclosed earlier this year; terms were not made public, and the company said its funding round remains open, with proceeds also directed toward regional expansion in markets underserved by conventional financial infrastructure.
Catapult Trade opened to the public in December 2025 after a pre-launch incentives campaign that built its first base of traders and creators.
The platform runs on algorithmically generated price charts rather than an orderbook or live price feed.
Each session’s full price path is generated in advance and committed to a cryptographic hash published before trading begins, then revealed at settlement, letting users verify that the chart was never altered mid-session.
The company frames the design as a correction to conditions on memecoin launchpads, where hidden information has consistently worked against retail traders.
Since launch, the platform has recorded more than $1.5 billion in cumulative trading volume and over 80,000 monthly active users, with no paid acquisition behind the figures.
The platform’s chart-generation engine has passed two independent security audits, most recently by Halborn and earlier by Hashlock, with the company committing to annual reviews.
A points system has run since launch, fueling speculation about a token distribution; the company has confirmed in community sessions that a token is planned, but has released no allocation or vesting details.
A second product, Catapult Hyper, is in development and would extend the platform from synthetic charts into multichain token launches built on LayerZero’s omnichain fungible token standard.
The build-out reflects the standards now being applied to crypto products.
Where the previous cycle’s flagships rested on token speculation, the current cohort, led by names such as Hyperliquid in perpetuals and Polymarket in prediction markets, is judged on user demand and revenue.
Catapult Trade is being scaled on the same terms, in a category, gamified short-session trading on verifiable charts, that has yet to see an incumbent at scale.


The panicky action got more so overnight, with bitcoin (BTC) careening to as low as $61,400 before quickly bouncing back to $64,000.
Ahead of the open of U.S. stocks, bitcoin is headed lower again, currently trading at $62,400, down 7% over the past 24 hours.
At the center of the plunge, Strategy Executive Chairman Michael Saylor has spoken. “Capital markets are funding the AI buildout at historic scale: ~$400B over 6 months,” Saylor posted to X minutes ago. “Bitcoin ETFs have seen ~$4B of outflows since May 14, pressuring BTC,” he continued.
“This is a capital rotation, not a Bitcoin impairment. Volatility creates opportunity,” Saylor concluded.
His comments echoed much of the conventional wisdom surrounding crypto’s general price struggles in recent months, which have become particularly acute this week after Strategy sold some of its bitcoin.
MSTR shares are lower 1.8% premarket.
The largest cryptocurrency by market capitalization has been nosediving lately, with its price posting another substantial decline over the past 24 hours.
Multiple analysts believe the valuation could reach new lows in the near future, while one key indicator suggests a rebound could be on the horizon.
How Much Lower?
There’s no way to soften what’s been happening to BTC lately. Its price has lost over $20,000 in the past month alone, and several hours ago it dipped to nearly $61,000, the lowest point since early February. The reasons behind this carnage are many and various: Strategy’s historic decision to sell some Bitcoin, the escalating conflict in the Middle East, the massive outflows from spot ETFs, and the bear market reigning across the broader crypto market.
Currently, the asset trades at around $62,500, which is a slight comeback, but according to numerous industry participants, the worst is yet to come.
Ali Martinez recently claimed that the plunge below $72,000 has put BTC in “a vulnerable position.” He said that, based on the MVRV Pricing Bands, the next major support is between $50,000 and $54,000.
For his part, X user Ted argued that BTC’s “head-and-shoulders” breakdown target is still not complete. He described $49,000 as “a good bottom zone,” drawing parallels to the August 2024 low.
Somewhat expected, the major collapse of BTC’s price gave Peter Schiff the opportunity to make a highly pessimistic prediction. The well-known crypto critic and outspoken proponent of gold forecasted that the valuation could nosedive to $20,000 if it breaks $50,000.
“It should be a quick fall below $20K, which should be a big enough drop to shake the conviction of long-term HODLers, causing many to finally throw in the towel,” he added.
Light at the End of the Tunnel?
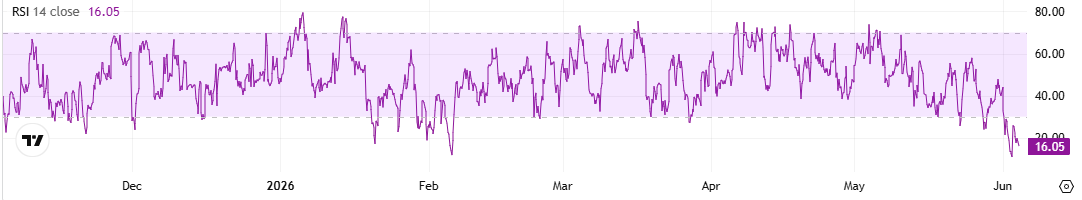
Contrary to the bloodbath and the predictions of a further collapse ahead, BTC’s Relative Strength Index (RSI) suggests it might be time for a resurgence. The technical analysis tool is often used by traders to spot potential price reversal points, as it indicates whether the asset is oversold or overbought.
It runs from 0 to 100, and anything below 30 indicates that the price has fallen too much in a short period of time and could be due for a comeback. On the other hand, readings above 70 signal that a pullback might be on the horizon. Just a few hours ago, the RSI dropped to 11, its lowest level in four months, and has since risen to approximately 16.
The post Top Bitcoin Price Predictions After BTC’s 15% Weekly Collapse appeared first on CryptoPotato.

Bitcoin price dropped 5.5% to $61,322 in early trading today as the news says this is its lowest level since February 6, before clawing back above $64,000 by afternoon, and now it’s sitting at $63,300.
The move completes a full round-trip, erasing every basis point of the rally that Middle East conflict headlines had built into BTC pricing over the prior three months.
The erasure of that geopolitical premium matters beyond the price level itself. It is a live stress test of the digital gold narrative, and the test results, again, are not flattering.
Bitcoin did not hold value during renewed Middle East tensions. It sold off with risk assets and then bounced with them. That is a risk-asset behavioral pattern, not a haven one.

Discover: The Best Crypto to Diversify Your Portfolio
Bitcoin News: BTC Support at $60,000–$65,000 Is the Line That Matters Now
Data BTC’s current critical support zone is between $60,000 and $65,000, and the price is sitting directly inside it.
More specifically, BTC has slipped below the Short-Term Holder Realized Price, the average cost basis for recent buyers, which historically functions as a pivot between bullish continuation and deeper mean-reversion.
Breaking cleanly below $61,000 on a closing basis opens the next structural level near $58,000.
The chart structure is damaged but not broken. The 20-day moving average was breached on the way down, a clean technical flush that coincided with the $1.85 billion liquidation event that tore through leveraged long positions.
Institutional inflow via spot ETFs, which drove aggressive net buying earlier in 2026, has shifted into a two-way flow; several days of net outflows now punctuate what was a one-directional accumulation story.
If BTC holds the $61,000 to $62,000 zone, funding rates reset negative, and short-term holders stabilize, a relief rally toward $68,000 sets up.
If the macro catalyst fails to arrive, Bitcoin consolidates between $62,000 and $65,000 while the market waits on US jobs data or Fed commentary to set the next directional leg.
A daily close below $61,000 triggers a second flush toward $58,000, where longer-term holder cost basis and prior accumulation zones offer the next real support.
Discover: The Best Token Presales
The post Bitcoin News: BTC USD Just Hit Its Lowest Level Since February appeared first on Cryptonews.
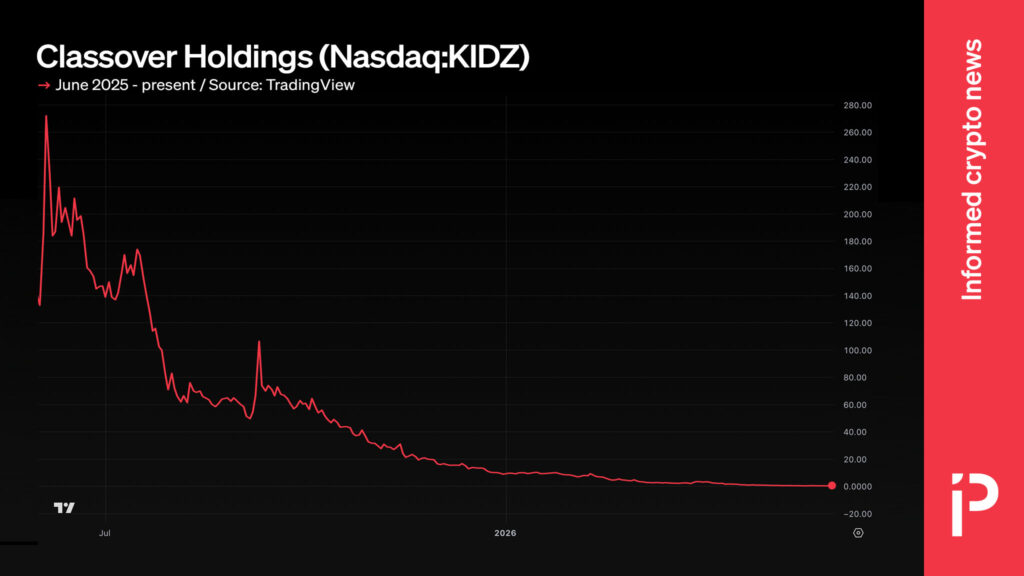
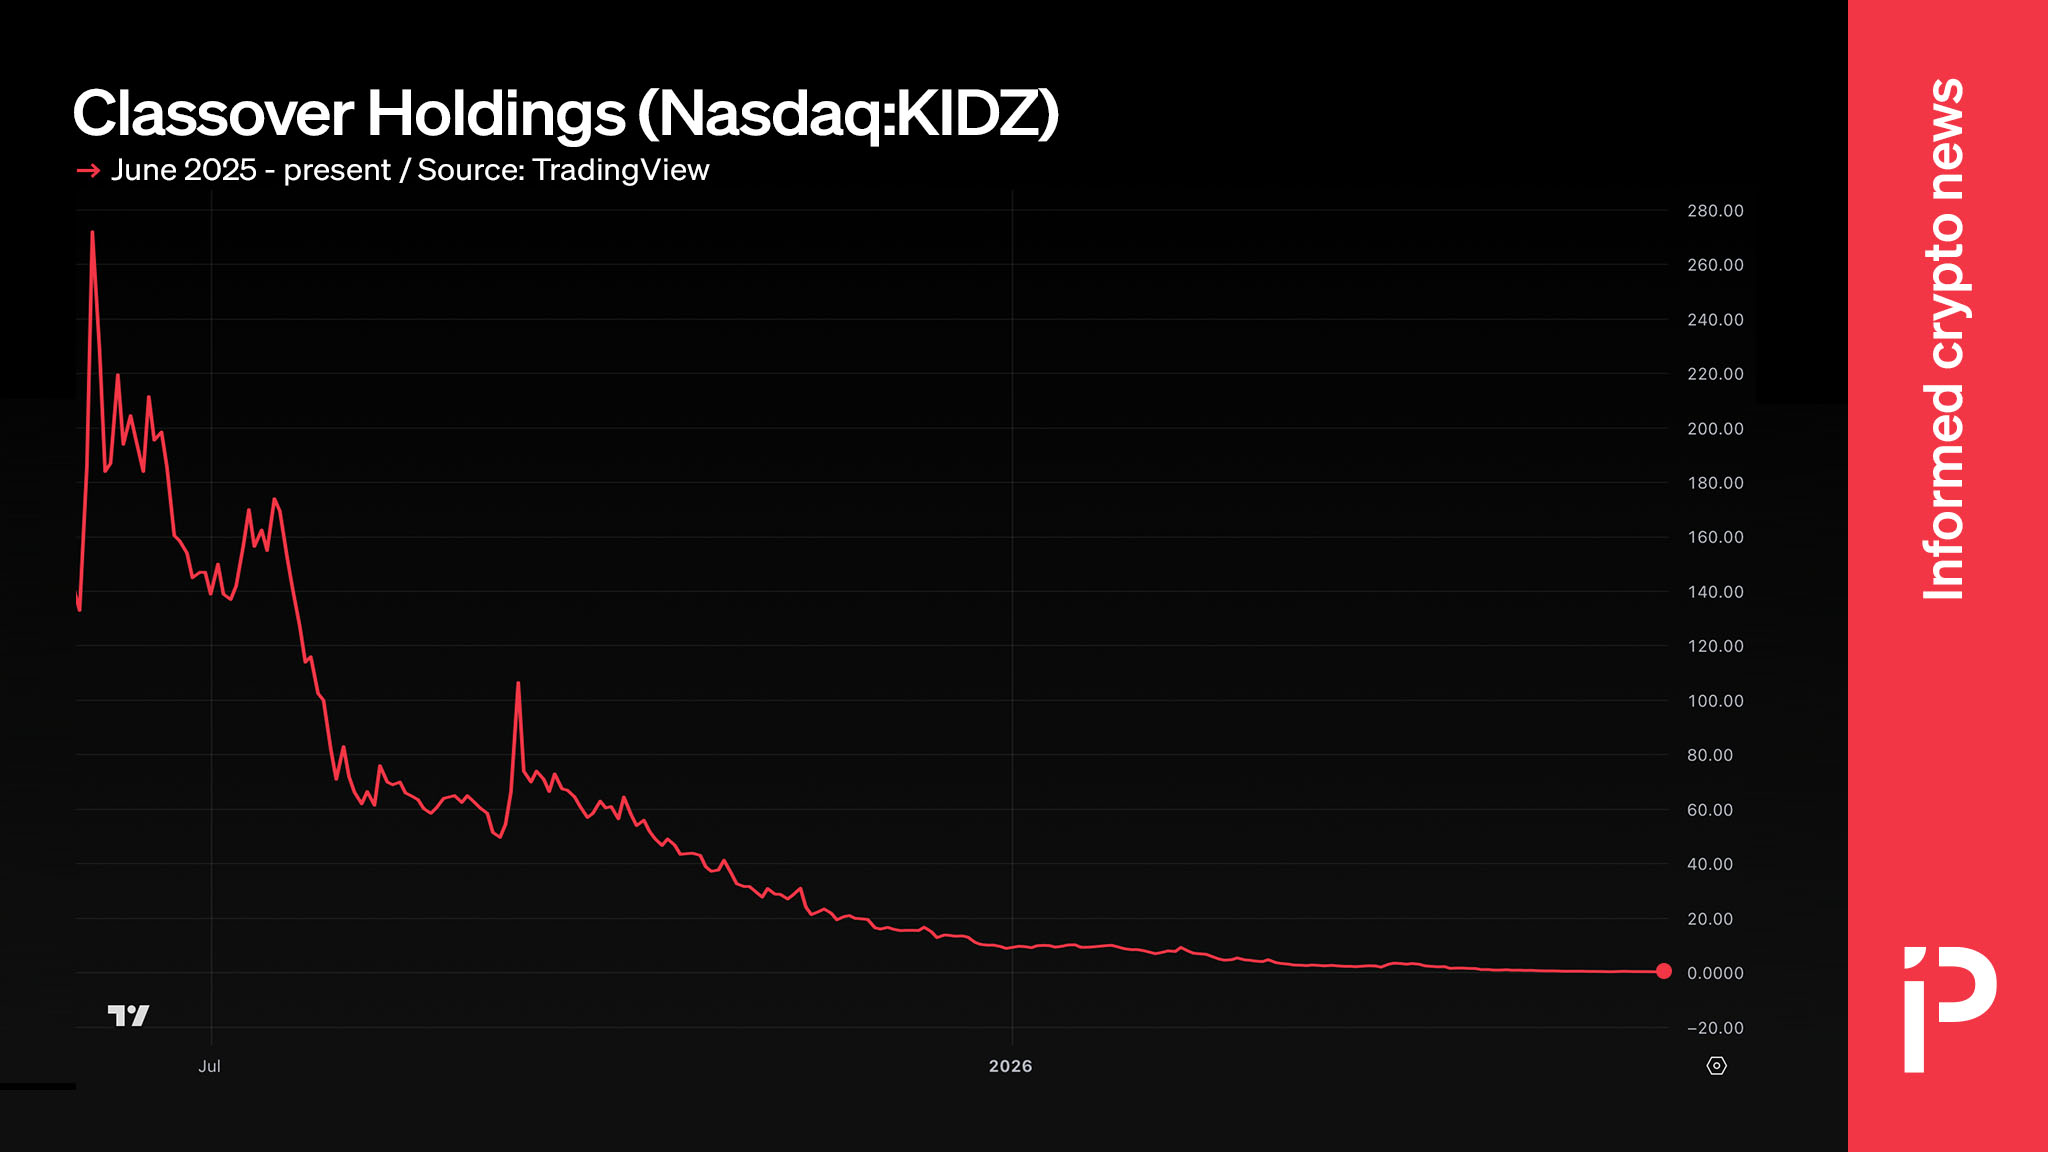
A publicly-traded children’s tutoring company has reinvented itself three times over the past year, pivoting from online education to Solana treasury management, then AI datacenter operations, and eventually, HyperLiquid yield farming.
Unfortunately, it dwindled to a penny stock in the process.
Shareholders have paid for every cringeworthy bandwagon hop. Its stock is down 99.9% over the past 12 months.
KIDZ AI is a Nasdaq-listed edtech curiosity formerly known as Classover Holdings. In 2025, it offered some sort of online, K-12 afterschool program. As of yesterday, it’s planning to farm stablecoins in the Hyperliquid ecosystem.
Every bizarre pivot arrived with a fresh press release, plenty of buzzwords, and a lower stock price.
Indeed, every single monthly candlestick over the past year is red.
Afterschool tutor becomes a ‘$900 million’ Solana bet
In the spring of 2025, the company discovered crypto. On May 1 of that year, during the momentary mania in digital asset treasury stocks, the company announced a $400 million agreement to fund a “Solana-centric digital asset treasury strategy.”
One month later, it announced another $500 million in convertible notes from Solana Growth Ventures LLC, bringing the headline figure to “$900 million” for a company whose actual quarterly revenues were less than $1 million at the time.
CEO Stephanie Luo called the financing a “milestone” for the company. And investors briefly loved it. The day after that press release, the stock had rallied 132% within two trading sessions.
It would never again regain those highs.
By October, after months of decline, management was still doubling down. The company said it would start accepting Solana (SOL) for tutoring payments, and reported holdings of 57,793 SOL worth roughly $13 million.
It chose words like “strengthens,” “reaffirms,” “commitment,” and “deepen” for a glowing press release. However, the stock kept sliding.
Sayonara Solana, aloha AI
Soon, its deeply reaffirmed commitment ended.
Three months ago, the company terminated its $400 million Solana “facility.” The digital asset strategy was no longer “accretive,” management said.
Instead of honoring its commitment, the company’s capital would now flow into artificial intelligence and robotics. Luo framed the reversal as “commitment.”
A new commitment.
Soon, the penny stock executed a one-for-50 reverse stock split, a maneuver that distressed companies use to manufacture a share price back above Nasdaq’s $1.00 per share minimum bid requirement.
Pre-split, the stock changed hands around 10 cents.
The company also rebranded to KIDZ AI Inc. It announced a GPU partnership targeting up to $50 million in AI compute capacity and started talking about AI datacenters.
Its stock price kept falling.
Read more: Hyperliquid SpaceX perp plummeted before Blue Origin explosion
Penny stock pivot to Hyperliquid
On Tuesday, KIDZ AI unveiled yet another treasury overhaul, this time phasing out Solana in favor of “the Hyperliquid ecosystem and yield-bearing US dollar-pegged stablecoin strategies.”
Luo said Hyperliquid has “real usage” and “deep liquidity.”
Investors rendered their verdict immediately, selling the stock down over 10% within a day.
Buried beneath the bandwagon-jumping treasury theatrics is a company in genuine distress.
Its most recent quarterly filing carries a going-concern warning, flagging “substantial doubt” about its ability to continue operating. The company lost millions operating its dwindling business divisions.
The SOL stash that once shimmered above $13 million was worth less than $5 million at the end of the most recent quarter.
Three pivots shared one outcome for the penny stock. The K-12 tutoring company that became a Solana treasury that became an AI robotics datacenter partner that became a Hyperliquid yield farmer play now trades around 35 cents per share, down 99.9% over the past year.
Got a tip? Send us an email securely via Protos Leaks. For more informed news and investigations, follow us on X, Bluesky, and Google News, or subscribe to our YouTube channel.

Arthur Hayes’ investment firm Maelstrom said Worldcoin could surge to as high as $5 per token over the next few months, with WLD acting as a crypto proxy for the AI boom.
“The AI mega IPOs are coming — and it appears the market has overlooked one of the cleanest proxies,” said Maelstrom researcher Lukas Ruppert on Wednesday.
The AI boom has been in full swing in the US. OpenAI confidentially filed its IPO prospectus with the SEC on May 22, targeting a public debut in September 2026, with the firm aiming to raise $60 billion with a potential valuation of up to $1 trillion.
Meanwhile, competitor Anthropic confidentially filed its draft prospectus on Monday after announcing on May 28 that it was valued at $965 billion following a fresh $65 billion funding round.
US stock markets such as the S&P 500 have reached record highs this week, primarily due to a surge in AI and memory storage company shares such as SanDisk, Micron, Seagate and Western Digital.
However, Ruppert argues that this hasn’t been reflected in the price of WLD, though company purchasing and a change in the token unlock schedule could be catalysts for a rally.
WLD is the native token underpinning Worldcoin, a crypto project co-founded by OpenAI CEO Sam Altman aimed at creating a global digital identity and financial network that can distinguish real humans from AI bots.
Two potential catalysts for WLD price pump
WLD prices have been downtrending since February, with losses accelerating in March following a private sale of tokens.
Worldcoin raised $65 million via an over-the-counter round in March, selling WLD tokens directly to private investors at a negotiated price, outside of any exchange. Of that amount, $25 million is locked for six months.
However, to protect themselves against WLD prices dropping before their tokens unlock, buyers hedged by shorting the token on perpetual futures markets in what Ruppert described as a “textbook short overhang.”
There are two potential catalysts to reverse this mechanical and temporary overhang, he said.
Eightco (ORBS), a small publicly traded company that has already accumulated 283 million WLD tokens, has around $144 million in cash sitting on its balance sheet. If they use that cash to buy more of the heavily shorted tokens, it could “trigger a reflexive loop,” sending prices higher, he said.
Secondly, Worldcoin’s unlock schedule, which releases tokens to the market every day, is set to drop by 43% on July 24, which could cut a major source of selling pressure.
Related: Crypto turns ‘contrarian bet’ as AI stocks draw investor attention: Bitwise
“Capital is aggressively chasing Anthropic and OpenAI exposure,” said Ruppert. Valuations are in the hundreds of billions and trillions, but WLD trades at $2 billion unlocked market cap, “a small cap, when it comes to AI valuations,” he added, labeling it an “asymmetric upside.”
The analyst note comes as WLD is currently the best-performing crypto asset in the top 100 tokens by market capitalization, having surged by around 60% over the past week.
“WLD doesn’t move often — but when it does, it moves aggressively,” he said, with Maelstrom predicting the token will reach $5 by August, a gain of around 900% from its current trading price of $0.50.
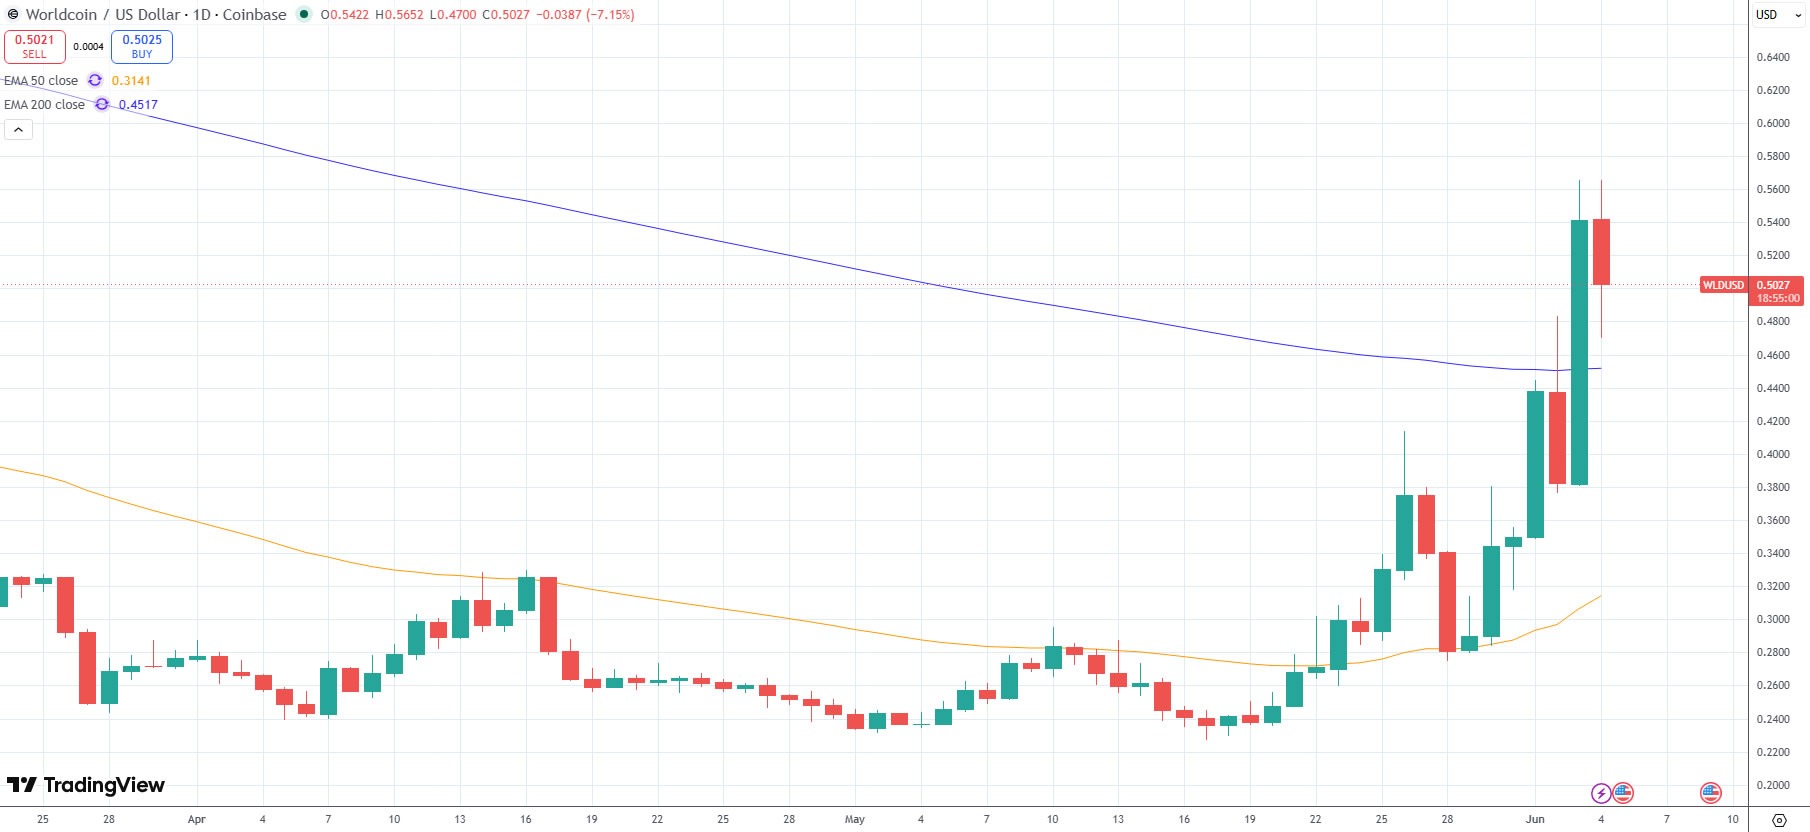
WLD has surged over the past week. Source: TradingView
Magazine: Big Questions: Do we really only need 2–5 cryptocurrencies?

Key Takeaways
- Bank of Japan poised to increase policy rate to 1% on June 16, marking the highest level in 30 years
- Sources indicate rate increase likely unless Middle East tensions dramatically worsen
- Financial markets currently pricing in approximately 80% probability of rate hike
- Governor Kazuo Ueda’s recent remarks suggest shift toward aggressive inflation management
- Central bank may also adjust bond purchase reduction strategy starting fiscal year 2027
Japan’s central bank appears set to implement an interest rate increase during its June 16 policy session, according to three individuals with knowledge of internal deliberations. This adjustment would elevate the nation’s benchmark policy rate from 0.75% to 1% — reaching heights unseen since the mid-1990s.
Bloomberg reports BOJ 🇯🇵 officials will consider a 25 bp rate hike at the June 15-16 meeting, which would take the policy rate to 1%.
Officials also see scope for another rate hike later this year, citing still-low real rates and upside inflation risks.
The BOJ is also expected… pic.twitter.com/ZqDU3HtmuS
— Wall St Engine (@wallstengine) June 4, 2026
These insiders, speaking under condition of anonymity due to lack of authorization for public statements, indicated that the final determination depends largely on developments in the Middle East. Barring a significant escalation of tensions involving Iran that could destabilize international financial markets, monetary tightening appears probable.
Financial market indicators already suggest this outcome, with derivatives pricing reflecting approximately an 80% likelihood of the rate adjustment.
Central Bank Chief Telegraphs Policy Shift
Governor Kazuo Ueda articulated his stance during Wednesday remarks that market observers interpreted as signaling a renewed focus on combating rising prices. His commentary suggested potential willingness to implement rate increases with greater frequency in coming months.
Two policy board officials, Kazuyuki Masu and Junko Koeda, have similarly expressed concern about accelerating price growth in recent statements. Market watchers believe they may align with three other policy hawks to support a June rate move.
Wholesale price data for April showed a 4.9% year-over-year surge — the sharpest acceleration in three years. This increase stems largely from elevated petroleum and chemical input costs linked to conflict in Iran.
Rising Price Pressures Mount
While Japan’s core consumer inflation metric has temporarily fallen beneath the BOJ’s 2% objective in recent months—partially due to government energy support programs—economists anticipate a rebound above that threshold later in 2025 as subsidies expire and energy expenses remain elevated.
Currency depreciation has compounded these challenges. A weakening yen increases import costs broadly, amplifying inflationary pressures and bolstering arguments for monetary policy normalization.
The central bank concluded its extended quantitative easing framework in 2024 and has implemented multiple rate increases since that time, including one in December. These moves reflect growing confidence that Japan can achieve its inflation objectives on a sustainable basis.
Prime Minister Sanae Takaichi, traditionally an advocate for accommodative monetary conditions, appears to have accepted the necessity of a June rate increase following a May 22 meeting with Ueda. Former policy board official Makoto Sakurai told Reuters the prime minister likely recognizes the move as unavoidable given current economic conditions.
Bond Purchase Strategy Under Consideration
The upcoming June session will also examine the central bank’s government bond purchase reduction program. The existing tapering schedule concludes in March 2027, requiring officials to establish a framework for the subsequent fiscal year.
Two sources suggest the BOJ favors either temporarily halting or decelerating the pace of bond purchase reductions to preserve market stability. Ueda acknowledged Wednesday that bond market functioning has strengthened but emphasized the importance of maintaining equilibrium as the institution withdraws from Japanese government bond acquisitions.
The two-day monetary policy gathering concludes on June 16.

Bitcoin briefly dipped toward the $60,000 zone, sliding to about $61,300 before bouncing back roughly 5.5% to around $64,690. The move came as fresh headlines about a potential ceasefire in the Middle East surfaced, adding a geopolitical undertone to a day of highly leveraged trading. While the rebound was sizable, observers warned that the surge could be a relief bounce rather than a bona fide bottom, given the size of the prior unwind and the chart setup traders are watching.
On the liquidity front, the move sparked a megawatt wave of liquidations across the market. Data tracker CoinGlass counted more than $737 million in BTC liquidations over a 24-hour window, with long positions bearing the brunt of the pressure. In absolute terms, more than $617 million of those liquidations came from long bets, underscoring how aggressively bullish positioning unraveled as prices slid. The brutal levered unwind has left participants weighing whether fresh bids will sustain or fade as risk sentiment shifts. CoinGlass data.
The rebound has fueled a breadth of mixed signals among traders. Some see the bounce as an early sign that selling pressure may have exhausted, opening room for a move toward the upper end of recent ranges. A market observer going by the alias RidaaXBT suggested a potential relief rally toward the $69,000–$70,000 zone, implying that the liquidation-driven flush may have run its course in the near term. RidaaXBT.
Analyst perspectives varied, with some colleagues hinting at cautious optimism. Another trader, ZordXBT, echoed the view that buyers stepped in near the lows given Bitcoin’s long downside wick, a sign some see as evidence of a floor forming. ZordXBT.
Not all voices agreed that the bottom was in. Hitman42.eth warned that bulls might be celebrating too soon, cautioning that the bounce could trap late buyers if the price loses momentum and retests lower levels. Hitman42.eth.
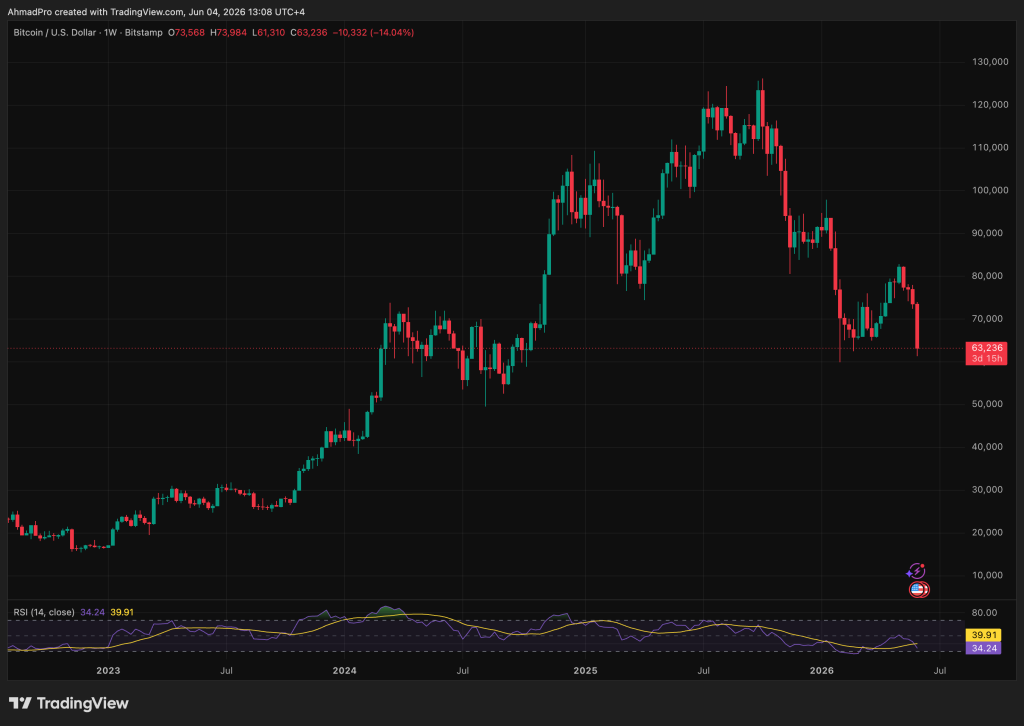
Market structure under the weekly lens: a bear flag remains in play
Looking at Bitcoin’s weekly chart, a bear-flag pattern continues to loom in the background. The setup implies a risk of a deeper pullback toward the $50,000–$52,000 area if selling pressure resumes and prices break down from the flag. The narrative is supported by rising volumes that accompanied the late-week downside, reinforcing the view that sellers still hold an edge in a broader market context. Related analysis.
Despite the bearish texture, the door remains ajar for a quick reversal if Bitcoin can reclaim the 200-week simple moving average near $61,800. That level has historically acted as a cycle-bottom anchor during major bear phases, surfacing as a potential fulcrum for a renewed up leg in 2015, 2018, and 2020. A convincing rebound above the 200-week SMA would undermine the bear-flag argument and broaden the market’s short-term upside scope, with $70,000 serving as the next clear milestone for bulls.
In chart terms, traders are watching how the price behaves around those levels while also weighing the momentum implied by weekly closes and volume patterns. The dynamic between the 200-week support and the bear-flag breakdown remains the key question for the coming sessions, shaping whether risk appetite stays tethered to defensive plays or shifts back toward aggressive long exposure.
What this means for traders and investors
The weekend moves highlight a persistent theme for Bitcoin: liquidity-driven volatility remains a defining feature, especially when leverage is high and sentiment shifts on macro headlines. For traders, the immediate takeaway is to monitor two critical areas: the 200-week SMA near $61,800 and the broader range around $69,000–$70,000. A move decisively above the SMA could shift the narrative toward a more constructive near-term outlook, prompting fresh bets toward higher targets. Conversely, aFailed break above the bear-flag upper boundary or a break below the weekly support could accelerate downside pressure toward the $50k–$52k corridor.
Investors eyeing longer horizons should consider how macro and geopolitical developments interact with on-chain signals. The Reuters report cited in coverage this week about potential ceasefire discussions between regional actors contributed to a mood shift that can carry through risk assets, including crypto markets. While headlines can move markets in the short run, traders are likely to place greater emphasis on structural indicators and risk-management metrics as liquidity remains a critical determinant of liquidation risk and price resilience. Reuters reporting.
Looking ahead, the market’s trajectory will hinge on whether buyers can sustain higher highs and whether selling pressure re-emerges with a fresh wave of leverage unwinds. If the price can stabilize above the 200-week SMA and push toward the mid-figure zone around $70k, momentum may tilt toward a more constructive phase. If, however, selling resumes and cracks appear below the weekly support, the path toward the lower targets could re-open, revisiting the bear-case scenario that has framed much of the recent discourse.
Trading and risk-management considerations aside, the episode underscores a broader theme in this cycle: Bitcoin remains highly sensitive to liquidity conditions and macro headlines, even as technical formations continue to shape shorter-term expectations. Investors should stay alert to how evolving on-chain data, funding dynamics, and regulatory mood interact with macro developments to determine whether the current bounce signals a durable bottom or a temporary relief rally.
What to watch next: a sustained hold above the 200-week SMA could reframe the near-term outlook toward a test of the $70,000 level, while a failure to reclaim that critical support may invite renewed downside toward the $50k–$52k zone. In the near term, traders will be watching liquidity conditions, funding rates, and the response of risk assets to any geopolitical headlines as the market seeks a clearer directional path.
In sum, the current action reflects a market negotiating between the fear of further downside and the relief of a sharp rebound, with the next price regime likely to be decided by how well Bitcoin can sustain above long-run support and whether a fresh batch of buyers steps in to defend the next leg higher.
Stay tuned for updates on liquidity metrics, macro headlines, and on-chain signals, as the market tests whether this rebound is the start of a new leg higher or a pause before another wave of selling.
The US dollar continues to hold firm against its major counterparts, supported by strong US macroeconomic data and expectations surrounding the release of further labour market indicators. Additional support for the greenback comes from persistent inflationary risks and the Federal Reserve’s cautious stance regarding further monetary policy easing. Against this backdrop, EUR/USD and GBP/USD remain under pressure, with market participants preferring to reduce long positions in the euro and sterling ahead of the next batch of economic releases.
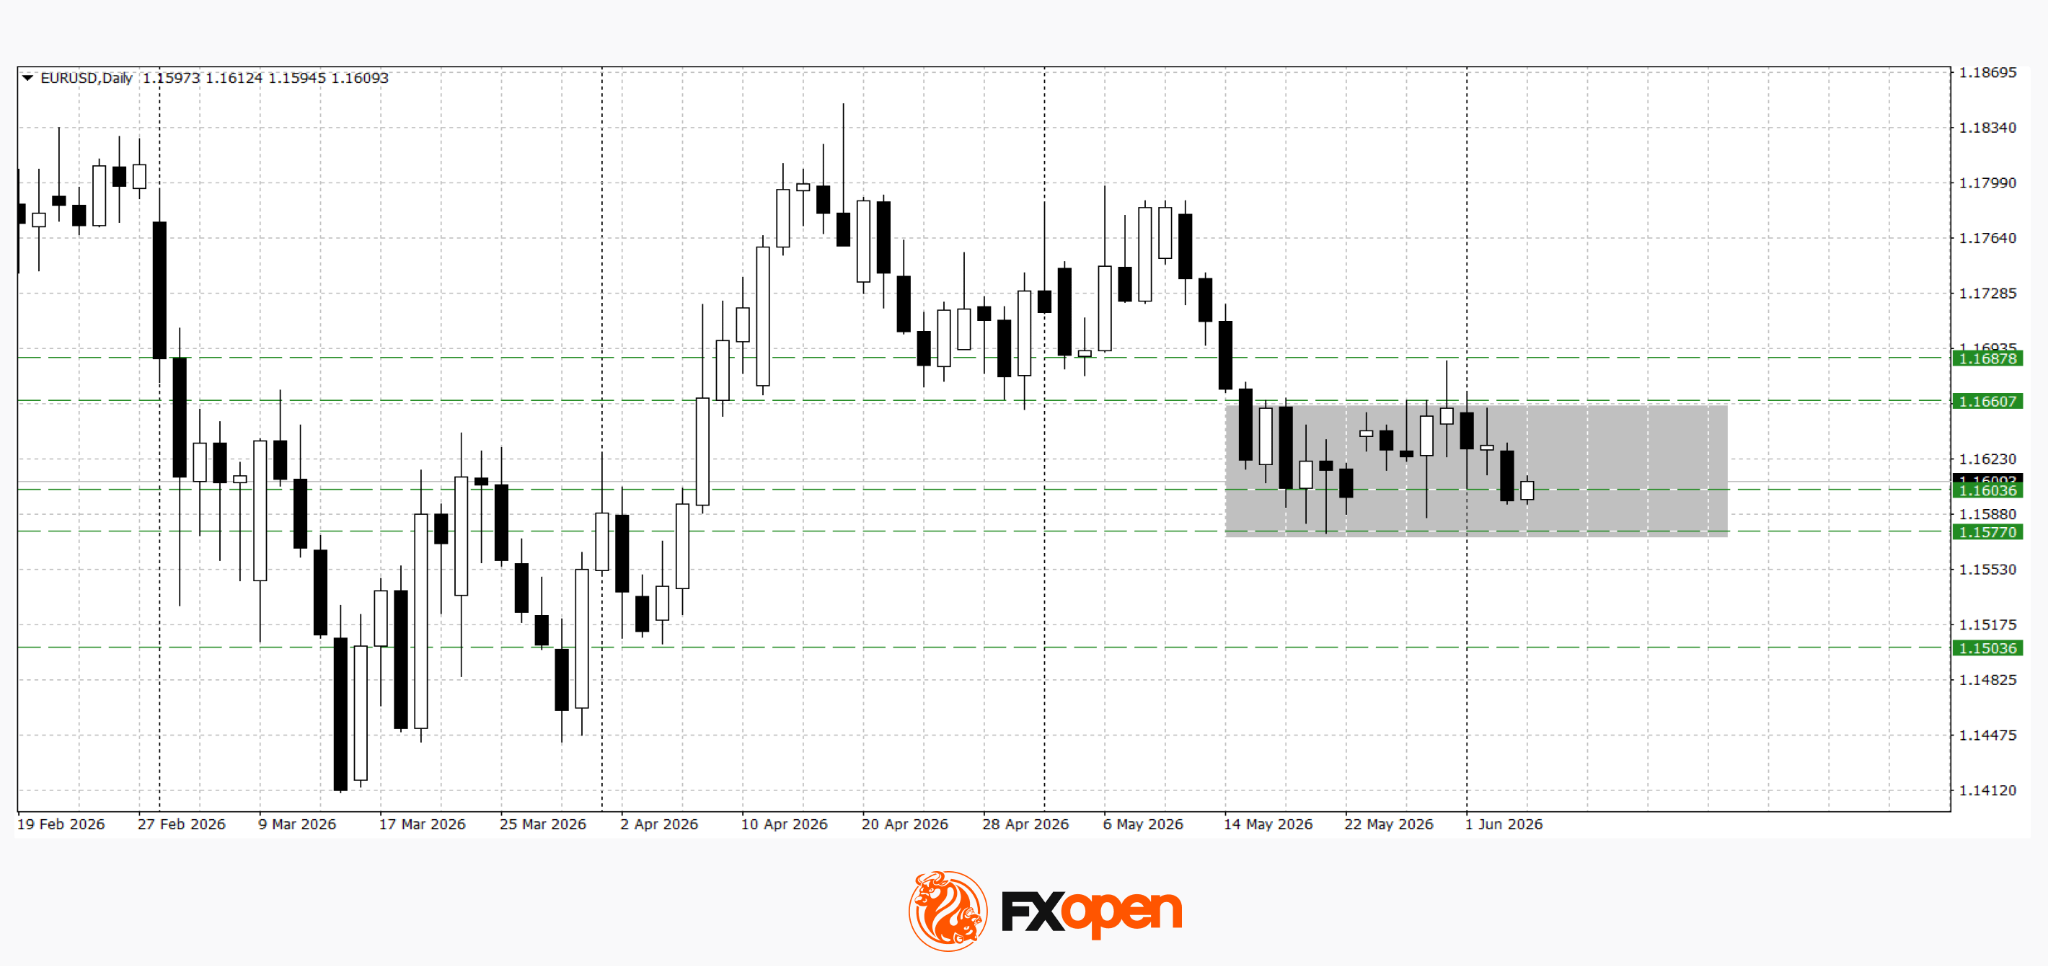
EUR/USD
EUR/USD continues to trade within its established range following the recent decline, consolidating near the lower boundary.
Technical analysis of EUR/USD points to continued sideways trading within the 1.1570–1.1660 range. Should US data come in strong, pressure on the pair could intensify, potentially leading to a break below the lower boundary of the range and the beginning of a new bearish impulse. Conversely, if incoming data disappoint market expectations, EUR/USD may strengthen above 1.1660.
Key events for EUR/USD:
- today at 10:30 (GMT+3): Germany S&P Global Construction PMI;
- today at 15:30 (GMT+3): US Initial Jobless Claims;
- today at 20:00 (GMT+3): speech by Federal Open Market Committee (FOMC) member Mary Daly.

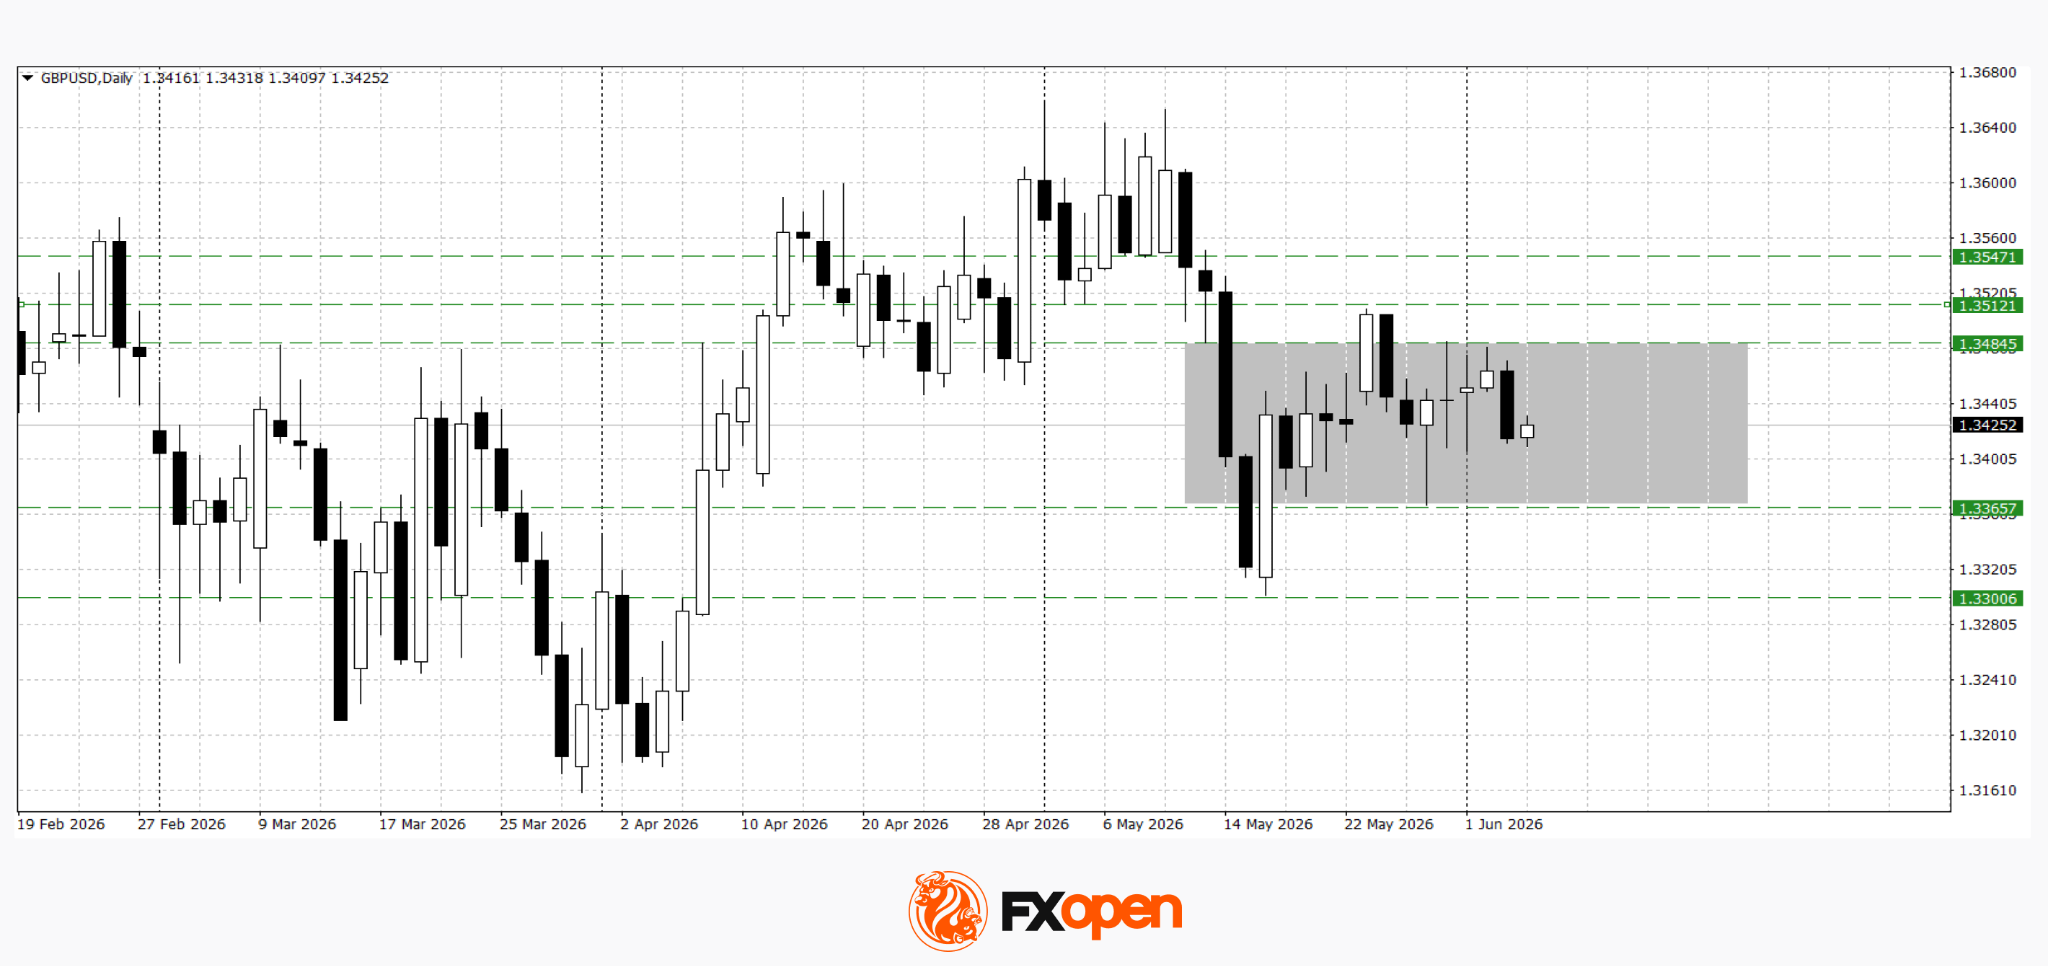
GBP/USD
GBP/USD also remains under pressure following its recent decline. Sterling previously attempted to develop an upward correction; however, buyers failed to establish themselves above local resistance levels. As a result, the pair has returned to the range between 1.3360 and 1.3480, where a balance between buyers and sellers is currently taking shape.
Technical analysis of GBP/USD suggests the possibility of a test of the lower boundary of this range. A decisive move below 1.3360 could lead to a retest of the recent low near 1.3300. If buyers manage to secure a foothold above 1.3480, a move towards the 1.3510–1.3550 area may follow.
Key events for GBP/USD:
- today at 11:30 (GMT+3): UK Construction PMI;
- today at 18:40 (GMT+3): speech by Bank of England Governor Andrew Bailey;
- tomorrow at 13:30 (GMT+3): UK mortgage lending data.
Key takeaways
The dollar continues to enjoy an advantage thanks to resilient US economic indicators and expectations of further labour market data. At the same time, EUR/USD and GBP/USD are trading close to important technical support levels, making the upcoming data releases a key factor for the market’s next move. Strong US figures could increase pressure on European currencies and trigger downside breakouts from their respective ranges, while weaker data may support a corrective recovery in both the euro and sterling.
Trade over 50 forex markets 24 hours a day with FXOpen. Take advantage of low commissions, deep liquidity, and spreads from 0.0 pips (additional fees may apply). Open your FXOpen account now or learn more about trading forex with FXOpen.
This article represents the opinion of the Companies operating under the FXOpen brand only. It is not to be construed as an offer, solicitation, or recommendation with respect to products and services provided by the Companies operating under the FXOpen brand, nor is it to be considered financial advice.

Switzerland’s Embolo goes to US embassy after travel denied ahead of WC | FIFA World Cup 2022

Cambridge Audio Evo 300 Debuts at HIGH END Vienna 2026 With 300W Streaming Amplifier Firepower

Witness History – The protests that sparked the Tiananmen Square massacre


-

 Tech6 days ago
Waymo dominates autonomous vehicle registrations as Tesla trails behind
-

 News Videos6 days ago
This is BROKEN! INSANE 5x MONEY CAR WASH WEEK! The NEW GTA Online UPDATE Today! (GTA5 New Update)
-
 Tech5 days ago
SpaceX just won a second Golden Dome contract. This one is $4.16 billion.
-

 Business3 days ago
Jade Biosciences, Inc. (JBIO) Discusses Positive Interim Results From JADE101 Phase I Healthy Volunteer Study and Development Plans Transcript
-
 News Videos6 days ago
SHE IS KILLING XRP!!! WATCH URGENT AND ACT FAST
-
 NewsBeat5 days ago
FIRST NIGHT REVIEW: Take That bring the Circus back to life in spectacular sun-soaked style
-

 Business5 days ago
Is the Spurs Phenom Already Better Than Prime Diesel?
-
Crypto World6 days ago
CFTC Has Approved the First Regulated Bitcoin Perpetual Contract in the U.S.
-

 Politics5 days ago
The House | Inside Andy Burnham’s Makerfield Campaign: “Nobody Thinks This Is In The Bag”
-

 Sports2 days ago
French Open 2026 results: Alexander Zverev beats Rafael Jodar and will play Jakub Mensik in semi-finals
-
 NewsBeat6 days ago
Novak Djokovic v Joao Fonseca LIVE: French Open latest scores and results after Jannik Sinner’s shocking collapse
-
 Entertainment5 days ago
Weak ‘Supergirl’ Box Office Tracking Amid Milly Alcock Backlash
-
 Crypto World6 days ago
Snowflake (SNOW) Stock Rallies on Strong Q1 Results and AI Product Growth
-

 Tech2 days ago
CryZENx Releases Fresh Playable Content Deep Inside Jabu-Jabu for His Ocarina of Time Remake
-

 Entertainment6 days ago
Maddox Jolie-Pitt Legally Requests to Drop Brad’s Surname
-

 Business5 days ago
Demand Conditions Improve In Chemicals Sector In April 2026
-
 Entertainment5 days ago
One of the Greatest Sitcoms of All Time Shoots Up Apple TV’s Charts 11 Years Later
-

 Tech6 days ago
This Week In Security: Ubiquiti Fixes, And FreeBSD Joins The Club You Don’t Want To Join
-
 Crypto World6 days ago
MicroStrategy Moves $30 Million in BTC to Coinbase Prime: Is the Bitcoin Sell-Off Already Here?
-
 Entertainment6 days ago
Bruce Willis’ Generosity Resurfaces Amid His Dementia
You must be logged in to post a comment Login