

Crypto World
Top Bitcoin Price Predictions After BTC’s 15% Weekly Collapse
The largest cryptocurrency by market capitalization has been nosediving lately, with its price posting another substantial decline over the past 24 hours.
Multiple analysts believe the valuation could reach new lows in the near future, while one key indicator suggests a rebound could be on the horizon.
How Much Lower?
There’s no way to soften what’s been happening to BTC lately. Its price has lost over $20,000 in the past month alone, and several hours ago it dipped to nearly $61,000, the lowest point since early February. The reasons behind this carnage are many and various: Strategy’s historic decision to sell some Bitcoin, the escalating conflict in the Middle East, the massive outflows from spot ETFs, and the bear market reigning across the broader crypto market.
Currently, the asset trades at around $62,500, which is a slight comeback, but according to numerous industry participants, the worst is yet to come.
Ali Martinez recently claimed that the plunge below $72,000 has put BTC in “a vulnerable position.” He said that, based on the MVRV Pricing Bands, the next major support is between $50,000 and $54,000.
For his part, X user Ted argued that BTC’s “head-and-shoulders” breakdown target is still not complete. He described $49,000 as “a good bottom zone,” drawing parallels to the August 2024 low.
Somewhat expected, the major collapse of BTC’s price gave Peter Schiff the opportunity to make a highly pessimistic prediction. The well-known crypto critic and outspoken proponent of gold forecasted that the valuation could nosedive to $20,000 if it breaks $50,000.
“It should be a quick fall below $20K, which should be a big enough drop to shake the conviction of long-term HODLers, causing many to finally throw in the towel,” he added.
Light at the End of the Tunnel?
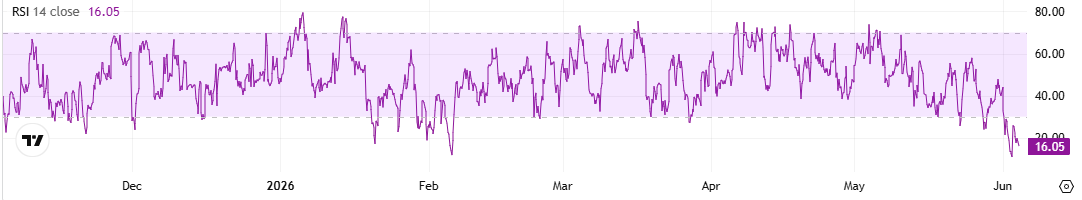
Contrary to the bloodbath and the predictions of a further collapse ahead, BTC’s Relative Strength Index (RSI) suggests it might be time for a resurgence. The technical analysis tool is often used by traders to spot potential price reversal points, as it indicates whether the asset is oversold or overbought.
It runs from 0 to 100, and anything below 30 indicates that the price has fallen too much in a short period of time and could be due for a comeback. On the other hand, readings above 70 signal that a pullback might be on the horizon. Just a few hours ago, the RSI dropped to 11, its lowest level in four months, and has since risen to approximately 16.
The post Top Bitcoin Price Predictions After BTC’s 15% Weekly Collapse appeared first on CryptoPotato.


ChatGPT AI just made a prediction on SpaceX stock price that treats the recent pullback as an opportunity rather than a warning. The model sees $220 to $280 by the end of 2026, with an aggressive case stretching to $320.
The bull case treats SpaceX as a rare combination of businesses trading under one ticker. At $156 today, the model frames this as a base-to-bull setup rather than a stretch target.
SpaceX sits at the intersection of satellite internet dominance, commercial launch supremacy, major defense contracts, and next-generation space infrastructure, while Starlink continues to scale into an increasingly massive, cash-generating business on its own. Investor enthusiasm around artificial intelligence adds another layer, especially given the company’s growing exposure through its merged AI operations.
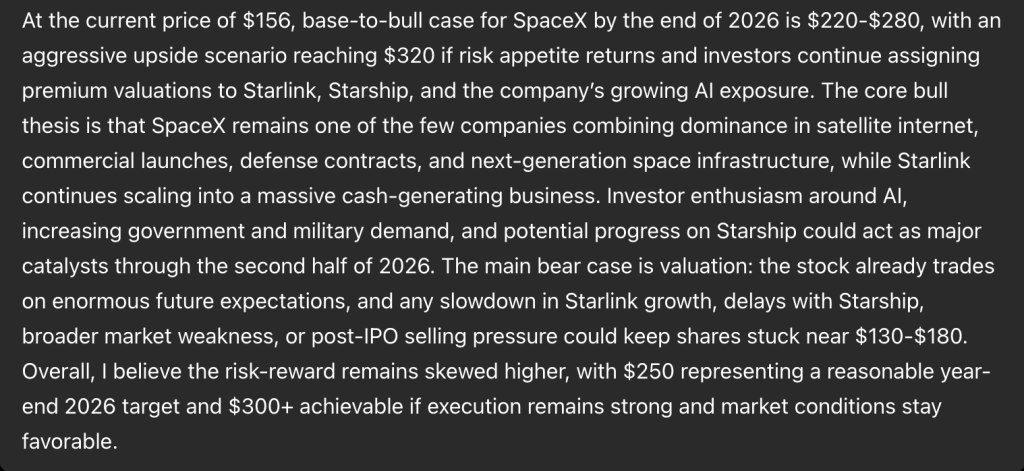
Rising government and military demand could act as a steady tailwind through the back half of 2026, and any real progress on Starship would give bulls a fresh headline to rally around.
If risk appetite returns broadly and investors keep assigning premium valuations to this combination of businesses, the model sees $250 as a reasonable year-end target, with $300 or higher achievable if execution stays strong and conditions stay favorable.
The bear case comes down to one word: valuation. The stock already prices in enormous future expectations, leaving little room for disappointment.
Any slowdown in Starlink subscriber growth, delays with Starship, broader market weakness, or simple post IPO selling pressure as lockups expire could keep shares stuck in the $130 to $180 range for a while instead of breaking higher.
SpaceX Price Prediction: SPCX Stock Tests Gravity After Its Record-Setting Launch
The intraday chart shows SpaceX trading at $156.06 after a turbulent first two weeks as a public company. Shares spiked from their IPO base into the low $220s before rolling over hard, then chopped through a series of lower highs on the way back down toward $150.
That kind of explosive debut, followed by a sharp pullback, is common for mega-cap IPOs once early momentum buyers take profits and lockup dynamics start to weigh on sentiment.
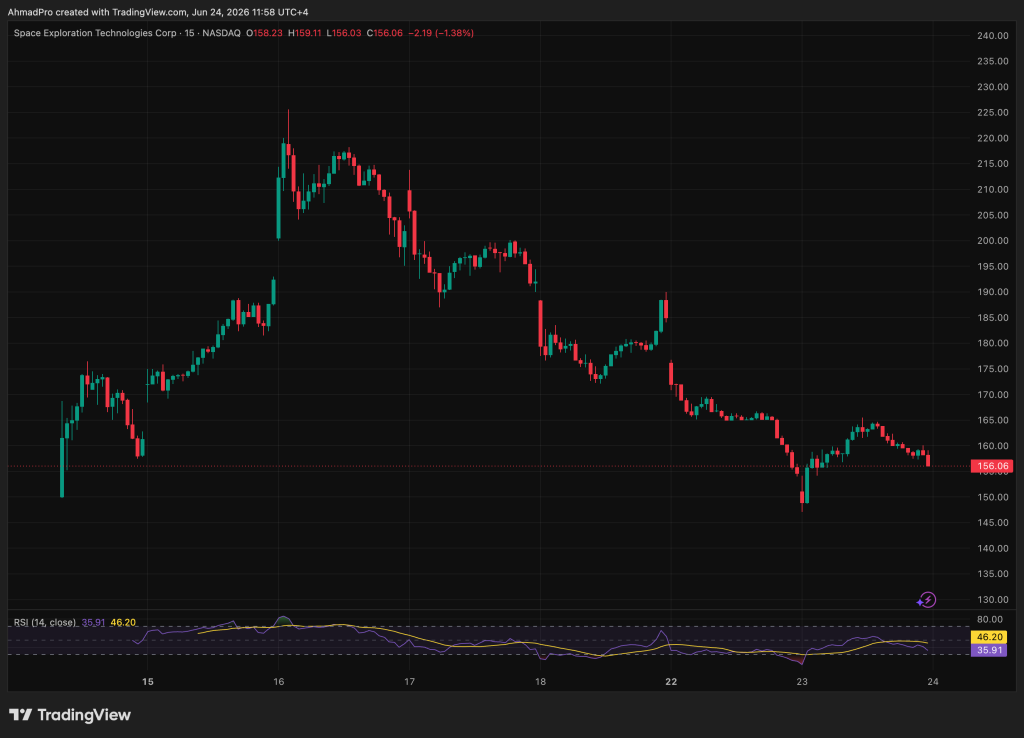
Price recently found support near $150, bounced toward $190, then faded again into the current $156 level, which puts it right in the middle of that post IPO trading range.
Immediate resistance sits near $165, then a tougher ceiling around $190 where the last bounce attempt stalled out. Support holds at $150, the same zone defended during the sharpest part of the recent selloff.
RSI is reading 35.91 against a signal line of 46.20, putting momentum well below its own average and firmly in weak territory for this short trading history. That wide negative gap signals sellers are still very much in control right now.
Overall momentum looks shaky rather than stabilizing at this point. Given how fresh this listing is, SpaceX will likely need to hold $150 and reclaim $190 before the $250 target starts looking like anything more than a longer-term bet on the story rather than the chart.
Don’t Miss Out on Our $1,000 USDT Airdrop on ByBit
LiquidChain Is Catching the Attention of SpaceX holders: ChatGPT AI Predicts It’s the Next 100x
The rotation is already happening. Most people will only see it in hindsight.
Large-cap crypto is not failing. It is capped. Bitcoin, Ethereum, and XRP have been pressing against the same resistance bands for weeks. The macro tailwinds keep getting delayed.
The institutional inflows keep getting pushed to next quarter. Holding assets where the upside depends on catalysts you cannot control is not a strategy. It is waiting.
A capital that has navigated enough cycles does not wait at resistance. It moves before the destination becomes obvious.
Early-stage infrastructure plays operate on different math entirely. A small enough market cap means a modest rotation produces dramatic price movement. The asymmetry exists because the market has not priced in what is being built yet. That gap between current valuation and what the project is actually worth is where the returns come from.
Multi-chain fragmentation costs DeFi real money every single day. Bitcoin, Ethereum, and Solana run completely isolated liquidity systems with no native way to connect them. Every user moving value between ecosystems absorbs that cost directly in fees, slippage, and failed transactions.
LiquidChain collapses all 3 networks into a single execution layer. One deployment. Full ecosystem access. No cross-chain tax on every interaction.
The market has not found this yet. That is the entire point.
The presale is at $0.01454 with just over $820,000 raised. Ground floor is not a marketing phrase here. It is a description of where this actually sits in its lifecycle.
Execution is unproven. Adoption is unknown. Those risks are real and worth naming directly. Established assets offer a smoother ride toward a ceiling that is already visible. This offers an earlier seat at a table that has not been set yet.
Explore the LiquidChain Presale
The post Sam Altman ChatGPT AI Predicts SpaceX Stock Price By End of 2026 appeared first on Cryptonews.
Deutsche Bank warned that gold could fall to about $3,800 an ounce if the Federal Reserve delivers three to four rate hikes, a scenario that would deepen the metal’s slide.
The downside case sits alongside fresh forecast cuts. Deutsche Bank follows Goldman Sachs, which cut its year-end target to $4,900 an ounce from $5,400.
Gold Faces Deeper Drop on Fed Hikes
In a note published on Tuesday, the bank noted that “hawks are driving out bulls” in the gold market. The bank now forecasts gold at $4,300 per ounce in the third quarter, more than 22% below its previous estimate and $4,800 in the fourth quarter. Even that year-end target marks a roughly 17% cut from its earlier forecast.
Analyst Michael Hsueh said the revised fourth-quarter outlook assumes the Federal Reserve keeps interest rates unchanged. A run of hikes would change that math.
Three to four rate hikes could push gold prices about 7% below current levels. The warning comes as expectations for US monetary policy continue to shift.
Notably, Bank of America recently suggested that the Federal Reserve could implement as many as three rate hikes in 2026.
Deutsche Bank added that the repricing of Fed expectations, coupled with resilient US economic data, has weighed on bullion prices.
Higher rates lift real yields, which weigh on gold because the metal pays no interest. Shifting rate expectations have already driven the recent selloff.
Follow us on X to get the latest news as it happens
Banks Temper Bullish Gold Calls
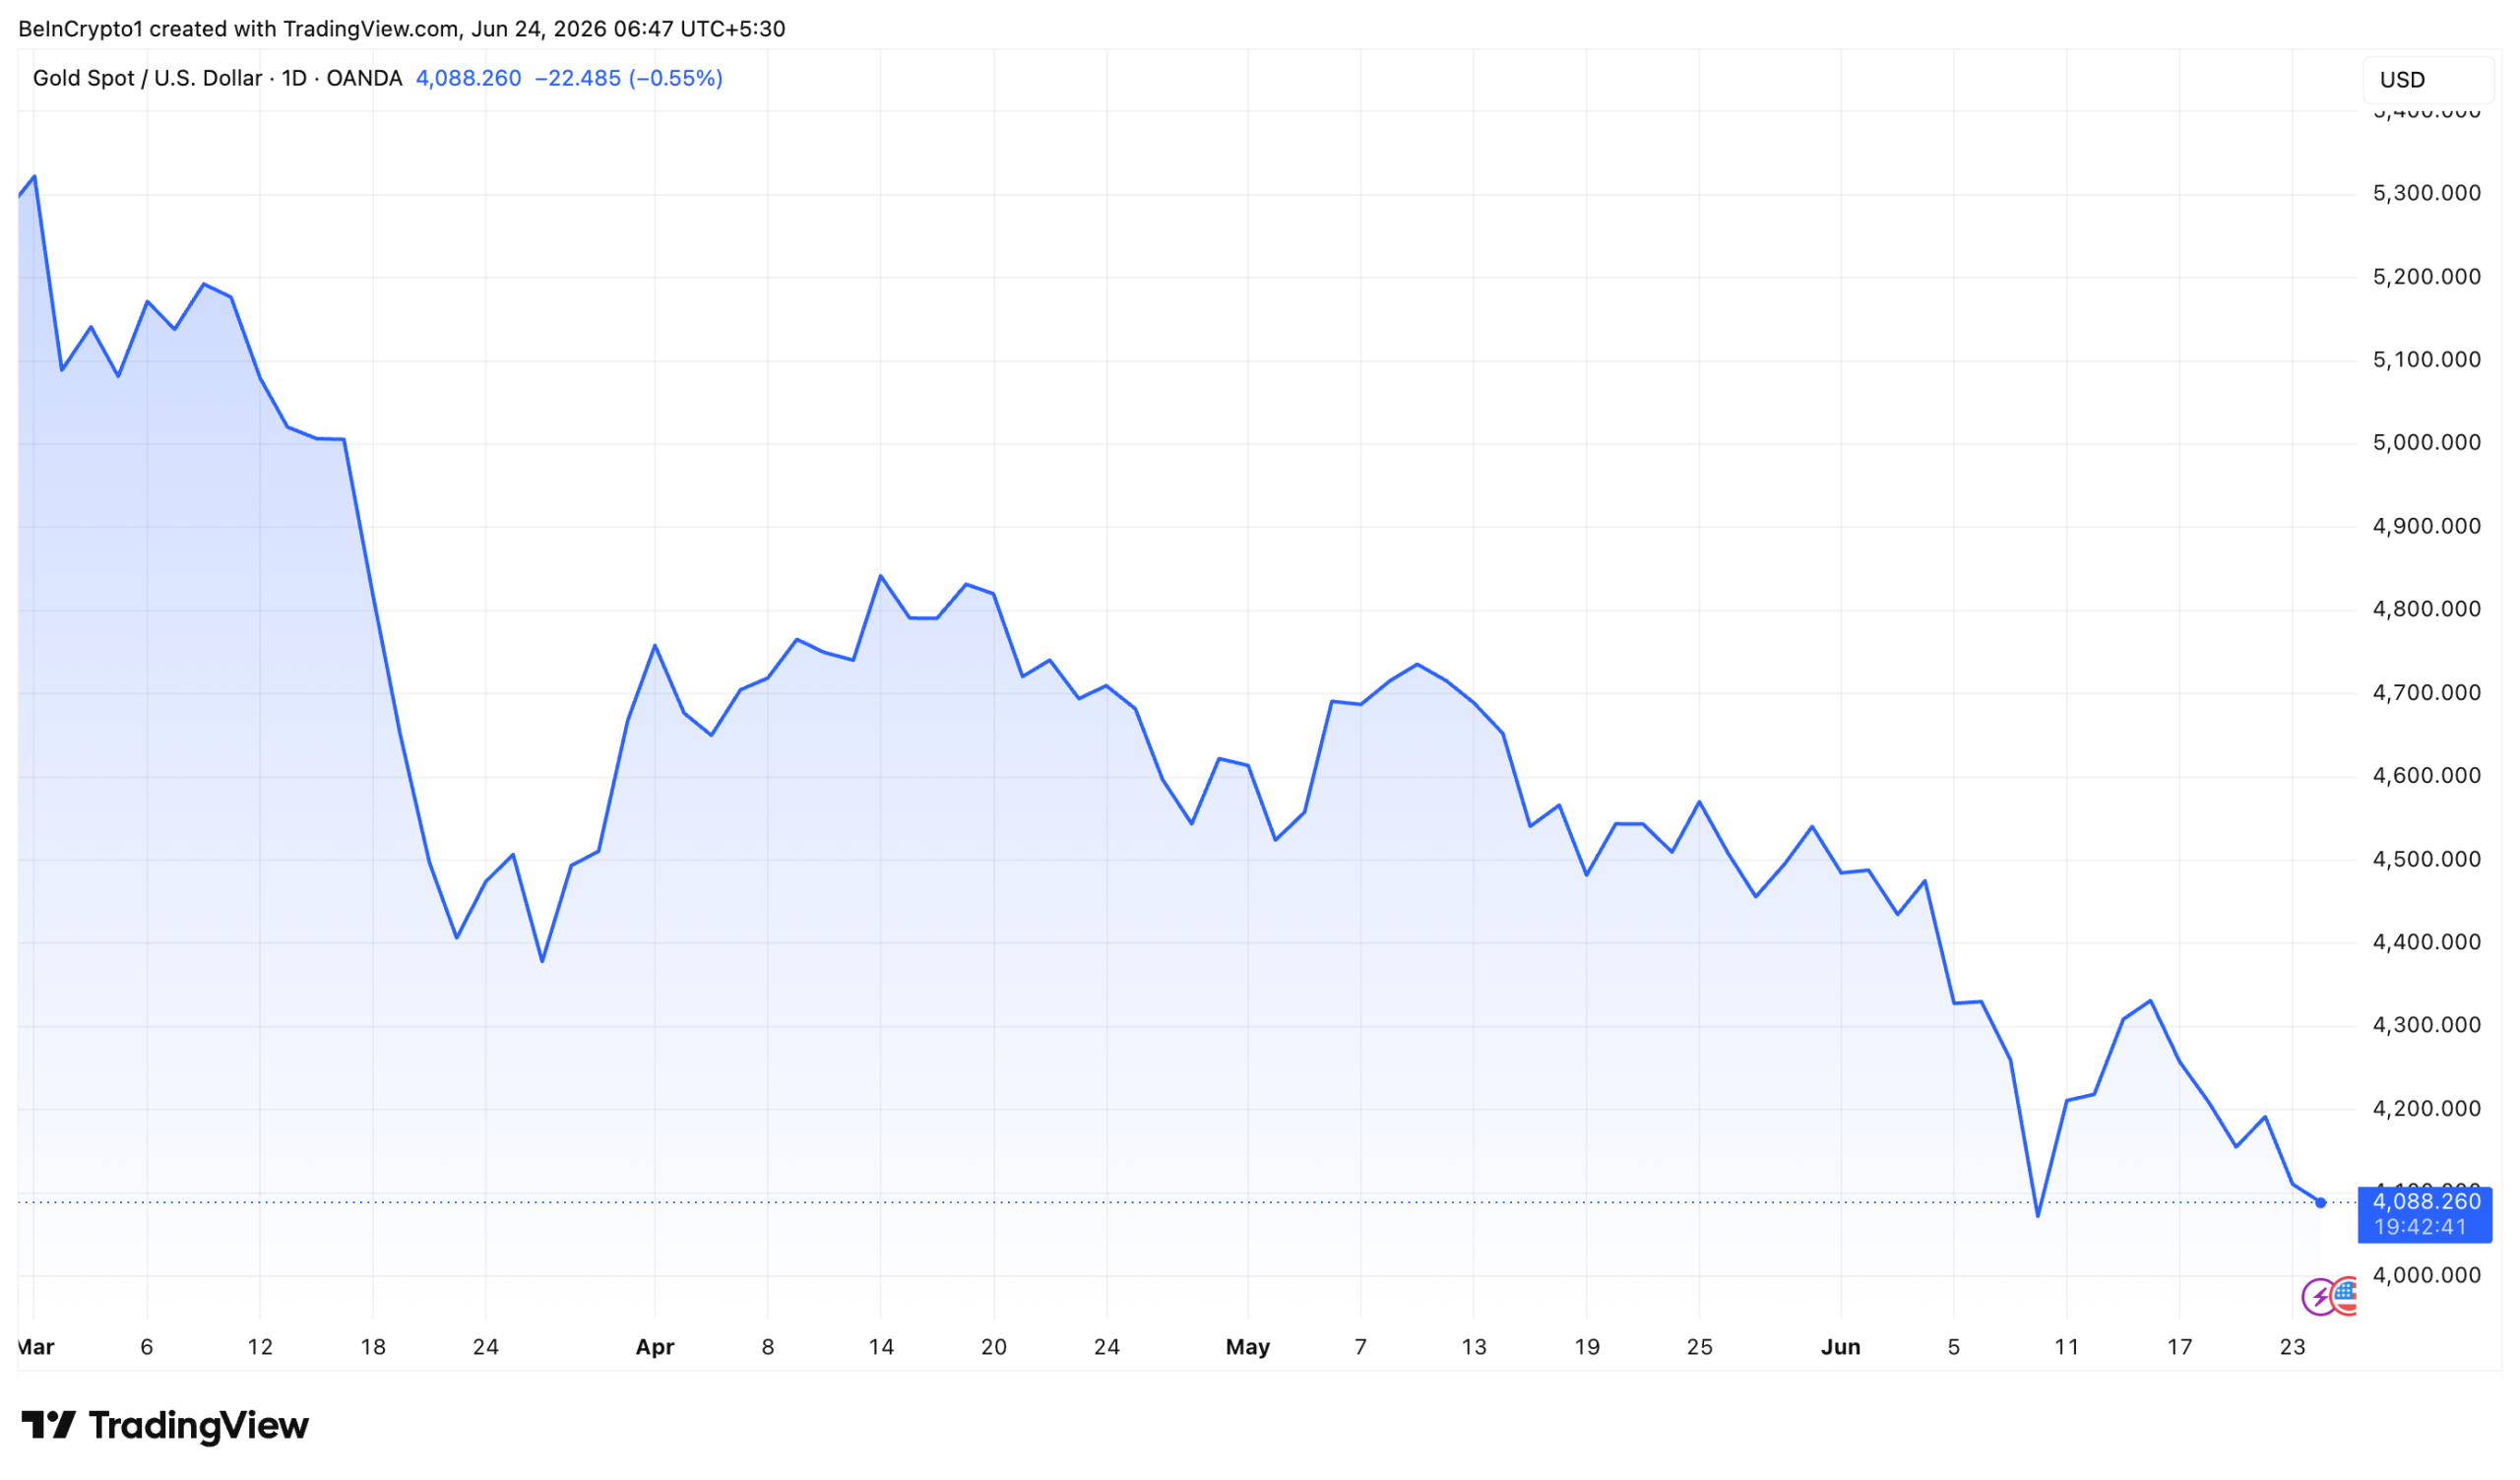
Gold has slumped more than 21% since early March. A January surge to record highs reversed after the US-Iran conflict lifted energy prices and stoked rate-hike bets.
Spot gold has now dropped below $4,100. It traded near $4,088 on Wednesday, down nearly 1% on the day.

Federal Reserve Chair Kevin Warsh left interest rates unchanged at his first FOMC meeting. Yet, nine of the 18 policymakers expect at least one rate increase in 2026.
The shift in tone reinforces downside risks for gold, keeping the possibility of a drop toward $3,800 firmly on the table.
Subscribe to our YouTube channel to watch leaders and journalists provide expert insights
The post Deutsche Bank Flags $3,800 Gold Risk as Fed Turns Hawkish appeared first on BeInCrypto.
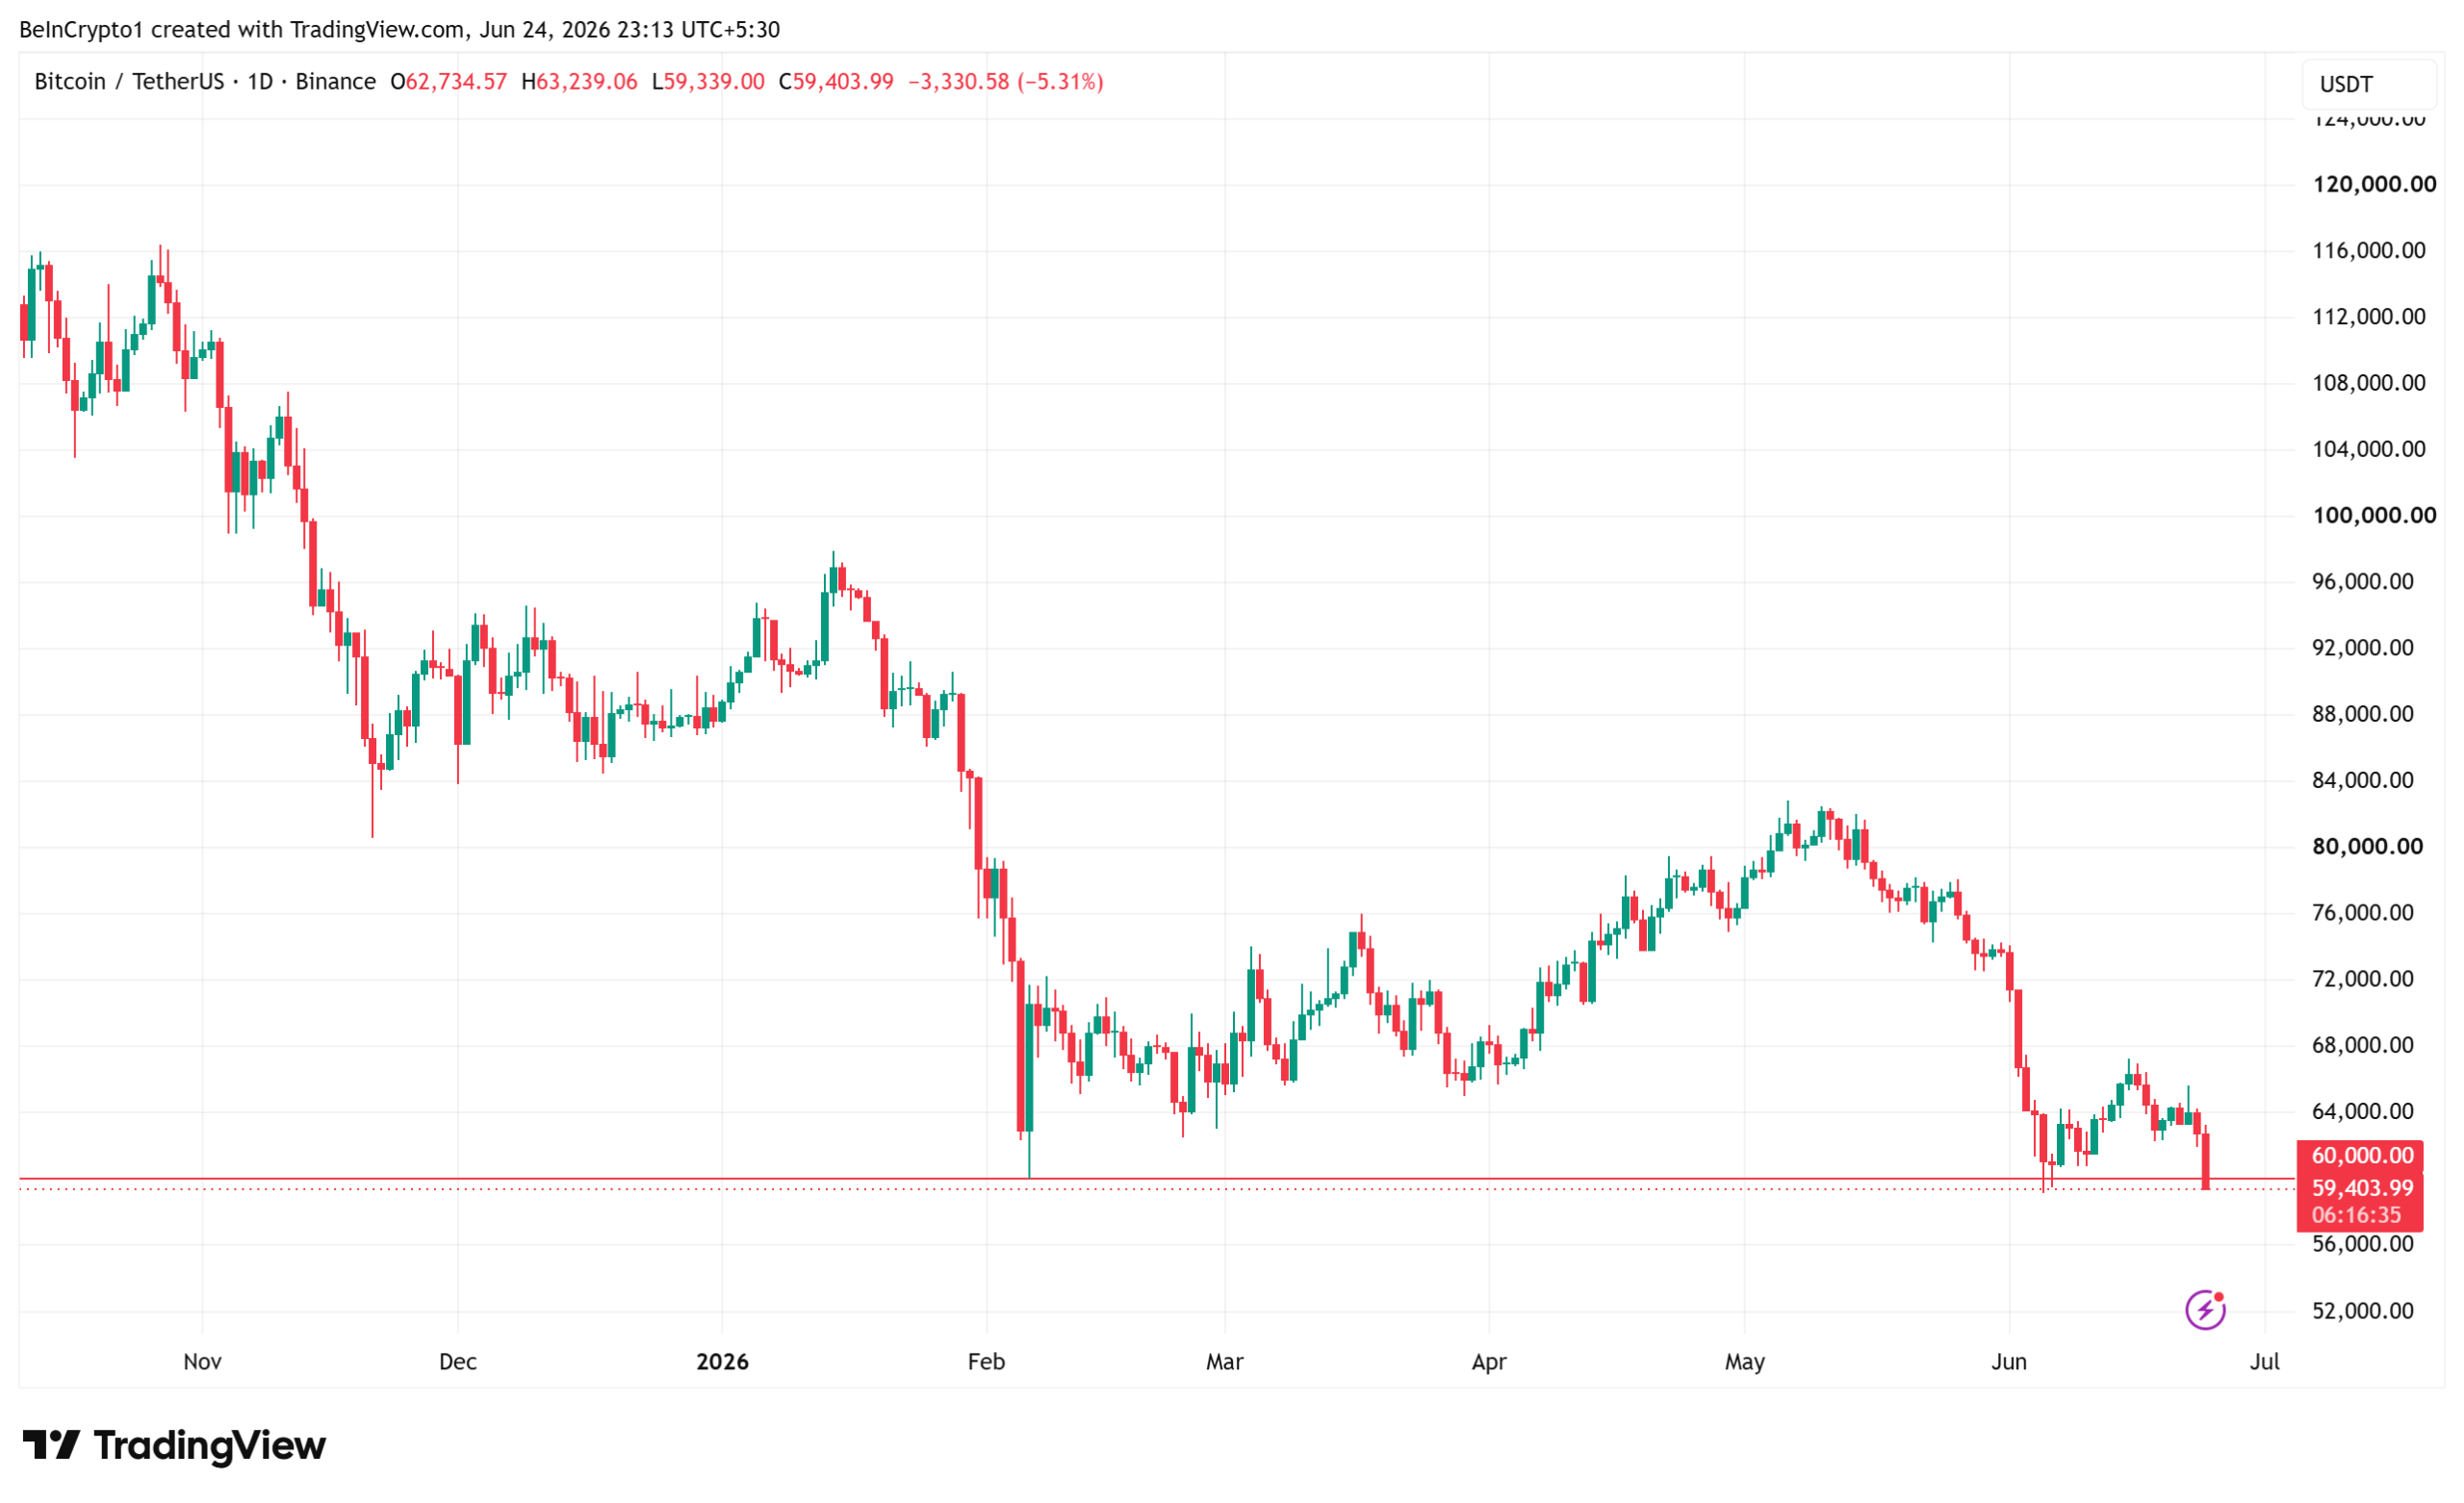
Bitcoin (BTC) fell below $60,000 again on Wednesday, this time with a steeper decline than the two previous instances in early June.
However, despite the breach, 21Shares still says the four-year cycle has not broken. The crypto asset manager had forecast that institutional demand would end Bitcoin’s halving-driven pattern in 2026.

Its mid-year report now says the opposite.
Why the Four-Year Cycle Still Holds
Bitcoin recorded an intra-day low of $59,102 as of this writing, down nearly 5% over 24 hours. The token has fallen more than 50% from its $126,080 record set in October 2025. It marks the third time the pioneer crypto falls below $60,000 this month.
Bitcoin has peaked 12 to 18 months after each past halving, then fallen hard. The April 2024 halving fed the run to October’s record, and the current slump tracks the same path.

In its latest State of Crypto report, 21Shares said the decline still mirrors past post-halving corrections. The firm had entered the year expecting Bitcoin’s four-year cycle to finally break.
“Heading into 2026, we believed that Bitcoin’s four-year cycle could be finished. Six months in, we have to be honest: price action still looks familiar,” read an excerpt in the report.
Follow us on X to get the latest news as it happens
The drawdown still looks mild next to the past two cycles. Glassnode data show Bitcoin fell about 84% after its 2017 peak and 77% after the 2021 peak.
Even while trading below $60,000, Bitcoin holds above the roughly $54,000 cost basis the report flags. That suggests sellers have not fully capitulated.
Institutional Money Cushions the Drop
21Shares built its original call on heavy exchange-traded fund (ETF) inflows and growing institutional adoption. It expected those forces to soften the boom-and-bust rhythm tied to Bitcoin’s halving.
Ownership has indeed grown more institutional, which the firm says makes capital stickier through downturns. Through late May, it counted about $3 billion in net ETF outflows.
The bleed has since deepened into a record outflow streak in June. Even so, net ETF inflows since the 2024 launch still total roughly $53 billion, SoSoValue data shows.

21Shares still expects that institutional base to support a recovery toward $100,000 by year-end, not a breakout to new highs.
Not Every Analyst Sees a Soft Landing
Other voices see more pain ahead. BitMEX co-founder Arthur Hayes expects a $40,000 bottom within six months, well below the cost basis 21Shares watches.
Hayes points to a hawkish Federal Reserve, where traders now put December rate-hike odds near 37% on CME FedWatch. He stays long while hedging with options, a stance that captures the current unease.
Thursday’s inflation reading and the Fed’s next moves may decide which view holds. A softer print could ease pressure, while another hot number may invite a deeper test of support.
The post 21Shares Concedes 4-Year Cycle Intact as Bitcoin Falls Below $60,000 Again appeared first on BeInCrypto.

Key Takeaways
- ASML shares tumbled 7.82% to close at $1,778.46, significantly lagging broader market indices
- Allegations surfaced regarding possible violations of U.S. export control regulations related to Chinese sales
- Proposed bipartisan legislation threatens to halt all deep-ultraviolet lithography (DUV) equipment exports to China
- Chinese market represents approximately 20% of ASML’s anticipated 2026 revenues
- Despite volatility, Wells Fargo upgraded price target to $2,200 with consensus rating at Moderate Buy
Shares of ASML (ASML) experienced a sharp decline on Tuesday, closing at $1,778.46—a 7.82% drop that significantly outpaced the broader market’s losses. While the S&P 500 shed 1.44% and the Nasdaq fell 2.22% during the same trading session, ASML’s pullback was notably steeper.
The semiconductor equipment manufacturer’s slide followed reports that U.S. officials have raised concerns about possible export control violations involving the company’s business with China. Compounding investor anxiety, a bipartisan legislative proposal now threatens to completely prohibit deep-ultraviolet (DUV) lithography equipment shipments to the Chinese market.
The stakes are substantial: China is projected to contribute approximately 20% of ASML’s total revenue stream in 2026, making this exposure a critical focal point for market participants.
ASML issued a formal denial of the allegations, clarifying that no extreme ultraviolet (EUV) systems were shipped to China in breach of existing controls. While this statement may mitigate some reputational risk, regulatory scrutiny appears likely to intensify.
Beyond the immediate allegations, market participants are increasingly concerned about potential restrictions on software updates, spare parts, and maintenance services for equipment already deployed in China. This ongoing service revenue has represented a significant, albeit understated, contributor to ASML’s financial performance.
Competitive dynamics add another layer of complexity. Nikon has been expanding its presence in mature-node immersion lithography systems, while Chinese domestic manufacturers continue advancing their indigenous capabilities—developments that could exert downward pressure on both pricing and profit margins in ASML’s lower-tier product segments.
Upcoming Earnings Release
Despite Tuesday’s selloff, ASML’s fundamental performance metrics remain robust. The company is scheduled to report quarterly results on July 15, 2026. Wall Street analysts project earnings per share of $7.98, representing a substantial 75.38% year-over-year increase.
Second-quarter revenue estimates stand at $10.28 billion, reflecting 17.83% growth compared to the prior-year period. Full-year consensus forecasts call for EPS of $36.69 and revenues of $45.35 billion—representing increases of 31.27% and 22.67%, respectively.
In the most recent quarter, ASML delivered EPS of $8.28 on $10.15 billion in revenue, achieving a return on equity of 48.69% and maintaining a net profit margin of 27.65%.
The stock currently trades at a forward price-to-earnings multiple of 52.58, above the industry average of 47.43. Its price-to-earnings-growth (PEG) ratio of 1.55 also exceeds the sector norm of 1.48.
Wall Street Maintains Cautious Optimism
Despite the recent volatility, analyst sentiment remains generally supportive. Wells Fargo elevated its price objective from $1,750 to $2,200 while maintaining an overweight rating. Bank of America similarly increased its target price and retained a Buy recommendation.
Morgan Stanley and Barclays have both reaffirmed overweight ratings in recent research updates.
The Street consensus stands at Moderate Buy, comprising four Strong Buy ratings, 20 Buy recommendations, five Hold ratings, and three Sell calls. The average price target of $1,772.62 closely aligns with Tuesday’s closing price.
However, not all institutional investors are holding steady. Riverbridge Partners LLC reduced its ASML position by 40.3% during the first quarter, divesting 1,201 shares. Following this reduction, the firm maintained 1,781 shares valued at approximately $2.35 million.
From a technical perspective, ASML’s 50-day moving average sits at $1,610.59, while the 200-day moving average stands at $1,411.79, suggesting the stock retains a cushion before testing long-term support levels. The 52-week trading range spans from $683.48 to $1,959.04.
ASML currently carries a Zacks Rank of #3 (Hold), with earnings per share estimates revised downward by 1.11% over the past month.


Kalshi has filed a federal lawsuit challenging a new Illinois law that would require prediction market platforms offering sports event contracts to obtain state licenses before operating.
Summary
- Kalshi has sued Illinois, arguing the state’s sports prediction market law violates federal authority.
- The company says complying with the law would conflict with CFTC rules and create unrecoverable costs.
- The lawsuit comes as Kalshi pursues a reported $40 billion valuation and expands its crypto product lineup.
According to a filing submitted Tuesday in the U.S. District Court for the Northern District of Illinois, Kalshi sued Illinois Governor JB Pritzker, Attorney General Kwame Raoul, members of the Illinois Gaming Board, and other state officials, arguing that the state has overstepped federal authority over regulated prediction markets.
The complaint targets Illinois Senate Bill 3019, which was signed into law last week as part of the state’s fiscal year 2027 budget package. Kalshi argued that the legislation unlawfully interferes with the Commodity Exchange Act by treating sports event contracts offered on federally regulated prediction markets as sports wagers subject to state licensing requirements. The company said the law is scheduled to take effect on July 1.
Kalshi says federal rules override Illinois licensing requirements
According to the complaint, Kalshi believes the Commodity Futures Trading Commission has exclusive authority over its event contracts because they are regulated under the Commodity Exchange Act. The company alleged that Illinois cannot impose an additional licensing system on products already overseen by the federal regulator.
Kalshi argued that stopping sports event contracts in Illinois would leave the company in conflict with the CFTC’s requirement to operate a uniform national market. The filing also claimed that restricting Illinois users would force Kalshi to build costly technology systems to block access in the state, expenses it said could not be recovered even if it later won the case.
At the same time, the complaint argued that complying with Illinois’s licensing framework would expose the company to another set of costly regulatory obligations. According to Kalshi, ignoring the new law is also not a practical option because state enforcement could include criminal penalties.
The disputed legislation also introduced a 0.2% tax on cryptocurrency transactions, a measure that has already drawn criticism from several participants in the digital asset industry.
In addition, the law expanded the state’s definition of an “exchange wager” to include agreements, contracts, transactions, or swaps traded on prediction markets when tied to sporting contests, placing those products under the same rules as traditional sports betting operators.
Legal dispute grows as Kalshi expands business
The Illinois case adds to a series of legal disputes over whether states or the federal government has primary authority over sports-related prediction markets.
The CFTC, now led by Commissioner Michael Selig, has maintained that prediction market event contracts fall under its jurisdiction because they qualify as swaps under federal law. Federal regulators have already challenged similar state actions, including recent litigation involving restrictions imposed in Kentucky.
Legal analysts have suggested that the conflicting positions taken by state gaming regulators and federal authorities could eventually require resolution by the U.S. Supreme Court if lower courts continue reaching different conclusions.
Meanwhile, the lawsuit comes as Kalshi continues expanding its business. The company has reportedly entered discussions to raise fresh funding at a valuation of about $40 billion, up from the $22 billion valuation it secured less than two months ago.
Sports-related contracts account for roughly 65% of trading volume, according to company data, while multi-outcome combination contracts introduced last year have become one of its fastest-growing products.
Recent product launches have also extended Kalshi’s regulated offerings. As reported by crypto.news, on June 24, the company added perpetual crypto futures tied to Zcash, Near Protocol, and Shiba Inu, increasing its CFTC-regulated lineup to 13 digital assets operating under contracts without expiration dates.
Crypto markets sold off hard on June 24, wiping out more than $600 million in leveraged long positions within hours. Bitcoin and Ethereum absorbed the heaviest of the crypto liquidations.
The drop was broad rather than isolated. Nearly every major token turned red, and the forced selling concentrated on the largest exchanges. Binance led every venue.
Red Floods the Market
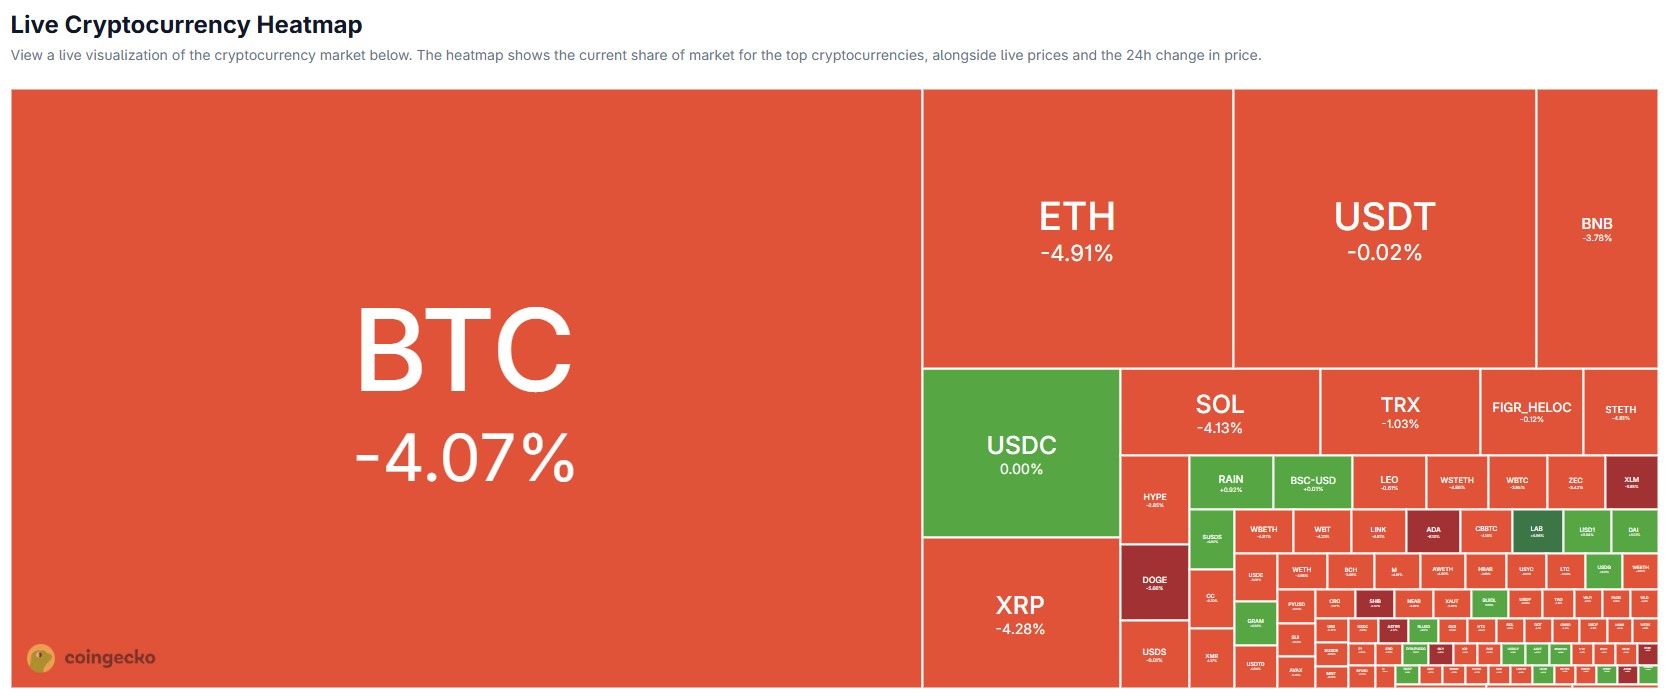
A live cryptocurrency heatmap captured the scale of the rout. Bitcoin (BTC) showed a 4.07% daily loss on the snapshot, while Ethereum (ETH) fell 4.91%.
Large caps followed in lockstep. XRP dropped 4.28%, Solana (SOL) lost 4.13%, and BNB slid 3.78%. Dogecoin (DOGE) ranked as the worst major performer at 5.86%.

The uniform selling pointed to risk-off pressure rather than a single token story. By press time the 24-hour declines had eased, with Bitcoin near $60,585 and Ethereum around $1,606 after a modest intraday bounce.
Longs Bear the Brunt of the Flush
The selloff was a leverage event. A 12-hour liquidation heatmap showed traders betting on higher prices getting wiped out across the board.
Bitcoin led with $336.47 million in liquidated longs. Ethereum followed at $188.82 million. Solana added $39.09 million, while a broad Others group totaled $70.80 million.

Centralized venues took the largest hits. Binance recorded $350.58 million in liquidations, far ahead of the field.
Hyperliquid placed second at $147.24 million, a notable showing for a decentralized exchange. Bybit followed with $120.08 million, then Gate at $55.89 million and OKX near $47.84 million.

Crypto Liquidations: Bitcoin Hinges on $63,000 Wall
The Binance BTC/USDT liquidation leverage heatmap explains why any Ethereum and Bitcoin bounce may struggle. Bitcoin traded flat near $63,000 for most of June 23 before breaking down.
Price stair-stepped lower through June 24, sliding toward $59,700 before steadying around $60,000. The descent cut straight through dense liquidation clusters.
Those bright clusters now sit overhead between $61,500 and $63,000. They mark heavy leverage that could act as resistance on any rebound.

A reclaim of $63,000 would invalidate the bearish setup. A loss of the $59,700 support could expose lower levels and trigger another cascade.
Bitcoin now sits between a wall of overhead liquidations and a thin floor below. The next move depends on which level breaks first.
The post $600M Wiped Out in Hours: Crypto’s Leverage Bloodbath Just Hit BTC and ETH Hardest appeared first on BeInCrypto.
Crypto World
Wall Street AI Watch: Micron (MU) Results, SK Hynix $29B Listing, and Chip Stock Recovery

Quick Summary
- Micron’s quarterly report served as a critical barometer for ongoing AI infrastructure investment
- Chip stocks like Nvidia and Broadcom rebounded strongly following this week’s earlier downturn
- SK Hynix unveiled plans for a U.S. stock market debut potentially worth $29 billion
- The Nasdaq regained ground after multiple days of technology-led losses
- Cerebras delivered earnings results, offering insight into specialized AI chip demand
Artificial intelligence remained front and center across financial markets today. Between quarterly earnings announcements and a blockbuster listing reveal, semiconductor companies commanded attention from traders and investors alike.
Micron’s Report Becomes AI Demand Litmus Test
[[LINK_START_0]]Micron’s quarterly earnings release[[LINK_END_0]] stood as the session’s most anticipated event.
Market participants track Micron carefully since its memory products power AI servers and data center infrastructure. Robust performance in these segments indicates continued aggressive spending by hyperscalers on artificial intelligence capabilities.
Anticipation ran high ahead of the announcement. Micron shares had delivered solid returns throughout 2026, leaving Wall Street eager for validation that high-bandwidth memory sales momentum persisted.
The implications extended well beyond a single company’s performance. Positive figures would reinforce optimism about semiconductor industry health. Disappointing numbers might trigger concerns about the actual pace of AI capital expenditure growth.
Few quarterly reports this season attracted comparable investor scrutiny.
Chip Sector Mounts Strong Recovery
Following recent pressure, semiconductor equities rallied meaningfully.
Nvidia, [[LINK_START_1]]Broadcom[[LINK_END_1]], and Intel all posted gains as capital flowed back into AI-linked stocks. The price action indicated many market participants viewed the recent selloff as an entry point rather than a fundamental warning.
AI-related capital spending continues representing one of the market’s most powerful tailwinds.
Hyperscale cloud providers maintain multi-billion-dollar commitments to data center expansion, advanced processors, and networking infrastructure. Today’s recovery demonstrated that underlying conviction in the sector remains intact.
Volatility has increased noticeably, yet demand emerged swiftly at lower price levels.
SK Hynix Announces Plans for $29 Billion U.S. Market Debut
The session’s most significant corporate development originated from SK Hynix.
The South Korean memory manufacturer disclosed intentions to pursue a United States listing in a transaction potentially generating approximately $29 billion. Upon completion, this would represent one of the largest public offerings on record.
[[LINK_START_2]]SK Hynix[[LINK_END_2]] specializes in high-bandwidth memory production, a critical component enabling contemporary AI system performance.
A U.S. market presence would provide investors with direct exposure to one of the most sought-after segments within the semiconductor value chain. The announcement underscores extraordinary investor appetite for AI-connected equity opportunities.
Nasdaq Composite Regains Momentum
The [[LINK_START_3]]Nasdaq[[LINK_END_3]] index posted positive returns following multiple consecutive down sessions.
Technology shares paced the advance as market participants grew increasingly comfortable with current valuations after the recent correction. While inflation and monetary policy concerns persist, buying interest nonetheless materialized.
The rebound indicates investors remain prepared to add exposure when high-quality technology companies experience pullbacks.
Semiconductors, AI infrastructure providers, and cloud computing firms continue leading broader market performance over the trailing twelve months.
Cerebras Provides Additional AI Sector Perspective
[[LINK_START_4]]Cerebras[[LINK_END_4]] published quarterly results as well, capturing attention from investors seeking exposure beyond dominant chip manufacturers.
The firm produces processors engineered exclusively for artificial intelligence computing tasks. Its financial performance offered visibility into demand patterns for specialized hardware operating outside Nvidia’s ecosystem.
The report contributed additional data points suggesting AI hardware investment remains broadly distributed rather than concentrated among just a handful of suppliers.
Investors continue monitoring emerging players like Cerebras to gauge the true breadth of AI infrastructure deployment.
The quarterly figures reinforced that artificial intelligence maintains its position as the defining investment theme propelling technology sector allocation as 2026 progresses.
The old saying – sell in May and go away – proved to be right once again for the cryptocurrency markets. It was just six weeks ago when bitcoin had evidently reclaimed the $80,000 level and even surged to a multi-month peak at almost $83,000. The sentiment was gradually improving and there were even calls for $100,000 by the summer.
However, the tides turned viciously and the asset was rejected vigorously. Its decline since then has been nothing short of painful, dumping below $60,000 earlier today for the second time in June.
Is This Why?
Popular analyst Ali Martinez brought out the Coinbase Premium metric earlier today as the markets were crashing to fresh low. CryptoPotato reported when BTC dumped below $60,000 but managed to maintain above the $59,000 level and has now reclaimed the former.
According to Martinez, though, the metric that stands out the most for the past six weeks or so is the one that tracks how much BTC costs on Coinbase compared to Binance. In general, if the Premium is in the green, it means US investors (typically institutions) are accumulating bitcoin en masse on Coinbase, pushing its price there above the levels on international exchanges.
However, the last 46 days have not seen such green days. Or, as Martinez put it:
“A negative premium means BTC is trading cheaper on Coinbase, suggesting that US institutional buying pressure has dried up.”
He believes this slowdown mimics the massive investor exodus from the US-based spot Bitcoin ETFs. The funds have bled approximately $5 billion in essentially the same timeframe because “American smart money appears to be sitting on the sidelines, waiting for macroeconomic clarity before re-entering the accumulation phase.”

Other Plausible Reasons
As we recently noted, the ETFs are indeed among the many possible reasons behind BTC’s latest leg down. Others include the uncertainty around the war against Iran, strengthening dollar, or even some OG investors selling off. However, another biggie that stands out is the FUD around Strategy and its Stretch shares.
STRC has dumped below its par price of $100, currently trading at a hefty discount at $80. This essentially increases the pressure that the BTC-buying machine is under as the ‘flywheel’ effect is disrupted and the company now has to pay higher yield. According to some analysts, this could result in massive BTC sales from Strategy.
The post Is This the Hidden Reason Behind Bitcoin’s $23K Collapse in Just 6 Weeks? appeared first on CryptoPotato.
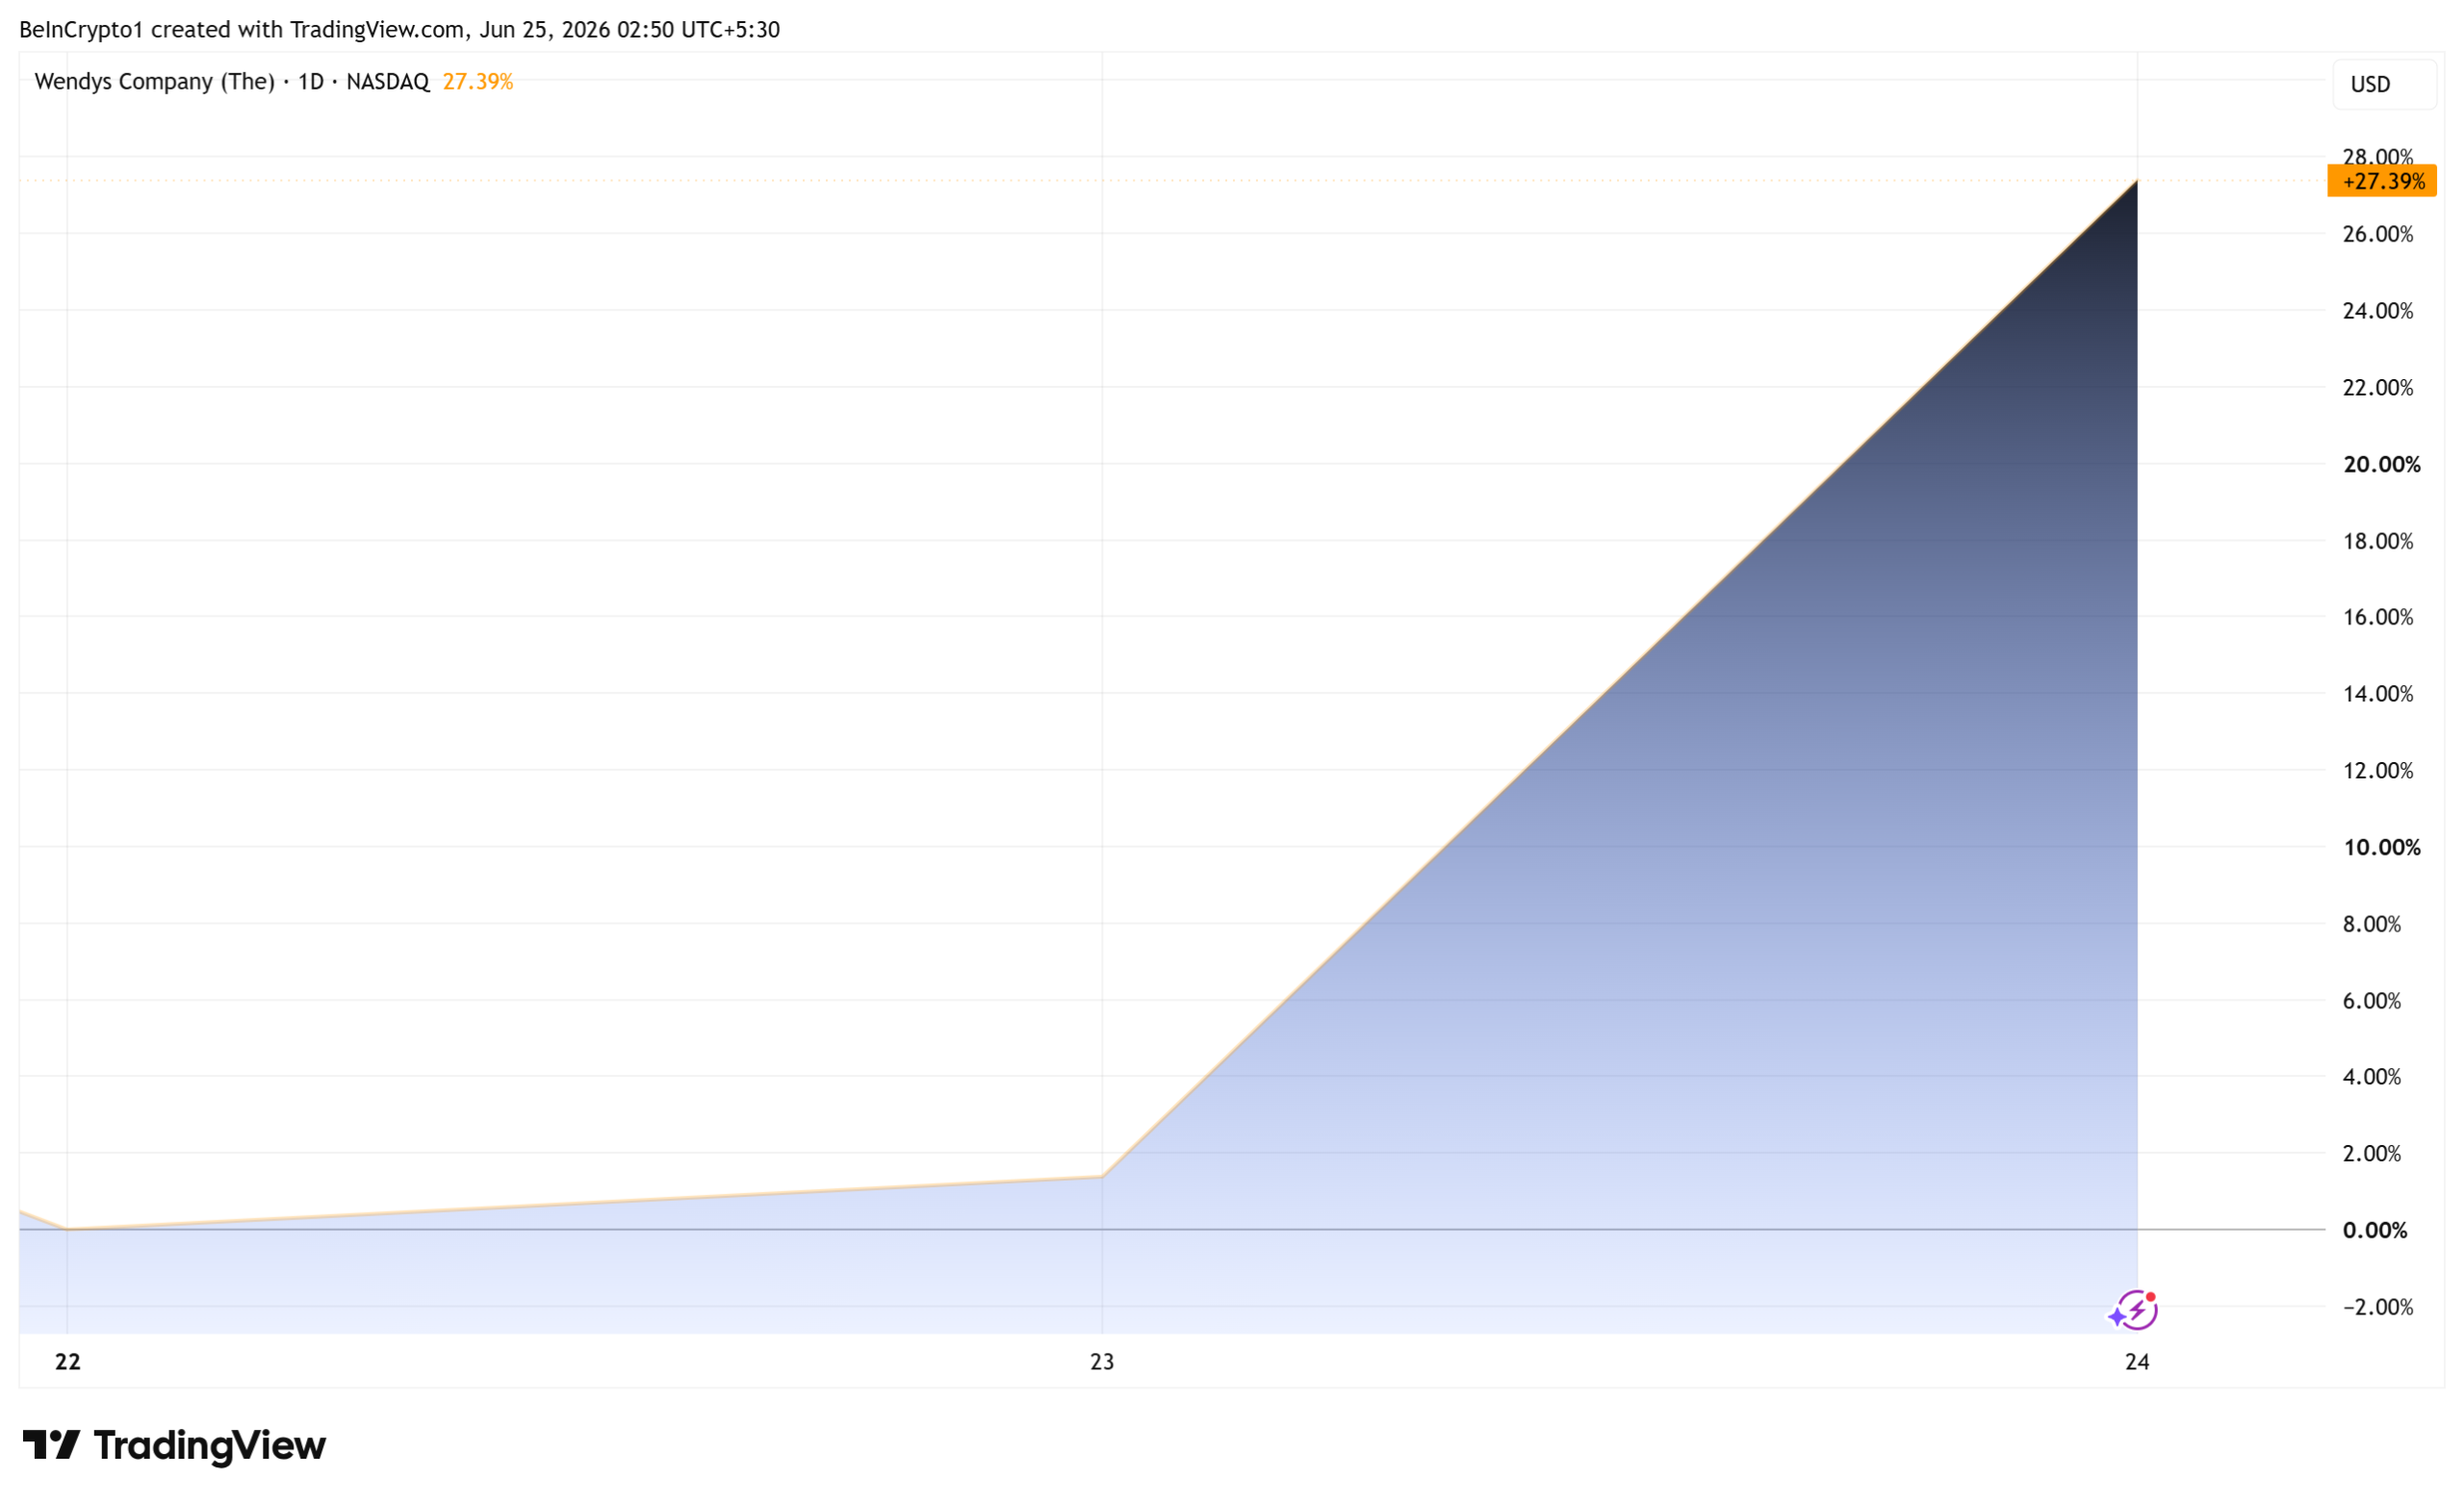
Wendy’s stock climbed almost 30% on Wednesday after traders on Reddit’s WallStreetBets forum rallied behind the struggling burger chain, reviving the meme-stock playbook that powered GameStop in 2021.
The rally lifted Wendy’s shares (WEN) to an intraday high near $8.89 and triggered at least one volatility halt, even as sales keep sliding.

Why Wendy’s Stock Drew a Short Squeeze
The move started with a since-deleted WallStreetBets post that urged members to rescue the chain before it collapsed. Copycat posts showing share and options purchases quickly followed.

“Save Wendy’s before it’s too late,” the post read.
Follow us on X to get the latest news as it happens
Volume confirmed the frenzy. More than 202 million shares changed hands, over 15 times the recent average.
The stock logged its biggest single-day gain since March 2020, CNBC reported. Wendy’s had ended the prior session near $6.26, not far from a multiyear low.
The squeeze setup is real but far smaller than 2021. About 23% of Wendy’s float was sold short before the rally, according to S3 Partners. The same firm put GameStop’s short interest above 140% of its float ahead of the 2021 squeeze.
Rising prices can still force shorts to buy back stock, which pushes prices higher. That pattern drove the AMC and GameStop squeeze, and it resurfaced this year during the GameStop meme stock frenzy.
A CFO Hire Gives Bulls a Story
Sentiment had a fundamental hook too. Wendy’s named Steve Cirulis chief financial officer on June 23, succeeding Ken Cook, according to a regulatory filing.
Cirulis ran finance at Potbelly alongside Bob Wright, now Wendy’s CEO. The company credits the pair with a more than 500% gain in Potbelly’s share price during their tenure.
That record gave retail buyers a turnaround story to chase, a familiar driver of meme driven market moves. The hire builds on a recovery plan the company calls Project Fresh.
Fundamentals Still Point Down
The business behind the rally remains weak. US same-restaurant sales fell 7.8% in the first quarter, and net income slid to $22.7 million.
Quarterly earnings still beat reduced forecasts, yet the rally rests on sentiment rather than results.
Wendy’s has been here before. A June 2021 Reddit post hailed Wendy’s as the perfect WallStreetBets stock and briefly drove shares up 26%. That rally faded within weeks because almost none of the stock was sold short.

This time a crowded short base gives the move real fuel. Still, most names lifted by Reddit traders and markets eventually gave back their gains.
Wendy’s gains holding may depend on how long the crowd stays interested.
The post Wendy’s Stock Climbs 30% as WallStreetBets Targets a GameStop Repeat appeared first on BeInCrypto.

![]()
Kalshi is seeking to raise fresh capital at a valuation of about $40 billion, nearly doubling the $22 billion valuation it targeted in its previous funding round, according to a Financial Times report citing people familiar with the matter.
The prediction markets platform could close the fundraising as soon as the third quarter of this year, FT said.
If completed, the deal would widen Kalshi’s valuation lead over rival Polymarket, which was last reported to be seeking funding at $15 billion. The two platforms have emerged as the dominant names in the prediction markets sector, while many other entrants have increased the industry’s competitive landscape.
Kalshi’s previous funding round, which valued the company at $22 billion, attracted a roster of high-profile investors including Philippe Laffont’s Coatue Management, Sequoia Capital, Andreessen Horowitz and Morgan Stanley.
Competition in the sector has intensified as firms race to capture users and expand product offerings.
Kalshi operates as a federally regulated exchange in the United States, a distinction that has helped it attract mainstream investors and institutional backing. Meanwhile, Polymarket, which uses blockchain infrastructure and cryptocurrency-based settlement, has gained popularity among crypto traders and has become widely followed during recent election cycles.

Admin throws Iran financial lifeline that upends decades of policy meant to deter nuclear program
This fishing village has a sandy cove, seaside pub and seafood sandwiches

Evertz Technologies Limited (ET:CA) Q4 2026 Earnings Call Transcript

No Jackpot Winner as $257 Million Prize Rolls Over to $269 Million Monday Draw

Blockchain.com files with SEC for U.S. IPO

Israel says it has killed new Hamas military leader in Gaza City airstrikes
Admin throws Iran financial lifeline that upends decades of policy meant to deter nuclear program
![We Are WEEKS Away From A MAJOR Price Explosion For XRP! XRP Holders ALL Need To PREPARE! [BUY XRP!]](https://wordupnews.com/wp-content/uploads/2026/06/1782344110_maxresdefault-80x80.jpg)
We Are WEEKS Away From A MAJOR Price Explosion For XRP! XRP Holders ALL Need To PREPARE! [BUY XRP!]

Money! – Kaytoven (money money green green) (Slowed + Reverb)
-

 Fashion5 days ago
Weekend Open Thread: Miami – Corporette.com
-

 Entertainment4 days ago
Renter of Home in Anne Heche Crash Denies Settlement With Son
-

 Tech2 days ago
Microsoft accidentally kills epic Outlook email threads
-
 Sports1 day ago
Two goals and an assist by sheer aura: Cristiano Ronaldo just entered the World Cup chat
-

 Business4 days ago
Soccer-U.S. defends Iran World Cup travel restrictions, says discussions ongoing
-
Crypto World20 hours ago
Bitcoin (BTC) Dips Below $62K, Ethereum (ETH) Plunges 6% Daily: Market Watch
-

 Politics6 days ago
BBC Reporter Discusses Cross Party Criticism Of Trumps Iran Deal
-

 Politics5 days ago
Andy Burnham and the meaning of Makerfield
-

 Crypto World17 hours ago
Securitize Wraps Roubini's SEC-Registered ETF as Dubai VARA Digital Security
-
Business23 hours ago
Entergy settles forward sale agreements, raises $672 million in cash proceeds
-
 Business5 days ago
Wall Street Week Ahead: Investors see Micron earnings as pulse check of AI rally momentum
-

 NewsBeat5 days ago
Keir Starmer Allies Question His Chances For No 10
-

 Tech6 days ago
AWS enters the context layer race with a graph that learns from agents, not manual curation
-
 Crypto World5 days ago
Can Charles Hoskinson Really Rescue Cardano?
-

 Crypto World5 days ago
HIVE shares jump as $220M AI deal speeds Bitcoin mining pivot
-

 Crypto World5 days ago
Jake Chervinsky accuses CME of protecting derivatives monopoly
-
 Tech3 days ago
Signal’s Meredith Whittaker says AI chatbots ‘are not your friends’ and calls Copilot agents a backdoor
-

 Entertainment5 days ago
Jose Alvarado Wants Taylor Swift at More Knicks Games
-

 Tech2 days ago
Nearly 7,000 fake Amazon domains registered ahead of Prime Day 2026, researchers warn
-

 Business6 days ago
Brexit cost 6% of UK economy, Bank of England company data suggests
You must be logged in to post a comment Login