

Crypto World
CIA Official Allegedly Invented Fake Doomsday Program to Hide $40 Million Gold Scheme


A former senior CIA officer allegedly fabricated a top secret intelligence program to siphon government money into gold, according to people familiar with the federal investigation.
David J. Rush, charged with theft of public money, built a sham “special access program” that prosecutors say funneled millions and ended with 303 gold bars stashed in his home.
How the Alleged Scheme Worked
Rush worked in the CIA’s Directorate of Science and Technology and built what is known as a special access program, a black box so restricted that even cleared officers need authorization to see inside.
He allegedly “read in” two colleagues as possibly unwitting accomplices and used a fabricated contract to funnel money into it.
The fake project posed as continuity of government work, the doomsday planning for keeping Washington running after a catastrophe.
Rush reportedly used that cover to persuade a defense contractor to buy large amounts of gold.
Follow us on X to get the latest news as it happens
What the FBI Found
A May 18 raid on Rush’s Virginia home turned up 303 gold bars worth roughly $40 million, $2 million in cash and 35 luxury watches, according to a government affidavit.
The May 20 filing also alleges he lied about a Clemson degree, a Rensselaer master’s and a Navy pilot record, and collected $77,000 in military leave pay after leaving the Navy in 2015.
The FBI found no record he attended either school. CIA Director John Ratcliffe referred the case after an internal review, and several officials are now on leave.
Why a $40 Million Gold Haul Draws Scrutiny
The seizure lands amid record demand for gold as a store of value, with central banks stockpiling gold near record levels.
That run has revived the BTC versus gold debate and fresh claims that Bitcoin is digital gold.
Investors also weigh Bitcoin versus gold as a hedge.
Physical bullion, though, leaves a heavy paper trail, raising questions about how the theft escaped notice.
A Widening Case
At a June 5 detention hearing in Alexandria, Virginia, Magistrate Judge William Fitzpatrick ordered Rush held as a flight risk.
Prosecutor Gavin Tisdale called him a “master manipulator” and said the evidence so far is only a “fraction” of what investigators have gathered.
“Keeping gold bars and wads of cash in your house is not exactly top-notch tradecraft,” said Jim Himes, ranking Democrat on the House Intelligence Committee, in a public statement.
The single charge may be only the opening move. With evidence sealed and officials on leave, coming weeks will show whether this is one man’s fraud or a wider breakdown of CIA controls.
The post CIA Official Allegedly Invented Fake Doomsday Program to Hide $40 Million Gold Scheme appeared first on BeInCrypto.


While Bitcoin fell roughly 17% through the first months of 2026, a basket of Bitcoin mining stocks rose more than 50%, with the best performers up over 70%.
Summary
- Public Bitcoin miners have secured more than $70 billion in AI and high-performance computing contracts as the sector shifts away from dependence on mining revenue.
- Mining stocks have outperformed Bitcoin in 2026, with a basket of listed miners gaining over 50% while BTC has fallen about 17%.
- Miners have sold more than 15,000 BTC from corporate treasuries and taken on billions of dollars in debt to fund AI data center expansion.
That divergence is not an anomaly. It is the clearest signal of the most important industrial transformation in crypto: Bitcoin miners are abandoning Bitcoin, or at least demoting it, to become artificial intelligence data centers.
The numbers are staggering. More than $70 billion in cumulative AI and high-performance computing contracts have now been announced across the public mining sector.
Hut 8 signed a 15-year, $9.8 billion lease for a 352-megawatt Texas facility built to NVIDIA’s reference architecture. TeraWulf has locked in $12.8 billion in contracted AI revenue. IREN secured a $9.7 billion deal with Microsoft for 76,000 NVIDIA GPUs.
Industry projections suggest listed miners could derive as much as 70% of their revenue from AI by the end of 2026, up from roughly 30% today. The companies built to mine Bitcoin are becoming something else entirely, and they are selling their Bitcoin to pay for the transition.
This piece explains why the pivot is happening, who is winning, how they are funding it, and what it means for Bitcoin itself.
The divergence that tells the story
The single fact that captures the whole transformation is the gap between miner stocks and the asset they were built to produce.
In 2026, as Bitcoin slid on rising Treasury yields and hawkish Federal Reserve expectations, the companies that mine it went the other way. A tracked basket of crypto mining equities rose 56% year-to-date while Bitcoin (BTC) itself fell about 17%, according to 10X Research. The individual leaders did far better. TeraWulf gained more than 73%. A handful of mining and AI-infrastructure stocks led the gains in the very weeks Bitcoin was bleeding. For an industry whose fortunes were supposed to rise and fall with the Bitcoin price, that decoupling is remarkable, and it is the market’s way of saying these are no longer Bitcoin companies.
The reason is straightforward once you see it. The market has stopped valuing these companies on how much Bitcoin they mine and started valuing them on how much AI computing capacity they can deliver. A miner that has signed multi-billion-dollar, 15-year leases with AI counterparties has a predictable, contracted revenue stream that looks nothing like the volatile, halving-exposed economics of Bitcoin mining. Investors are pricing the contracted AI backlog, the delivery timelines, and the quality of the counterparties, and rewarding the companies that moved fastest. Bitcoin’s price direction, for the leading names, has become a secondary consideration.
This is why the pivot deserves attention even from people who do not own mining stocks. When an entire industry that was built around Bitcoin starts being valued as an AI infrastructure play and starts behaving accordingly, it changes things about Bitcoin itself, from the network’s hashrate to the selling pressure on its price. To understand those effects, you first have to understand why the miners are running for the exits.
Why mining stopped being good enough
Bitcoin mining was always a brutal business, and a confluence of forces in 2025 and 2026 made the AI alternative too attractive to ignore.
Mining economics are punishing by design. Roughly every four years, the Bitcoin halving cuts the block reward in half, slashing miners’ primary revenue overnight unless the price rises enough to compensate. Miners compete in a zero-sum race for the same fixed pool of block rewards, so as more computing power joins the network, each miner’s share shrinks. They are price-takers on their revenue, which swings with Bitcoin’s volatility, and price-takers on their largest cost, electricity. It is a business of thin, unpredictable margins and relentless capital expenditure on hardware that becomes obsolete in a few years.
Then artificial intelligence created an almost perfectly matched opportunity. The AI boom produced explosive demand for data center capacity, and specifically for the two things Bitcoin miners already had in abundance: large-scale access to cheap power and the physical infrastructure to house and cool enormous racks of energy-hungry machines. A Bitcoin mine is, at its core, a building full of power hookups, cooling systems, and high-density computing, which is most of what an AI data center needs too. The miners were sitting on exactly the scarce resource, secured power capacity at scale, that the hyperscalers and AI cloud providers were desperate to acquire.
The economics of the swap are night and day. Instead of mining a volatile asset in a zero-sum halving race, a miner can sign a 15-year lease with a creditworthy AI counterparty for hundreds of megawatts of capacity, generating stable, contracted, dollar-denominated revenue with hosting margins that can exceed 25%. One is a commodity business at the mercy of Bitcoin’s price; the other is an infrastructure-rental business with predictable cash flows and investment-grade tenants. Faced with that choice, the rational move for a company sitting on gigawatts of power was obvious, and the leaders made it aggressively.
Who is winning the pivot
The transformation has produced clear execution leaders, and walking through the marquee deals shows just how far it has gone.
Hut 8 has undertaken one of the most aggressive transformations in the sector. It signed a 15-year, $9.8 billion lease for its Beacon Point campus in Nueces County, Texas, a 352-megawatt facility designed to NVIDIA’s DSX reference architecture, lifting its contracted AI capacity to roughly 597 megawatts. The company’s posture says everything: in a recent earnings call, Hut 8 stated that Bitcoin is no longer a long-term strategic focus, and its CEO has repositioned it around a model of integrated power and compute rather than merchant mining. The company that once defined itself by its Bitcoin treasury now defines itself by its AI leases.
TeraWulf has been the credibility leader, partly because of who is backing it. It has signed HPC contracts totaling $12.8 billion, with deals anchored by Google-backed Fluidstack and other counterparties, and roughly 27% of its revenue already comes from AI, a figure projected to reach about 70% by year-end. In the first quarter of 2026, TeraWulf generated $21 million in HPC revenue out of $34 million in total revenue, meaning the AI business had already become the larger, more stable, more market-valued part of the company.
IREN, the largest of the group by market cap, made the most telling strategic choice: it secured a $9.7 billion deal with Microsoft for 76,000 NVIDIA GB300 GPUs across 200 megawatts at its Childress, Texas campus, and it holds zero Bitcoin in treasury, by deliberate choice rather than financial necessity. Core Scientific has roughly $10 billion in contracted revenue through CoreWeave partnerships. Galaxy Digital signed a 15-year, 800-megawatt commitment with CoreWeave expected to generate around $4.5 billion. Cipher Digital liquidated a third of its Bitcoin reserves and is repositioning as a pure HPC operator. The pattern across all of them is the same: power capacity plus a creditworthy AI tenant plus a long-term lease, and the company is revalued from miner to infrastructure operator.
One metaphor has spread across the sector to describe the hybrid version of this strategy: the “mullet data center.” Bitcoin mining runs in the back as a flexible, interruptible workload used to balance grid demand and soak up power when AI is not using it, while AI occupies the front, where the multi-year contracts and stable margins live. Business in the front, party in the back. It captures how even the miners keeping a foot in Bitcoin are reorganizing around AI as the main event.
How they’re paying for it, and the risk that creates
The pivot is not free, and the two ways miners are funding it both carry real risk that the rally has so far looked past.
The first source is debt, and the sector’s leverage has changed character entirely. Building AI data centers to hyperscaler specifications requires enormous upfront capital, and the miners have taken on infrastructure-scale debt to do it. IREN carries roughly $3.7 billion in convertible notes across multiple series. TeraWulf has around $5.7 billion in total debt. Cipher Digital issued $1.7 billion in senior secured notes, which caused its quarterly interest expense to surge from $3.2 million across nine months to $33.4 million in a single quarter. These are not mining-company balance sheets. They are bets that the AI revenue will materialize fast enough, and reliably enough, to service obligations that now dwarf anything the mining business ever carried. If the AI demand softens or the buildouts run late, that debt becomes a serious problem.
The second source is more symbolic: the miners are selling their Bitcoin to fund the transition. Publicly listed miners have collectively reduced their Bitcoin treasuries by more than 15,000 BTC from peak levels. Core Scientific sold $175 million worth of Bitcoin, about 1,992 coins, in March 2026 to fund operational transitions. This is a genuine cultural break. For years, miners held Bitcoin on their balance sheets as a core conviction, treating accumulated coins as a strategic reserve. Now they are liquidating that reserve to build AI infrastructure, selling the asset that built their businesses to finance becoming something else. It is the clearest possible statement of where they think the future lies, and it adds a steady stream of miners selling to a Bitcoin market already under pressure.
There is also a concentration-and-oversupply risk hanging over the whole sector. Because so many miners are pursuing the same pivot at once, there is a real possibility of overbuilding AI data center capacity relative to demand, which could compress the very margins that make the strategy attractive. And the AI workloads, unlike interruptible Bitcoin mining, cannot be easily curtailed during peak grid demand, which is already creating friction with some state regulators over power pricing and water usage. The pivot is being priced by the market as a near-certain win, but it rests on assumptions, sustained AI demand, manageable debt, and regulatory cooperation that are not guaranteed.
What it means for Bitcoin
Zoom out from the mining stocks, and the pivot has real consequences for Bitcoin itself, in ways that are easy to miss when the focus is on miner share prices.
The most direct effect is on Bitcoin’s hashrate and network security. As miners divert power capacity from Bitcoin mining to AI workloads, computing power that would have secured the Bitcoin network goes to training and running AI models instead. Bitcoin recorded its first first-quarter hashrate drop in six years partly because of this diversion. This is not an immediate security threat; the network remains enormous and secure, but it is a structural shift. Bitcoin’s security budget historically grew as mining expanded; now a chunk of the industry’s growth is flowing to AI instead, and the long-run implications of miners treating Bitcoin as the interruptible back-of-the-mullet workload are new.
The second effect is selling pressure. The 15,000-plus Bitcoins that miners have sold to fund their AI transitions are real supply hitting the market, and it comes from a cohort that used to be reliable holders. In a weak market, that miner selling is one more source of pressure on the price, and it connects to the broader narrative, voiced by figures like Michael Saylor, that the AI buildout is draining capital and resources away from Bitcoin. The miners selling BTC to build AI data centers is that thesis made literal: the people who produce Bitcoin are cashing it in to chase the AI opportunity.
The deeper question is whether the pivot is reversible, and the evidence suggests it mostly is not. Analysts looking at whether a Bitcoin price recovery to $80,000 or higher would pull capacity back to mining have concluded the migration is mostly one-way. The 15-year lease structures that dominate the new AI contracts make reverse migration economically irrational; a company locked into a decade-and-a-half commitment to an AI tenant cannot simply flip its data center back to mining when Bitcoin rallies. That permanence is what makes this an industrial transformation rather than a temporary rotation. The Bitcoin mining industry as it exists is not pausing to wait out a bear market. A large part of it is converting into something else permanently, and the converted capacity is not coming back.
For Bitcoin, the net of all this is a more mature, more independent network whose price no longer has the miners as committed backstop buyers, whose hashrate growth competes with AI for power, and whose former producers have become some of its sellers. None of that is catastrophic, and a leaner mining sector focused on the most efficient operations may even be healthier. But it is a real change in the structure that underpins the asset, driven by an AI boom that turned out to want exactly what Bitcoin miners were sitting on. The quiet transformation of miners into AI data centers is one of the most consequential things happening in crypto, precisely because almost no one is framing it as a crypto story at all.
This article is for informational purposes and does not constitute financial or investment
advice. Cryptocurrency markets are highly volatile. The figures and analysis described
reflect data available as of June 5, 2026. Always do your own research and consult with
qualified financial professionals before making investment decisions.

Key Insights
- Bittensor (TAO) becomes a prominent decentralized AI network gaining more industry traction
- Sui (SUI) concentrates on free stablecoin transfers and efficient movement of digital assets
- Solana (SOL) attracts continued institutional interest while producing high ecosystem revenue
In addition to Washington’s ongoing efforts on the CLARITY Act, the crypto investing community is carefully watching the latest moves that might bring about changes in regulation. According to many market analysts, regulatory clarity may lead to more institutional investment and better stability in the cryptocurrency ecosystem.
Despite some lingering uncertainties, there are many blockchain projects that show significant growth in terms of development and adoption. Some of the interesting projects include Bittensor (TAO), Sui (SUI), and Solana (SOL). These projects cover significant markets, and their success may be influenced positively by any regulatory clarity coming from the US.
TAO — Bittensor: Decentralized AI Makes Inroads
TAO, or Bittensor, has emerged as one of the most closely followed decentralized AI ventures currently. The platform seeks to create a decentralized market where developers can share their AI models and get rewarded depending on the contribution they make to the blockchain.
As more sectors leverage AI technologies across the globe, there are plenty of investors looking for alternatives to standard AI companies. Bittensor presents a decentralized model with high transparency and collaboration.
Recently, the decentralized platform saw increased media coverage ahead of the Proof of Talk conference in Paris. The conference drew numerous developers and entrepreneurs in search of cutting-edge technology. Such events could help increase interest and awareness regarding Bittensor’s prospects.
As AI adoption gains traction worldwide, decentralized AI could hold significant potential. Consequently, TAO ranks among the AI crypto assets investors should monitor.
Sui (SUI): Development of Practical Financial Tools
The Sui Network continues to present itself as a blockchain aimed at serving practical purposes. Among SUI’s most interesting projects in terms of functionality is one that enables free transactions with stablecoins of any amount.
Fees for transactions can be an obstacle for users of various blockchains. Eliminating or minimizing these fees can facilitate user activity and allow for more efficient movement of money.
Another opportunity Sui can take advantage of is tokenization. The development and implementation of a system in which the majority of assets, including securities, are issued in digital format may become a key factor favoring particular blockchain platforms. Unlike some projects that seek attention through PR, SUI focuses on developing practical, valuable solutions.
Solana (SOL): Ecosystem and Institutional Momentum
Solana remains one of the leading blockchain ecosystems in the cryptocurrency markets despite fluctuations in trends. The network shows strong developer activity, a growing user base, and notable revenue generation.
Recently, seven Solana-based projects reported revenues of more than eight figures at the start of 2026. The high demand for products and services on the blockchain reinforces its position among top smart-contract platforms.
Institutional support is also an important catalyst for Solana’s price movements. JPMorgan disclosed a position worth about $500,000 in the Solana staking fund from Bitwise. While that investment may appear modest, many see it as an indication of growing institutional interest. All things considered, Solana remains one of the leading platforms in the crypto ecosystem.

TLDR:
- USDT flipping ETH marks a shift from speculative crypto assets to demand for stable dollar liquidity.
- The stablecoin market grew 30x in five years, expanding from under $10B in 2020 to over $300B today.
- Visa, Mastercard, and MoneyGram are integrating stablecoins into live settlement and payment networks.
- Neobanks building on stablecoin rails can offer global accounts, cards, and cross-border transfers from launch.
USDT flipping ETH in market capitalization is reshaping how the crypto industry understands value. For years, Bitcoin held the top position while Ethereum sat firmly at number two.
That order reflected a market built around assets and protocols. Now a dollar-pegged token is challenging that structure, and the shift carries real consequences for stablecoins and the neobanks positioning to build on top of them.
What the USDT and ETH Flip Reveals About Stablecoin Demand
USDT flipping ETH is not a story about one token outperforming another. It reflects a fundamental change in what the market wants from crypto infrastructure.
The world is not only seeking crypto assets anymore. It is seeking crypto money, and stablecoins are delivering exactly that.
The stablecoin market has expanded from under $10 billion in 2020 to over $300 billion today. USDT accounts for roughly $187 billion of that total, with USDC holding approximately $76 billion.
That 30x growth over five years did not come from speculation. It came from real demand for dollar liquidity on programmable rails.
Early stablecoin use centered on trading. Sell a volatile asset, park value in USDT, move funds across exchanges. That use case still exists, but it no longer defines the market.
Stablecoins now move through cross-border payments, B2B settlement, freelancer payouts, merchant transactions, remittances, and on-chain lending.
Unlike token narratives that fade when attention moves elsewhere, stablecoin demand is tied to broken money movement. That demand does not dry up in a bear market.
In many cases, it grows stronger, because businesses still need settlement and users still need dollar access regardless of price cycles.
What the Flip Means for Neobanks Building on Stablecoin Rails
The USDT and ETH shift is also a signal for neobanks watching the stablecoin market closely. The first generation of neobanks improved the banking interface while leaving legacy rails intact underneath. The next generation is replacing those rails entirely with stablecoin infrastructure.
A stablecoin-native neobank can operate globally from day one. It can offer USD balances, crypto cards, P2P liquidity markets, merchant settlement, cross-border transfers, payroll, and FX routing without relying on local banking systems.
Stablecoins become the money layer, while the neobank provides the product experience users interact with daily.
Major payment networks are already moving in this direction. Visa’s stablecoin settlement pilot reached a $7 billion run rate and grew 50% quarter over quarter.
Mastercard has entered stablecoin payouts and multi-token infrastructure. MoneyGram launched a dollar-pegged stablecoin connected to a network serving tens of millions of users.
Projections place the stablecoin market between $1.2 trillion and $1.9 trillion by 2028 to 2030. At that scale, the competitive edge will not belong to stablecoin issuers alone.
It will go to neobanks that own user relationships, local liquidity, merchant networks, and distribution. USDT flipping ETH is the market pointing directly at that opportunity.

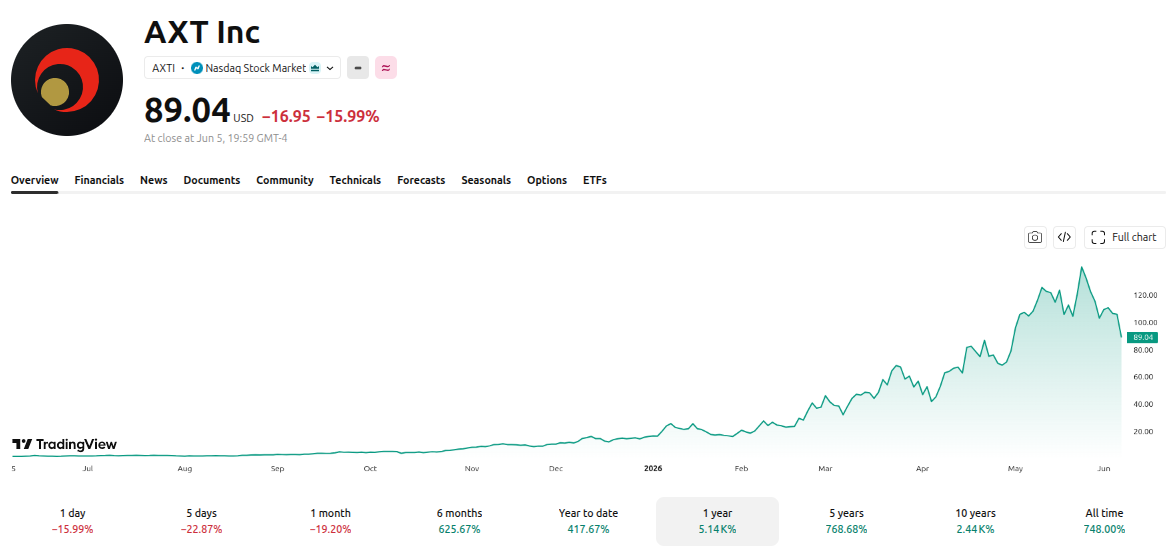
While Bitcoin and Ethereum lost nearly 40% over the past 12 months, AXT Inc. surged more than 5,100%, becoming one of the most impressive AI-linked stories in financial markets this cycle.
We break down what AXT does, why it exploded, and how it compares against Bitcoin and Ethereum across a brutal year for crypto markets.

How AXT Inc. Surged Over 5,100% in Just 12 Months
AXT Inc. is a California-based semiconductor company that manufactures high-performance compound substrates. Its flagship product is Indium Phosphide, alongside Gallium Arsenide and Germanium, all critical materials for advanced photonic and optical applications across AI.
The numbers speak loudly. AXTI traded near $1.74 in June 2025, then jumped close to $89 by early June 2026, a rally of more than 5,100% across the period.
The stock briefly touched an all-time high of over $140 on May 22, 2026, before correcting roughly 35%. Even after that pullback, AXTI’s annual gains remain spectacular and rank among the best of the entire stock market.
The rally was driven by the explosion of AI infrastructure demand. Hyperscalers like Google, Amazon, Microsoft, and Meta accelerated data center construction, generating a record backlog for AXT and lifting expectations of major future capacity expansions.
AXT’s Indium Phosphide substrates power next-generation lasers and optical transceivers running at 800G and 1.6T speeds. These components enable ultrafast interconnects within modern AI data centers, making them critical to the entire ecosystem.
The company controls roughly 40% of the global Indium Phosphide supply. Few short-term substitutes exist, giving AXTI rare pricing power and a near-monopoly in a specific corner of the AI infrastructure supply chain.

In its Q1 2026 earnings report released on April 30, AXT Inc. (AXTI) posted revenue of $26.9 million, up 39% YoY from $19.4 million.
The company significantly improved its gross margin to 29.6% (from negative 6.4% in Q1 2025), while narrowing its GAAP net loss to $1.6 million ($0.03 per share), beating analyst expectations.
Strong demand for Indium Phosphide substrates for AI data centers drove the results, with a record backlog exceeding $100 million.
How Bitcoin and Ethereum Compare Over the Same Year
Bitcoin and Ethereum experienced the opposite story. The king of the crypto market traded near $110,000 one year ago and now sits close to $60,700, a decline of roughly 40% across the same twelve-month period.
This week the picture worsened sharply. Bitcoin suffered a heavy liquidation event, dropping more than 17% in a single week and breaking below $60,000, approaching yearly lows that few major holders expected.

The macro backdrop did not help. Spot Bitcoin ETFs recorded outflows above $1.7 billion this week alone, the largest weekly data in over a year, according SosoValue data. Meanwhile a strong United States jobs report reduced expectations for upcoming rate cuts.
Ethereum has followed a similar downward path. The asset traded near $2,685 one year ago and now around $1,560, a correction of roughly 35% across the same broader twelve-month window.
This week was equally tough for ETH. The token dropped more than 22% in 7 days, breaking key technical support levels and reflecting the same risk-off sentiment now dominating both crypto and traditional financial markets.

The AXTI story illustrates a powerful lesson. In the current AI cycle, certain specialized “picks and shovels” suppliers can deliver returns that dwarf even the most popular crypto narratives, including Bitcoin and Ethereum across an equivalent investment window.
Yet AXTI remains highly volatile. Elevated valuation, AI sector dependence, and significant production exposure in China are real risks. The trajectory simply highlights the enormous upside hiding inside the quieter corners of the AI supply chain.
The post This Hidden AI Stock Up 5,100% While Bitcoin and Ethereum Lost Nearly 40% appeared first on BeInCrypto.
Friday was a brutal day for essentially all financial markets, even though the only notable news that went live was positive, as the US saw the strongest jobs report in a year and a half.
The analysts at the Kobeissi Letter tried to simplify what transpired and explain why markets reacted in such a painful manner.
What Exactly Happened?
If you are reading this, you are probably aware of what took place in the crypto markets. Bitcoin plunged to $59,100 for the first time since November 2024, dragging the entire altcoin field with it and triggering over $1.7 billion in liquidations at one point. But, the crash was not just in crypto.
Gold, traditionally regarded as a safe-haven tool known for its stability, dumped by over 4% in a day from more than $4,500 to $4,315. Wall Street experienced a similar decline, with the S&P 500 erasing $2 trillion from its market cap in a single trading session. The Nasdaq 100 printed seven consecutive hourly red candles during the day in what became its worst drop since Trump’s so-called “Liberation Day” from over a year ago.
And most of those losses took place after the US jobs report went live, which was highly promising – the strongest in 18 months. This financial crash, then, appears puzzling, and even the POTUS himself seemed confused by this situation.
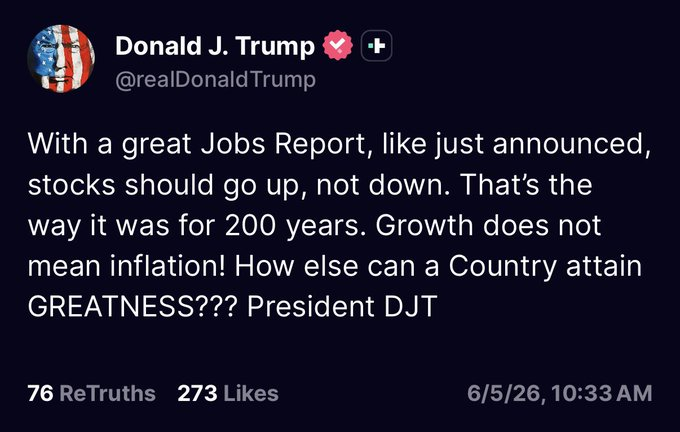
So Why Down Then?
However, such good news does not appear to be beneficial to BTC and other risk-on assets, according to some analysts.
“Strong jobs data kills the rate cut narrative. Bitcoin, already down 15% and sitting on uncleared leveraged longs, has no macro catalyst to recover into, and Middle East tensions are keeping risk appetite soft across markets,” told us the analysts from Nansen.
Their colleagues at the Kobeissi Letter concurred, indicating that when the Fed made its first rate cuts of 2025, it was “specifically because of labor market weakness,” not because the inflation had reached or even neared the 2% target.
With inflation skyrocketing again due to the war against Iran, the bond market has held on to “hopes of rate cuts for some time because of the “weak” labor market.” The jobs report from Friday, though, has “flipped that sentiment, and the weakness of the labor market is being questioned.”
Additionally, the report showed that job openings rose by over 730,000 positions in April, while experts anticipated no change. Available employment jumped to 7.6 million for the month, the highest in two years.
The result of all of the above means that markets have seen the “most hawkish shift in Fed expectations since post-pandemic stimulus.” Experts now believe there will be rate hikes by early 2026, while the overall expectations until months ago suggested up to 4 cuts.
Adding even more fuel to the fire is the drawdown in crypto, with Bitcoin now down -53% since October.
In fact, Bitcoin is down 20% this week ALONE, with crypto erasing ~$2.5 trillion since October 2025.
The bear market gained momentum this week and crushed risk appetite. pic.twitter.com/48WL0tsjqv
— The Kobeissi Letter (@KobeissiLetter) June 5, 2026
Separately, reports claimed recently that Meta is considering raising “tens of billions of dollars” through a stock offering to fund AI development, similar to Google’s $85 billion raise. Such moves increase investor concerns as big tech could start flooding the market with equity raises to fund AI growth.
SpaceX’s IPO, scheduled for June 12, could also be among the culprits, as “funds are likely selling to make room” for this major event.
“Sum it all up, and the market, which was up 20%+ in 2 months, was overdue for today’s decline,” concluded the analysts.
The post Friday’s Market Meltdown: What Sent Bitcoin, Gold, and Wall Street Tumbling? appeared first on CryptoPotato.
Crypto World
Ethereum Store Value Debate Heats Up As Analysts Question ETH’s Monetary Value and Market Performance

Key Points
- The success of Ethereum going forward may depend on ETH’s ability to hold long-term monetary value
- With the development of Layer-2 networks, there is debate regarding the impact of Ethereum’s adoption on ETH’s value
- Weakness in ETH prices and lower support levels have raised questions about Ethereum’s economic model
Identity of Ethereum Undergoes Scrutiny Again
Questions have emerged once more about whether Ethereum serves as a good store of value as stakeholders analyze the link between the success of the Ethereum network and the intrinsic value of ETH. The discussion came into focus when comments from one of the co-founders of Bankless were widely shared within the cryptocurrency community.
In his comments, Ethereum was said not to be distinct from its underlying asset. This point led some people to believe that backing the future of Ethereum while disregarding its value was contradictory. This triggered further discussion from different quarters about the economic base of Ethereum.
Layer 2 Expansion Brings Up Value Creation Considerations
Moreover, the discussion grew even more heated when a co-founder of Bankless gave his point of view about how Ethereum creates value. The latter’s consideration was based on the question of whether an increase in blockchain usage means that the value of its token will go up.
The topic has been highly relevant lately due to Layer 2 expansion on Ethereum. Networks built on top of Ethereum perform increasingly more transactions, allowing better scaling and decreasing costs for end users. At the same time, however, it brings up concerns whether the activity conducted on Layer 2 brings direct value for ETH holders.
According to critics, the broad use of applications does not mean that the demand for tokens goes up as well. The reason is that there might be no connection between the network’s development and token growth if most activity occurs within the apps themselves.
Advocates of Ethereum state that ETH has remained the centerpiece of the ecosystem despite Layer 2 development. ETH still acts as the main asset for staking, is used as a major form of collateral in DeFi protocols, and remains one of the sources of network security.
Scarcity and Proof of Stake
Ethereum’s shift to proof-of-stake resulted in a reevaluation of its monetary policy. The upgrade implemented a mechanism that allows for the reduction of net ETH creation in periods of high network activity. It has led to narratives among supporters that the token becomes scarce under such conditions.
Supporters believe that the introduction of scarcity will contribute to Ethereum’s attractiveness as an investment. However, skeptics argue that scarcity alone may not ensure long-term demand given rising competition from new blockchain projects that can offer services and attract capital at lower costs.
Market Performance Brings Additional Pressure
Market performance recently added another dimension to the debate. ETH was trading at $1,669, marking a decline of about 3.7% over the reporting period.
The crypto had been struggling in a crucial support area of $1,725 before undergoing a notable drop. Even though buyers were able to stop the fall in the $1,650 range, the downturn increased focus on the asset’s future prospects.
At this point, the main concern does not revolve around Ethereum’s ability to attract new projects and developers. More investors are questioning whether progress in the ecosystem will eventually translate into higher ETH prices.
The further development of the project remains controversial: some investors focus on ecosystem expansion while others emphasize the need for ETH appreciation.
Crypto World
Ethereum Store Value Debate Heats Up as Analysts Question ETH’s Monetary Value and Market Performance

Key Points
- The success of Ethereum going forward may depend on ETH’s ability to hold long-term monetary value
- With the development of Layer-2 networks, there is debate regarding the impact of Ethereum’s adoption on ETH’s value
- Weakness in ETH prices and lower support levels have raised questions about Ethereum’s economic model
Identity of Ethereum Undergoes Scrutiny Again
Questions have emerged once more about whether Ethereum serves as a good store of value as stakeholders analyze the link between the success of the Ethereum network and the intrinsic value of ETH. This discussion came into focus when comments from one of the co-founders of Bankless were widely shared within the cryptocurrency community.
In his comments, Ethereum was said not to be distinct from its underlying asset. This point led some people to believe that backing the future of Ethereum while disregarding its value was contradictory. This triggered further discussion from different quarters about the economic base of Ethereum.
Layer 2 Expansion Brings Up Value Creation Considerations
Moreover, the discussion grew even more heated when a co-founder of Bankless gave his point of view about how Ethereum creates value. The latter’s consideration was based on the question of whether an increase in blockchain usage means that the value of its token will go up.
The topic has been highly relevant lately due to Layer 2 expansion on Ethereum. Networks built on top of Ethereum perform increasingly more transactions, allowing better scaling and decreasing costs for end users. At the same time, however, it brings up concerns whether the activity conducted on Layer 2 brings direct value for ETH holders.
According to the critics, the broad use of applications does not mean that the demand for tokens goes up as well. The reason behind is that there might be no connection between the network’s development and token growth in case all the actions happen within the apps.
Advocates of Ethereum state that ETH has remained the centerpiece of the ecosystem despite Layer 2 development. ETH still acts as the main asset for staking, is used as a major type of collateral in DeFi protocols, and is one of the sources of network security.
Scarcity and Proof-of-Stake
Ethereum’s shift to proof-of-stake resulted in a reevaluation of its monetary policy. The upgrade implemented a mechanism that allows for the reduction of net ETH creation in periods of high network activity. It has led to the emergence of narratives regarding Ethereum’s supply dynamics among supporters who claim that the token becomes scarce under such conditions.
Supporters believe that the introduction of scarcity will contribute to Ethereum’s attractiveness as an investment. However, skeptics argue that scarcity is not enough to ensure long-term demand due to the rise of competition among new blockchain-based projects that use other technologies to provide services and attract capital at lower costs.
Market Performance Brings Additional Pressure
Market performance recently added yet another aspect to the debate. ETH was trading at $1,669, marking a decline of about 3.7% over the reporting period.
The crypto had been struggling in a crucial support area of $1,725 before undergoing a notable drop. Even though the buyers were able to stop the fall in the $1,650 range, this downturn brought increased focus on the future prospects of the asset.
At this point, the main concern does not revolve around the capability of Ethereum to attract new projects and developers. More and more investors start questioning whether the progress made by Ethereum would eventually lead to an increase in the price of the coin itself.
The further development of the crypto project remains controversial with some investors focusing on the expansion of the ecosystem whereas others place emphasis on the need for ETH appreciation.


It is the longest losing streak the spot Bitcoin ETFs have ever recorded.
Summary
- U.S. spot Bitcoin ETFs recorded a record 13 consecutive trading days of net outflows, with roughly $4.37 billion leaving the funds between May 15 and June 3.
- BlackRock’s IBIT accounted for about $3.3 billion of the withdrawals as total spot Bitcoin ETF assets fell from $104.29 billion to $82.83 billion.
- The streak highlighted the growing influence of ETF flows on Bitcoin price action, though cumulative net inflows since launch still exceed $55 billion.
Between May 15 and June 3, 2026, US-listed spot Bitcoin ETFs bled cash for 13 consecutive trading days, draining roughly $4.37 billion from the complex and flipping the year’s cumulative flows negative for the first time since the funds launched in January 2024.
BlackRock’s iShares Bitcoin Trust absorbed about three-quarters of the damage, shedding $3.3 billion on its own. Total assets across all US spot Bitcoin ETFs fell from $104.29 billion to $82.83 billion in roughly three weeks, a $21.46 billion drop, as redemptions and a falling Bitcoin price compounded each other.
The streak finally broke on June 4 with a token $3 million net inflow, but the number that matters is not the one that ended it.
The real story is what an unprecedented 13-day run reveals about how Bitcoin actually works now, and the answer is more interesting than the bearish headline.
ETF flows have become part of Bitcoin’s price machinery, and this streak is the clearest demonstration yet of what that means in both directions. This piece breaks down the streak, what it signals, and how to read it without panicking or hoping.
The streak, by the numbers
Start with the full scope, because the scale is what makes this more than a routine pullback.
US spot Bitcoin ETFs recorded net outflows for 13 straight trading sessions from May 15 through June 3, the longest such streak since the products launched in January 2024. The previous record was eight consecutive days, set during a February 2025 correction, so this run did not just break the record, it shattered it by more than half again. Over those 13 days, approximately $4.37 billion left the funds, equivalent to around 59,000 Bitcoin at the prices involved.
The concentration matters. BlackRock’s IBIT, the largest spot Bitcoin ETF by assets, accounted for roughly $3.3 billion of the outflows, about 75% of the total. Fidelity’s FBTC was the second-largest contributor at around $456 million, followed by Grayscale’s GBTC at roughly $303 million. The fact that one fund drove three-quarters of the bleed tells you this was led by large institutional redemptions through the dominant vehicle, not a broad retail panic spread evenly across the complex.
The combined effect on assets was severe. Total net assets across all US spot Bitcoin ETFs fell from $104.29 billion on May 15, the last session before the streak began, to $82.83 billion on June 3. That $21.46 billion decline came from two forces working together: the redemptions themselves and the drop in Bitcoin’s (BTC) price, which fell about 21% over the same window from above $80,000 toward $63,000. ETF holdings now equal roughly 6.36% of Bitcoin’s circulating market cap, down from above 7% at the mid-May peak.
Galaxy Research added a detail that underlines how sustained the selling was: the trailing 7-day, 10-day, and 20-day outflow windows all set all-time records during the streak, with the 20-day window reaching $5.42 billion and 73,080 Bitcoin, the heaviest readings ever in both dollar and coin terms. This was not one bad day dragging the average down. It was nearly three weeks of consistent, intensive selling, which is precisely what makes it significant as a signal, not noise.
Why a streak means more than a single day
A common mistake in reading ETF flows is to fixate on the largest single-day number. The streak structure is more informative than any one session, and understanding why is the key to interpreting this event.
A single large outflow day can be almost anything: one institution rebalancing, a quarterly portfolio adjustment, a tactical hedge, a fat-finger block trade. It is a data point, easily explained away, and often reversed the next session. A 13-day streak cannot be explained that way. Sustained, consecutive selling over nearly three weeks means the selling pressure is structural, not incidental, that a broad set of holders kept deciding, day after day, to reduce exposure. Persistence is the signal. It says the move reflects a genuine shift in sentiment and positioning, not a one-off event.
That is why the all-time-record 7, 10, and 20-day windows matter more than the single worst day. They show the selling was distributed across the entire period rather than concentrated in one wave that then exhausted itself. In market-structure terms, a concentrated single-day dump often marks capitulation, a final flush after which selling pressure eases. A prolonged streak, by contrast, suggests ongoing distribution, a steady reallocation away from the asset that can continue until the underlying reason changes. The shape of the selling tells you about its nature, and this shape says the pressure was deep and sustained.
There is a flip side that the streak structure also reveals, and it is the more important long-term point. For the streak to matter this much, ETF flows have to matter this much, and they do now in a way they did not in previous Bitcoin cycles. That is the real lesson buried in the 13-day run.
The deeper signal: ETFs are now Bitcoin’s marginal bid
The most important thing the streak reveals is structural, and it reframes how to think about Bitcoin entirely. The spot ETFs have become part of Bitcoin’s price machinery, the marginal source of buying and selling that moves the price at the edges.
One analysis put a striking number on it: ETF flows now drive roughly 45% of weekly Bitcoin price moves. Whether or not that exact figure is precise, the direction is unmistakable. Since their January 2024 launch, the spot ETFs have grown large enough that their daily creation and redemption activity is a major input into Bitcoin’s price, not a sideshow. When the ETFs are buying, they provide a steady bid that absorbs supply and amplifies rallies. When they are selling, as during this streak, they become a source of supply that drags the price down and removes the dip-buyer that might otherwise stabilize it.
This is a genuine change in Bitcoin’s nature. In the 2017 and 2021 cycles, Bitcoin’s price was driven primarily by retail speculation, miner selling, and crypto-native flows. There was no institutional ETF channel because the ETFs did not exist. Now they do, and they have become what one analysis called Bitcoin’s marginal bid. That cuts both ways and is the key insight for interpreting flow data going forward. The same mechanism that powered Bitcoin’s 2024-2025 rise to $126,000, a relentless ETF bid absorbing supply, is the mechanism that drove this decline when it reversed. The ETFs did not just passively reflect the selloff. As a major share of marginal flow, they were part of the machinery producing it.
So the 13-day streak is really two signals at once. In the short term, it is a bearish indicator of sustained distribution and negative sentiment. In the structural sense, it is confirmation that Bitcoin has been institutionalized to the point where regulated fund flows are a primary price driver, for better and for worse. The asset that was supposed to be beyond the traditional financial system now moves substantially on the buying and selling decisions made inside it.
The context the panic headlines leave out
For all the record-breaking alarm, several pieces of context complicate the purely bearish read, and leaving them out produces a distorted picture.
The first is the lifetime number. Despite the $4.37 billion that left during the streak, cumulative lifetime net inflows into the Bitcoin ETFs since January 2024 still exceed $55 billion, according to Bloomberg ETF analyst Eric Balchunas, less than $10 billion below the all-time high-water mark. In other words, the streak gave back a small fraction of the enormous capital that flowed in over two years. The funds undid part of a recent recovery and pushed 2026’s flows negative, but the structural position built since launch remains overwhelmingly intact. A $4 billion outflow against $55 billion in lifetime inflows is a meaningful momentum reversal, not a structural collapse.
The second is what happened to the Bitcoin that was left. The redemptions do not necessarily mean the Bitcoin was dumped into oblivion. Analysts noted the streak partly reflects a redistribution of supply toward long-term holders, the cohort that tends to accumulate during weakness and hold through cycles. When ETF shares are redeemed in a falling market, some of that Bitcoin moves from short-term, price-sensitive ETF allocations into the hands of holders with longer horizons. That kind of redistribution from weak hands to strong hands has historically been a feature of bottoms, not tops.
The third is the comparison to April. The selling marks a sharp reversal from April 2026, which were the funds’ strongest month of the year with $1.97 billion in inflows. That whiplash, from best inflow month to worst outflow streak in a matter of weeks, points to a sentiment and macro shift rather than a fundamental breakdown in the ETF thesis. The plumbing did not break. The direction of the flow through it is reversed, driven by the same macro forces, rising Treasury yields, hawkish Fed expectations, and capital rotating toward AI, that pressured all risk assets.
And the fourth is that the streak ended. June 4 broke the run with a small net inflow, modest at around $3 million, but a directional change nonetheless. One green day does not erase a 13-day red streak, but it suggests the most intensive phase of selling may have run its course, at least temporarily.
How to actually read it
Pulling it together, the practical way to interpret the 13-day streak avoids both the doom and the hopium, and focuses on what the flow data can and cannot tell you.
What it tells you for certain: institutional sentiment turned sharply negative for nearly three weeks, the selling was sustained and broad, not a one-off, and ETF flows are now a dominant enough force that a streak like this is a genuine driver of price rather than a passive symptom. The institutionalization of Bitcoin is complete enough that watching ETF flows is no longer optional for understanding the market. They are the marginal bid, and the marginal bid turned into a marginal offer.
What it does not tell you: whether this is a bottom or a continuation. A sustained streak can mark the distribution phase before further declines, or it can mark the capitulation that precedes a recovery, and the flow data alone cannot distinguish between them. The bullish reading points to the redistribution toward long-term holders, the extreme fear readings that have historically preceded recoveries, and the intact $55 billion lifetime position. The bearish reading points to the record-breaking persistence of the selling, the macro headwinds that have not resolved, and the reality that 45% of weekly price action now rides on a flow that turned negative.
The honest synthesis is that the streak is a significant negative event whose ultimate meaning depends on what the flows do next. The single most useful thing to watch is not the price but whether the June 4 inflow was a one-day blip or the start of a return to sustained positive flows. If the ETFs resume steady buying, the streak will look in hindsight like a deep correction within an institutionalized bull market. If they keep bleeding after the brief pause, the negative turn is structural, and the marginal bid stays a marginal offer. Either way, the 13-day streak’s lasting lesson is the one that survives whatever happens next: Bitcoin is now a fund-flow asset, and the funds, not the cypherpunks, hold the marginal vote on its price
This article is for informational purposes and does not constitute financial or investment advice. Cryptocurrency markets are highly volatile. The figures and analysis described reflect data available as of June 5, 2026. Always do your own research and consult with qualified financial professionals before making investment decisions


Bitcoin’s latest oversold RSI mirrors 2020 and February 2026 setups that preceded 50% and 30% rebounds, putting $70K back in focus.
TLDR:
- Bitcoin dropped 83%, 84%, and 77% following the last three Federal Reserve leadership transitions.
- New Fed chairs typically adopt hawkish rhetoric early, tightening liquidity and pressuring risk assets.
- The Fed ended quantitative tightening in December 2025 and resumed short-term Treasury purchases.
- Warsh’s hawkish history and renewed inflation signals cloud hopes for dovish policy at June FOMC.
Bitcoin is hovering near $63,000 as the Federal Reserve prepares for a leadership change in May 2026. Jerome Powell will hand over the chair to Kevin Warsh amid subdued crypto markets.
Equities continue hitting all-time highs, yet Bitcoin remains roughly 50% below its $125,000 peak. A recurring historical pattern now draws renewed attention: every Fed Chair transition has coincided with a major Bitcoin drawdown.
Bitcoin Fed Chair Transitions and the Drawdown Pattern
The data behind this pattern is difficult to ignore. Bitcoin dropped approximately 83% after Janet Yellen assumed office in 2014.
A similar 84% decline followed Jerome Powell’s first term beginning in 2018. Powell’s reappointment in 2022 preceded a 77% collapse tied to the most aggressive tightening cycle in modern history.
MacroMicro research attributes these declines to several recurring forces. Early in a new chair’s tenure, institutional investors reduce exposure to volatile assets while policy direction remains unclear.
New chairs also tend to adopt hawkish rhetoric to establish inflation-fighting credibility, which tightens liquidity conditions.
Markets further compound the effect through anticipation. Tightening expectations often get priced in before formal policy shifts occur, producing classic “buy the rumor, sell the news” behavior. External shocks then frequently amplify whatever policy pressure already exists.
Each historical cycle shows this combination clearly. The Mt. Gox collapse in February 2014 hit just as Yellen took office and QE tapering began.
The ICO unraveling in 2018 coincided with rate hikes and balance sheet reduction under Powell. In 2022, the Terra and FTX collapses struck as the Fed raised rates at an unprecedented pace.
Why This Cycle May Differ for Bitcoin
The current transition carries meaningful differences from prior episodes. The Federal Reserve formally ended quantitative tightening in December 2025 and has since resumed purchases of short-term Treasury securities. This shift keeps baseline liquidity conditions more stable than during the 2018 or 2022 cycles.
MacroMicro’s research notes that a liquidity-driven Bitcoin selloff, similar to previous transitions, carries reduced risk this time around.
Stable liquidity foundations remove one of the central mechanics that turned prior drawdowns into prolonged bear markets.
That said, uncertainty around Warsh’s policy direction remains. His historically hawkish stance and signs of renewed inflation suggest the June FOMC meeting may not deliver the dovish signals some market participants expect. Trump’s pressure on Warsh to support rate cuts adds another layer of unpredictability.
Investors watching Bitcoin through this transition should focus less on the historical curse and more on the Fed’s actual policy trajectory.
Whether the new chair tilts accommodative or restrictive will likely determine whether Bitcoin breaks the pattern or repeats it.

How to Use Claude to Build INSANE Financial Models (2026)

Bethenny Frankel’s $900 ‘Rich Girl’ Sandals Have a $26 Lookalike

King and Queen in attendance as Peter Phillips marries NHS nurse


-

 Business5 days ago
Jade Biosciences, Inc. (JBIO) Discusses Positive Interim Results From JADE101 Phase I Healthy Volunteer Study and Development Plans Transcript
-

 Fashion1 day ago
Weekend Open Thread: Evereve – Corporette.com
-

 Sports4 days ago
French Open 2026 results: Alexander Zverev beats Rafael Jodar and will play Jakub Mensik in semi-finals
-
 Crypto World1 day ago
Jensen Huang Approves Samsung, SK Hynix, and Micron for NVIDIA (NVDA) HBM4 Memory Supply
-

 Tech4 days ago
CryZENx Releases Fresh Playable Content Deep Inside Jabu-Jabu for His Ocarina of Time Remake
-

 Business4 days ago
Trump Taps Housing Chief Bill Pulte as Acting Intelligence Director After Gabbard Exit
-
Crypto World1 day ago
LBank Surpasses 25 Million Users Worldwide as AFA Partnership Continues to Drive Global Growth
-
 NewsBeat4 days ago
Republicans balk at Trump’s attempt to appoint a MAGA enforcer to lead National Intelligence
-
 Crypto World4 days ago
Seagate (STX) Stock Surges to Record High on AI Boom and Legal Settlement
-
Crypto World4 days ago
EU AI Data Center Project Faces Delays as Funding Gaps Grow
-

 Entertainment4 days ago
Did The Mandalorian And Grogu Already Ruin The Next Star Wars Movie?
-

 Tech1 day ago
RCS Messages Between iPhone and Android Get End-to-End Encryption With iOS 26.5
-

 Business4 days ago
Aehr Test Systems Stock Soars 17% Amid Surging AI Demand and Conference Spotlight
-

 Business4 days ago
Relay Therapeutics Shares Surge 20% on ASCO Momentum for Zovegalisib Breast Cancer Program
-
 Business4 days ago
Claude AI Down Today Reason: Why Anthropic’s AI is not working today? What’s the latest quota update
-
 Crypto World1 day ago
Merlin (MRLN) Stock Soars 32% on Major USSOCOM Autonomy Milestone
-

 Tech4 days ago
Instagram will stop bombarding teens with the same kind of obsessively unhealthy content
-
Crypto World5 days ago
Tether Brings Google’s TurboQuant to Production, Unlocking Long-Context AI on Everyday Devices
-

 Business4 days ago
Dow Jones Climbs Near Record Highs as AI Optimism Offsets Geopolitical Risks
-
 Entertainment4 days ago
‘Aliens’ Star Reveals How the US Military Co-Opted James Cameron’s Sci-Fi Tech [Exclusive]
You must be logged in to post a comment Login