
Crypto World
Friday’s Market Meltdown: What Sent Bitcoin, Gold, and Wall Street Tumbling?
Friday was a brutal day for essentially all financial markets, even though the only notable news that went live was positive, as the US saw the strongest jobs report in a year and a half.
The analysts at the Kobeissi Letter tried to simplify what transpired and explain why markets reacted in such a painful manner.
What Exactly Happened?
If you are reading this, you are probably aware of what took place in the crypto markets. Bitcoin plunged to $59,100 for the first time since November 2024, dragging the entire altcoin field with it and triggering over $1.7 billion in liquidations at one point. But, the crash was not just in crypto.
Gold, traditionally regarded as a safe-haven tool known for its stability, dumped by over 4% in a day from more than $4,500 to $4,315. Wall Street experienced a similar decline, with the S&P 500 erasing $2 trillion from its market cap in a single trading session. The Nasdaq 100 printed seven consecutive hourly red candles during the day in what became its worst drop since Trump’s so-called “Liberation Day” from over a year ago.
And most of those losses took place after the US jobs report went live, which was highly promising – the strongest in 18 months. This financial crash, then, appears puzzling, and even the POTUS himself seemed confused by this situation.
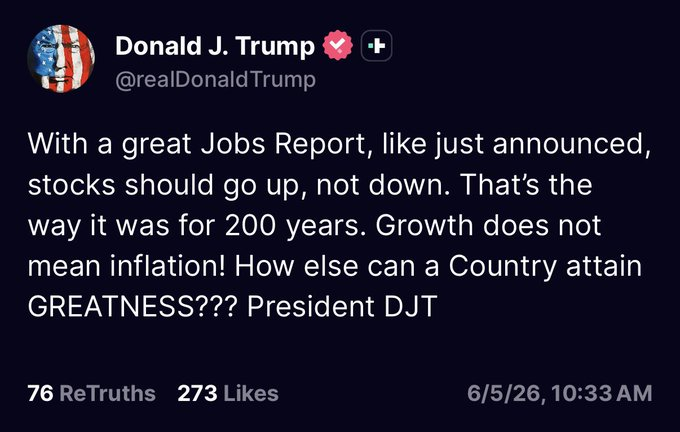
So Why Down Then?
However, such good news does not appear to be beneficial to BTC and other risk-on assets, according to some analysts.
“Strong jobs data kills the rate cut narrative. Bitcoin, already down 15% and sitting on uncleared leveraged longs, has no macro catalyst to recover into, and Middle East tensions are keeping risk appetite soft across markets,” told us the analysts from Nansen.
Their colleagues at the Kobeissi Letter concurred, indicating that when the Fed made its first rate cuts of 2025, it was “specifically because of labor market weakness,” not because the inflation had reached or even neared the 2% target.
With inflation skyrocketing again due to the war against Iran, the bond market has held on to “hopes of rate cuts for some time because of the “weak” labor market.” The jobs report from Friday, though, has “flipped that sentiment, and the weakness of the labor market is being questioned.”
Additionally, the report showed that job openings rose by over 730,000 positions in April, while experts anticipated no change. Available employment jumped to 7.6 million for the month, the highest in two years.
The result of all of the above means that markets have seen the “most hawkish shift in Fed expectations since post-pandemic stimulus.” Experts now believe there will be rate hikes by early 2026, while the overall expectations until months ago suggested up to 4 cuts.
Adding even more fuel to the fire is the drawdown in crypto, with Bitcoin now down -53% since October.
In fact, Bitcoin is down 20% this week ALONE, with crypto erasing ~$2.5 trillion since October 2025.
The bear market gained momentum this week and crushed risk appetite. pic.twitter.com/48WL0tsjqv
— The Kobeissi Letter (@KobeissiLetter) June 5, 2026
Separately, reports claimed recently that Meta is considering raising “tens of billions of dollars” through a stock offering to fund AI development, similar to Google’s $85 billion raise. Such moves increase investor concerns as big tech could start flooding the market with equity raises to fund AI growth.
SpaceX’s IPO, scheduled for June 12, could also be among the culprits, as “funds are likely selling to make room” for this major event.
“Sum it all up, and the market, which was up 20%+ in 2 months, was overdue for today’s decline,” concluded the analysts.
The post Friday’s Market Meltdown: What Sent Bitcoin, Gold, and Wall Street Tumbling? appeared first on CryptoPotato.


Pi Network paid more than a million people to verify eighteen million identities across half a billion discrete tasks, then published the exact formula for what it paid them. Every outlet reproduced the formula. Not one converted it to dollars. Here is the number, and what it says about crypto’s largest experiment in distributed human labour.
Summary
- Pi Network distributed its first round of KYC validator rewards to 1,094,680 people who completed 526,970,631 verification tasks, confirming roughly 18 million identities.
- The formula is published by Pi itself: a pool of 16,568,774 Pi contributed by migrating users, plus 10 million Pi from the Pi Foundation, divided by the task count, giving 0.0504179 Pi per validation.
- Converted at Pi’s current price near $0.077, the entire distribution is worth approximately $2 million, and a single validation pays roughly four tenths of one cent.
- The average validator completed around 481 tasks and received about 24 Pi, worth under two dollars at current prices and roughly four dollars at the price when rewards landed.
- Pi describes the rate as 21 times the base mining rate, which is accurate and means the base mining rate is worth approximately two hundredths of a cent per unit.
There is a specific kind of number that gets repeated across dozens of articles without anyone stopping to convert it, and Pi Network produced a textbook example this year. The project announced that more than a million verified users had completed over 526 million identity-validation tasks, confirming eighteen million people across two hundred countries, and that all of those validators had now been paid. It is a remarkable operational achievement, arguably the largest distributed human-labour experiment ever run on a blockchain, and Pi has since positioned that workforce as infrastructure available to artificial intelligence companies that need verified humans in the loop. The coverage was extensive and uniformly impressed.
Pi published the exact reward formula on its own blog. Eight or more outlets reproduced it faithfully, quoting 0.0504179 Pi per validation and noting that this represents 21 times the base mining rate. One publication’s page carries the sentence “arriving at a price per validation of approximately” followed by nothing at all, the figure simply missing. Nobody multiplied by the token price. This piece does, and the resulting number reframes both the achievement and the business built on top of it.
The formula, and the number it produces
Start with Pi’s own arithmetic, because the project publishes it in full and there is no dispute about the inputs.
Every Pioneer who completed identity verification and migrated to the Mainnet contributed 1 Pi into a shared reward pool. By the snapshot date of March 5, 2026, that produced a pool of 16,568,774 Pi, corresponding to the same number of migrated users. The Pi Foundation added a further 10 million Pi, acknowledging that much of the earliest validation work had served to train the validator workforce instead of processing final applications. Total pool: 26,568,774 Pi.
That pool was divided by 526,970,631 successful validations, producing a price per validation of 0.0504179 Pi. Validators needed at least 50 qualifying validations reaching majority agreement to receive a payout, and rewards were transferred directly to Mainnet wallets.
Now the conversion nobody performed.
At Pi’s current price of approximately $0.077, the entire distribution is worth roughly $2.05 million. A single validation pays about $0.0039, four tenths of one cent. The minimum qualifying threshold of 50 validations pays approximately $0.19.
Divide the task count by the validator count and the average participant completed around 481 validations, earning roughly 24.3 Pi. At current prices that is about $1.87. At the price when the rewards were distributed in early April, when Pi traded near $0.176, it was closer to $4.27.
So the headline reads: more than a million people completed half a billion tasks and received, on average, somewhere between two and four dollars each.
What the multiple actually means
The most-repeated framing in the coverage is that the rate represents 21 or 22 times the base mining rate, and Pi states this directly. It is accurate, and it is worth thinking about what it implies instead of accepting it as the reassurance it is presented as.
If 0.0504179 Pi is 21 times the base mining rate, the base mining rate is approximately 0.0024 Pi. At current prices that is roughly two hundredths of one cent.
A multiple is only informative relative to its base. Twenty-one times a very small number is a slightly less small number, and describing the validator rate as 21x invites the reader to conclude that validation is well compensated, when what it actually shows is that mining rewards are worth almost nothing and validation is worth somewhat more than almost nothing.
This is the same pattern this publication has documented elsewhere in crypto metrics. A network celebrating 1.4 million agent transactions turned out, on the arithmetic, to have generated roughly $280 in total fees, because transactions on that chain cost two hundredths of a cent. In both cases the underlying activity is real, the technology works, and the number that gets promoted measures volume while the number that would measure value goes unpublished. Our guide to why transaction counts mislead covers the general form of the error; this is the labour-market version of it.
Why the task count is so large
One structural point deserves explanation, because it is the reason 18 million identities required 527 million validations and it is to Pi’s credit.
Pi’s verification system is built for privacy preservation. Rather than handing a complete application to one reviewer, the system splits each application into discrete tasks: a liveness video check, a document review, a photo match, a data-consistency check, a name verification, each assigned to a different validator, and each requiring at least two independent validators to agree before the step passes.
Applications with complications, such as name-change requests or repeat submissions, generate additional checks on top of that baseline.
The result is that no single validator ever sees a complete picture of an applicant’s personal data. Pi states that an average application requires roughly 20 validations, and the arithmetic across the full dataset works out closer to 29 checks per identity confirmed.
That design choice is defensible and unusual. Most identity-verification providers hand a complete file to one reviewer or to an automated system, which is faster and cheaper and considerably worse for privacy. Pi chose to multiply the task count in exchange for compartmentalising the data, and it paid for that choice in validator hours.
It also means the per-task figure understates what a validator is compensated for a complete identity. Twenty-nine tasks at 0.0504179 Pi is roughly 1.46 Pi per identity confirmed, worth about eleven cents at current prices, distributed across the twenty-nine different people who touched it.
The AI business built on this number
The reason the arithmetic matters is that Pi is now marketing this workforce commercially, and the economics of that offer depend entirely on what the workforce costs.
Pi has formally articulated a strategy positioning its verified user base as infrastructure for artificial intelligence companies, targeting data labelling, reinforcement learning from human feedback, and model evaluation. The pitch is specific and, on its own terms, strong: more than 18 million identity-verified humans across 200-plus countries, each already holding a functioning wallet, with a proven production-scale precedent of half a billion completed tasks. Both co-founders took that pitch to a major industry conference this year.
The strategic logic is real. Verified-human labour is genuinely scarce and getting scarcer as generated content and automated accounts contaminate every open data source, and the AI industry does need what Pi has built. Existing distributed-work platforms struggle with exactly the problems Pi has solved: onboarding friction, payment rails across jurisdictions, and confidence that the worker is a person.
The uncomfortable half is the price. A workforce that accepted four tenths of a cent per task, denominated in a token trading near its all-time low, is either an extraordinary cost advantage or an unsustainable one, and which it is depends on why people participated. If validators were working for the token’s future value and not its present value, the labour supply is contingent on price expectations that the chart has been steadily contradicting. If they were working because the task volume was low and the marginal effort trivial, the supply may not scale to commercial data-labelling workloads that require sustained attention.
Pi has acknowledged part of this. It says future distribution rounds should produce higher per-validation rates as automation handles more routine checks, leaving fewer human validations per application and a pool divided among fewer tasks. That is a sensible design response, and it also means the commercial pitch is being made on economics the project itself expects to change.
The gap in the user base
One further figure deserves the same treatment, because it sits alongside the task count in every Pi announcement and receives even less scrutiny.
Pi describes an engaged user base in the tens of millions, with figures above 60 million appearing routinely in its communications and in coverage. The KYC programme this piece examines verified approximately 18 million identities. Of those, 16,568,774 had migrated to the Mainnet by the March snapshot, which is the figure the reward pool was built from, since each migrated Pioneer contributed exactly 1 Pi.
Set those numbers against each other and the funnel is stark. Something on the order of 60 million people engaged with the application. Roughly 18 million completed identity verification. Roughly 16.6 million completed migration to the Mainnet. The gap between the top and bottom of that funnel is larger than the entire verified user base of most cryptocurrencies.
The attrition is not necessarily damning, and the reasons are mundane, not sinister. Verification requires documents many users do not have or will not submit. Migration requires deliberate action from people who joined a free mobile application years ago and may have forgotten it. Some accounts were duplicates or automated, which the verification process exists to catch, and catching them is a success, not a loss.
But it matters for the commercial pitch, because the number Pi markets to potential AI customers is the verified figure and the number that appears in most public discussion is the engagement figure. Those are different populations by a factor of more than three, and the addressable workforce is the smaller one. Of that smaller one, roughly a million people, about six percent of verified users, actually performed validation work in the first round.
A workforce of a million active participants is substantial and unusual for a blockchain project. It is also considerably smaller than the headline suggests, and any assessment of what Pi can deliver commercially should start from the million who worked, not the sixty million who once downloaded something.
What the number does not prove
An honest treatment names what the arithmetic cannot settle, and there are three things.
It does not prove exploitation. Validators opted in voluntarily, the work was intermittent and required no commitment, most participants were already mining Pi on their phones for years at rates the validation payout exceeded twenty-fold, and nobody was induced to leave other employment. Comparing four tenths of a cent per task to a minimum wage assumes an employment relationship that did not exist.
It does not prove the workforce is worthless. Half a billion completed tasks with majority-agreement thresholds is a real operational output, and the fact that it was cheap says as much about Pi’s ability to mobilise its community as about the rate. Any conventional provider attempting the same verification volume with the same privacy compartmentalisation would have paid enormously more.
And it does not settle the token question. The value of these rewards is a function of Pi’s price, which sits near its all-time low after a long decline. The same 24 Pi that is worth under two dollars today was worth more than four dollars in April and would be worth considerably more if the token recovered. Validators paid in an asset instead of cash hold a claim whose value is undetermined, which is the oldest arrangement in crypto and cuts both ways.
What the number settles is the framing. An achievement described in hundreds of millions of tasks is, in dollar terms, a two-million-dollar programme, and any assessment of Pi’s commercial AI ambitions should start from that figure rather than from the task count.
The comparison the pitch invites
If Pi is selling a verified-human workforce to artificial intelligence companies, the honest exercise is to price it against what those companies currently pay, because that comparison is the entire commercial case and nobody has run it.
The established distributed-labour platforms operate on per-task pricing that varies enormously by complexity, from fractions of a cent for the simplest classification work to several dollars for tasks requiring judgment, domain knowledge, or sustained attention. Reinforcement learning from human feedback, the category Pi names explicitly, sits toward the expensive end, because it requires annotators who can evaluate model outputs coherently and consistently, and the labs buying it have historically paid accordingly.
Pi’s demonstrated rate is four tenths of a cent per task. That is competitive at the very bottom of the market and nowhere near the categories Pi is targeting in its pitch.
Two readings follow, and they point in opposite directions. The optimistic one is that the rate reflects what Pi chose to pay for internal work using a token it issues, not what it would charge a commercial client, and that a paying customer’s budget would flow to validators at market rates with Pi taking a spread. On that reading the 526 million tasks prove capability and mobilisation, not price, and the low figure is irrelevant to the commercial offer.
The sceptical reading is that the participation itself was a function of the rate being incidental. People completed validations in spare moments, on phones, for a token they were already accumulating, with no expectation that the payout would matter. Asking the same population to perform sustained, quality-controlled annotation work for real money is asking for a different behaviour from a different worker, and the fact that a million people tapped through simple checks says relatively little about whether fifty thousand of them will label training data to a standard a laboratory accepts.
Both readings are consistent with the evidence, and the distinguishing test is straightforward: a named commercial client, a task type, and a rate. Until one of those exists, the 526 million figure proves that Pi can mobilise its community for near-free work, which is a genuine and unusual asset, and does not yet prove that the community will work for customers.
What Pi built that others could not
Setting the arithmetic aside for a moment, an honest assessment has to credit what this programme accomplished, because the achievement is real and the criticism above does not touch it.
Verifying eighteen million identities across more than two hundred countries is a task that established identity providers charge substantial sums for and frequently perform badly. The industry standard is either full automation, which fails on document variety and produces false rejections at scale in exactly the countries with the least standardised paperwork, or outsourced human review, which concentrates sensitive personal data in a small number of processing centres and has produced repeated breaches. Pi did neither. It built a system that splits each application across many reviewers so that no individual sees a complete file, requires independent agreement at each step, and pays participants in the network’s own asset through infrastructure it also built.
That combination has not been achieved elsewhere at this scale, and the privacy property in particular is a genuine engineering accomplishment, not a marketing claim. Compartmentalised review is harder, slower, and more expensive in labour terms than the alternatives, which is precisely why nobody does it, and Pi absorbed that cost by having a community willing to work for a token.
The payment rail matters too and receives even less attention than the verification design. Distributing rewards to more than a million people across two hundred countries, in amounts averaging a couple of dollars, is operationally impossible through conventional financial infrastructure. Payment processors will not handle it, the fees would exceed the payments, and the compliance burden of onboarding a million micro-payees in that many jurisdictions would swamp any project attempting it. A blockchain with pre-verified wallet holders solves that specific problem completely, and it is the clearest instance in this whole story of crypto doing something the existing system genuinely cannot.
So the fair summary holds two things at once. The economics are far smaller than the headline numbers imply, and the infrastructure that produced them does something no conventional provider could. Whether the second fact can be sold to customers at a price that makes the first fact irrelevant is the entire question hanging over Pi’s commercial strategy, and it will be answered by a contract rather than by a milestone announcement.
What to watch
The second distribution round. Pi says it is refining the validator performance algorithm before the next round and expects higher per-validation rates. Whether that materialises, and at what dollar value, is the single most informative upcoming data point.
Whether any AI customer signs. The commercial pitch has been made publicly. A named client, a contract value, or a disclosed pilot would convert the strategy from a positioning statement into a business. Its absence over the coming quarters would be equally informative.
Task volume after automation. Pi expects automation to reduce human validations per application. That improves per-task pay and shrinks the total workforce opportunity simultaneously, and the two effects pull in opposite directions for anyone valuing the labour network.
The token price against participation. If validator participation holds while the price falls, the labour supply is not primarily price-motivated, which strengthens the commercial case considerably. If it falls with the price, the workforce is a function of speculation rather than of wage.
Open Mainnet. The transition remains pending with no announced date, and the terms of it determine whether validators can convert rewards freely, which is what makes any of these numbers real for the people who earned them.
A closing note on why this conversion was worth doing at all, since the arithmetic is trivial and the inputs were public the whole time.
Crypto produces an unusual density of figures that are technically accurate and practically uninformative, and they share a shape. A count, a multiple, or a cumulative total, quoted without the unit that would let a reader size it. Half a billion tasks. Twenty-one times the base rate. Sixteen and a half million Pi plus ten million more. Every one of those statements is true, verifiable, and published by the project itself in good faith. Together they produce an impression of scale that a single multiplication dissolves.
The reason the multiplication does not get done is not conspiracy. It is that the party with the strongest incentive to publish the number is the party with the least reason to, and the outlets covering the announcement work from the press release under time pressure, reproducing the figures they are given. One of them, working from Pi’s own blog post, left the per-validation figure out of the sentence entirely and published anyway. That is what a supply chain of unconverted numbers looks like in practice.
The correction is available to any reader with a calculator, and the habit generalises well beyond this project. When a crypto announcement leads with a count, find the price and multiply. When it leads with a multiple, find the base. When it leads with a cumulative figure, find the period. The result is frequently smaller than the headline suggests, occasionally larger, and always more useful than the number you were handed.
Frequently Asked Questions
How much did Pi validators actually earn?
Approximately 0.0504179 Pi per validation, which at Pi’s current price near $0.077 is about four tenths of one cent per task. The average validator completed roughly 481 tasks and received around 24 Pi, worth under two dollars at current prices and roughly four dollars at the price when the rewards were distributed in early April.
How was the reward pool calculated?
Pi publishes the formula. Every Pioneer who completed KYC and migrated to the Mainnet contributed 1 Pi, producing a pool of 16,568,774 Pi by the March 5, 2026 snapshot. The Pi Foundation added 10 million Pi, and the combined 26,568,774 Pi was divided by 526,970,631 successful validations to give 0.0504179 Pi per validation.
What does “21 times the base mining rate” mean?
That the base mining rate is approximately 0.0024 Pi, worth around two hundredths of one cent at current prices. The multiple is accurate, and it is informative only relative to its base: 21 times a very small number is a slightly less small number, which is a different statement from the one the framing invites.
Why did 18 million identities need 527 million tasks?
Privacy design. Pi splits each application into discrete tasks, a liveness check, a document review, a photo match, a data-consistency check, a name verification, each handled by a different validator, with at least two independent validators required to agree per step. No single validator sees a complete file. That works out to roughly 29 checks per identity confirmed.
Is this exploitation?
The arithmetic does not support that framing on its own. Participation was voluntary and intermittent, required no commitment, and paid more than twenty times what the same users were already earning from mobile mining. Comparing the per-task rate to a wage assumes an employment relationship that did not exist. What the arithmetic does show is the programme’s true scale in dollars.
What is Pi doing with this workforce commercially?
Positioning it as infrastructure for artificial intelligence companies, targeting data labelling, reinforcement learning from human feedback, and model evaluation, on the basis of 18 million verified humans across 200-plus countries with existing wallets and a demonstrated production precedent. Both co-founders presented the strategy at a major industry conference this year. No named customer has been disclosed.
Will future rounds pay more?
Pi says yes, on the reasoning that automation will handle more routine checks, reducing human validations per application and dividing the pool among fewer tasks. That would raise per-validation pay while shrinking total workforce opportunity, and it means the current commercial pitch rests on economics the project itself expects to change.
What should observers actually track?
The second distribution round’s per-validation rate in dollars, whether any AI customer is named with a contract value, whether validator participation holds as the token price falls, and the terms of the pending Open Mainnet transition, which determines whether rewards are freely convertible for the people who earned them. This is educational analysis, not investment advice.
Disclaimer: This article is for information and educational purposes only and does not constitute financial or investment advice. Token prices change continuously and all dollar conversions reflect prices at the time of writing. Nothing here is a recommendation to buy, sell, or hold any asset, or to participate in any programme. Always do your own research. Information is accurate as of July 30, 2026.


For a decade the pitch was that blockchains would route around the plumbing of American finance. On July 15 the plumbing processed its first live tokenized trades, with forty firms participating and the crypto-native issuers sitting inside its working group instead of competing with it. The incumbent did not lose. It joined, and then it became the largest venue in the category.
Summary
- The Depository Trust and Clearing Corporation processed its first live production trades of tokenized stocks, ETFs, and US Treasuries on July 15, under an SEC no-action letter authorising a three-year pilot.
- Participation spans more than forty firms including BlackRock, JPMorgan, Goldman Sachs, Vanguard, NYSE, Nasdaq, CME Group, and State Street, with full service launch scheduled for October.
- The scale comparison is the story: DTC custodies more than $114 trillion in securities and DTCC processed roughly $4.7 quadrillion in transactions last year, against a crypto-native tokenized equity market where the largest issuer holds under a billion dollars.
- Crypto-native firms including Circle, Ondo Finance, and Ripple Prime are participants in DTCC’s fifty-firm industry working group, not competitors to it.
- The tokenized versions preserve identical legal ownership rights, which is precisely what offshore tokenized-stock products cannot offer, and which resolves the question our post-IPO settlement audit found unanswered.
Tokenization has been sold for roughly a decade on a specific promise: that putting securities on a blockchain would make the existing settlement apparatus unnecessary. Trades would clear instantly, intermediaries would be disintermediated, and the institutions that sit between a buyer and a share certificate would find themselves routed around by software. It was a coherent thesis, it attracted enormous capital, and on July 15 it was answered in a way almost nobody has processed. The Depository Trust and Clearing Corporation, the entity whose depository arm custodies more than $114 trillion in securities and which processed something in the region of $4.7 quadrillion in transactions last year, ran its first live production trades of tokenized stocks, exchange-traded funds, and US Treasuries. More than forty firms took part, including the largest asset managers, the largest banks, and both major American exchanges. Full service launch is scheduled for October. And the crypto-native firms that spent the decade building the alternative are inside the working group helping design it. The incumbent did not get disintermediated. It ran a pilot, and the pilot is now the biggest tokenization venue in the country.
What actually happened on July 15
The mechanics matter, because the announcement has been reported as a milestone and not examined as a market structure event.
DTCC processed live production trades of tokenized assets held at its depository arm, covering equities, exchange-traded funds, and US Treasuries. Not a simulation, not a sandbox with test assets, but real trades in real instruments settled through tokenized representations of securities the depository already holds. The platform runs with Chainlink providing the blockchain infrastructure layer.
The legal foundation is an SEC no-action letter issued on December 11, authorising a three-year pilot covering constituents of the Russell 1000, major index exchange-traded funds, and US Treasuries. A no-action letter is not a permanent regulatory framework, a limitation this piece returns to, but it is sufficient authority for the institutions involved to participate without the classification uncertainty that has constrained every previous attempt.
The participant list is the part that should have generated more coverage than it did. BlackRock, JPMorgan, Goldman Sachs, Vanguard, State Street, NYSE, Nasdaq, CME Group, and Microsoft among more than forty firms. That is not an experiment being run at the edge of the industry by its most adventurous members. It is the core of American capital markets participating simultaneously.
And one design decision resolves a question that has hung over every tokenized equity product to date: the tokenized versions preserve identical legal ownership rights to the underlying securities. The token is the security, held through the same depository chain, and not a claim on someone’s promise to hold the security for you.
The scale nobody has put side by side
Set the two markets against each other and the framing of the past decade inverts.
The crypto-native tokenized equity market, the collection of products that were supposed to replace this infrastructure, currently amounts to something in the region of a billion dollars in total. Ondo Finance, the largest issuer, holds under a billion. The xStocks product suite sits in the hundreds of millions. Robinhood’s tokenized stock offering leads the category on holder count, with several hundred thousand holders, and carries roughly forty-four million dollars in value, which our coverage of that market noted works out to an average position near a hundred and thirty dollars.
Against that, DTC custodies more than $114 trillion in securities.
The ratio is not a hundred to one or a thousand to one. It is approximately a hundred thousand to one, and it explains why the participant list looks the way it does. Institutions that were never going to move meaningful volume onto an offshore mirror-token venue will move it onto a tokenized rail operated by the depository they already use, because doing so requires changing the settlement technology without changing the legal, custodial, or counterparty arrangements at all.
The entire competitive insight. The crypto-native products asked institutions to accept a new legal structure in exchange for better technology. DTCC is offering the same technology with the existing legal structure attached. Almost nobody chooses the first option when the second exists.
The crypto firms are inside the tent
The detail that makes this a feature instead of a milestone report is who is participating.
DTCC’s industry working group spans more than fifty firms across traditional finance and decentralised finance, and its members include Circle, Ondo Finance, and Ripple Prime. Each of those is a company whose tokenization business was, on the original thesis, a competitor to exactly this infrastructure.
Ripple Prime’s presence is the most striking given what we documented in our audit of that company’s acquisition strategy. Ripple spent roughly four billion dollars assembling custody, prime brokerage, treasury software, and payment rails, an empire built on the proposition that the company could operate institutional financial infrastructure instead of depending on it. Its prime brokerage arm now sits in a working group helping the incumbent depository build the tokenization rail that the same institutional clients will use.
Circle’s participation follows a similar logic. A company that just completed a national trust bank charter, as our coverage of the OCC charter wave described, is positioning inside the regulated perimeter instead of outside it, and joining DTCC’s working group is the settlement-layer version of the same move.
None of this is capitulation, and reading it that way would be lazy. The crypto-native firms have genuine capabilities the incumbents lack: stablecoin settlement, twenty-four-hour operation, programmable compliance, and years of operational experience with blockchain infrastructure. Participating in the standard-setting body is how those capabilities get built into the rail that ends up mattering. The strategic question is whether they end up as suppliers to DTCC’s platform or as competitors with a fraction of its volume, and the working group membership suggests they have made that calculation already.
Why the incumbents win this particular fight
The structural reasons deserve stating, because they generalise beyond this case.
Legal identity beats technical elegance. A tokenized security that is legally the same security, with the same ownership rights, transfer mechanics, and regulatory treatment, requires no new legal analysis from any participant. A mirror token that references a security requires every institution to determine what it actually owns, and our audit of the tokenized products that existed through the SpaceX listing found that question resolved badly for several of them, with products scrapped and buyers refunded.
The counterparty is already approved. Every institution in the participant list already faces DTCC daily. Adding a settlement technology to an existing relationship is an operational project. Adding a new counterparty is a credit, legal, and compliance project measured in quarters.
Volume attracts volume. Settlement infrastructure is a network business with extreme returns to scale, which is why depositories are natural near-monopolies in the first place. A tokenization rail attached to the venue where the securities already sit inherits the liquidity of the entire market.
And the regulator prefers it. A pilot conducted by the depository under a no-action letter, with the largest institutions participating and identical legal treatment preserved, is a substantially easier supervisory proposition than a parallel market operating on different assumptions.
The uncomfortable implication for the sector is that the disintermediation thesis may have been backwards from the start. Blockchain settlement was not a threat to the incumbent clearing layer. It was a technology upgrade the incumbent could adopt once the regulatory path existed, and the decade of crypto-native building may have functioned primarily as the research and development phase that proved the technology worked.
The exchanges are converging too
The settlement layer is only half of it. The trading layer is moving on a parallel track and the two are arriving at roughly the same time.
Nasdaq is developing blockchain-based share issuance in partnership with Kraken’s parent company, targeting 2027. Intercontinental Exchange and the New York Stock Exchange are working with OKX on tokenized stock trading. Both incumbents are approaching from the trading side while DTCC approaches from settlement, which means the tokenized equity market that exists in two years is likely to be operated end to end by the same institutions that operate the untokenized one.
For the crypto-native venues, that is a materially different competitive landscape than the one they were built for. The shadow markets that made SpaceX tradable before its IPO, which our proxy-math piece examined, filled a genuine gap: global retail could not access American equities and crypto rails could deliver that access. If the incumbents tokenize their own listings with identical legal rights and the settlement runs through the depository, the gap that justified the offshore products narrows to the jurisdictions the incumbents will not serve.
That is still a real market. It is a smaller one than the thesis assumed.
What could still go wrong
An honest assessment names the ways this does not play out as described, and there are three.
The authority is temporary. A no-action letter authorising a three-year pilot is not a permanent framework. It can be withdrawn, it expires, and converting it into durable regulation requires either SEC rulemaking or legislation, both of which take years and neither of which is scheduled. Institutions building on a three-year permission are building with a clock running.
Pilots stall. The gap between a live production trade with forty participants and a functioning market with meaningful volume is large, and financial infrastructure projects of this scope routinely take longer than announced. The October full-launch date is a target, not a delivery.
And the incumbents may not actually want it. Faster settlement compresses the float and the fee income that existing market structure generates. T+1 settlement moving toward instantaneous removes revenue for several participants in the current chain, and institutions rarely accelerate their own disintermediation with enthusiasm. The pilot’s participants have every reason to explore the technology and some reason to implement it slowly.
None of those undo the central point. Even a slow, temporary, partially-implemented DTCC tokenization platform is operating at a scale the crypto-native market has not approached, with participants the crypto-native market cannot attract.
The precedent for this, from the last time
There is a historical rhyme worth knowing, because the sequence has run before in the same industry with the same participants.
Electronic trading arrived in American equities as an outsider technology, promoted by upstarts arguing that floor-based exchanges were an unnecessary intermediary layer that software would eliminate. Electronic communication networks grew through the 1990s, took meaningful share, and were treated as an existential threat by the incumbents they were routing around. The eventual outcome was not disintermediation. The exchanges bought the networks, adopted the technology, and emerged operating the electronic markets that were supposed to replace them, with the incumbents’ names on the venues and considerably more market power than before.
The pattern held because the challengers had the better technology and the incumbents had everything else: the listings, the regulatory relationships, the institutional client base, and the balance sheets to acquire whatever they lacked. Technology is purchasable. Distribution and legal standing are not.
Tokenization looks like the same shape at an earlier stage. The crypto-native sector spent a decade proving that blockchain settlement works, building the tooling, and demonstrating institutional demand exists. The incumbents watched, waited for a regulatory path, and then launched with forty of the largest firms in American finance participating from day one. The working group membership of the crypto-native issuers is the current-era equivalent of the acquisition phase: capability moving inside the incumbent structure rather than competing with it from outside.
Where the analogy could break is jurisdiction. Electronic trading was a domestic story with a single regulator. Tokenization is global, and the incumbents’ advantages are strongest precisely where regulation is strongest. The markets the DTCC platform will not serve, the jurisdictions where American securities law does not reach and where offshore products currently supply access, remain genuinely open to crypto-native venues. That is a real market and a smaller ambition than the one the sector started with.
What this means for the products already trading
For anyone holding tokenized equity exposure today, the practical consequences arrive before October and deserve stating plainly.
The offshore mirror-token products currently available occupy a market defined by an absence: global retail cannot easily access American equities, and crypto rails deliver that access. Their legal substance varies considerably, from derivatives referencing a price to collateralised certificates to arrangements where the issuer holds shares through a broker, and our audit of what happened to those products through the SpaceX listing found the differences resolved badly for several holders, with some products scrapped and buyers refunded.
A DTCC-settled tokenized security is a different instrument in the way that matters most: it is the security. Same ownership rights, same corporate actions, same regulatory treatment, same place in the custody chain. When both exist, the comparison is not close for anyone who can access either.
The constraint is who can access it. The pilot covers Russell 1000 constituents, major index funds, and Treasuries, and it operates within the American regulatory perimeter, which means the participants are institutions and, eventually, the retail clients of firms inside that perimeter. A trader in a jurisdiction American brokers do not serve gains nothing from the depository tokenizing its holdings, and that trader is the entire addressable market for the offshore products.
So the honest guidance is a split. If you can hold securities through a regulated intermediary, the tokenized versions arriving through the incumbent rail will be strictly better instruments than mirror tokens, and the question is only when they reach retail wrappers. If you cannot, the offshore products remain the only route, their legal substance still varies, and reading exactly what a given product represents remains as necessary as it was before July 15.
What to watch
The October launch. Whether full service arrives on schedule, and with what scope. Slippage would be the first evidence that the pilot’s momentum is slower than the announcement suggested.
Volume, not participation. Forty firms taking part in a pilot is a headline. Dollar volume settled through the tokenized rail is the measure, and it is the number that would tell you whether institutions are using this or evaluating it.
The no-action letter’s successor. Watch for SEC rulemaking or legislative language that would convert temporary authority into a permanent framework. Its absence as the three-year window runs down is the largest risk to everything described here.
What the crypto-native issuers do next. Circle, Ondo, and Ripple Prime are inside the working group. Whether they emerge as suppliers of specific capabilities to the DTCC rail, or pivot toward the jurisdictions the incumbents will not serve, is the strategic tell for the entire tokenization sector.
The exchange track. Nasdaq’s 2027 target with Kraken’s parent, and the ICE work with OKX. If trading and settlement both tokenize under incumbent operation, the category consolidates faster than anyone forecast.
A closing note on how this changes the reading of everything adjacent to it.
If tokenized securities end up settling through the depository with identical legal rights, several arguments the crypto sector has been having become less important than they looked. The debate over whether mirror tokens confer ownership stops mattering for the assets DTCC covers, because a better answer exists in the same market. The competitive question between offshore tokenized-stock venues resolves toward whichever ones serve jurisdictions the incumbents will not. And the case for building a parallel settlement layer weakens considerably when the existing one accepts the technology.
What does not change is everything outside the perimeter. Assets that are not Russell 1000 constituents, index funds, or Treasuries sit outside the pilot’s scope entirely. Investors outside the jurisdictions American institutions serve remain unserved. Twenty-four-hour trading, stablecoin settlement, and programmable compliance are capabilities the incumbent rail has not yet demonstrated and may adopt slowly given the float and fee income that current settlement timing generates.
That is the honest map of what remains. A large and legally clean tokenized market operated by the institutions that already operate American finance, and a smaller, faster, less regulated market serving what the first one will not touch. It is a considerably more modest outcome than the decade’s rhetoric promised, and it is arriving substantially faster than the rhetoric predicted, which is the pattern financial technology usually follows.
Frequently Asked Questions
What did DTCC actually launch?
On July 15 it processed its first live production trades of tokenized assets held at its depository, covering stocks, exchange-traded funds, and US Treasuries, with Chainlink providing blockchain infrastructure. More than forty firms participated, including BlackRock, JPMorgan, Goldman Sachs, Vanguard, State Street, NYSE, Nasdaq, and CME Group. Full service launch is scheduled for October.
What legal authority permits this?
An SEC no-action letter issued December 11, 2025, authorising a three-year pilot covering Russell 1000 constituents, major index exchange-traded funds, and US Treasuries. A no-action letter indicates the SEC will not recommend enforcement action; it is not a permanent regulatory framework, and converting it into one would require rulemaking or legislation.
How large is DTCC relative to crypto tokenization?
Approximately a hundred thousand times larger. DTC custodies more than $114 trillion in securities and DTCC processed roughly $4.7 quadrillion in transactions last year. The entire crypto-native tokenized equity market amounts to roughly a billion dollars, with the largest issuer holding under a billion and the most widely held product carrying about forty-four million in value.
Are crypto companies competing with this or participating?
Participating. DTCC’s industry working group spans more than fifty firms across traditional and decentralised finance, with members including Circle, Ondo Finance, and Ripple Prime. Each built businesses that the original tokenization thesis positioned as alternatives to depository infrastructure, and each is now helping design the incumbent’s platform.
What makes DTCC’s tokens different from existing tokenized stocks?
Legal identity. DTCC’s tokenized versions preserve identical ownership rights to the underlying securities, held through the same depository chain. Most existing tokenized equity products are mirror tokens or contractual claims referencing a security held elsewhere, which means holders own a promise, not the instrument, a distinction that resolved badly for several products during the SpaceX listing.
Does this mean crypto tokenization has failed?
No, but it means the disintermediation thesis was probably wrong. Blockchain settlement turned out to be a technology the incumbent could adopt, not a threat that would route around it. The crypto-native sector proved the technology worked and built genuine capabilities in stablecoin settlement, continuous operation, and programmable compliance, and the open question is whether those become inputs to the incumbent rail or the basis of a smaller parallel market.
What could prevent this from succeeding?
Three things. The authority is a three-year pilot, not permanent regulation. Financial infrastructure projects of this scope routinely slip, so October is a target, not a delivery. And faster settlement compresses float and fee income for several participants in the existing chain, which gives some of them reason to implement slowly.
What should observers actually track?
Dollar volume settled through the tokenized rail rather than the number of participating firms, whether October’s full launch arrives on schedule and with what scope, any SEC rulemaking that would make the authority permanent, and what the crypto-native working group members do as the platform matures. This is educational analysis, not investment advice.
Disclaimer: This article is for information and educational purposes only and does not constitute financial or investment advice. It describes a pilot programme operating under temporary regulatory authority whose scope, timeline, and outcome may change. Figures reflect reporting available at the time of writing. Always do your own research. Information is accurate as of July 30, 2026.


Ask an Expert
Q. The Clarity Act, yea or nay?
Yea, with one important caveat. The objective cannot simply be to make life easier for crypto companies. It should make legitimate projects easier to identify, while making fraud and regulatory arbitrage harder. The biggest problem in the U.S. has been that companies often cannot determine whether they are dealing with the SEC, the CFTC or both until an enforcement action happens.
That is not a serious regulatory system. It pushes responsible teams offshore while doing surprisingly little to stop bad actors. The Clarity Act is directionally right because it recognizes that a capital-raising transaction can involve securities laws without automatically making the underlying token a security.
That distinction is much closer to how decentralized networks actually develop. My main concern is implementation. If the definitions remain subjective, or the SEC and CFTC apply conflicting standards, the uncertainty simply moves from the courts into the rulemaking process. The bill should pass, but success will depend on clear rules, coordinated regulators and real enforcement against fraud.
Q. What aspect will benefit investors the most?
The greatest benefit is the combination of clearer asset classification and mandatory disclosure. Investors need to know what they are buying, which regulator has jurisdiction, what information the project must disclose and what legal protections exist if something goes wrong. The current system often gives investors the worst of both worlds. Many projects do not provide disclosures comparable to public companies, yet they also lack a practical regulatory framework tailored to decentralized networks.
Cryptocurrency trading volumes spiked in South Korea as its stock market fell by nearly 18% this week.
Key points:
- South Korean exchanges see a 600% uptick in crypto trading volume around the snap declines in the KOSPI.
- Investors may be seeking to capitalize on volatility by buying stock-linked products overseas, per analysis.
- Bitwise highlights Bitcoin’s surprising resilience to macro headwinds throughout July.
KRW/USDT volumes spike in response to stock sell-off
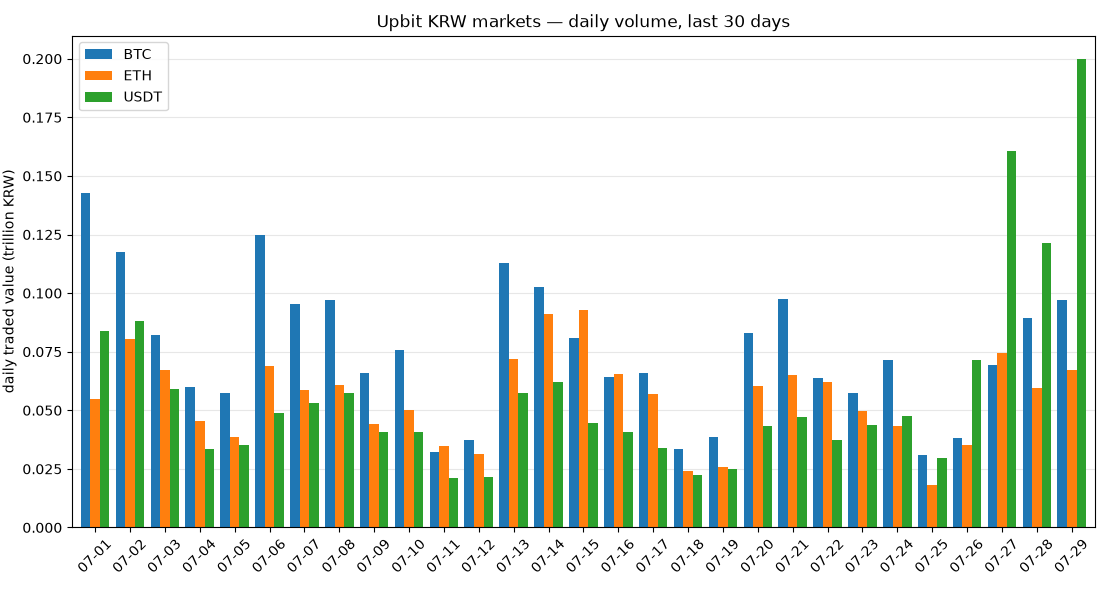
Data from largest South Korean exchange Upbit shows trading volume accelerating between the Korean won and Tether (USDT). It neared 200 billion won (140 million USDT) on July 29, up from just 20 million USDT on July 25 — an increase of 600%.

Korean won crypto trading-volume data. Source: Upbit
On the back of several straight days of downside on South Korea’s KOSPI, which came as a result of a sell-off in chip-maker stocks, investors variously sought protection and to take advantage of the decline. Capital could have flowed out of stocks to crypto, analysis referenced by local media outlet Seoul Economic Daily suggested, while investors could also have targeted derivatives of Korean equities via overseas crypto exchanges.
“There is a possibility that demand increased for moving funds to overseas exchanges or personal wallets to trade perpetual stock futures,” Cho Yoon-sung, a senior researcher at independent digital asset research and data provider Tiger Research, told the publication.
As Cointelegraph reported, an influx into semiconductors and away from crypto earlier this year is now under scrutiny as the tide turns on the AI trade’s rapid rise.
Crypto trading remains a hive of activity in South Korea, as younger traders in particular display a fondness for risk. Traders’ fondness for leveraged bets is an overarching feature of both crypto markets and this year’s AI retail boom.
Analyst underscores BTC price strength
The impact of KOSPI volatility on crypto trading volumes was in evidence before this week’s rout. On July 14, Upbit saw a conspicuous volume surge after the index plunged 10% in a single day.
Related: Bitcoin price wedged into ‘most divided’ FOMC as Iran war spikes oil prices 8%
Commenting on the latest events, Andre Dragosch, European head of research at crypto asset manager Bitwise, underscored the lack of contagion resulting from the semiconductor “meltdown.”
“Bitcoin is essentially flat since semis peaked in late June,” he summarized, suggesting that Bitcoin’s resilience was unexpected.
In an analysis released earlier this week, Bitwise attributed “remarkable outperformance” to Bitcoin in comparison to a range of US mega-cap stocks.
“Bitcoin continues to demonstrate remarkable outperformance and resilience vis-à-vis US mega cap stocks such as the Magnificent 7 and SpaceX (SPCX) – a relative strength that is all the more notable in the context of tightening financial conditions and consistent with our view of Bitcoin as the ‘canary in the macro coal mine,’” it stated.
Bitwise argued that Bitcoin may already be giving early indications of future monetary-policy easing by central banks despite rising inflation and the short-term potential for interest-rate hikes as a result.
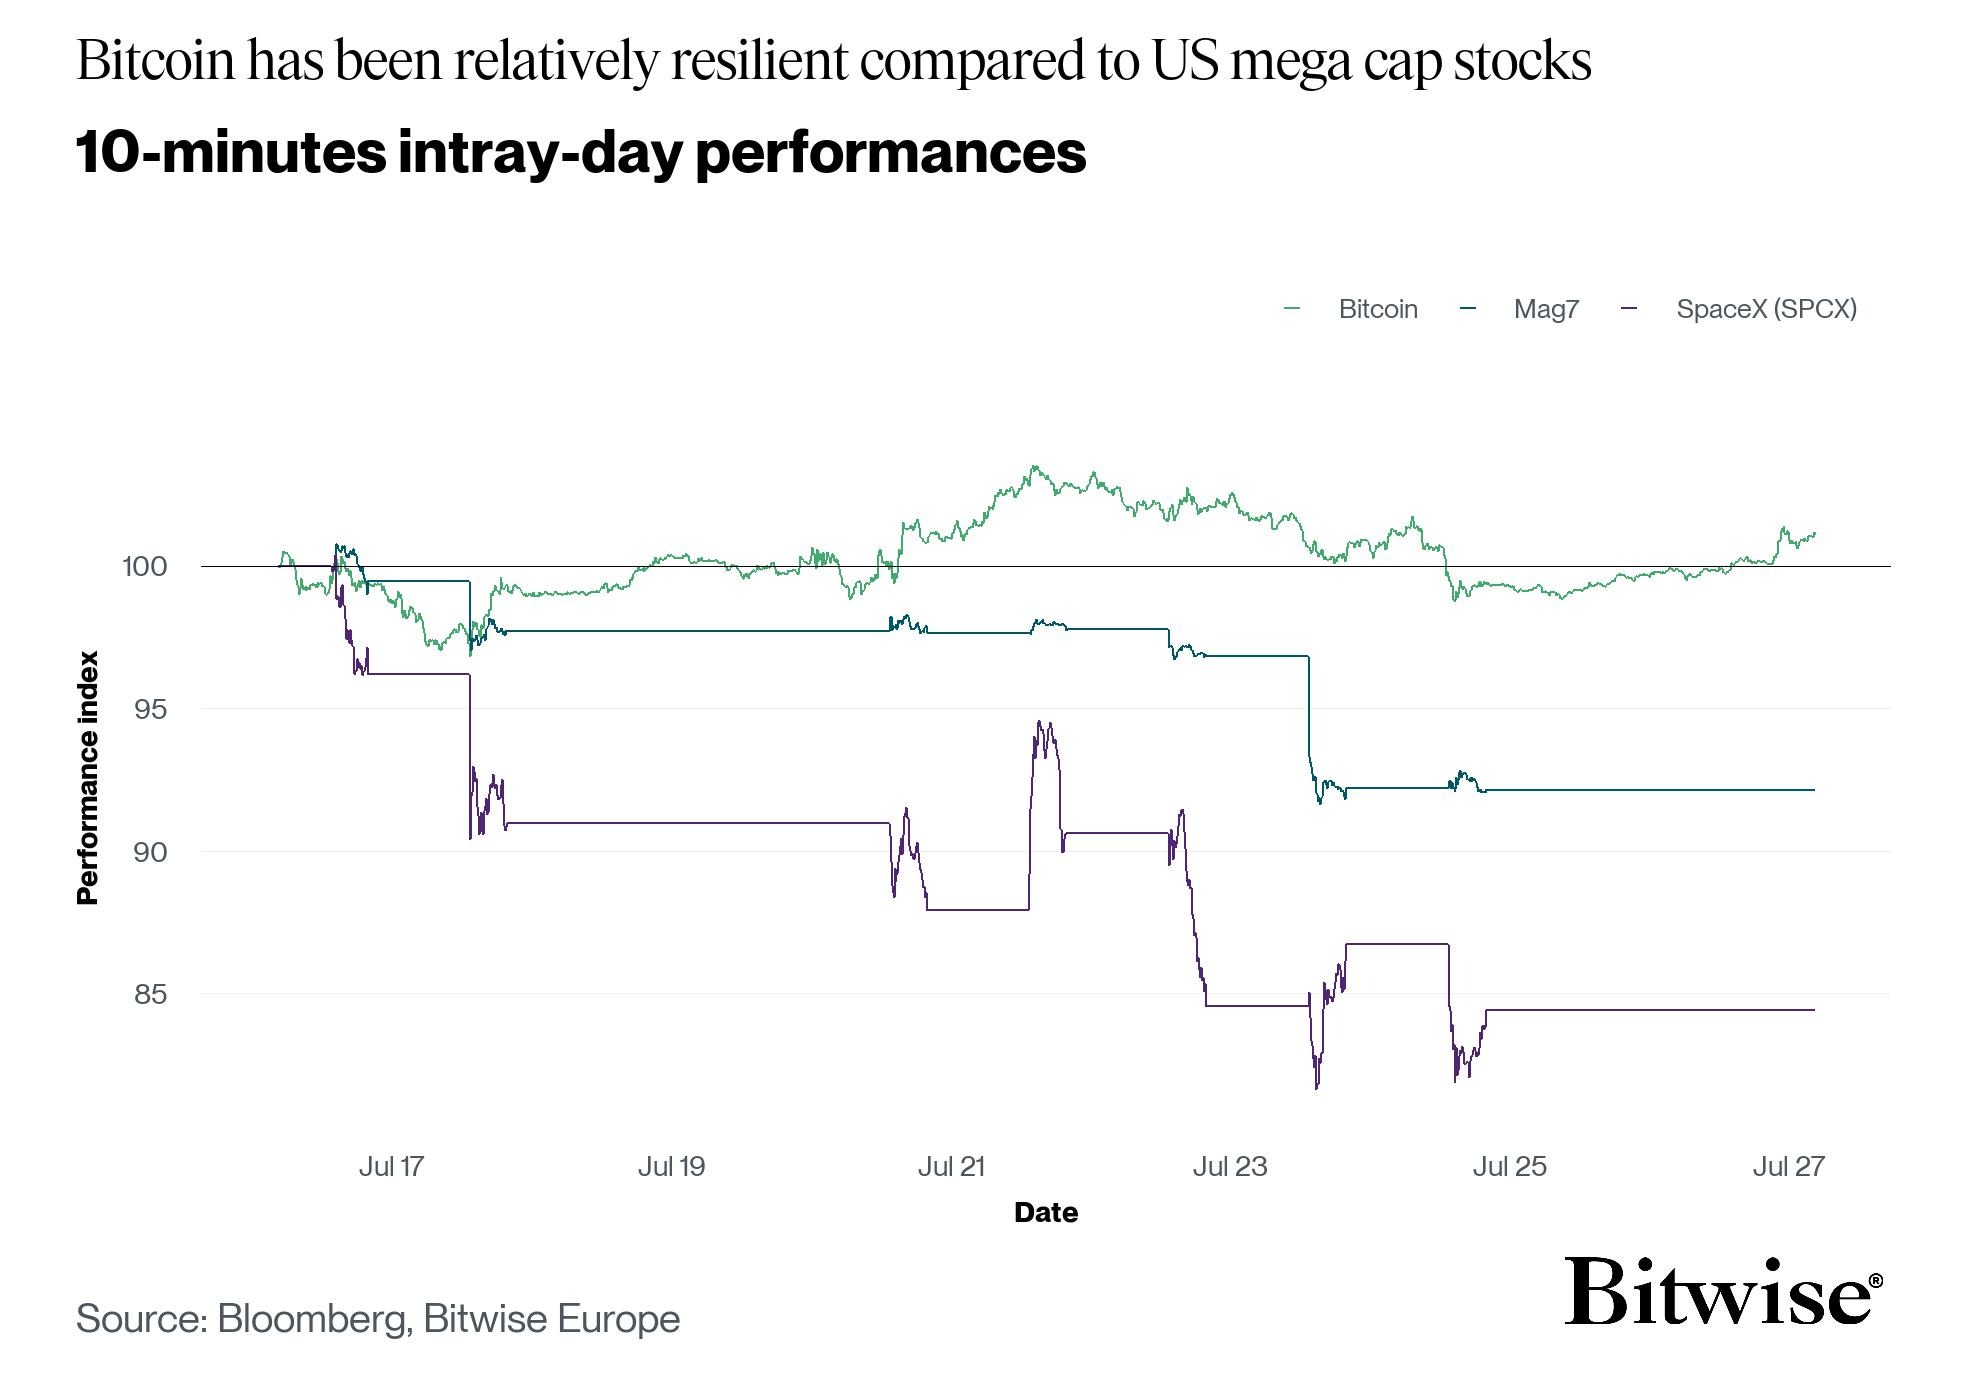
BTC/USD vs. SpaceX and Magnificent 7 stocks. Source: Bitwise
Crypto World
There is a hidden tax risk of crypto perps that no one is talking about, says CME’s CEO


U.S. approval of perpetual futures contracts could expose traders to unexpected tax and regulatory uncertainty if the products are ultimately determined to be swaps rather than futures, an issue that has received little public attention, according to CME Group Chairman and CEO Terry Duffy.
“There’s a consequence that nobody’s talking about,” Duffy said in an interview with CoinDesk. “There’s ambiguity right there, from a tax perspective, for all U.S. participants now.”
The comments come as CME continues its legal challenge against the Commodity Futures Trading Commission (CFTC) over the regulator’s approval of perpetual futures contracts in the U.S. Both sides await a federal court decision, and the outcome could significantly influence how the U.S. approaches the rapidly growing arena of perpetual futures. One consequence, according to Duffy, is how the Internal Revenue Service (IRS) ultimately taxes these contracts.
The dispute stems from whether perpetual futures should legally be treated as futures or swaps.
Duffy said that perps should fall under the legal definition of swaps, instead of how the CFTC categorizes them as futures, because of the periodic funding payments exchanged between long and short positions.
Unlike traditional futures, perpetual contracts never expire. Instead, traders periodically exchange funding payments intended to keep the derivative’s price close to that of the underlying asset. Duffy argued that those recurring payment exchanges satisfy the statutory definition of a swap under U.S. law.
“When two parties exchange payments to each other, that is deemed a swap,” he said, referring to the funding-rate mechanism used by perpetual contracts.
What Duffy sees as the main problem with this mismatched designation is that if perpetual contracts qualify as futures, many institutional traders could receive the blended tax treatment available under Section 1256 of the U.S. tax code. Under this, gains and losses are generally treated as 60% long-term and 40% short-term capital gains. If those contracts fall under swaps, they will be taxed under “ordinary” taxation. Given that the perps are newer innovations, the IRS has not issued guidance specifically addressing the tax treatment of perpetual futures.
So if the regulators or courts ultimately conclude that perpetual contracts are swaps rather than futures, market participants who have been treating them as futures for tax purposes could face uncertainty about how to report those positions to the IRS.
“So if you file your tax return and this ruling comes back, where these products that you’ve been trading and filing government tax returns as 1256 contracts [futures], when it should be ordinary, I will be curious what the IRS has to say to you about how much they think you owe them because you didn’t file your tax returns properly,” Duffy said.
‘Substance over form’
Legal experts, however, said that the issue is much more complex than that.
“The challenge here is that textually, by the structure, perpetual futures look a lot like a swap, but economically they perform a lot like futures,” said Rustin Diehl, a tax attorney and counselor at Allegis Law and an Emeritus Fellow at Georgetown Law’s Institute for International Economic Law and professor of business law at Weber State University. “It’s really a substance-over-form question … function versus text.”
Adding to the uncertainty, legal experts say that the definition of swaps is extremely broad.
“Basically, the statutory definition of swaps is so broad as to encompass … anything,” Jason Gottlieb, partner and chair of Morrison Cohen’s digital assets practice, told CoinDesk. He added that the breadth of the statutory language leaves considerable room for interpretation regarding its application to new financial products such as perpetual futures.
What it will come down to is how the court interprets it.
That’s because the Supreme Court’s 2024 Loper Bright decision eliminated the longstanding Chevron doctrine; federal courts now give less deference to agencies’ interpretations of ambiguous statutes, meaning judges could play a larger role in deciding how existing derivatives laws apply to novel crypto products.
Tax evasion?
And it’s likely to be a long, drawn-out process.
“My view is that there’s going to be a lot of litigation about it, and the Supreme Court has told courts that if there is ambiguity in the statute, they can ignore the CFTC and read the statute for themselves,” Gottlieb said.
Also, rather than immediately deciding whether the products should be classified as swaps or futures, a federal judge is likely to first examine whether the regulator reasonably considered public comments and sufficiently explained its decision before approving these contracts, Diehl said.
“I think the judge is going to focus on the Administrative Procedure Act, and kind of look at the question of did the CFTC really exercise independent judgment? Were they thorough? Were they reasoned? Did they express their reasoning?” he said.
Even if the litigation ultimately clarifies whether perpetual contracts are swaps or futures, tax treatment may still require separate guidance from the IRS, which is not obligated to adopt the CFTC’s interpretation of financial instruments, Diehl said.
“I think people are going to want to maybe check with the IRS and see how they should report these,” said Diehl. “They [IRS] generally do agree with the CFTC’s definitions of commodities historically, but there’s been many times when the IRS doesn’t just agree with a taxpayer submitting their tax position based on CFTC rules.”
Until regulators, tax authorities, or the courts provide greater clarity, Duffy said, large institutions could face uncertainty over how to report trades involving perpetual futures.
“How would you like to be running a very large public company that trades a lot and hedges a lot, and all of a sudden you’re in the news for not paying proper taxes,” said Duffy.
Read more: Inside the CME and CFTC’s battle over onchain perpetual futures

Claude AI predicts a Fed driven breakout for XRP, and this price prediction ties the entire setup to a single event. XRP walks into tonight’s FOMC decision holding a base that has been quietly defended for weeks, climbing from roughly $1.05 to $1.14 earlier this month before cooling back to $1.06 as ETF inflows moderated ahead of the meeting.
Seven US spot XRP ETFs, launched since late 2025, continue absorbing supply even during this pause. That kind of steady institutional buying through a quiet period is often more telling than a sharp spike, since it suggests real demand rather than momentum chasing.
Standard Chartered’s Geoff Kendrick holds the most credible institutional target on the board at $2.80 by year end. Worth noting, that figure was actually cut down from an earlier $8 call after February’s selloff, which makes it a more conservative, tested number rather than a hype driven one.
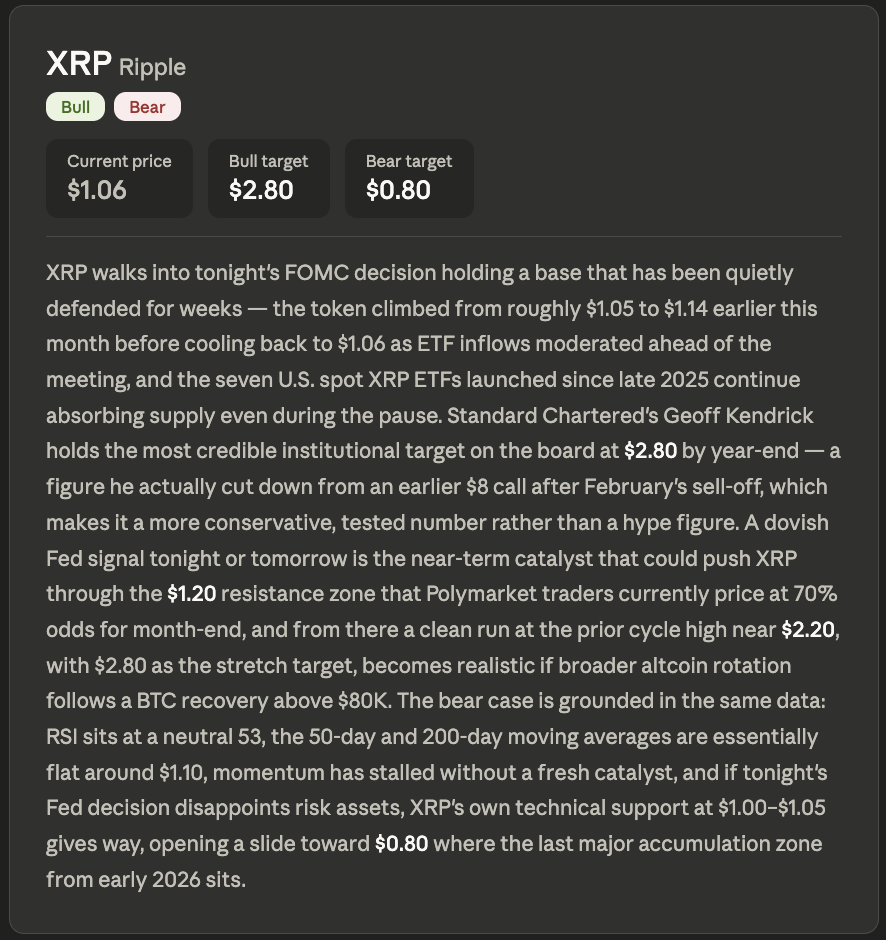
A dovish Fed signal tonight or tomorrow is named as the near term catalyst that could push XRP through the $1.20 resistance zone. Polymarket traders currently price 70% odds of that happening by month end.
From there, a clean run at the prior cycle high near $2.20 becomes realistic, with $2.80 as the stretch target if broader altcoin rotation follows a Bitcoin recovery above $80,000. The bear case is grounded in the same underlying data rather than a separate narrative.
RSI currently sits at a neutral 53, while the 50 day and 200 day moving averages are essentially flat around $1.10, meaning momentum has genuinely stalled without a fresh catalyst to break the tie.
If tonight’s Fed decision disappoints risk assets broadly, XRP’s own technical support at $1.00 to $1.05 gives way, opening a slide toward $0.80, the level where the last major accumulation zone from early 2026 sits.
XRP Price Prediction: XRP Is Sitting Exactly Where The Data Says It Should Be
Price closed at $1.0665, down 0.12%, in a session ranging between $1.0608 and $1.0925. That flat close lines up almost perfectly with the neutral RSI reading and flat moving averages described in the prediction itself.
Zoom out and the broader trend since July 2025 has been a long, uneven decline. XRP peaked near $3.65 that month, then spent the rest of the year carving a staircase of lower highs, with the sharpest break coming in October when price gapped from above $2.60 down through $1.80 in a matter of weeks.
Since that October crash, price spent months compressing between roughly $1.30 and $1.60, then broke that range lower in June, sliding toward $1.05. The bounce to $1.14 earlier this month has already faded back to current levels, exactly the kind of stalled momentum the flat moving averages point to.
Support sits at $1.00, the level the bear case names directly as the line that needs to hold. Resistance stacks at $1.14, then $1.20, the zone Polymarket traders are pricing tonight’s catalyst against, then the heavier ceiling near $2.20 from the prior cycle high.
Momentum here is genuinely neutral, not building toward a breakout in either direction on its own. For Claude’s bull case to activate, XRP needs a dovish signal to arrive and immediately clear $1.20, since nothing in the current chart structure suggests it can do that without outside help.
Here is What Claude AI Predicts About LiquidChain: Spoiler Alert, Very Bullish
Hindsight is the only place most people will see this rotation clearly. The money that moves early does not announce itself.
Large caps are not broken. They are boxed in. Bitcoin, Ethereum, and XRP keep testing the same ceilings with nothing giving way. Every macro catalyst comes with a new arrival date. Every institutional wave lands next quarter. Sitting in assets where the next leg depends entirely on someone else’s decision is not a position. It is a waiting room.
Capital that has survived enough cycles operates on one principle. It moves before the destination has a name.
Small market cap infrastructure plays by a different set of rules entirely. A rotation that would not register at Bitcoin’s scale can reprice an undiscovered project by multiples. The return lives in the distance between what something is genuinely worth and what the market has assigned it so far. That distance only exists while the project stays unfound. The moment it gets found, the gap closes for good.
Multi-chain fragmentation drains value from DeFi every single day. Bitcoin, Ethereum, and Solana operate as completely isolated systems with no native bridge connecting them. Every user who crosses those boundaries pays for that disconnection directly in fees, slippage, and failed transactions. Every crossing. Every time.
Claude AI predicts LiquidChain eliminates that entirely. All 3 networks unified inside a single execution layer. One deployment reaches every ecosystem. Zero cross-chain tax on any interaction.
The presale sits at $0.01454 with just over $920,000 raised. The market has not found this yet. That is exactly the opportunity.
The post Anthropic Claude AI Predicts the Price of XRP by The End of 2026 appeared first on Cryptonews.

The US Treasury’s Office of Foreign Assets Control (OFAC) has sanctioned two Iranian maritime firms in an effort to stop Iran from monetizing the Strait of Hormuz with its BTC insurance scheme.
OFAC claims the Persian Gulf Marine Insurance Company and HormuzSafe Marine Services Authority are “integral” to the Islamic Revolutionary Guard Corps (IRGC) and its “extortion scheme.”
The scheme, called “Hormuz Safe,” has been in the works for some months now. Shipowners could pay for Iran’s insurance with BTC and other cryptocurrencies and guarantee safe passage through the strait.
It would reportedly generate over $10 billion of revenue for the country and help it maintain control over the stretch of water once the war is concluded.
Read more: Crypto scams are now a threat in the Strait of Hormuz, report
In a statement, Treasury Secretary Scott Bessent said, “With its economy in freefall and inflation in the triple digits, the regime is desperate for cash.”
He added, “The United States will not allow Iran to hold global commerce hostage or use international shipping to finance the IRGC’s terrorism, aggression, and repression.”
The US noted that “disgraced regime financier” Babak Morteza Zanjani had already promoted the scheme to his followers on social media.
Zanjani reportedly used Binance between 2024 and 2025 to move $850 million, despite his account being flagged multiple times.
Yesterday’s sanctions also targeted an Iranian shadow fleet of tankers that the US says is supplying the country with millions of barrels of crude oil and petroleum products.
The war began in February 2026, and in June, a US memorandum of understanding was signed that aimed to peacefully reopen the Strait of Hormuz and end the war.
This didn’t last long, and millitary strikes resumed on July 13. Another round of peace talks took place in late July during a three-day ceasefire between the US and Iran, however, the conflict has since flared up again.
Got a tip? Send us an email securely via Protos Leaks. For more informed news and investigations, follow us on X, Bluesky, and Google News, or subscribe to our YouTube channel.
Goldman Sachs, Barclays, and Jefferies cut their Robinhood Markets (HOOD) price targets on Thursday, one evening after the Nasdaq-listed brokerage beat second-quarter revenue and profit estimates. Goldman and Jefferies had each raised their targets to $137 earlier in July.
All three firms kept bullish ratings. Their reversal is about timing, not execution. Analysts now expect Robinhood’s existing trading business, rather than its newer products, to carry growth into 2027.
Why Did Analysts Cut Robinhood Price Targets After an Earnings Beat?
Goldman Sachs moved to $118. Jefferies went to $127. Barclays cut deepest, to $105.
Firm
New target
Prior
Rating
Change
Barclays
$105
$122
Overweight
-14%
Goldman Sachs
$118
$137
Buy
-14%
Needham
$120
$123
Buy
-2%
Jefferies
$127
$137
Buy
-7%
The round trip is what stands out. Jefferies lifted its target from $94 to $137 on July 8. Goldman reached $137 in mid-July. Both unwound that optimism within a month.
Not everyone retreated. Piper Sandler held $135 and BTIG reiterated $125. Bernstein’s $160, set July 20, still leads the 28 analysts covering the stock.
Why It Matters for HOOD Stock
Robinhood beat and still could not hold a bid. That pattern is established, not new.
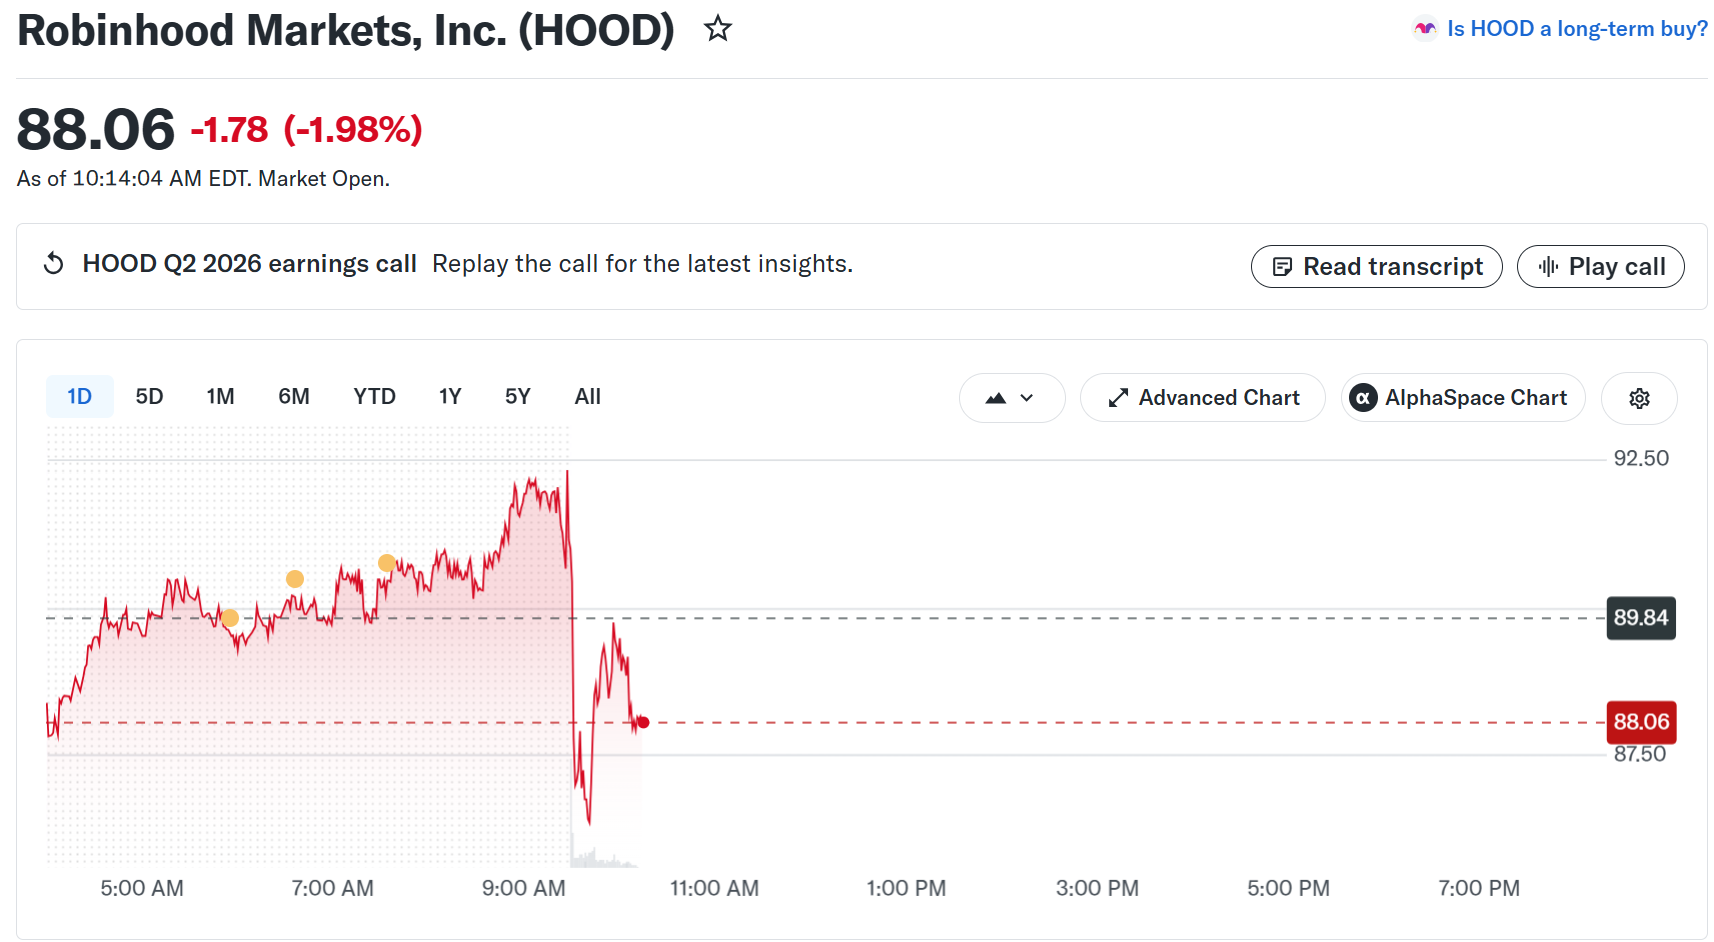
In November 2025, Robinhood beat on both lines and fell 10.8% the next session. HOOD traded near $89.67 on Thursday morning, about 42% below its October 2025 record.
Barclays framed the ceiling plainly. It expects existing businesses to drive near-term growth, arguing newer bets need years before they move the revenue base.

Robinhood’s HOOD stock fell almost 2% at market open, and was trading for $88.06 as of this time.
What Robinhood’s Q2 Filing Actually Shows
Revenue rose 32% to a record $1.31 billion, per the company’s filing. Diluted earnings reached $0.62 per share, up 48%. Adjusted EBITDA hit $741 million.
Earnings quality is thinner than the headline suggests. Roughly $0.14 of that EPS came from one-off gains, mostly the deconsolidation of Robinhood Ventures Fund I.
Crypto remains the soft spot. Robinhood’s crypto revenue beat consensus at $100 million, yet fell 38% from $160 million a year earlier.
That line now supplies 8% of net revenues, down from 16%. The 10-Q blames weaker market-maker rebate rates and 16% fewer users placing crypto trades.
What to Watch Over the Next 30 Days
July net new assets are tracking toward $4 billion, soft after a strong June.
Costs are the offset. Robinhood cut 10% of staff in June and lowered full-year 2026 expense guidance to a range of $2.675 billion to $2.775 billion.
Robinhood also leads tokenized stock ownership by holder count while trailing on money committed, which is the gap Barclays is pricing.
With the consensus target near $122 and the stock under $90, the question is whether prediction markets and tokenized assets scale before that spread closes on its own.
The post Goldman, Barclays, Jefferies Cut Robinhood Targets Despite Earnings Beat appeared first on BeInCrypto.

It’s clear Russia is the single most important ally to Iran in their shared conspiracy against global peace and prosperity. According to many intelligence reports, in addition to passing on sensitive intelligence to Iran about U.S. military installations in the region, Russia is systematically upgrading Iran’s aging, pre-1979 military infrastructure as its single largest external source of weaponry. As of mid-2026, Moscow has completed production of advanced Su-35 fighter jets and helicopters for Tehran, augmented by deliveries of Yak-130 combat trainers, Mi-28 attack helicopters, and hundreds of long-range air-to-air and anti-radar missiles. Furthermore, in 2022, Moscow helped launch Iran’s high-resolution Khayyam satellite, and Russian forces routinely transfer captured Western weaponry from the Ukrainian frontline—including Javelin and Stinger systems—directly to Iranian defense firms to be reverse-engineered and cloned for Tehran’s proxy networks. Simultaneously, Russian telecommunications firms are supplying Iranian operators with advanced digital surveillance and cyber warfare technologies.

Samsung SDS, the IT services arm of Samsung Group, says it is exploring cooperation with Dunamu—operator of South Korea’s Upbit exchange—across stablecoin infrastructure, digital asset systems and AI-enabled payment models. The discussions were outlined during Samsung SDS’ second-quarter earnings call on Thursday, according to remarks from CEO Lee Jun-hee.
The effort also arrives as Samsung Electronics continues to expand its digital asset footprint, including recent plans to add stablecoin support to Samsung Wallet. Together, the moves point to a broader push by Samsung-related entities toward regulated digital finance rails rather than purely retail-facing crypto features.
Key takeaways
- Samsung SDS is in talks with Dunamu on stablecoin infrastructure and broader digital asset system development.
- CEO Lee Jun-hee framed the Dunamu relationship as expansion in infrastructure capabilities, not a standalone financial investment.
- Samsung affiliates already have ties to Dunamu: Samsung Securities, Samsung SDS and Samsung Card agreed to buy a combined 4% stake in May 2026.
- Samsung SDS’ Q2 results show growth across cloud and AI-related services, providing business momentum for its digital finance ambitions.
- South Korea’s regulatory direction for stablecoins remains a key variable for how such infrastructure partnerships develop.
Samsung SDS and Dunamu explore stablecoin and digital finance infrastructure
During its Q2 earnings call, Samsung SDS CEO Lee Jun-hee said the company is discussing potential cooperation with Dunamu on stablecoin infrastructure, digital asset systems, and AI-based payment business models. Lee also referenced Samsung SDS’ own work in tokenized securities and stablecoin workflow validation as proof points for why it expects the partnership to strengthen its position in digital asset infrastructure.
Lee noted that Samsung SDS has already secured “differentiated business capabilities” through the Korea Securities Depository’s tokenized securities platform project and through end-to-end validation of a full stablecoin process—from issuance through settlement. The company’s stated aim is to combine its IT services, cloud and security capabilities with Dunamu’s blockchain expertise.
In the Q2 transcript, Samsung SDS said the partnership goal is to “lead this market” by pairing the two firms’ respective strengths. However, Samsung SDS did not provide additional detail on timelines, specific technical approaches, or the scope of any prospective commercial offering.
Cointelegraph previously reported Samsung Electronics’ plan to add stablecoin support to Samsung Wallet, and this new development suggests the Samsung ecosystem is aligning infrastructure capability with consumer-facing wallets. While Samsung Wallet would be a distribution layer, stablecoin infrastructure and enterprise digital asset systems typically sit behind the scenes—supporting issuance, settlement, custody integrations, and compliance-oriented workflows.
Earlier stake tie deepens: strategic rather than financial intent
The talks with Dunamu follow a prior move that increased Samsung affiliates’ exposure to South Korea’s digital asset sector. In May 2026, Samsung Securities, Samsung SDS and Samsung Card agreed to buy a combined 4% stake in Dunamu. That transaction strengthened existing commercial ties and underscored that Samsung-related companies are looking beyond pilots.
In the latest Q2 call, Lee reportedly characterized Samsung SDS’ investment in Dunamu as strategic rather than purely financial. He said both companies plan to refine potential business models for digital financial infrastructure, suggesting that any future cooperation could extend beyond infrastructure experiments into more defined productization.
Samsung SDS did not immediately respond to Cointelegraph’s request for comment, and Dunamu declined to comment. That limits what can be said publicly about how negotiations are progressing or whether agreements are already in place for specific use cases.
How Samsung SDS’ cloud and AI expansion could reinforce digital finance plans
Samsung SDS’ stablecoin and digital asset ambitions are being presented alongside broader growth in cloud and AI services. In its Q2 earnings presentation and related figures, Samsung SDS reported Q2 revenue of 3.72 trillion Korean won (about $2.6 billion), up 5.9% year on year. The company cited cloud momentum as a major contributor, including a 17% increase in cloud revenue from the prior year and a jump in external cloud business revenue of 75%.
Samsung SDS attributed part of the external cloud growth to demand for its cloud platform and graphics processing unit-as-a-service offerings. That emphasis matters because stablecoin infrastructure and tokenized financial systems often depend on the same enterprise capabilities—secure hosting, scalable compute, identity and access controls, and reliability under transaction load.
The company also reportedly outlined plans to expand its AI infrastructure capacity—from about 110 megawatts today to 230 MW by 2029, and more than 800 MW by 2031. If executed, such expansion would further position Samsung SDS to deliver data-intensive services for AI-driven finance workflows, including risk analytics, fraud detection, and automated settlement-related monitoring.
Still, investors and builders should distinguish between infrastructure readiness and regulatory authorization. Stablecoin use in retail payments, treasury operations, or tokenized assets typically depends on compliance frameworks and the specific licensing/oversight model in the relevant jurisdiction.
What this means for South Korea’s digital finance ecosystem
South Korea has been moving toward clearer stablecoin and crypto regulation, and industry participants are watching how the rules will translate into real, compliant payment and settlement deployments. Earlier coverage from Cointelegraph noted that a South Korea report proposed stablecoin rules ahead of a broader crypto law framework.
Against that backdrop, Samsung SDS’ focus on end-to-end stablecoin process validation—from issuance to settlement—reads like an attempt to be ready for both technical and compliance requirements. Rather than targeting speculative applications, the company appears to be building capabilities that can support regulated flows once the legal environment permits or clarifies specific models.
At the same time, the partnership’s practical impact will hinge on what “AI-based payment business models” ultimately involve. AI can be used in customer authentication, compliance monitoring, market surveillance, and payment risk assessment, but the boundaries of acceptable use will depend on data policies and the final regulatory approach.
For traders and users, these initiatives may not immediately change day-to-day trading volumes or retail access. For developers and institutional stakeholders, however, infrastructure partnerships can matter because they affect integration timelines, operational reliability, and the availability of custody/settlement tooling that exchanges and financial platforms can adopt.
Next, the key question is whether Samsung SDS and Dunamu will move from exploratory cooperation into concrete deployments—particularly in stablecoin issuance/settlement workflows and any wallet or payment integrations tied to Samsung’s consumer products. Observers should also watch for updates as South Korea’s stablecoin regulatory trajectory progresses, since the permitted use cases will likely determine what infrastructure work can scale commercially.

BRABUS ULTIMA 55 Luxury Catamaran Boasts 1,450 Horsepower, Foils, and a Deck That Swallows a Party

England and fellow UEFA nations set to unanimously BOYCOTT World Cup after FIFA’s plans to sell shares to private investors

Stellantis swings to profit on rising demand in North America


-

 Fashion6 days ago
Weekend Open Thread: Brooks Brothers
-
 Sports4 days ago
Commonwealth Games boxing: Jadumani Singh seals dominant 5-0 win over Pakistan’s Sumama Rehman to enter quarter-finals | Commonwealth Games News
-

 Business19 hours ago
Why Trees Belong on the Risk Register
-

 Tech4 days ago
Intel is reversing course and bringing hyper-threading back to its server chips
-

 Crypto World5 days ago
Ripple bought a bank in pieces. The $4 billion audit
-

 Politics3 days ago
Luke Littler dismantles Gerwyn Price to retain title in Blackpool
-

 Politics2 days ago
The Part of the Electric Transition Nobody Wants to Discuss
-
 Entertainment6 days ago
A New Post-Apocalyptic Gundam Anime Series Blasts Into SDCC
-

 News Videos4 days ago
BITCOIN JUST ENTERED THIS CRITICAL ZONE…
-

 Fashion6 days ago
16 Dresses for the High Summer Event
-

 Sports7 days ago
2026 3M Open leaderboard: Scottie Scheffler finds putter in Round 1, sits three back
-

 News Videos7 days ago
The Peugeot Family: How 200 Years of an “Old Money” Dynasty Died in A Boardroom
-

 Business1 day ago
Major shareholder moves on Canyon
-

 Crypto World4 days ago
XRP Ledger adds $2.6B as RWA inflows rank second
-

 Politics4 days ago
Spain sweeps the board at 2026 World Cup with individual awards
-

 News Videos3 hours ago
Bitcoin Enters the 3rd Stage of the Bear Market
-
 Entertainment2 days ago
‘Stargate’ Creator’s New Sci-Fi Series Returns for Season 3 Tomorrow
-

 Tech5 days ago
Anthropic launches Claude Opus 5, a cheaper AI model for coding, agents and enterprise workflows
-

 Crypto World2 days ago
Kraken Enables Retail Access to Jersey Mike’s IPO via Tokenized Shares
-

 Entertainment5 days ago
Sara Gilson Killed By Husband After Viral “Pedophile” TikTok Video
You must be logged in to post a comment Login