

Crypto World
5 Critical Stocks to Monitor Next Week: Nvidia (NVDA), Broadcom (AVGO), CrowdStrike (CRWD), UnitedHealth (UNH), and Marvell (MRVL)

Key Takeaways
- Nvidia (NVDA) continues to serve as the primary barometer for AI infrastructure investment and market confidence
- Broadcom (AVGO) confronts investor skepticism following a sharp decline despite delivering solid quarterly performance
- CrowdStrike (CRWD) experienced a post-earnings downturn even after boosting forecasts and revealing a stock split
- UnitedHealth (UNH) emerges as a preferred choice for investors seeking shelter in defensive healthcare positions
- Marvell (MRVL) experienced an AI-fueled rally before retreating, setting up a critical test in the coming sessions
Five companies—Nvidia, Broadcom, CrowdStrike, UnitedHealth, and Marvell—will command significant attention from investors during the upcoming trading week. These names represent crucial market narratives: the artificial intelligence revolution, cybersecurity expansion, healthcare stability, and evolving investor risk preferences.
Nvidia and Marvell at the Forefront of AI Momentum
Nvidia continues to hold its position as the market’s most influential equity. The stock serves as a proxy for AI infrastructure investment trends, with its price action offering insight into broader confidence levels surrounding the artificial intelligence sector. Despite a modest retreat from recent highs, Wall Street analysts maintain their bullish outlook on the company’s long-term prospects.
Marvell captured headlines recently following reports that Nvidia CEO Jensen Huang hinted the semiconductor firm could eventually achieve a trillion-dollar market capitalization. The speculation triggered a substantial rally in shares. However, Marvell subsequently retreated in tandem with the broader chip sector, creating uncertainty as the new week approaches.
A swift return of buying interest in these two names would reinforce the durability of the AI investment thesis. Conversely, continued weakness might prompt questions about valuation levels and whether expectations have outpaced fundamentals.
Nvidia’s leadership position stems from its GPU dominance, advanced networking solutions, and expanding AI software ecosystem. Meanwhile, Marvell has gained prominence through its specialized AI chip designs and cloud infrastructure offerings, establishing itself as a frequently discussed Wall Street favorite.
Broadcom and CrowdStrike Face Market Scrutiny
Broadcom delivered impressive quarterly results but stumbled when its forward guidance failed to exceed lofty market expectations. Shares tumbled in response. The upcoming week will reveal whether investors view this correction as an attractive entry point or the beginning of broader pressure on AI-adjacent equities.
CrowdStrike similarly declined following its earnings release, despite posting robust numbers, elevating guidance, and announcing a stock split. The selloff reflected valuation anxieties rather than operational concerns.
Cybersecurity investment remains on an upward trajectory. Enterprises continue allocating larger budgets toward cloud security solutions, endpoint defense systems, and AI-enhanced threat monitoring capabilities. A rebound in CrowdStrike’s stock price would indicate revived investor enthusiasm for high-growth software companies.
Broadcom maintains strategic importance in the AI landscape through its custom silicon offerings and networking infrastructure products. A recovery in its shares could generate positive spillover effects throughout the semiconductor industry.
UnitedHealth Gains Traction as a Safe Haven
UnitedHealth has captured increased investor attention following a positive analyst rating revision. As technology stocks experience heightened volatility, capital is migrating toward healthcare as a more dependable sector.
UnitedHealth benefits from predictable revenue streams and a commanding market presence. These characteristics enhance its appeal during periods of market turbulence.
Market participants will monitor whether institutional capital continues shifting into healthcare equities. Should this trend persist, UnitedHealth could emerge as a reliable outperformer amid choppy market conditions.
Collectively, these five equities encapsulate Wall Street’s dominant investment themes: AI infrastructure buildout, cybersecurity market expansion, and the pursuit of stability when facing market uncertainty.


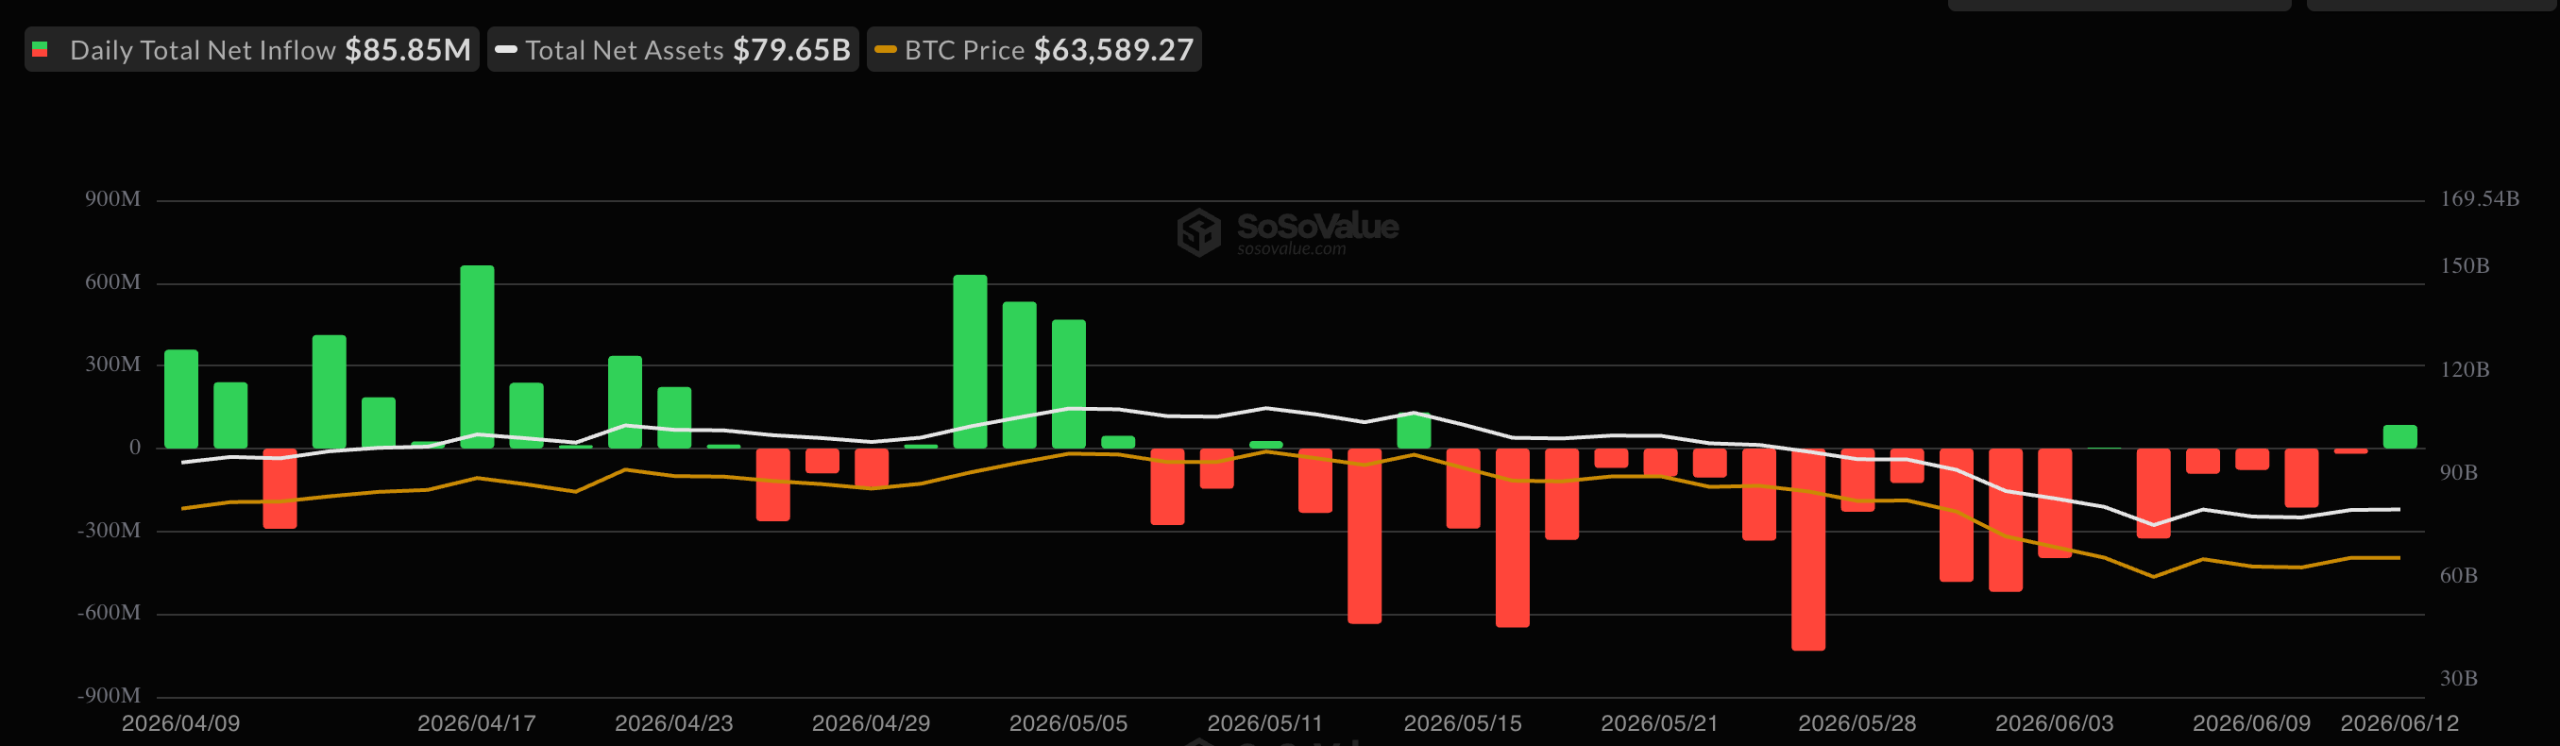
Bitcoin spot exchange-traded funds drew $85.85 million in net inflows on June 12, the largest single-day in about 4 weeks. The reversal arrived on the same day SpaceX made its record Nasdaq debut.
The inflow broke a five-session withdrawal streak that pulled roughly $727 million from the funds.
BTC ETF Inflows Return After a Bruising Stretch
The June 12 total marks the strongest single-day demand since May 14, when the funds absorbed $131.31 million. Cumulative net inflows now stand at $53.62 billion, with total net assets near $79.65 billion.

The previous days ran the other way. Outflows struck on June 5, 8, 9, 10, and 11, draining capital before the trend flipped. The funds had shed money for 13 straight sessions from May 15 to June 3. That run stands as their longest outflow streak since launching in early 2024.
Geopolitics drove much of that pressure. Tensions across the Middle East pushed Bitcoin toward $59,000. Bitcoin is still down about 20% over the past month.
Sentiment then shifted on June 11. President Donald Trump said he had canceled planned US strikes on Iran, citing progress toward a deal.
Bitcoin rebounded above reclaimed $63,000. The diplomatic push gained further pace today. Pakistani Prime Minister Shehbaz Sharif said that “finalisation likely expected in the next 24 hours.”
Follow us on X to get the latest news as it happens
The news has lifted the largest cryptocurrency higher. BeInCrypto Markets data showed that BTC was up 0.17623% over the past day. At press time, it traded at $63,868.

Bitcoin Holds Firm as SpaceX Storms Its Nasdaq Debut
The inflow coincided with another major market development. SpaceX shares began trading on the Nasdaq on June 12 under the ticker SPCX. The stock was priced at $135, opened at $150, and closed near $161.
The offering raised about $75 billion at a valuation of $1.7 trillion. That total ranks as the largest IPO on record.
A raise that size competes for investor capital. However, the flow data cuts the other way. Bitcoin ETFs pulled in capital, and BTC recovered, signs that crypto demand held up rather than rotated out.
Attention now turns to the Federal Reserve. Its June 16-17 meeting could decide whether the inflows hold or fade.
Subscribe to our YouTube channel to watch leaders and journalists provide expert insights
The post Bitcoin ETFs Post Biggest Inflow In 4 Weeks on SpaceX IPO Day appeared first on BeInCrypto.

TLDR:
- Bitcoin mining difficulty dropped 9.55%, marking the second-largest downward adjustment recorded in 2025.
- Network hashrate fell from near 1 ZH/s in May to roughly 861 EH/s around June 10 before partially recovering.
- The difficulty reset is expected to lift BTC output per active hashrate by over 9%, pushing hashprice above $30/PH/s.
- Power reallocation toward AI and HPC workloads is driving structural hashrate decline beyond short-term price pressure.
Bitcoin mining difficulty has dropped by approximately 9.55%, marking the second-largest decline recorded this year.
The adjustment follows a sustained slide in network hashrate after bitcoin’s price briefly plunged to around $60,000 in early June before recovering to near $64,000.
The reset lowers the computational work required to mine a block, offering direct relief to miners squeezed by thinning margins. Output per active hashrate is set to rise by more than 9% as a result.
Hashrate Collapse Triggers Steep Difficulty Adjustment
Bitcoin’s network hashrate had been holding near 1 zettahash per second (ZH/s) at the close of May. It then fell sharply to approximately 861 exahashes per second (EH/s) around June 10, before recovering moderately to about 894 EH/s in recent days.
That sustained decline over the two-week epoch triggered Bitcoin’s automatic recalibration mechanism. The resulting 9.55% drop is now confirmed as the second-largest downward difficulty adjustment of the year.
The adjustment directly reshapes mining economics across the network. A lower difficulty setting means each unit of active hashrate now produces more bitcoin per day than it did before.
That increase in output per hashrate is expected to push hashprice back above $30 per petahash per second. Hashprice had fallen below that level following the early June price crash, tightening margins across the industry.
The $30/PH/s threshold is a closely watched line for operators managing older or less efficient fleets. According to TheEnergyMag, the difficulty drop is expected to increase BTC output per active hashrate by over 9% and may also push mining hashprice back above $30 per PH/s.
Below that mark, sites running legacy hardware or carrying higher electricity costs move closer to gross breakeven before overhead and debt are factored in.
Texas-based miners likely played a role in the hashrate volatility as well. June marks the start of the state’s 4CP season under ERCOT, when large power consumers reduce load during four critical summer peak intervals to lower their transmission cost allocation for the following year.
That mechanism pushes bitcoin miners to curtail operations during potential peak windows, temporarily removing significant hashrate from the network regardless of real-time power prices.
AI and HPC Redeployment Pulls Capacity from Bitcoin Mining
Not all of the hashrate decline was tied to price pressure or seasonal curtailment. Several publicly listed miners have been actively unplugging rigs and redirecting power capacity toward high-performance computing and AI data center workloads.
That structural shift removes bitcoin hashrate even when the underlying power infrastructure remains fully operational and under contract.
The pivot toward HPC and AI reflects a deliberate strategy by major mining companies to diversify revenue. As TheEnergyMag reported, beyond the shutdown of older mining rigs due to profitability pressure, another key driver of the hashrate decline is the reallocation of power capacity toward high-performance computing and AI data centers.
Long-term computing contracts with enterprise clients offer more stable cash flow compared to bitcoin’s variable hashprice environment.
Power capacity that once drove network hashrate is now being allocated to contracted AI workloads under a different business model entirely.
Several public miners have been unplugging mining rigs or slowing mining growth as they retrofit sites for contracted AI and HPC use, a strategy that can remove bitcoin hashrate even when the underlying power capacity remains in use. That transition is reshaping how mining infrastructure is deployed across North America.
The partial hashrate recovery seen in recent days points to some of the June decline being temporary. Curtailments tied to Texas’s 4CP window and short-term economic responses likely account for a portion of the drop rather than permanent fleet shutdowns.
Even so, the continued migration of mining infrastructure toward AI use cases adds lasting downward pressure on network hashrate heading into the second half of the year.
The 9.55% difficulty drop offers a meaningful reset for operators who held through the June pressure, with improved margins now expected in the current epoch.

TLDR:
- XRP ETF inflows reached $10.68M in the latest week, marking five consecutive weeks of positive flows.
- Bitcoin and Ethereum ETF products recorded negative flows during the same five-week period.
- XRP price sits near $1.15, with analysts watching the $0.70–$0.90 range as a potential support floor.
- EMAs at $1.45 and $1.78 must be reclaimed before any macro trend reversal can be confirmed for XRP.
XRP ETF inflows have remained positive for five straight weeks, even as the broader crypto market faces ongoing pressure.
According to Coingecko data, XRP trades at $1.15 as of this writing, up 1.38% in the past 24 hours and 3.61% over the past seven days. Trading volume reached $1.115 billion within the same 24-hour window.
Source: Coingecko
Meanwhile, Bitcoin and Ethereum ETF products continue to record negative flows, making XRP’s institutional resilience a notable contrast in the current market cycle.
Institutional Demand Stays Firm Despite Market Volatility
XRP ETF inflows totaled $10.68 million in the most recent weekly period, according to SosoValue data. That capital entered across three separate trading sessions during the week. The consistency of those inflows sets XRP apart from other major digital assets at this time.
Bitcoin and Ethereum have both struggled to attract fresh ETF capital over the same period. Negative flows in those products reflect broader investor hesitation tied to prolonged market uncertainty. XRP, however, has maintained a different trajectory on the institutional side.
Five consecutive weeks of positive ETF flows suggest that institutional participants are not reacting to short-term price weakness.
They appear to be maintaining their positions regardless of the current price environment. That kind of behavior typically reflects longer-term positioning rather than reactive trading.
The separation between price performance and ETF flow data is worth noting here. XRP’s spot price remains under pressure, yet institutional demand through ETF channels continues without interruption.
That divergence adds a layer of context to how different market participants are reading the current conditions.
Price Structure Points to a Potential Cycle Bottom Zone
XRP spent nearly two years capped below the $0.70 to $0.80 resistance range before breaking out in Q4 2024. That breakout pushed price toward the July 2025 high before momentum reversed. The asset has since pulled back from its January 2026 peak to current levels near $1.04 to $1.15.
Analyst X Finance Bull noted that the current price range represents a defined “area of interest” on the chart. That zone is being watched as a potential cycle bottom between now and Q4 2026. The old resistance band between $0.70 and $0.90 may now act as a support floor.
X Finance Bull stated: “The ceiling that capped XRP for years becomes the floor that holds it.” However, the analyst was clear that no bottom confirmation exists yet. The EMAs at $1.45 and $1.78 still need to be reclaimed before any macro reversal can be established.
Until those levels are recovered, the price structure remains in a phase that tests holder conviction. The underlying fundamentals have not changed according to the analysis. Price behavior of this kind often precedes the next directional move in longer market cycles.
Bitcoin remains under significant selling pressure after losing a major higher-timeframe structure and breaking below several key support levels. While buyers have managed to defend the $60K region for now, both the technical and on-chain pictures suggest that the market is still in a vulnerable phase. A legitimate recovery requires BTC to reclaim several overhead resistance zones.
Bitcoin Price Analysis: The Daily Chart
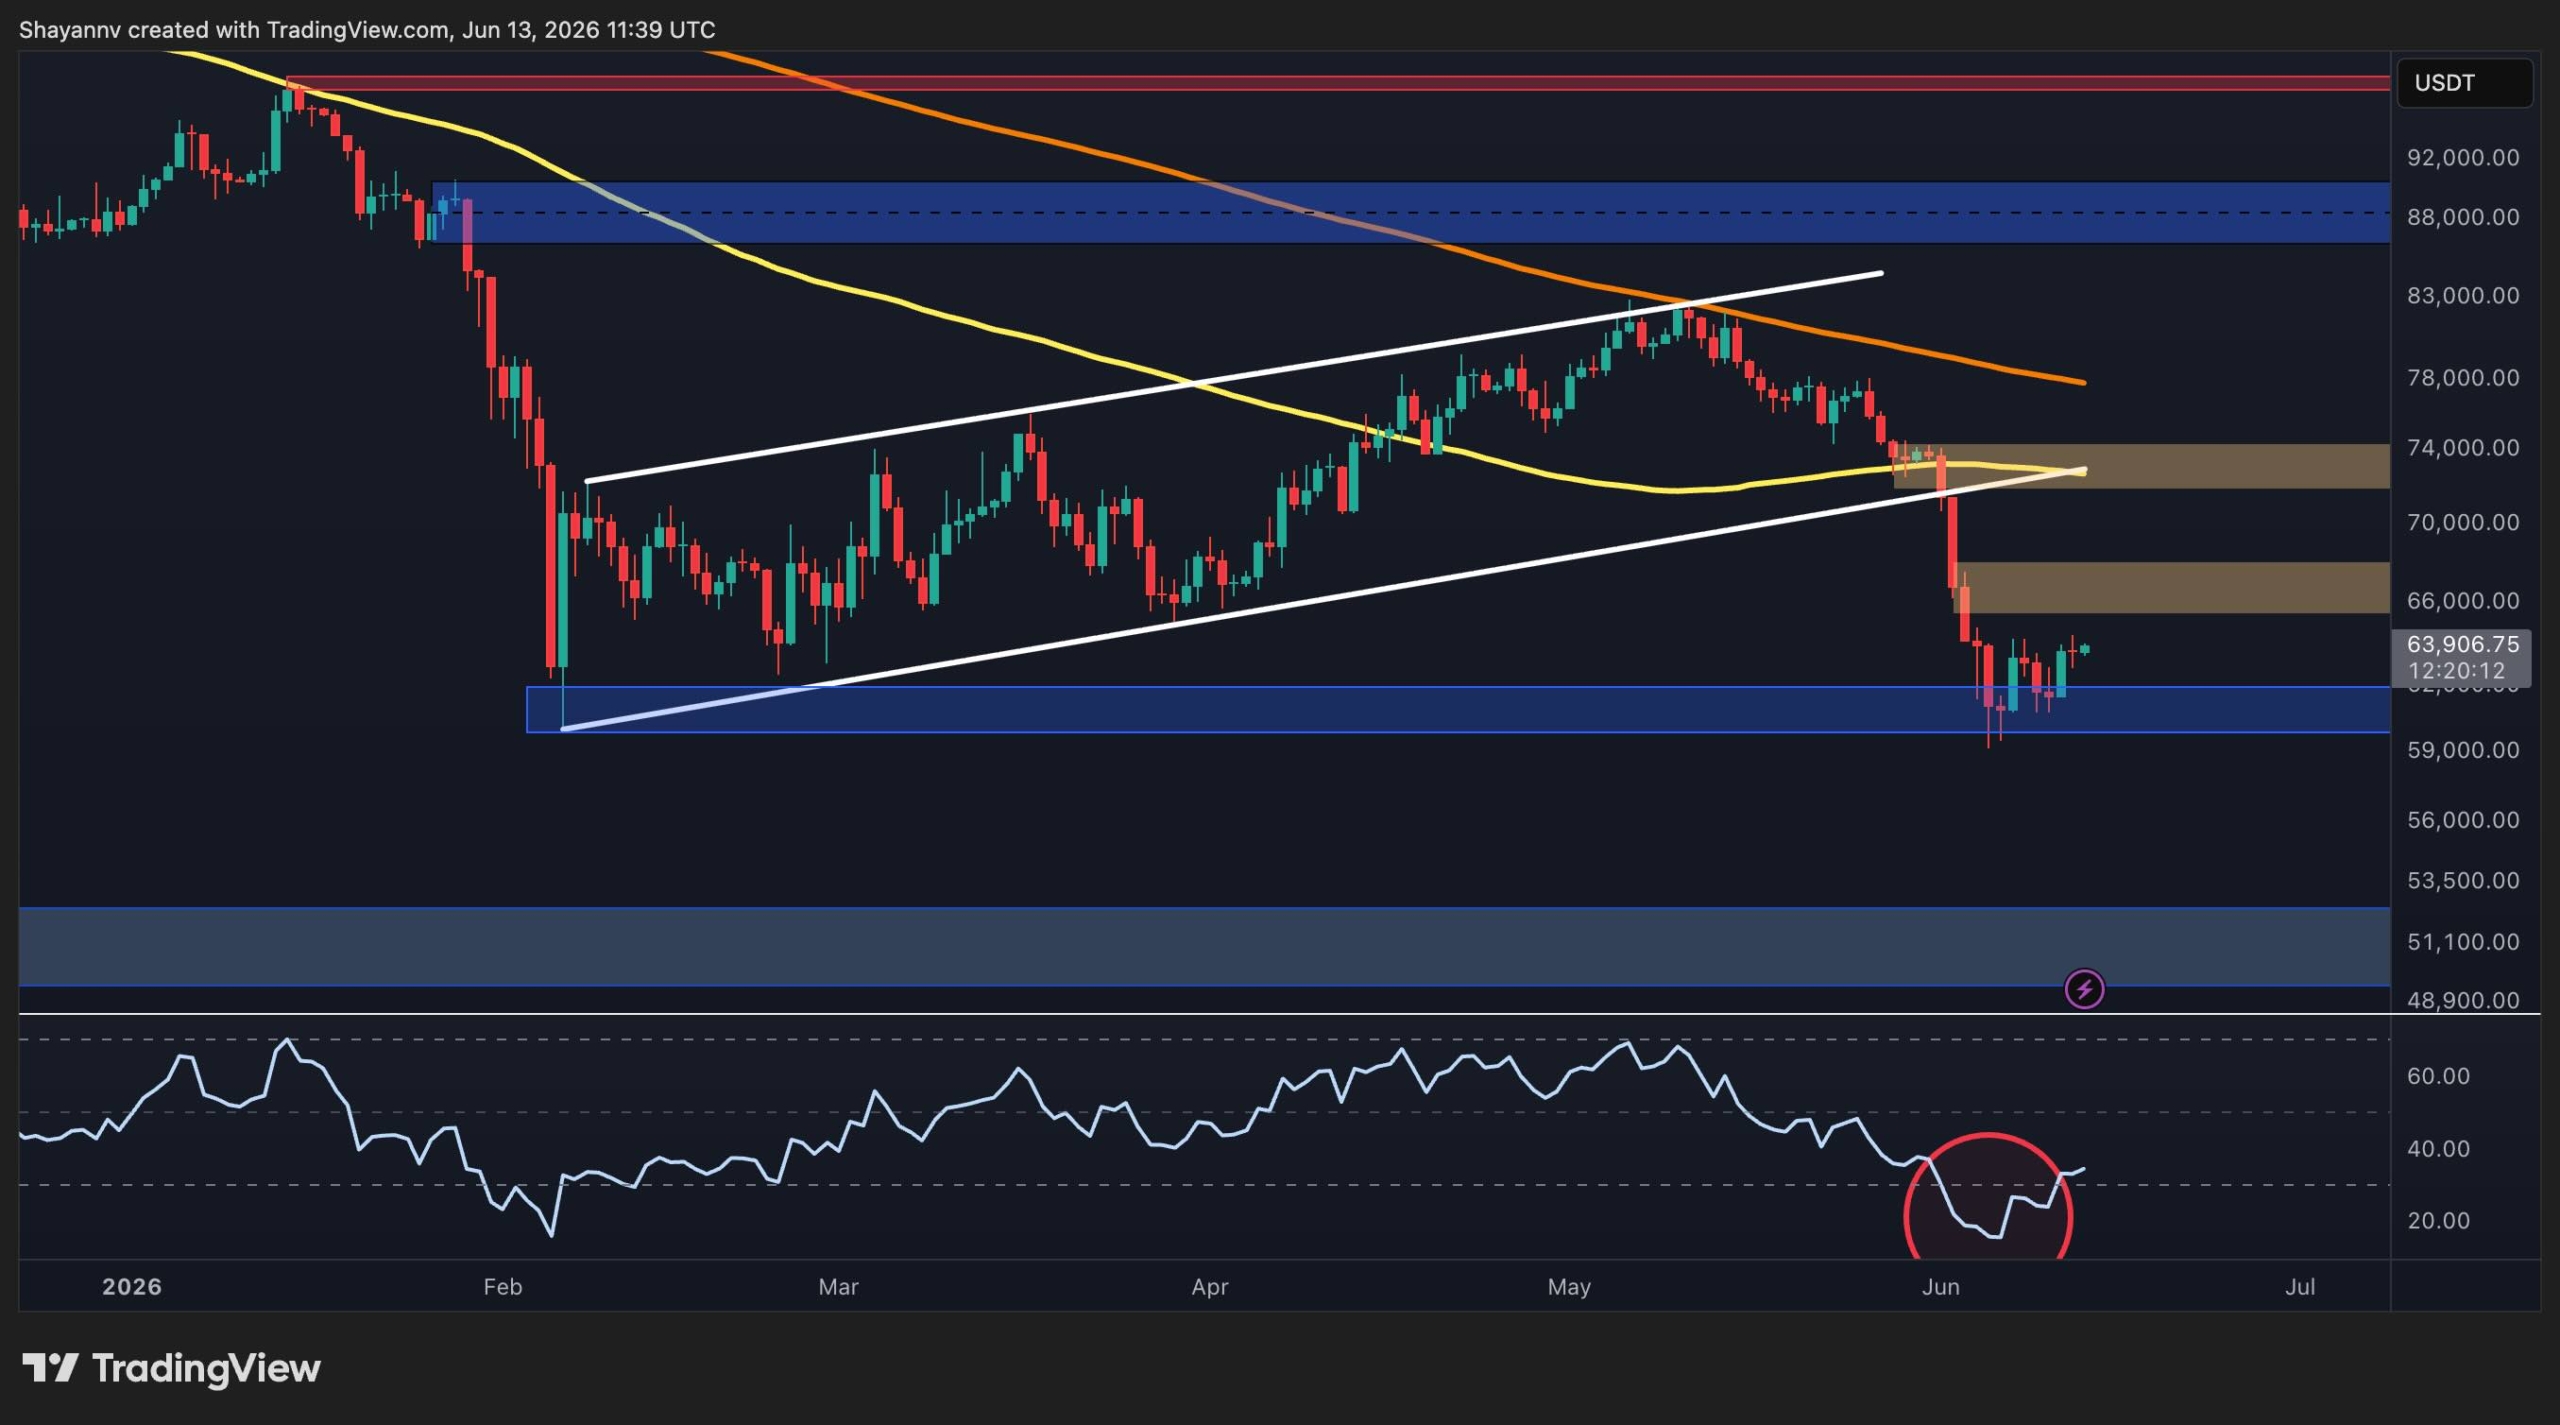
On the daily timeframe, BTC has completed a decisive breakdown from a large rising channel that had supported the price action throughout almost the first half of the year. The breakdown accelerated once the market lost the $70K psychological support zone, and was followed by an aggressive decline of around $10K in just 4 days.
Following the selloff, Bitcoin dropped into the major support region around $60K, where buyers have finally stepped in. The recent candles and the RSI rebounding from deeply oversold values show stabilization above the $60K zone. This has prevented a deeper decline toward the next significant support cluster around $51K.
The general structure, however, remains bearish. The asset continues to trade below both the 100-day and 200-day moving averages, which are currently converging above the $70K region. These moving averages will act as dynamic resistance and reinforce the importance of the overhead supply zone.
If BTC attempts a recovery, the first major resistance lies between $65K and $68K. Above that, sellers are likely concentrated in the $72K-$74K supply zone, which coincides with the breakdown area and former channel support. Reclaiming this zone would be necessary to invalidate the current bearish structure on the daily timeframe.
BTC/USDT 4-Hour Chart
The 4-hour timeframe reveals the first signs of short-term stabilization after an aggressive decline. Following the sharp breakdown from $74K, Bitcoin found support around $60K and has since formed a small ascending channel, which shows improving short-term momentum. The RSI has also recovered from deeply oversold conditions and is gradually pushing higher as bearish momentum is beginning to cool.
Despite this improvement, the current recovery remains relatively modest. The market is approaching the first significant supply zone between $65K and $68K. This area could attract renewed selling pressure and determine whether the rebound develops into a larger recovery or simply another lower high.
A successful breakout above $68K would likely trigger a move toward the more critical $72K-$74K resistance region. Conversely, a breakdown of the current recovery channel could expose the $60K support once again. Losing that level would significantly increase the probability of a deeper decline toward the $51K region. Yet, for now, the short-term structure favors consolidation and relief rallies, but confirmation of a general trend reversal remains absent.

On-Chain Analysis
The UTXOs in Profit (%) metric presents one of the most notable developments on the on-chain side. This indicator measures the percentage of Bitcoin’s unspent transaction outputs currently held at a profit. Historically, readings above 90% have been associated with strong bull market conditions, while sharp declines often accompany major corrections and periods of capitulation.
The metric has recently collapsed to roughly 50%, marking one of the steepest deteriorations in network profitability visible on the chart. At current levels, only about half of all UTXOs remain in profit, reflecting the severity of the recent correction and the amount of underwater supply now present in the market.
Historically, such sharp contractions in profitability often emerge during late-stage correction phases when weaker holders have already been forced out of positions. However, they can also precede extended consolidation periods as the market attempts to absorb the newly realized losses.
The combination of BTC holding above the $60K support zone while UTXO profitability sits near cycle lows creates an important inflection point. If buyers can defend current levels and push the price back above key resistance areas, the extreme decline in profitability could eventually be viewed as a capitulation signal. Until then, the on-chain data continues to reflect a market that has experienced significant stress and has yet to fully recover its previous bullish momentum.

The post Bitcoin Price Analysis: BTC’s Recovery May Be a Trap as $51K Risk Lingers appeared first on CryptoPotato.
Crypto World
How Audited Corporate Balance Sheet Backing Establishes BlockDAG As The Next Big Crypto Coin

The digital asset ecosystem in 2026 is experiencing a significant crisis of confidence regarding unbacked algorithmic valuation structures. Multiple early-stage utility protocols have faced severe capital drawdowns due to a lack of tangible liquidity reserves to support their active market capitalizations. This systemic vulnerability has made corporate transparency and verified financial accountability the most critical metrics for modern asset selection.
Strategic allocators are no longer willing to risk capital on projects that depend entirely on retail trading volume to sustain value. Instead, institutional capital flows are shifting toward networks that feature audited balance sheets and dedicated corporate reserves.
Moving Past Unbacked Speculative Trading Volumes
Traditional token economic structures depend heavily on constant secondary market demand to maintain stable pricing levels, making them highly vulnerable during liquidity contractions. When retail interest declines, these unbacked assets often experience rapid price drops that wipe out long-term community value. Advanced blockchain protocols are correcting this structural flaw by shifting from speculative volume dependency to institutional-grade treasury backing models. By linking network valuation to audited financial reserves, corporate entities can provide a solid structural safety net for their ecosystems, protecting participant capital from sudden open-market liquidations.

The danger of unbacked platforms becomes obvious during macro economic downturns when global trading volumes drop across all major exchanges. Without a tangible financial backstop, unbacked utility networks have no way to absorb aggressive short-selling or forced liquidations from defaulting institutions. This lack of structural padding causes a complete breakdown in token value, leaving retail holders holding illiquid assets. Shifting toward a corporate treasury model solves this issue by ensuring that the core network value is sustained by audited real-world capital reserves rather than speculative retail participation.
The Reality of Audited Treasury Reserve Mechanisms
BlockDAG sets a new benchmark for corporate compliance by establishing a fully audited treasury reserve structure designed to fund its ongoing buyback campaign. The guaranteed 113X mathematical multiplier offered inside the native dashboard does not rely on retail trading volume or external public market momentum to sustain execution. Instead, the entire settlement framework is fully backed by secured corporate liquidity reserves held within verified treasury custody vaults. This level of balance sheet backing ensures that every single token registered via the direct swap interface is fully accounted for by audited stablecoin assets ahead of the final distribution phase.

These treasury reserves undergo strict independent financial audits to ensure total transparency for all participating parties. The asset allocation pool is completely ring-fenced from standard network operational expenses, ensuring that buyback funds remain entirely untouched until the settlement date arrives. By maintaining this strict separation of capital, the corporate entity guarantees that every dashboard user’s 113X arbitrage yield is fully protected by liquid stablecoin assets. This professional financial framework brings traditional corporate treasury discipline to the digital asset sector.
Verifying Compliance for the Next Major Token Project
This high standard of financial compliance provides absolute certainty for both retail and institutional capital allocators as the platform prepares for its global market expansion. By building the buyback program on verifiable corporate reserves rather than speculative projections, the network eliminates counterparty risks. This transparent design makes the project a primary destination for conservative funds looking to insulate net worth during macro corrections. When evaluating the next big crypto coin, market analysts are pointing to this balance-sheet-backed infrastructure as the essential blueprint for sustainable, institutional-grade digital asset growth.

Furthermore, this institutional-grade transparency lays a clean foundation for the project’s long-term utility goals. By building trust with large-scale asset managers through audited financial disclosures, BlockDAG creates a secure environment for future corporate integrations. Large financial funds require verifiable balance sheet records before deploying substantial amounts of capital into any early-stage network. Meeting these compliance demands early ensures that the project remains completely detached from the typical regulatory risks that affect unbacked digital assets.
In Conclusion
Relying on speculative market sentiment to support asset valuations has proven to be an unreliable model for long-term wealth preservation. BlockDAG provides a superior financial alternative by anchoring its entire ecosystem directly to fully audited corporate treasury reserves. Guaranteeing a $0.05 USDT exit for entries secured at $0.00000044 ensures that the 113X arbitrage loop remains fully insulated from external order-book variables.
As investors search for the next big crypto coin, BlockDAG’s secure corporate balance sheet framework provides the transparency and mathematical certainty needed to navigate volatile market environments safely.

Presale: https://purchase.blockdag.network
Website: https://blockdag.network
Telegram: https://t.me/blockDAGnetworkOfficial
Discord: https://discord.gg/Q7BxghMVyu
Disclaimer: This is a Press Release provided by a third party who is responsible for the content. Please conduct your own research before taking any action based on the content.


For Elon Musk’s company, it’s a rounding error against a valuation of over $1.8 trillion: small enough that the stock will never trade on it, yet large enough to normalize the asset in a way no dedicated vehicle can.
For years, onchain analysts estimated SpaceX held about 8,300 bitcoin. The S-1 then revealed the real number was more than twice that, meaning one of the most scrutinized private companies in the world held a billion-dollar bitcoin position, and the public’s best guess was off by half until securities law forced the answer.
Now the position lives under public company rules.
Fair-value accounting means every quarterly report marks bitcoin to market, recording gains and losses whether or not SpaceX trades the coin. Tesla showed how that looks in a drawdown, booking hundreds of millions in paper losses on a position it wasn’t selling.
SpaceX arrives with bitcoin 37% already below its January high, though its roughly $35,000 cost basis means the stake is still up about 80% from its initial buys.
Neither Tesla nor SpaceX — both Elon Musk-owned firms — have ever shown an appetite for trading its stack. These companies continue to hold (at least for now) bitcoin through public earnings cycles and analyst questions, while the position swings, hands every Fortune 500 finance chief a working example of a mega-caps that treat bitcoin as a reserve asset, absorbs the earnings noise and moves on.


Crypto tried to solve this with its own version of yield. We tried staking rewards, liquidity mining, and levered DeFi strategies. At first glance, they looked productive. But too much of that yield was circular. It depended on token emissions and fresh inflows, not real economic activity. That story is a much harder sell now. What investors want is yield that is durable, transparent, and tied to something real.
The next step is not more crypto-native yield. It is putting onchain dollars into real assets. The opportunity is not to build better wrappers for cash, but to connect onchain dollars to assets investors already know how to price: money market funds, U.S. treasuries, corporate bonds, and credit. This is not about chasing the hottest yield on the screen this week, but about making dollars onchain work harder without making them less useful.
This shift has already started. Tokenized real-world assets are now a meaningful onchain category beyond stablecoins, and tokenized treasuries alone are already worth billions. But treasury tokens by themselves do not fully solve the problem. In most cases, they remain separate investment products. The bigger opportunity is a dollar you can still use across crypto, while it quietly earns from real assets underneath.
Zcash founder Zooko Wilcox says an AI-powered security audit of the privacy-focused cryptocurrency found no serious vulnerabilities in its core protocol. The review was conducted using Anthropic’s Claude Mythos model, at the request of Shielded Labs, a Swiss non-profit that supports Zcash development.
Wilcox made the claim in an X post on Saturday, adding that the audit did not uncover “any more serious bugs” in the Zcash protocol. The announcement arrives after a separate, well-documented emergency response earlier this month involving Zcash’s Orchard shielded pool.
Key takeaways
- Wilcox said Anthropic’s Claude Mythos audit did not find serious vulnerabilities in Zcash’s protocol, requested by Shielded Labs.
- Developers temporarily suspended Orchard transactions on June 3 after a vulnerability was found in the shielded pool, then restored functionality via an emergency upgrade.
- The Orchard issue traced back to a four-year-old forgery bug discovered with help from Anthropic’s Claude Opus 4.8 model.
- The Zcash Foundation said there was no evidence of exploitation, no unauthorized value creation, and privacy was unaffected.
- Beyond Zcash, Anthropic’s new AI security tooling has also raised broader crypto security and governance concerns, including changes to public access.
AI audit finds no “serious” issues in Zcash protocol
In his Saturday statement, Zooko Wilcox tied the latest protocol-level review to Anthropic’s Claude Mythos. According to Wilcox, the audit—requested by Shielded Labs—did not reveal “any more serious bugs” in the Zcash protocol.
This matters for Zcash participants because the protocol is designed to preserve user privacy via shielded mechanisms, where security failures can create both technical and trust risks. While no audit can guarantee absolute safety, an explicit “no serious vulnerabilities” finding is still significant for a system that handles sensitive transaction data through cryptographic constructions.
June Orchard incident: what was found and how it was contained
Just before the latest audit claim, Zcash developers took urgent action around the Orchard shielded pool. On June 3, they temporarily suspended Orchard transactions after discovering a vulnerability affecting that privacy layer.
Functionality was restored later that day through an emergency upgrade, limiting the duration during which users could not transact through Orchard. The vulnerability was ultimately described as stemming from a four-year-old forgery bug in the Orchard shielded pool, discovered by security researcher Taylor Hornby with the help of Anthropic’s Claude Opus 4.8 model.
In a statement, the Zcash Foundation said there was no evidence the vulnerability was exploited and that it detected no unauthorized value creation. It also said user privacy was unaffected—an outcome that matters in a privacy-preserving system, where even some non-exploit failures could potentially leak information or weaken confidentiality.
Why AI security tools are reshaping crypto defense—and the risks
The Zcash sequence also highlights a broader industry shift: AI models are increasingly being used to locate vulnerabilities in complex systems. At the same time, the same capabilities can concern security professionals and regulators because they may also be leveraged by adversaries.
Anthropic recently released the first public version of its Claude Mythos model, named Fable 5, according to coverage on Cointelegraph earlier this week. Anthropic previously said the Mythos model uncovered more than 10,000 high or critical-severity vulnerabilities in “systemically important software,” a claim that helped fuel debate about whether such models should be broadly accessible.
Anthropic also told users that Fable 5 was “made safe for general use,” including safeguards that reroute some cybersecurity-related topics to a different model, Claude Opus 4.8. However, just days later, Anthropic said it suspended access to its Fable 5 and Mythos 5 models, citing a US government export control directive tied to national security concerns.
The practical tension for the crypto sector is straightforward: faster vulnerability discovery can strengthen defenses, but accelerating the “find and exploit” cycle can also raise the odds of real-world compromises. In a recent interview with Cointelegraph, Mitchell Amador, CEO of bug bounty platform Immunefi, warned that rapid advancements are shifting the cybersecurity landscape toward threat actors—describing a “vulnerability apocalypse” that has contributed to renewed DeFi hacking pressure.
Cointelegraph also cited DefiLlama data showing that crypto hacks totaled $634 million in April, the highest monthly figure since the Bybit hack led to roughly $1.4 billion in losses in February 2025.
What to watch next for Zcash and the privacy-tech roadmap
For Zcash users, the key question is whether the emergency Orchard fixes fully address the class of problems implied by the forgery bug discovery—and whether ongoing protocol reviews can prevent similar issues from resurfacing. In the near term, observers will likely watch for follow-up documentation around the June upgrade and any additional security processes, especially as AI models continue to be used in both discovery and verification.

Analysts at the market research firm Glassnode have highlighted on-chain data indicating a weakening of speculative appetite for bitcoin (BTC) in traditional finance (TradFi) markets.
According to a tweet from the firm, most TradFi channels for Bitcoin exposure are giving off the same signal: BTC volume in treasury vehicles and exchange-traded funds (ETFs) is drying up.
Speculative Interest in BTC Cools
One metric that substantiates Glassnode’s claims is the 30-day Simple Moving Average (SMA) of the United States spot ETF trading volume. This indicator has contracted from $4.4 billion per day in October 2025 to roughly $0.96 billion daily currently. This shift represents a 78% decline, one significant enough to dry up volumes.
CryptoPotato reported that last week was the second worst for Bitcoin ETFs since their inception. As BTC fell to a 19-month low, the ETFs experienced massive net outflows, totaling $1.72 billion. The last time the products witnessed such withdrawals was in February 2025.
Glassnode revealed earlier today that the 30-day SMA of total trading volume across Bitcoin treasury companies has also plummeted from $34.2 billion per day in December 2025 to $17.4 billion per day currently. This 49% drop in trading volume among Digital Asset Treasury (DAT) companies further reflects a lack of speculative appetite for BTC in traditional channels, as interest in DAT equities closely tracks bitcoin’s price.
“Combined with the 49% drop in DAT company volumes flagged earlier, both TradFi channels for Bitcoin exposure are signaling the same thing: Speculative appetite for BTC in traditional markets has largely withdrawn,” Glassnode explained.
Spot Demand Contracts Too
Besides the decline in speculative and leveraged appetite for BTC exposure, spot demand has also pulled back significantly. This can be seen in investors selling into strength instead of increasing their exposure. As reported, the dynamic shift marks the transition from an accumulation phase into a distribution regime, subsequently leading to the cutting of Bitcoin activity in half from its peak.
At the time of writing, BTC was trading around $62,500, 22% below its price of $80,900 a month ago. The asset slipped below $60,000 last weekend amid selling pressure from investors. These are all clear indications that spot demand is in a contraction phase.
With institutional interest weakening and spot demand contracting, it remains to be seen how low BTC will go as the bears continue to steer the wheel.
The post Speculative Interest in BTC Fades Across Traditional Markets, On-chain Data Shows appeared first on CryptoPotato.
FIFA World Cup predictions have become the biggest business in prediction markets. Polymarket’s tournament winner market alone holds $2 billion in bets, while Kalshi runs 48 markets on the same question and banks the industry’s largest fees.
The two platforms agree on the football yet split the money in very different ways. BeInCrypto’s Dune dashboards across three venues show where volume, fees, and leftover crypto bets sit.
Sports Built a Record May for Prediction Markets
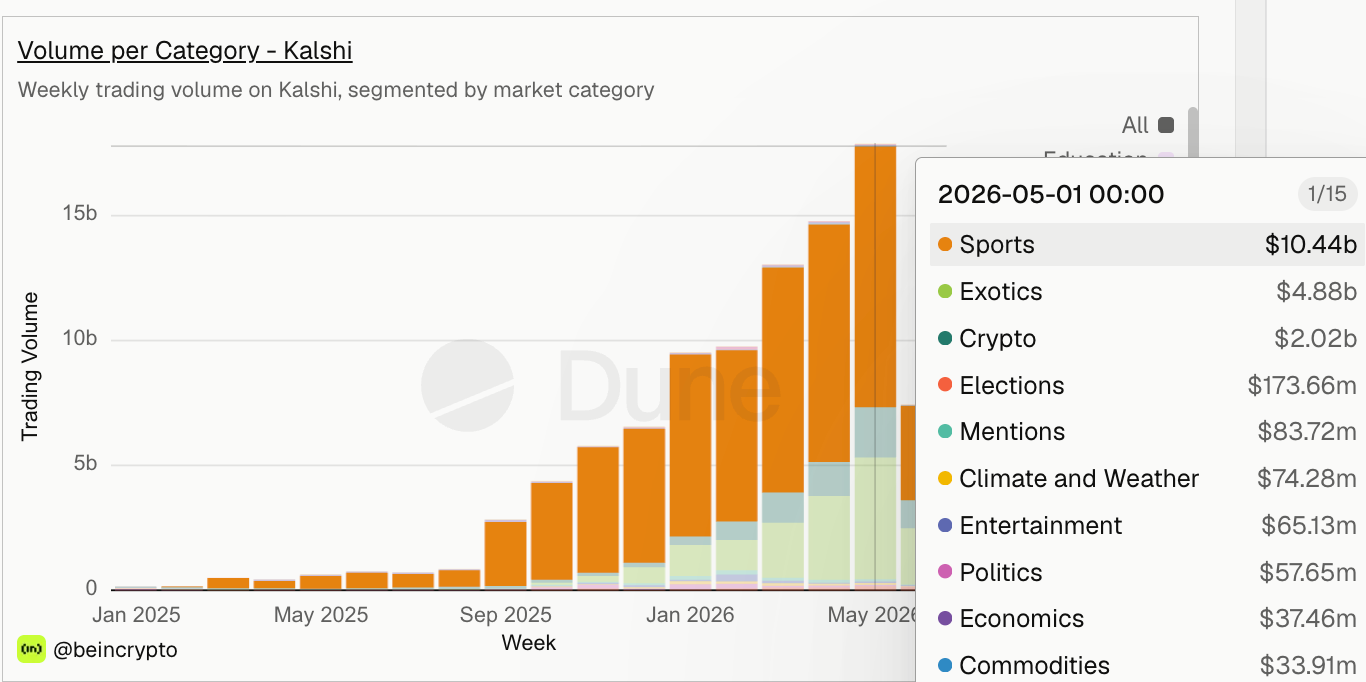
By Binance Research’s accounting, prediction markets turned over a record $31.2 billion in May, up roughly 15% from January. The same report puts Kalshi at 58% of that flow and Polymarket at 28%, with industry open interest reaching $1.3 billion.
BeInCrypto’s own data shows what filled Kalshi’s share. In the platform’s biggest month of 2026, that is May, sports trading volume reached $10.44 billion.
Elections, the category that made Kalshi famous, managed just $173.66 million that month, roughly 60 times less.

Crypto markets did $2.02 billion on Kalshi in the same period, while a sports-adjacent exotics bucket added $4.88 billion more. The pattern suggests the 2026 World Cup calendar, not politics or coin prices, now powers the platform’s growth.
Note: All weekly data points have been condensed into monthly data points.
June is already seeing Sports lead the way. And with almost the entire World Cup fixture to go, this figure might surge. It is worth mentioning that the Elections category on Kalshi is already nearing its May levels. This category might therefore steal some of Sports’ thunder.

The single biggest football market shows how concentrated that engine is.
One $2 Billion Market Against 48 Smaller Ones
Polymarket’s World Cup Winner market holds $2 billion in lifetime volume, $436 million in liquidity, and traded $137 million on Thursday alone. The platform’s FIFA World Cup section spans more than 330 active markets.

Kalshi’s equivalent event has built $182.3 million across 48 markets. On the largest listed events, the gap runs roughly 11 to 1 in Polymarket’s favor, and Thursday’s flow on Polymarket alone approached the lifetime volume of Kalshi’s biggest listed World Cup event.

The venues disagree on structure, not on football. Both books price the World Cup odds identically, with Spain favorite at exactly 17% and Kalshi paying 5.56x on Spain and France alike.
Kalshi spreads flow across dozens of match-level books while Polymarket pools it in one tournament-scale market. Kalshi still clears more total volume platform-wide, per Binance Research’s 58% share, so the contest is breadth against depth rather than big against small.
That concentration shows up across Polymarket’s entire year.
Sports have Led Polymarket All Year, and It’s Cooling
Sports topped every weekly category split on Polymarket in 2026. January saw sports at $6.20 billion, or 43% of the $14.34 billion total, ahead of politics at $4.49 billion and crypto at $3.65 billion.
Note: All weekly data points have been condensed into monthly data points.

The peak came in March, when sports did $8.77 billion of a record $19.58 billion in a month. By June this time, the total had cooled about 70% to $5.91 billion, yet the sports share climbed to 56.5%. Crypto held $1.73 billion and politics shrank to $831.25 million.

In other words, football dominance is not a tournament artifact. It predates the World Cup hype, and it deepens even as overall activity cools into the group stage.
Volume tells half the story. The fees tell the rest.
Kalshi Takes the Fees, Opinion Shows the Endgame
In May, Kalshi collected $137.86 million in trading fees, compared with Polymarket’s $28.07 million and Opinion’s $159,330. That is nearly a five-to-one revenue gap, consistent with Binance Research’s finding that Kalshi clears the most volume.

The dashboard tracks Kalshi fees from April onward, and both tracked months sit far above anything Polymarket has earned. So the betting money splits two ways, but the fee money flows overwhelmingly to Kalshi.
The smaller venue Opinion shows where this trend ends. In January, crypto led the platform with $729.52 million of a $1.46 billion week.
Note: All weekly data points have been condensed into monthly data points.

By the week of June 1, sports accounted for 99.4% of activity, while crypto fell below $500,000. FIFA World Cup predictions did not just grow there; they replaced the categories on which prediction markets were built.

The surprises stack up. Sports have now beaten crypto on every venue tracked, including the crypto-native ones, and politics collapsed to a rounding error barely a year after carrying the industry.
The platforms agree completely on the football, both pricing Spain. Most striking, the record May arrived while overall activity was already cooling.
What happens next decides the FIFA World Cup predictions race. Daily group-stage games favor Kalshi’s match-level structure, while knockout drama should feed Polymarket’s deep tournament pool, so the lead may change hands week by week.
Traders should watch whether kickoff revives total volume, whether the rebounding elections category claws share back from sports, and whether open interest keeps building into the knockouts.
If the group stage cannot reverse the slowdown, the prediction market boom will have peaked before the first whistle.
The post Polymarket vs Kalshi: Where are Fans Placing Their FIFA World Cup Predictions? appeared first on BeInCrypto.

Bitcoin ETFs Post Biggest Inflow In 4 Weeks on SpaceX IPO Day
Yung Miami Surprises Fans At Summer Walker’s Atlanta Concert

Delays expected in Knaresborough as Bed Race concludes


-

 NewsBeat6 days ago
Alexander Zverev wins the French Open to finally earn a 1st Grand Slam title
-
 Entertainment7 days ago
The Best Mystery Series of All Time Is Surging on Streaming 30 Years After It Ended
-

 Crypto World5 days ago
Anatomy of the June crypto crash: Fed, Iran, Saylor
-

 Crypto World2 days ago
Oppenheimer backs SpaceX as $70 billion retail frenzy builds
-

 Crypto World2 days ago
Markets Rally as SpaceX IPO Looms Amid Iran Tensions and Inflation Surge
-
Crypto World7 days ago
Senator Cynthia Lummis Calls CLARITY Act the Most Consequential Financial Legislation of This Generation
-
 NewsBeat6 days ago
Alexander Zverev conquers demons and outlasts Flavio Cobolli to win French Open for first major title
-

 Tech6 days ago
Microsoft unveils seven homegrown AI models in new bid for ‘long term self-sufficiency’
-

 Business5 days ago
High Stakes for Wembanyama as New York Pushes for 3-0 Lead
-

 Tech6 days ago
Notion restores access to Anthropic after service disruption
-
 Business7 days ago
The Pain Points Taking a Fragile Tech Rally Down a Notch
-
 Crypto World5 days ago
Eli Lilly (LLY) Stock Surges 4% Following Breakthrough Sleep Apnea Trial Results
-
 Business6 days ago
The investment to transform historic St Helen’s ground in Swansea
-

 Crypto World6 days ago
Trump’s AI Ownership Plan Could Benefit Anthropic at OpenAI’s Expense
-
 Sports4 days ago
Bangladesh beat Australia after 20 years in ODIs, register only their second win over six-time world champions | Cricket News
-

 Tech16 hours ago
NanoClaw integrates JFrog registries to secure AI agent downloads
-

 Crypto World11 hours ago
Bitget enters Argentina’s regulated crypto market through PSAV registration
-

 Tech1 day ago
This Week In Security: Microsoft On Microsoft, Register Your Domains, Linux On ARM, And FreeBSD Joins The File Cache Club
-

 Politics2 days ago
Politics Home | Healey Resignation Is “Colossal Failure Of Government”, Says Former Labour Defence Secretary
-

 Sports2 days ago
First Time Since 1971: Australia Register Historic Low In ODI Cricket
You must be logged in to post a comment Login