

Crypto World
The AI Boom Runs on Copper, Yet Its Latest Record Hides a Warning
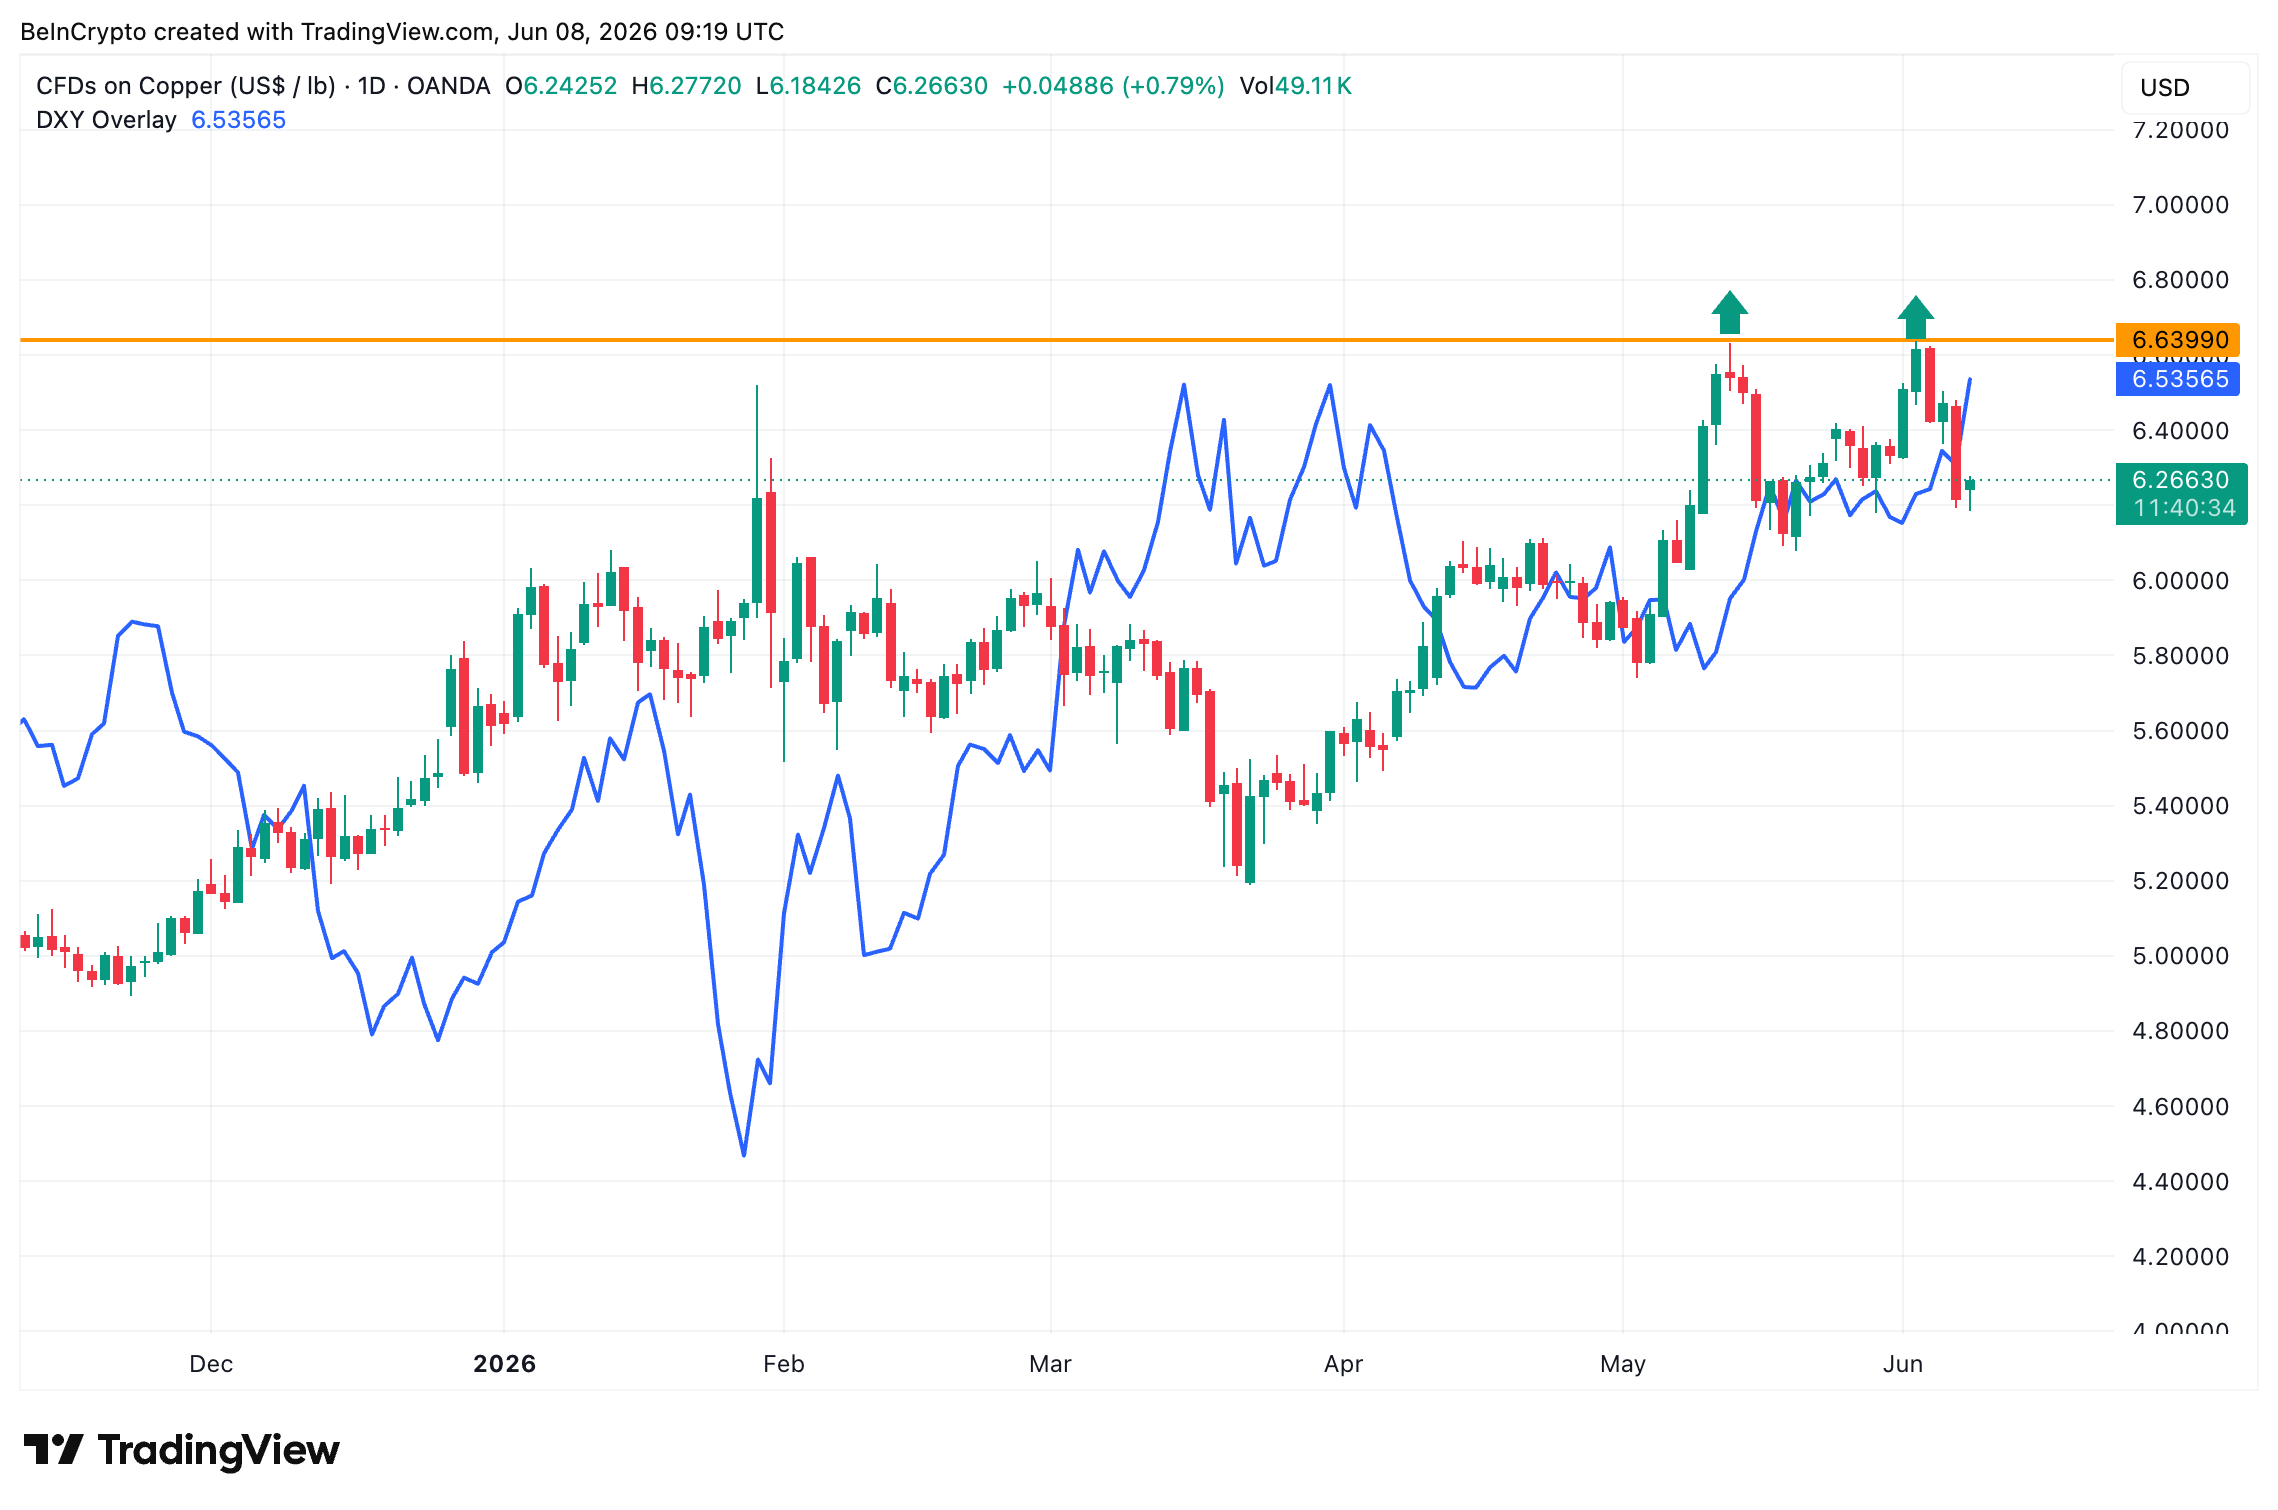
Copper price set a record near $6.63 per pound on June 2, lifted by the same AI data center buildout powering Nvidia, yet it now trades around $6.27, down roughly 6% from that peak.
Options traders are leaning bullish, but the chart, the dollar, and physical-market hedgers all flash caution. The demand story is real, but the near-term setup, however, looks mixed, and several signals now point in the same direction.
Why the AI Boom Made Copper Indispensable
Every AI data center runs on copper. The power delivery, cooling, and busbars behind the buildout are copper-intensive, tying the metal directly to the same trade lifting Nvidia and the wider AI complex.
Want more insights like this? Sign up for Editor Harsh Notariya’s Daily Newsletter here.
The scale is large. A single hyperscale AI facility can use up to 50,000 tons of copper, according to the Copper Development Association, against 5,000 to 15,000 tons for a conventional data center.
JPMorgan estimates data centers alone will need about 475,000 tons of copper this year, up sharply from the prior year.
Nvidia chief executive Jensen Huang has said copper will dominate chip interconnects for as long as possible before any shift to optics. That demand sits on top of a structural shortage, with S&P Global projecting a 10 million tonne deficit by 2040.
The demand case is not in doubt. Whether the latest push had a solid footing is the real question.
A Double Top and a Rising Dollar Cap the Record
The price chart raises the first warning. Copper formed a double top, two failed attempts to break the same resistance near its record, a pattern that often marks a stalling rally.
A double top is a bearish setup where the price tests a ceiling twice and fails each time. Copper printed exactly that against its record zone in May and early June.
The dollar deepens the pressure. The US Dollar Index, or DXY, which measures the dollar against major currencies, has climbed as copper stalled.

A stronger dollar makes dollar-priced copper costlier abroad, and rising yields, along with it, pull money toward cash. That backdrop sets up the positioning split.
Options Traders Turned Bullish as Hedgers Backed Away
Here, the divide sharpens. On CPER, the United States Copper Index Fund, an ETF tracking copper futures, the put-call ratio turned bullish. The volume ratio fell to about 0.11 from a 0.27 peak on June 2, with the open interest ratio near 0.19.

A put-call ratio below 1 means calls outnumber puts, a bullish tilt. The options crowd is leaning into copper even as the chart and dollar warn.
The futures market disagrees. In the latest CFTC Commitments of Traders report, which shows who holds futures positions, commercial hedgers, the physical-market players closest to copper, sit heavily net short and trimmed longs by 3,254 contracts.

The bullish options bet runs against the smart money.
Speculators Crowded In as the Rotation Signal Still Backs the Bulls
The same report shows where the buying comes from. Non-commercial speculators hold 111,525 long contracts against just 32,692 short, and added 5,852 longs into the highs. Crowded speculative longs can sharpen a reversal if sentiment turns.
The deciding tell is the Copper-Gold Investor Rotation Index. This is a proprietary BeInCrypto custom gauge that highlights whether investors favor growth through copper or safety through gold.
A rising reading shows growth appetite, a falling one shows a shift to defense.

The index sits near 1.23, close to the top of its range. That matters because in January it fell sharply at copper’s peak, signaling caution despite strong prices, and that loss of growth leadership preceded a correction.
Unlike January, the index is now rising alongside price, not falling against it. That points to growing appetite for growth-sensitive assets, likely tied to the strength in AI stocks driving the broader buildout. For now, the rotation signal sits on the bulls’ side of the split.
What to Watch Next
The structural case for copper stays intact, carried by an AI buildout (data centers) that shows no sign of slowing. The near-term signals, though, lean cautious, and a few markers will show which way the next move breaks.
If you are tracking copper from here, watch:
- The Copper-Gold Rotation Index. It is rising in price, backing the bulls for now. A roll lower would warn that growth appetite is fading, as it did in January.
- The double top near the record. A clean break above it reopens the upside, while another failure confirms the ceiling.
- The US dollar and yields. Continued strength keeps pressure on dollar-priced copper, while a reversal would remove a headwind.
- Commercial hedger positioning. If the net-short commercials start covering, it would signal the physical-market players see further upside.
The bullish options crowd and the cautious smart money cannot both be right for long. The next move depends on which camp blinks first.
The post The AI Boom Runs on Copper, Yet Its Latest Record Hides a Warning appeared first on BeInCrypto.


Apple is being sued by three iPhone and App Store users who allege they suffered combined losses of about $1.8 million after installing a fake Bitcoin wallet application that prompted them to enter their seed phrases. The complaint was filed on Friday in the US District Court for the Northern District of California, according to a copy of the filing reviewed by MacRumors.
The suit argues Apple did not do enough to screen and supervise apps distributed through the App Store, even as the company promotes it as a trusted marketplace. The plaintiffs say the fraudulent app enabled scammers to transfer their Bitcoin after they shared sensitive recovery information.
Key takeaways
- Three plaintiffs allege they lost a combined about $1.8 million after installing a counterfeit Bitcoin wallet app from Apple’s App Store.
- The complaint says users entered seed phrases into the malicious app, allowing scammers to move their Bitcoin.
- Losses reported in the filing include roughly $875,000, $840,000, and $120,000 during 2025.
- Apple says it has removed impersonating apps and terminated related developer accounts, and points users and developers to report guideline-violating software.
- The original wallet developer has previously criticized Apple over fake app versions appearing in the App Store, and the legitimate wallet does not offer an official iOS app.
Allegations in the Northern District of California lawsuit
The lawsuit names three customers: James Ramirez, Christopher Ellis, and Jalen Delgado. Their complaint, filed Friday, claims Apple failed to adequately review and monitor applications available through the App Store despite presenting the platform as a controlled, trustworthy distribution channel, as described in the filing copy obtained by MacRumors.
The plaintiffs allege that they downloaded what they believed was a Bitcoin wallet app but was actually a fraudulent copy. After installing the app, they entered their seed phrases—the recovery words that can be used to access cryptocurrency wallets. The complaint says those phrases were then used by scammers to transfer the victims’ Bitcoin holdings.
According to the complaint, the losses occurred during 2025. Ramirez reported losses of about $875,000, Ellis reported about $840,000, and Delgado reported approximately $120,000.
The impersonated wallet and the “no official iOS app” issue
The counterfeit app impersonates Sparrow Wallet. MacRumors reports that Sparrow Wallet is available on Windows, macOS, and Linux, and that developer Craig Raw has said the wallet has no official iOS app.
That detail may be significant for investors, users, and app platform observers because it underscores an apparent mismatch: if there is no legitimate iOS release, a purported iOS wallet carrying the same branding would be inherently suspicious. MacRumors further notes that Raw has previously criticized Apple after fake versions of the app appeared on the App Store.
For users, this kind of incident highlights the risk of wallet-related apps that ask for seed phrases. In practice, seed phrases are effectively full-access credentials. Any wallet prompt requesting them should raise serious red flags, especially when the app’s legitimacy is unclear.
Apple’s response: app removals and account terminations
Apple told MacRumors that it has taken action against the fraudulent listings. The company said it removed apps impersonating Sparrow Wallet and terminated developer accounts tied to those apps.
Apple also pointed to its reporting mechanisms, saying developers and users can report applications that violate App Store guidelines. Apple further said it takes action against apps that do not comply with its rules.
The lawsuit, however, centers on whether those controls were sufficient—particularly given the alleged scale of the losses and the claim that users were able to access a counterfeit app that appears designed to capture seed phrases.
Why the case matters for crypto users and the broader app ecosystem
This dispute touches a fault line that has repeatedly surfaced in crypto-enabled fraud: many losses involve not only a malicious actor, but also the ecosystem that allowed the harmful app to reach victims in the first place. For crypto users, the case serves as a reminder that downloading wallet software from mainstream app stores is not, by itself, a guarantee of safety—especially when the app’s behavior suggests it may be collecting recovery credentials.
From an enforcement and platform-governance perspective, the lawsuit may also shape how regulators, courts, and consumers evaluate “reasonable” screening and monitoring for high-risk financial and credential-handling applications. The plaintiffs are alleging a failure of oversight despite Apple’s positioning of the App Store as a trusted marketplace, which is likely to be a focal point in legal arguments about responsibility and foreseeability.
Even if Apple removes impersonating apps quickly after being informed, victims may already have been compromised. That timing gap—between a fraudulent app becoming available and enforcement actions landing—can be critical in the types of scams described in the filing.
There is also an information asymmetry for users: people may assume that brand names like “wallet” and familiar project titles imply legitimacy. The “no official iOS app” detail reported by MacRumors, combined with Raw’s past criticism about fake listings, suggests that legitimacy signals (such as official release availability and publisher identity) can be decisive for avoiding impersonation.
What happens next will likely depend on how the court assesses the adequacy of Apple’s app review and monitoring processes, and how it evaluates whether the harm was caused by app distribution decisions versus individual user behavior (such as entering seed phrases into a fraudulent interface).
In the meantime, readers should watch for any further procedural developments in the case and for Apple’s continued actions on impersonating crypto apps—especially wallet applications that request seed phrases or recovery credentials. The unanswered question is not only whether enforcement occurred, but whether it came fast enough to prevent the kinds of losses alleged in this filing.
[PRESS RELEASE – New York, United States, July 28th, 2026]
BitSafe has released infrastructure for builders launching decentralized financial applications on Canton Network.
Backed by a Canton Foundation Development Fund grant of over $1 million (8,500,000 $CC), BitSafe today opened the public beta of Decentralization Manager, an open-source framework allowing apps and institutions to build resilient products that distribute control across multiple independent operators.
Canton Network has become critical infrastructure for institutions bringing real capital and operations on-chain. Meeting institutional application standards requires audit trails and distributed trust, but until now every team building on Canton has had to build threshold custody, governance, and audit infrastructure from scratch. Decentralization Manager makes those reusable, so teams build the application, not the infrastructure.
Independently audited by Quantstamp, Decentralization Manager marks an exciting expansion of on-chain use cases and allows institutions to continue leveraging the network’s privacy-native architecture while mitigating risk by distributing their operations.
Decentralization Manager ships with pre-built frameworks for token issuance and custody and enables additional products such as:
- Token issuance: Issuers can launch and govern Canton-native tokens, ranging from wrapped cryptoassets to stablecoins and RWAs.
- Custody and multi-signature wallets: Teams can hold and transfer assets under shared, multi-party control, removing reliance on any single custodian.
- Tokenized real-world assets and securities: Builders can bring real-world assets on-chain and govern them under distributed control.
- DEXs, lending, and structured products: Institutions can launch institutional-grade financial applications with Decentralization Manager.
Contact us to start launching decentralized applications and assets.
CBTC, the first non-native asset on Canton, is the first live use case of Decentralization Manager. With over 10 million transactions to date, node operators powering CBTC already earn a share of Canton fees from on-chain transactions. Decentralization Manager now extends that opportunity across the network. Application builders get an easier path to high-quality node operators who can support their products, and those operators earn the same share of Canton fees in return.
“The future of institutional blockchain depends on making sophisticated infrastructure easier to build and adopt,” said Viv Diwakar, Head of the Canton Foundation. “By open-sourcing Decentralization Manager, BitSafe is giving developers the tools to create resilient, privacy-preserving applications that distribute trust across independent operators without compromising the governance and control institutions require. Contributions like this strengthen the Canton ecosystem and help accelerate the growth of institutional digital assets and tokenized financial markets. We’re pleased to see BitSafe making this capability available to the wider community and look forward to seeing the next generation of institutional applications built on Canton.”
As of today, Palladium Labs is the first builder announced using Decentralization Manager to enable multi-party authorization for protocol operations. “Distributed trust and full auditability are table stakes for institutional-grade credit infrastructure like Alpend,” said Akshay Sinha, Cofounder & CTO of Palladium Labs. “Decentralization Manager makes that a framework the entire Canton ecosystem can build on. Adopting it was one of the easier decisions we’ve made.”
In addition to Palladium, CBTC Attestors Nethermind, DSRV, and Finoa Consensus Services have already implemented Decentralization Manager. Their institutional participation affirms a collective effort across Canton to embrace decentralized technology that prioritizes data privacy, operational control, and resilience.
The public beta is open now on the Canton Foundation’s GitHub, with an additional grant application underway. Builders who need operators to complete their Decentralized Party can reach out to BitSafe to be matched with vetted, institutional-grade node operators. Institutions looking to issue and govern Canton-native tokens can engage BitSafe’s Decentralization Services for custom tokenization engagements.
Additional quotes from ecosystem partners:
“The CBTC Decentralized Party has shown how far Canton has come, and the public beta opening of Decentralization Manager is a big step for the whole ecosystem. Onboarding was remarkably smooth for our team – contract deployment was essentially one click. For any app still running on a single validator, this is the easiest path we’ve seen to move beyond a single point of failure.” – Joonkyo Kim, CTO, DSRV
”As one of the attestors securing CBTC, we’ve operated inside BitSafe’s decentralized signing architecture from an early stage, so we’ve seen firsthand what it takes to distribute trust across independent operators in production. Onboarding into Decentralization Manager was refreshingly straightforward, the admin tooling is intuitive and whenever we hit an issue the BitSafe team resolved it quickly and communicated the whole way through.
Institutions bringing real assets onto Canton increasingly expect exactly this: no single point of control with the audit trails and operational resilience their risk teams demand. Making that kind of infrastructure open and repeatable is a meaningful step for the ecosystem.” – Mateusz Jędrzejewski, CIO, Nethermind
“BitSafe’s Decentralization Manager turns the infrastructure we already run into a setup with no single point of failure, the kind institutions expect from Canton. We’re glad to extend our partnership with BitSafe and look forward to building more together as new applications join the network.” – Daniel Schrader, Managing Director, Finoa Consensus Services
About BitSafe
BitSafe builds decentralized, privacy-enabled digital asset infrastructure on the Canton Network. As the team that brought Bitcoin to Canton ($CBTC), BitSafe’s threshold-governed multi-sig infrastructure distributes custody and governance, eliminates single points of failure, and enables institutions and developers to launch trading venues and build compliant financial products and assets across the ecosystem.
The post Canton’s Decentralized App Layer Launches, Backed by $1M+ Foundation Grant appeared first on CryptoPotato.
Robinhood now leads every tokenized stock platform by holder count, four weeks after launching its own blockchain.
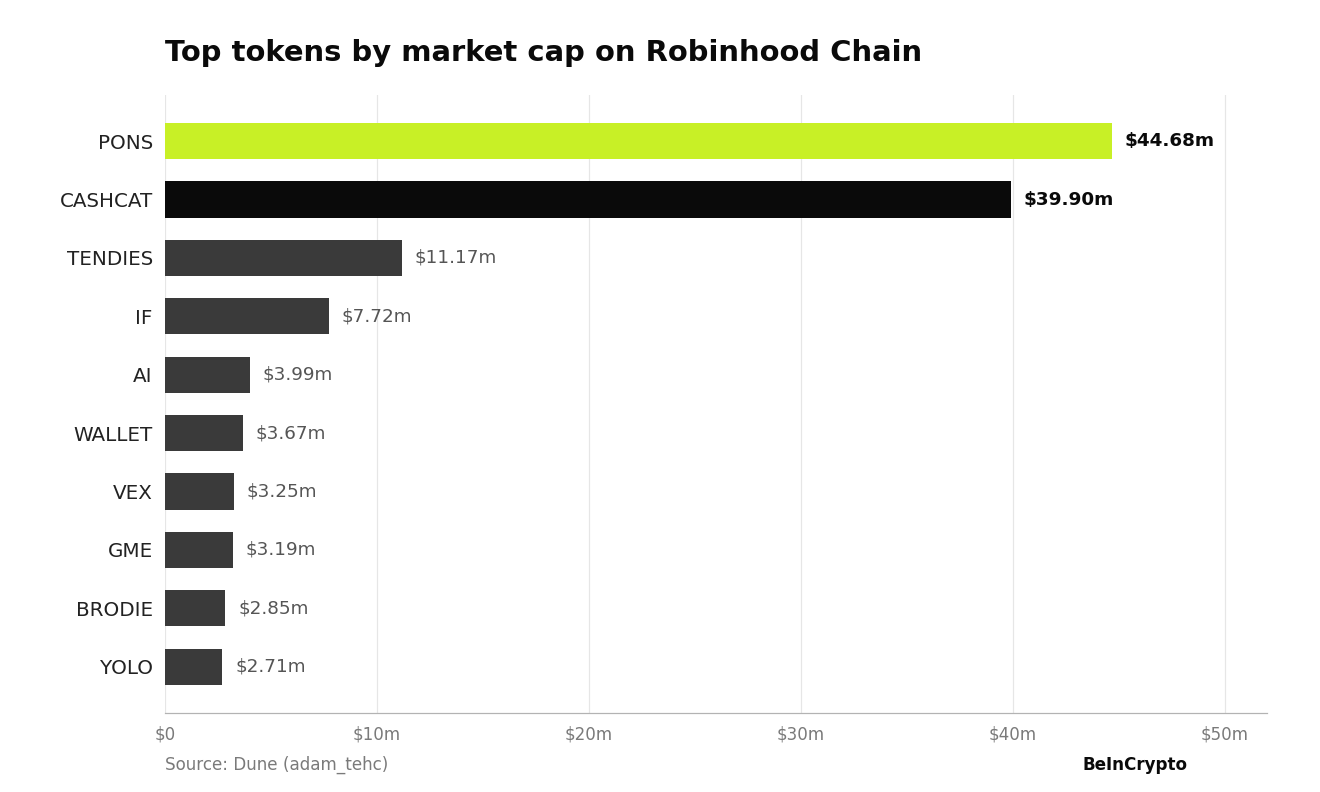
Nonetheless, meme coins, not equities, still dominate the Robinhood Chain. Pons (PONS) has overtaken Cash Cat (CASHCAT) as the network’s largest token by market cap.
Robinhood Wins the Holders and Trails on Value
Tokenized equity holders crossed 752,000 in late July, up 92% over 30 days, according to DWF Labs. Robinhood drove most of that growth.
Follow us on X to get the latest news as it happens
The platform reached 328,000 holders after launching on July 1, giving it a 44% share. However, the ranking does not hold when it comes to value. Its tokenized stock value sits at $44 million.
By comparison, Ondo holds $857 million and xStocks $487 million. The gap widens per holder. Robinhood averages $134, while Securitize averages $4.9 million across just 50 holders. That spread reflects who each platform actually serves.
“There’s a clear split in holder base across issuers. Securitize and Figure lean institutional. Robinhood towards retail. xStocks and Ondo have a mix of both through strategic integrations and partnerships,” DWF Labs stated.
Meme Coins Still Dominate Robinhood Chain Activity
Tokenized stocks are winning holders, while meme coins are winning value. PONS leads the network with a $44.68 million market cap and $11.4 million in 24-hour volume, according to Dune data.

CASHCAT follows at $39.90 million. The token topped $200 million on July 11, when it ranked as the largest asset on the chain.
TENDIES sits third at $11.17 million. The 10 largest tokens hold roughly $123 million in combined value, nearly triple the total value of tokenized stocks.
Subscribe to our YouTube channel to watch leaders and journalists provide expert insights
The post Robinhood Leads Tokenized Stocks by Holders but Not by Money appeared first on BeInCrypto.


While bitcoin and ether (ETH) are under pressure, their prices remain above their respective 50-day averages, a bullish sign. The broader market isn’t so lucky.
The 50-day simple moving average (SMA) is widely tracked as a near-term trend gauge. Price breaks above that level are taken as a sign that bullish momentum is building. Right now, only 29 of the top 100 coins, including the two largest, are trading above their respective 50-day averages. So the breadth remains decisively bearish.
It looks even worse when compared with the Nasdaq 100 breadth. As of Monday, 47 stocks from the index traded above their 50-day SMAs.
This shows that the stability seen since the BTC selloff stalled below $58,000 on June 1 has yet to spill over into the wider crypto market. But there is hope. Ether, the bellwether of altcoins, has recently outperformed bitcoin, raising hopes that soon other coins could catch a strong bid.
A lot depends on the Fed’s interest-rate decision due Wednesday and the cues (if any, given Chair Kevin Warsh’s reticence to provide forward guidance) about the interest-rate trajectory.


IMF has called for closer oversight of Brazil’s stablecoin market as cross-border crypto flows outpace traditional capital movements.
Summary
- The IMF has urged Brazil to strengthen oversight of stablecoins as cross border crypto flows continue to grow faster than traditional capital movements.
- The fund said Brazil’s crypto market has become more connected with the financial system while gaps remain in stablecoin rules, customer protection and AML compliance.
- IMF analysis found stablecoin purchases are two to three times more sensitive to global shocks than portfolio investment and foreign direct investment.
- Brazil already bars virtual assets from settling payments through regulated foreign exchange channels while allowing crypto trading and stablecoin use outside that framework.
- Dollar backed stablecoins continue to account for a large share of Brazil’s crypto activity even as regulators tighten oversight of the sector.
According to the International Monetary Fund’s (IMF) latest Financial System Stability Assessment, Brazil’s crypto asset market has expanded rapidly since 2017, with U.S. dollar-pegged stablecoins becoming a major part of that growth.
The report says cross-border crypto transactions have increased faster than conventional capital flows and now require closer regulatory attention because of their growing links with the country’s financial system.
The assessment says stablecoin purchases respond much more strongly to global financial shocks than traditional portfolio investment or foreign direct investment.
Based on the IMF’s analysis, purchases of dollar-backed stablecoins are two to three times more sensitive to external market events, raising concerns over how quickly international volatility could spread through crypto markets.
Brazil’s stablecoin market has drawn IMF attention
Brazil has emerged as one of the world’s more active crypto markets, with stablecoins accounting for a significant share of digital asset activity. The IMF said the country’s crypto ecosystem has become increasingly connected with the traditional financial sector, making regulatory oversight more important as adoption continues to rise.
The report acknowledges that Banco Central do Brasil (BCB) has already introduced measures to regulate crypto asset service providers. Even so, the IMF said several areas still need stronger rules, including customer asset protection, stablecoin issuance requirements, and compliance with anti-money laundering (AML) and counter-terrorist financing (CFT) standards.
While discussing financial stability risks, the IMF did not call for restrictions on stablecoins. Instead, it recommended strengthening the regulatory framework as crypto markets become more integrated with existing payment and financial infrastructure.
Cross-border crypto flows have grown faster than traditional capital
One of the report’s central findings is the pace at which crypto is moving across borders. According to the IMF, cross-border crypto flows have increased steadily over recent years and are now expanding faster than conventional international capital movements.
The assessment says stablecoin transactions react more sharply during periods of global market stress than portfolio investment or foreign direct investment. Such sensitivity, the IMF said, could make capital movements through crypto markets more volatile during external financial shocks.
The institution linked those risks to the growing use of dollar-backed stablecoins, which continue to dominate Brazil’s crypto market. Earlier comments from BCB Governor Gabriel Galípolo have also pointed to stablecoins accounting for about 90% of the country’s reported crypto flows, with regulators monitoring possible tax, money laundering and reserve-related risks.
Existing rules already separate crypto from regulated payment channels
The IMF’s recommendations come after Brazil introduced new rules governing how digital assets interact with the country’s regulated foreign exchange system.
In April, Banco Central do Brasil published Resolution BCB No. 561, which amended regulations for electronic foreign exchange (eFX) providers. Under the updated framework, payments and receipts between regulated eFX providers and foreign counterparties must be completed through foreign exchange transactions or movements in non-resident Brazilian real accounts.
The regulation also prohibits the use of virtual assets to settle transactions inside those supervised cross-border payment channels. At the same time, the measure does not prohibit crypto trading or stablecoin transfers more broadly. Instead, it separates regulated international settlement from private crypto activity conducted through exchanges, wallets and other digital asset services.
Transitional provisions allow firms that have not yet received authorization as eFX providers to continue operating if they apply for central bank approval before May 31, 2027. Those firms must still comply with the same settlement restrictions during the transition period.
Earlier regulatory proposals have also examined stablecoins issued outside the central bank’s supervision. In technical comments submitted to Brazil’s Congress, the BCB warned that offshore-issued stablecoins, particularly real-denominated tokens beyond its oversight, could raise concerns around monetary sovereignty, regulatory consistency and capital flows.
Stablecoins remain central to Brazil’s payment landscape
Regulatory scrutiny has increased even as stablecoins continue gaining ground alongside Brazil’s domestic payment infrastructure.
Recent reporting by crypto.news showed that Tether-backed payment platform Oobit integrated Pix, allowing users to deposit Brazilian reais, hold USDT and complete payments through Pix keys or QR codes. The development illustrates how dollar-backed stablecoins can operate alongside Brazil’s widely used instant payment system without replacing it.
The latest IMF assessment also arrives shortly after trade tensions between Brazil and the United States brought the country’s payment ecosystem into focus.
A Section 301 investigation by the Office of the United States Trade Representative cited Brazil’s Pix payment system among several practices considered unfair to U.S. electronic payment companies, although the resulting 25% tariffs targeted Brazilian imports rather than the payment network itself.
Ethereum price fell 5% from $1,973 to $1,873 on July 28 after another rejection below $2,000 triggered forced selling and pushed ETH into a key technical support zone.
- Ethereum price dropped below $1,900 after buyers failed to break the $1,975–$2,000 resistance zone.
- Leveraged positions accelerated the decline as ETH moved through several long-liquidation clusters.
- ETH is testing the lower boundary of a rising wedge near $1,870 on the 4-hour chart.
- The next large concentration of downside liquidity sits around $1,840–$1,850.
Ethereum price falls below $1,900 after $2,000 rejection
According to data from crypto.news, Ethereum (ETH) price traded near $1,875 at the time of writing, down from an intraday high close to $1,973. The decline erased most of the gains from the previous session, when ETH reached its highest level since early June.
Selling intensified after buyers failed to push the price through the $1,975–$2,000 resistance range. The rejection trapped traders who had opened leveraged long positions in anticipation of a breakout above the psychological threshold.
ETH subsequently moved below $1,900, activating stop-loss orders and forcing position closures. The price reached approximately $1,873 before stabilizing around the lower end of the daily range.
Despite the decline, Ethereum remains above its early July low near $1,560. The token has gained roughly 20% from that level, meaning the wider recovery has weakened but has not yet been invalidated.
Leveraged longs accelerate the ETH sell-off
Derivatives positioning appears to have increased the speed of the decline. Bullish traders had built exposure as Ethereum approached $2,000, leaving the market vulnerable when spot demand failed to sustain the move.
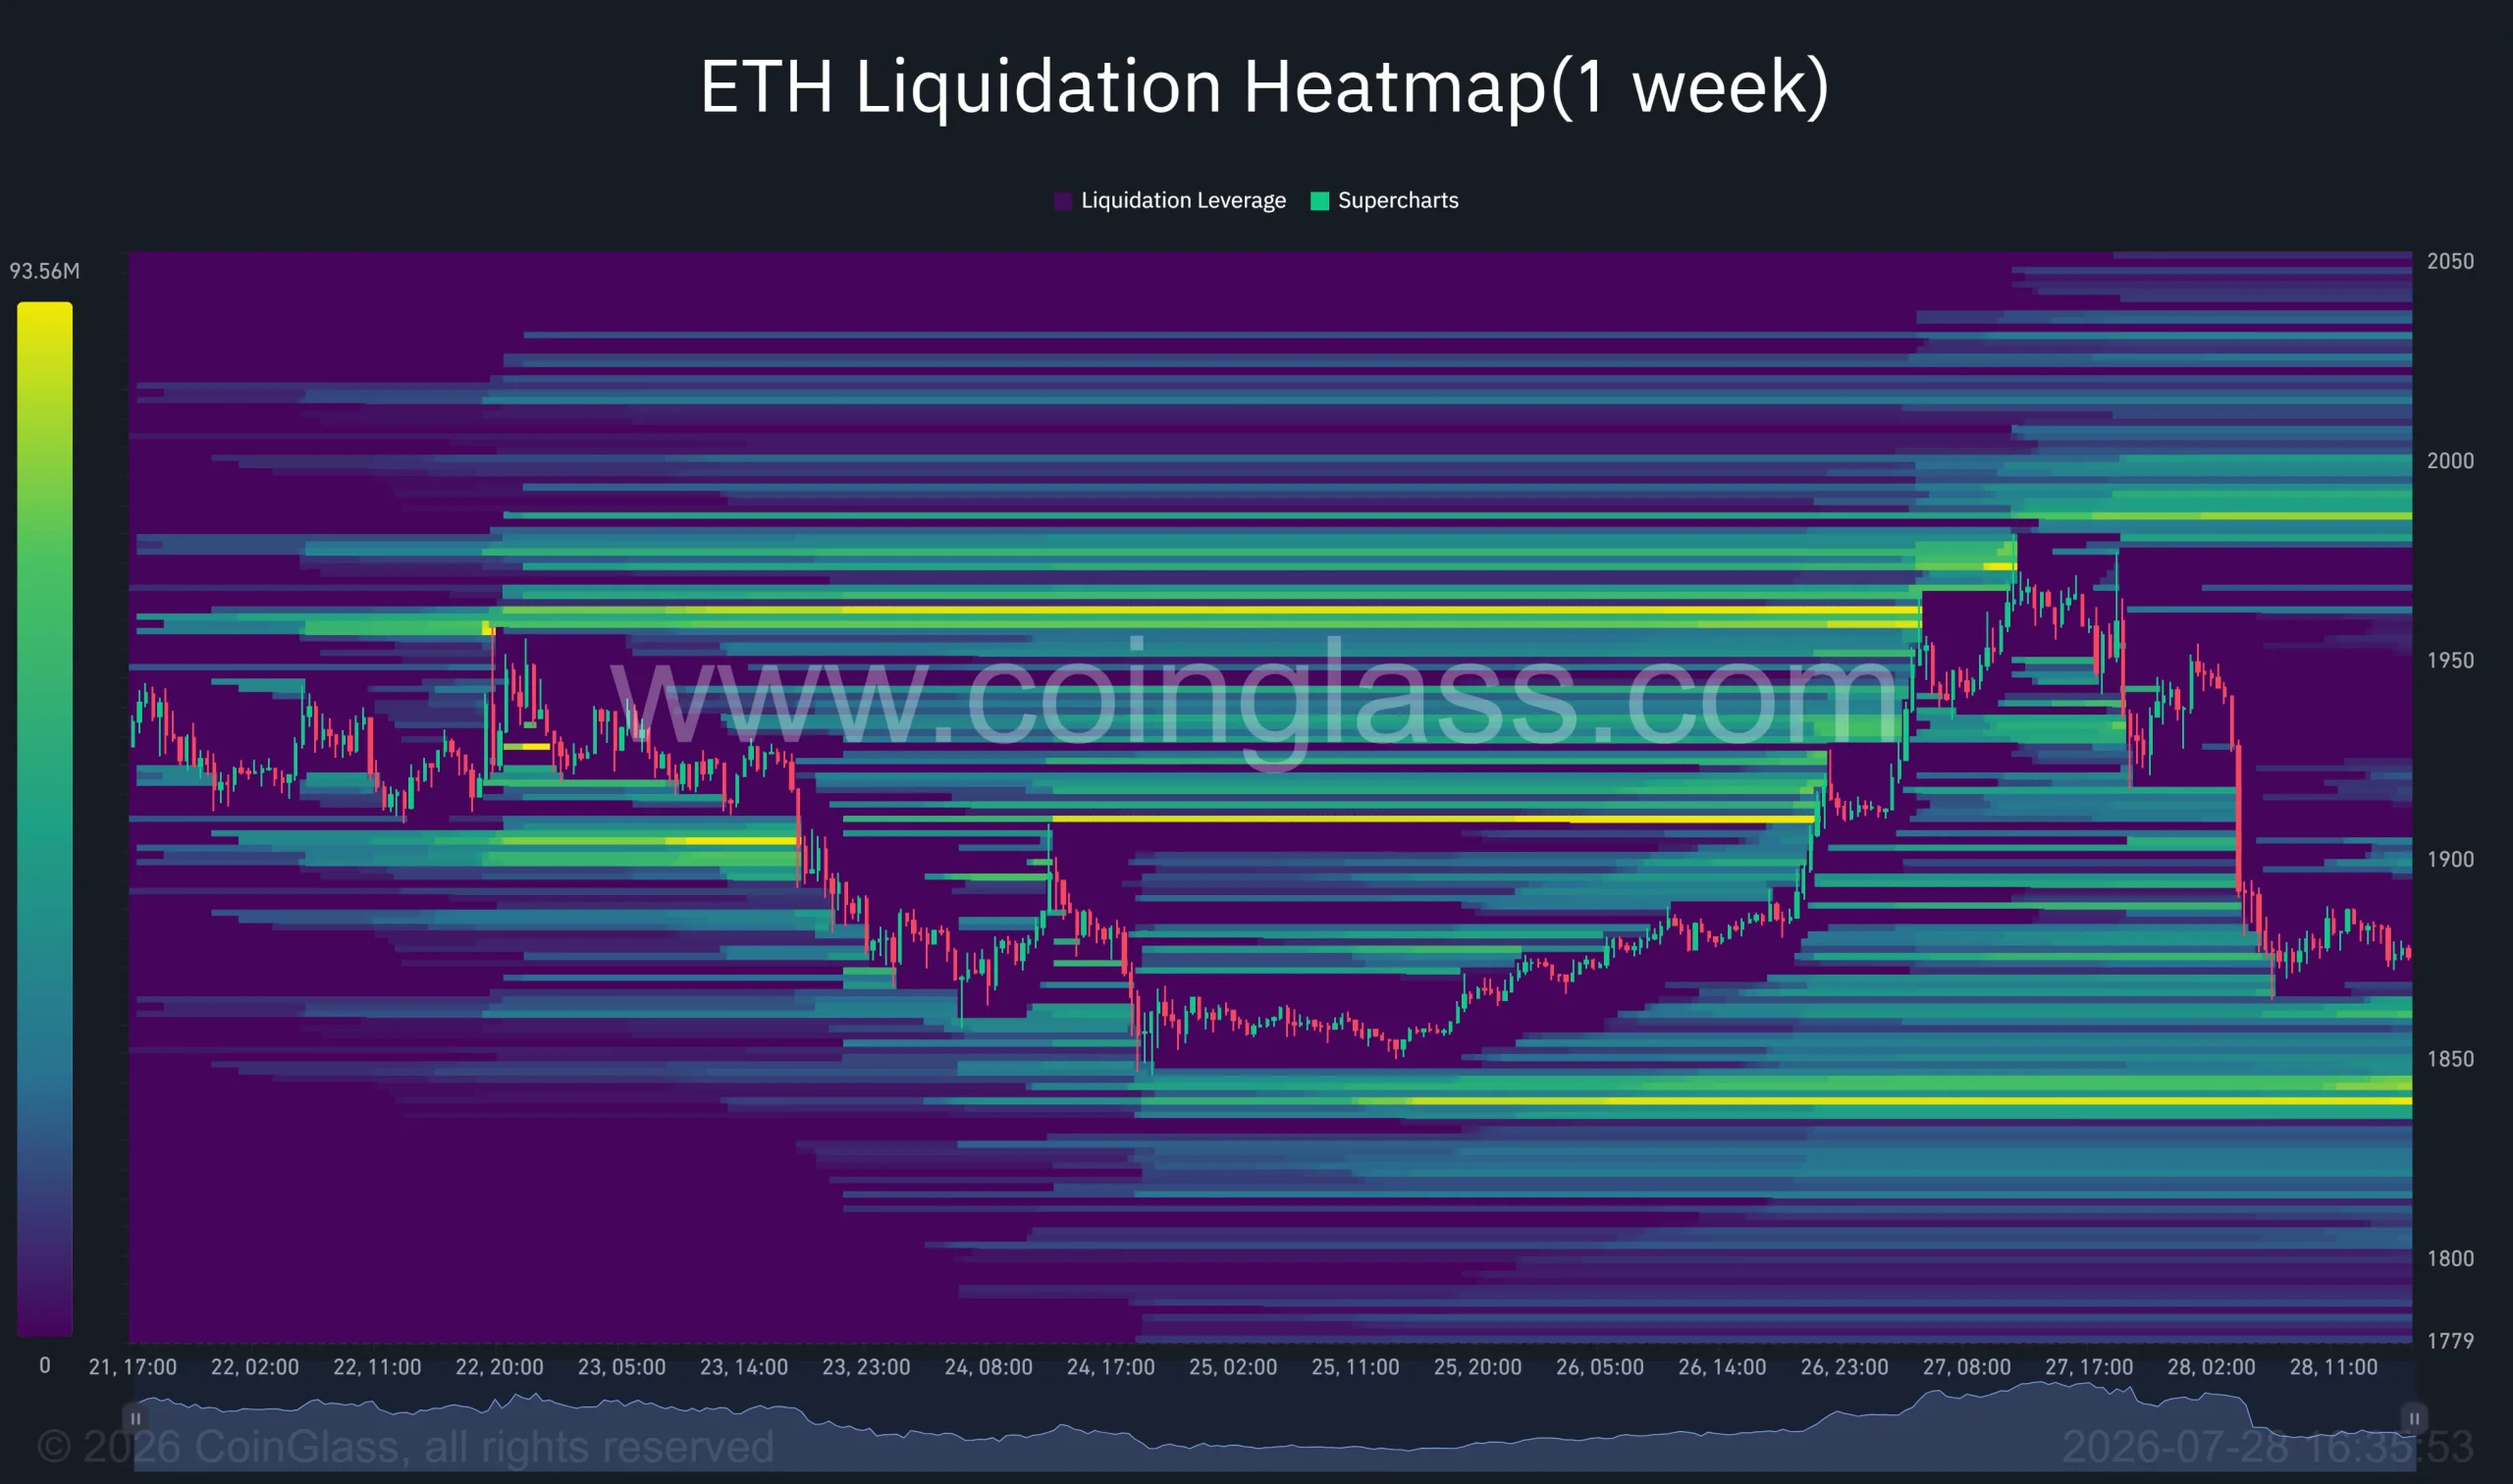
The one-week ETH liquidation heatmap shows that the price passed through multiple areas of leveraged exposure between $1,950 and $1,890. Forced closures likely added sell orders as Ethereum broke through those levels.
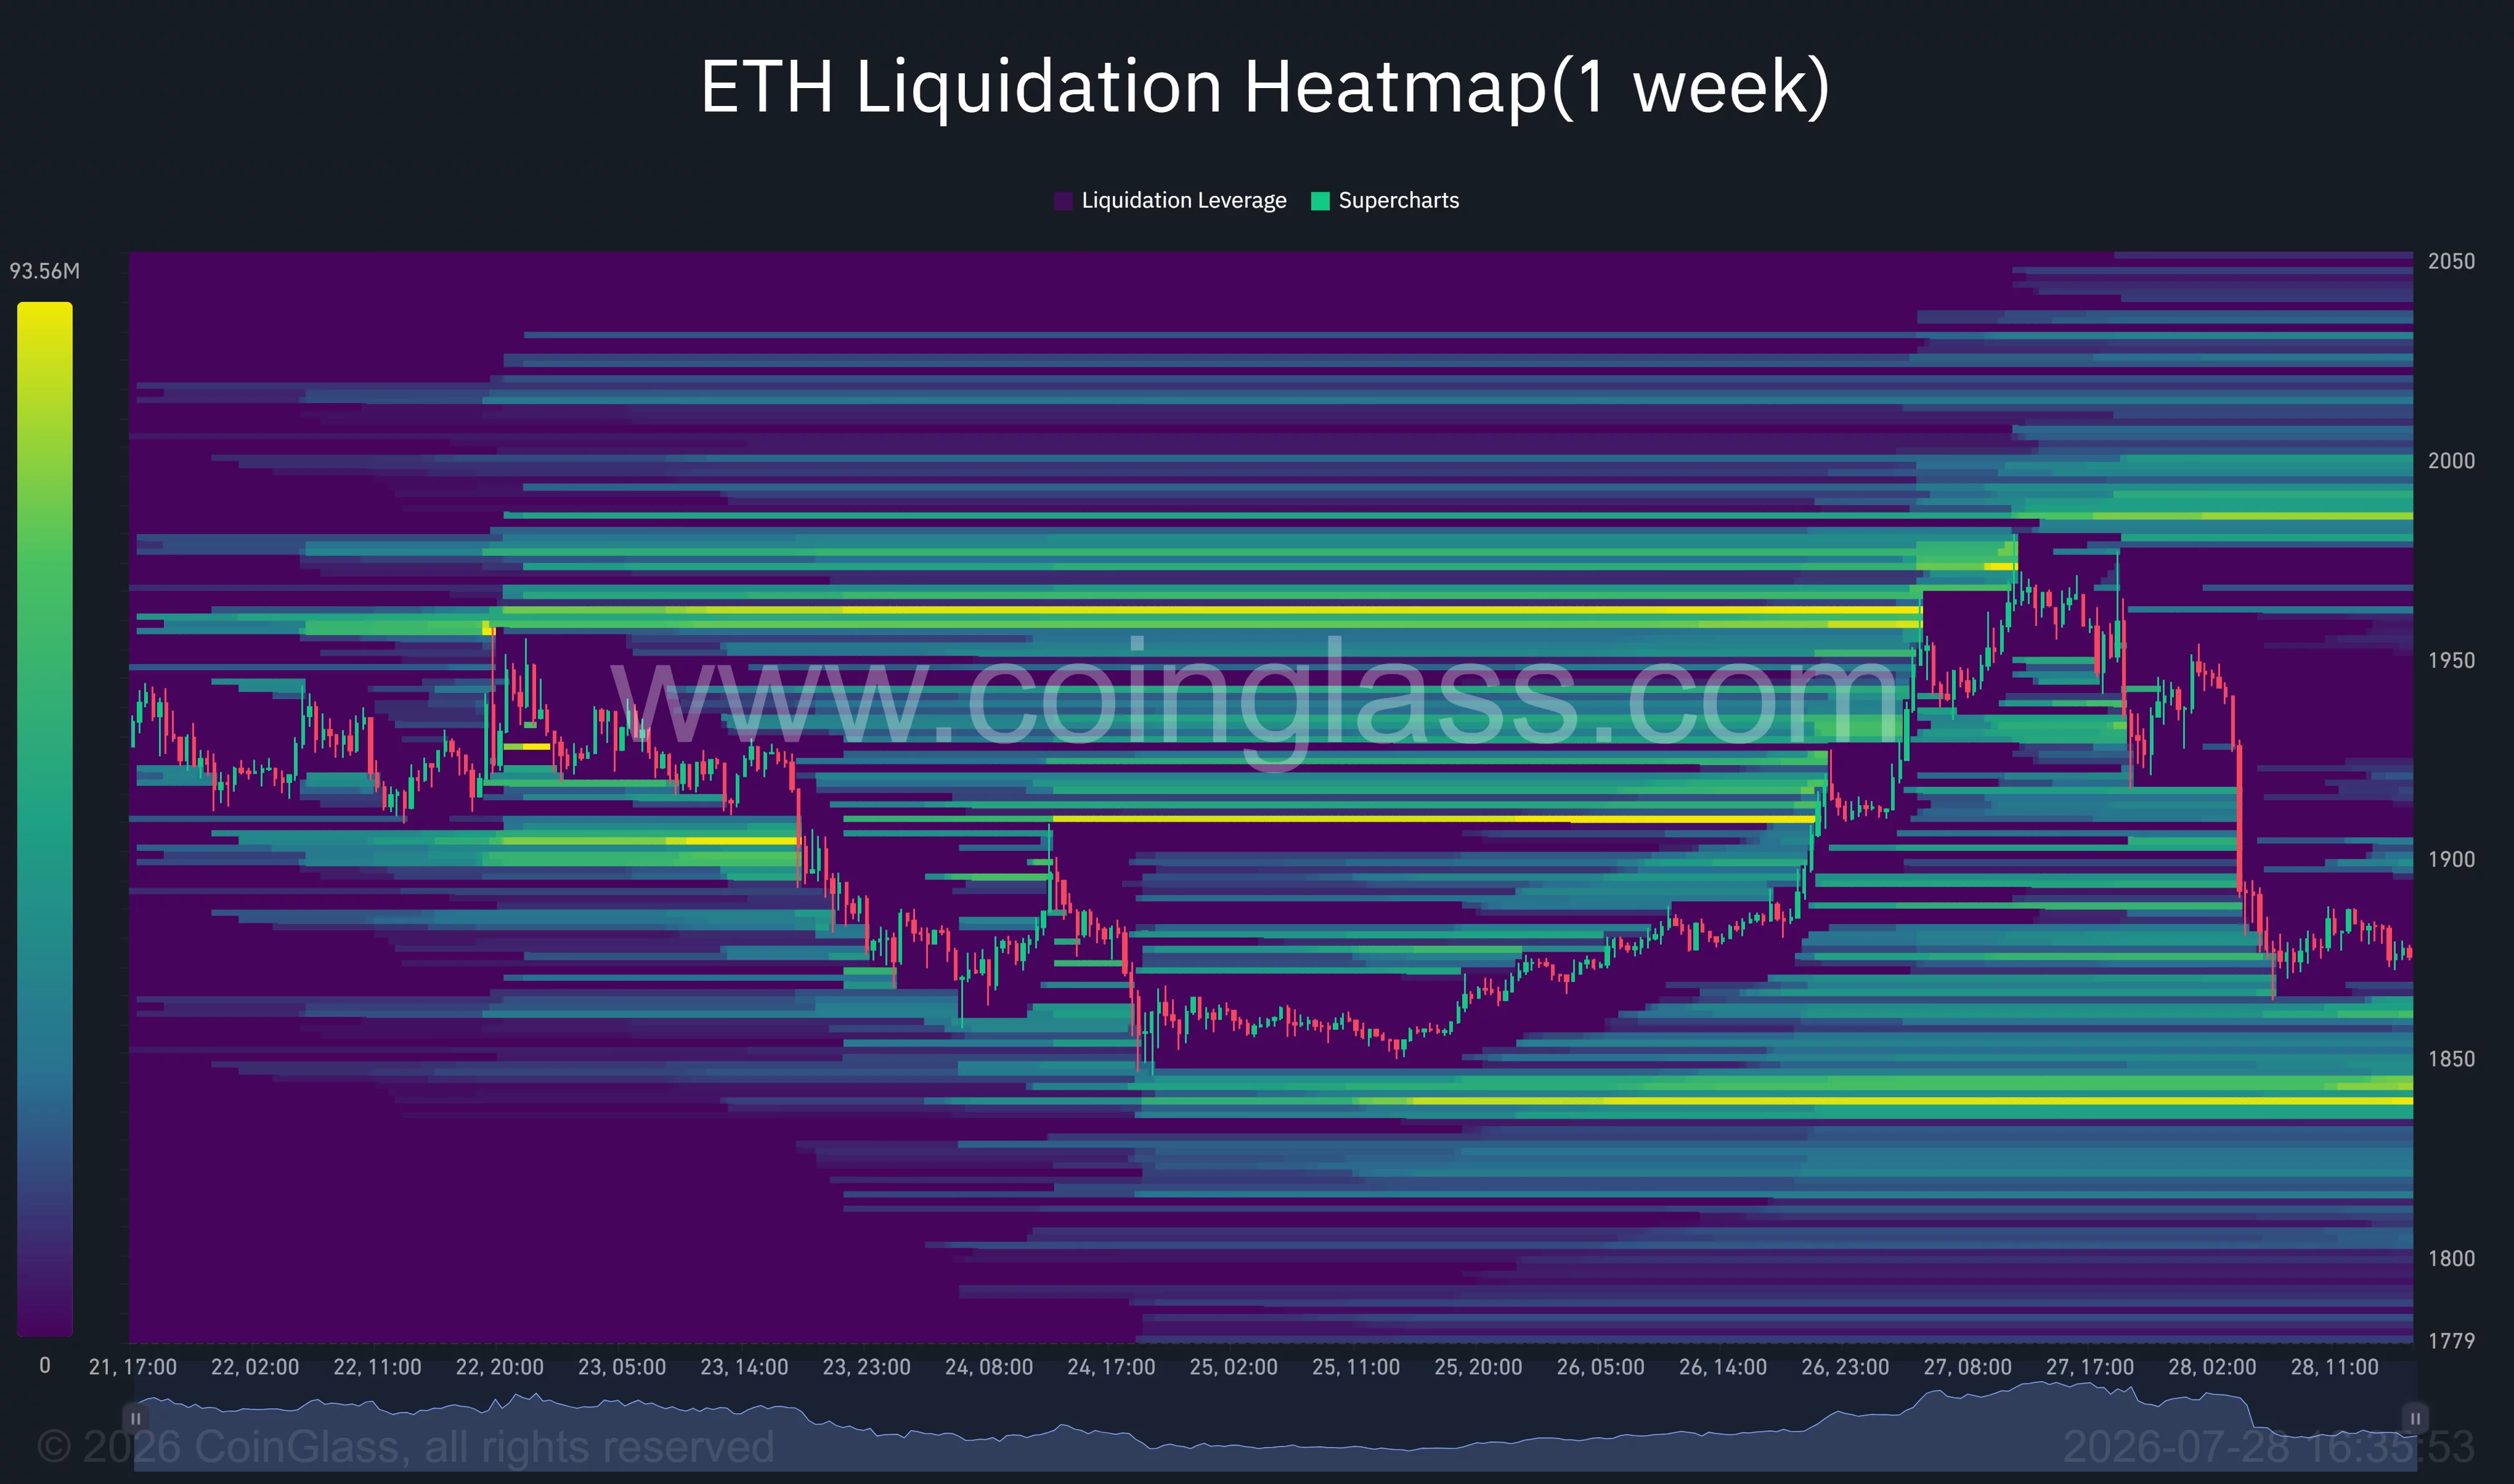
The heatmap now shows a larger concentration of liquidity around $1,840–$1,850. Price can gravitate toward such areas because liquidations produce additional trading activity, although the data does not guarantee that ETH will reach the zone.
Transfers from large wallets to centralized exchanges may also have added to the pressure. Exchange deposits increase the amount of ETH available for sale, but they do not confirm that the holders have liquidated their assets.
Broader weakness across technology stocks contributed another source of pressure. Concerns about the financial returns from heavy artificial intelligence spending have increased volatility across global equities, encouraging investors to reduce exposure to risk assets, including cryptocurrencies.
ETH tests rising support near $1,870
Ethereum’s 4-hour chart shows the price testing the lower boundary of a rising wedge near $1,870. The trendline has supported the recovery since the middle of July, making the current area important for the token’s next move.
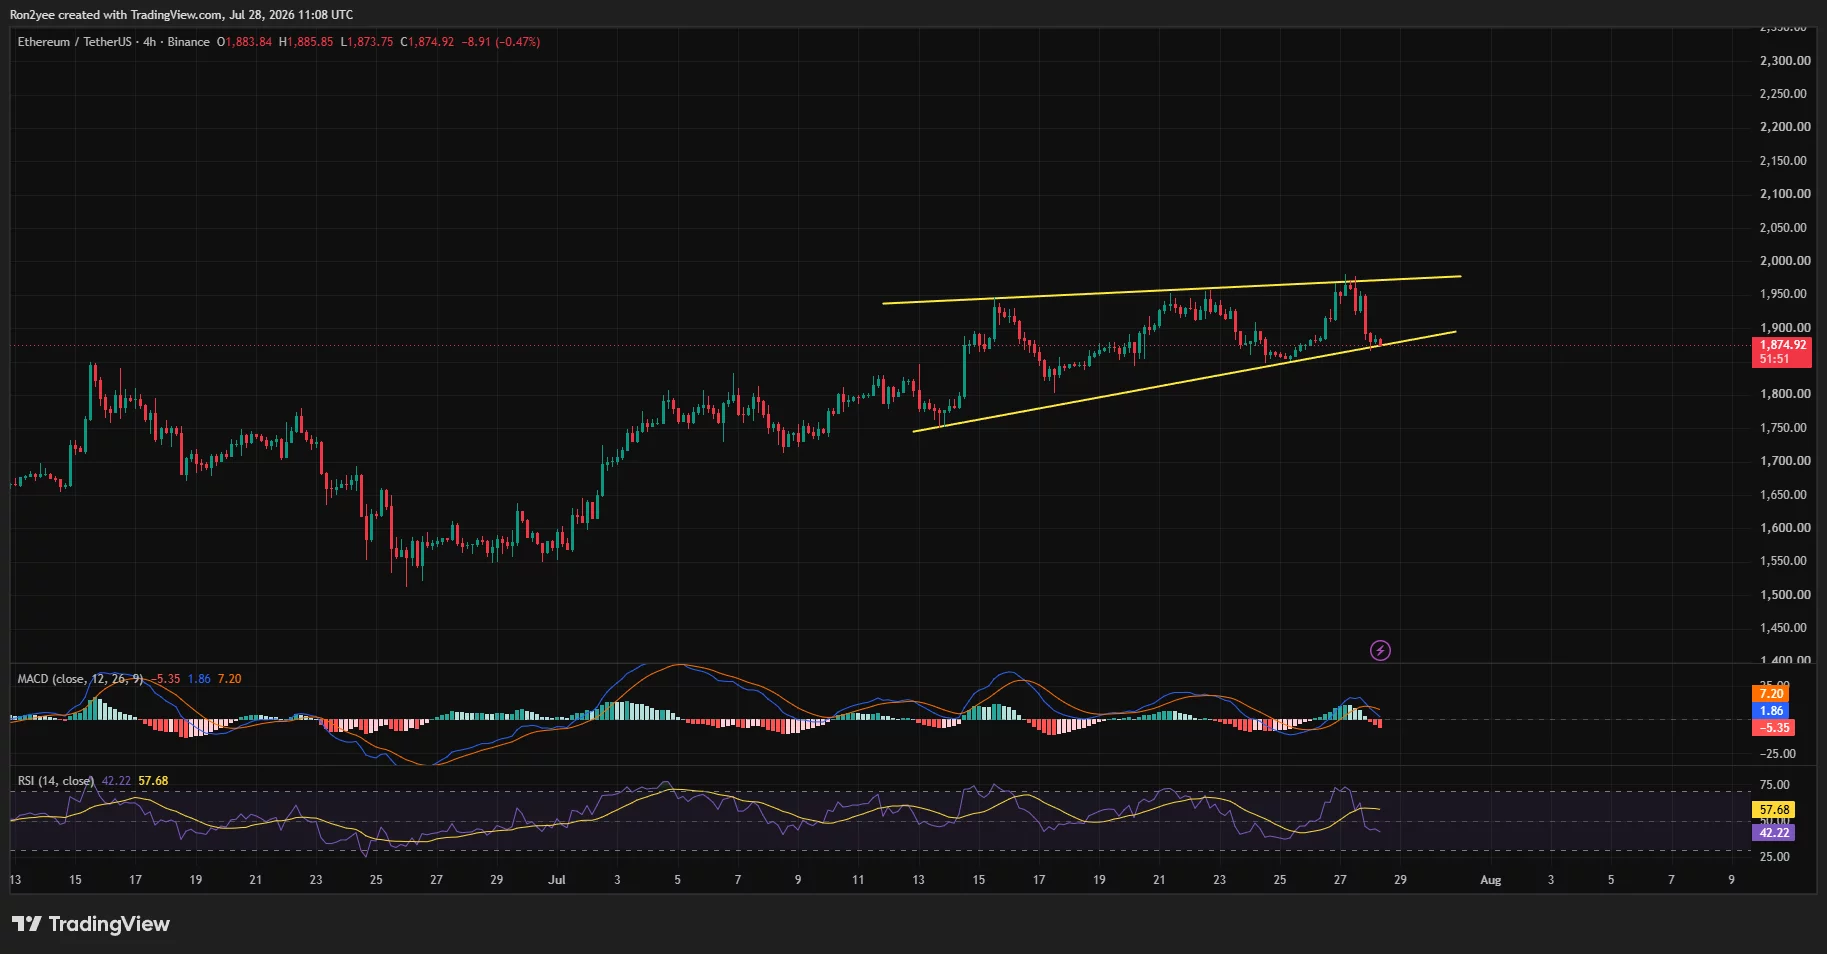
A decisive close below the trendline would weaken the rebound and could send ETH toward the $1,850–$1,840 liquidity zone. Failure to hold that area would expose the 100-day simple moving average near $1,758.
Momentum indicators support a cautious short-term outlook. The 4-hour relative strength index has fallen to 42.22, below its moving average of 57.68. The reading shows weakening demand but remains above the oversold threshold of 30.
The moving average convergence divergence indicator has also turned bearish. The MACD line has fallen below its signal line, while the histogram has moved into negative territory, showing that sellers retain short-term control.
On the daily chart, Ethereum price remains above its 20-day SMA, currently near $1,864, offering immediate support around the present price. The 50-day SMA stands lower at approximately $1,759.
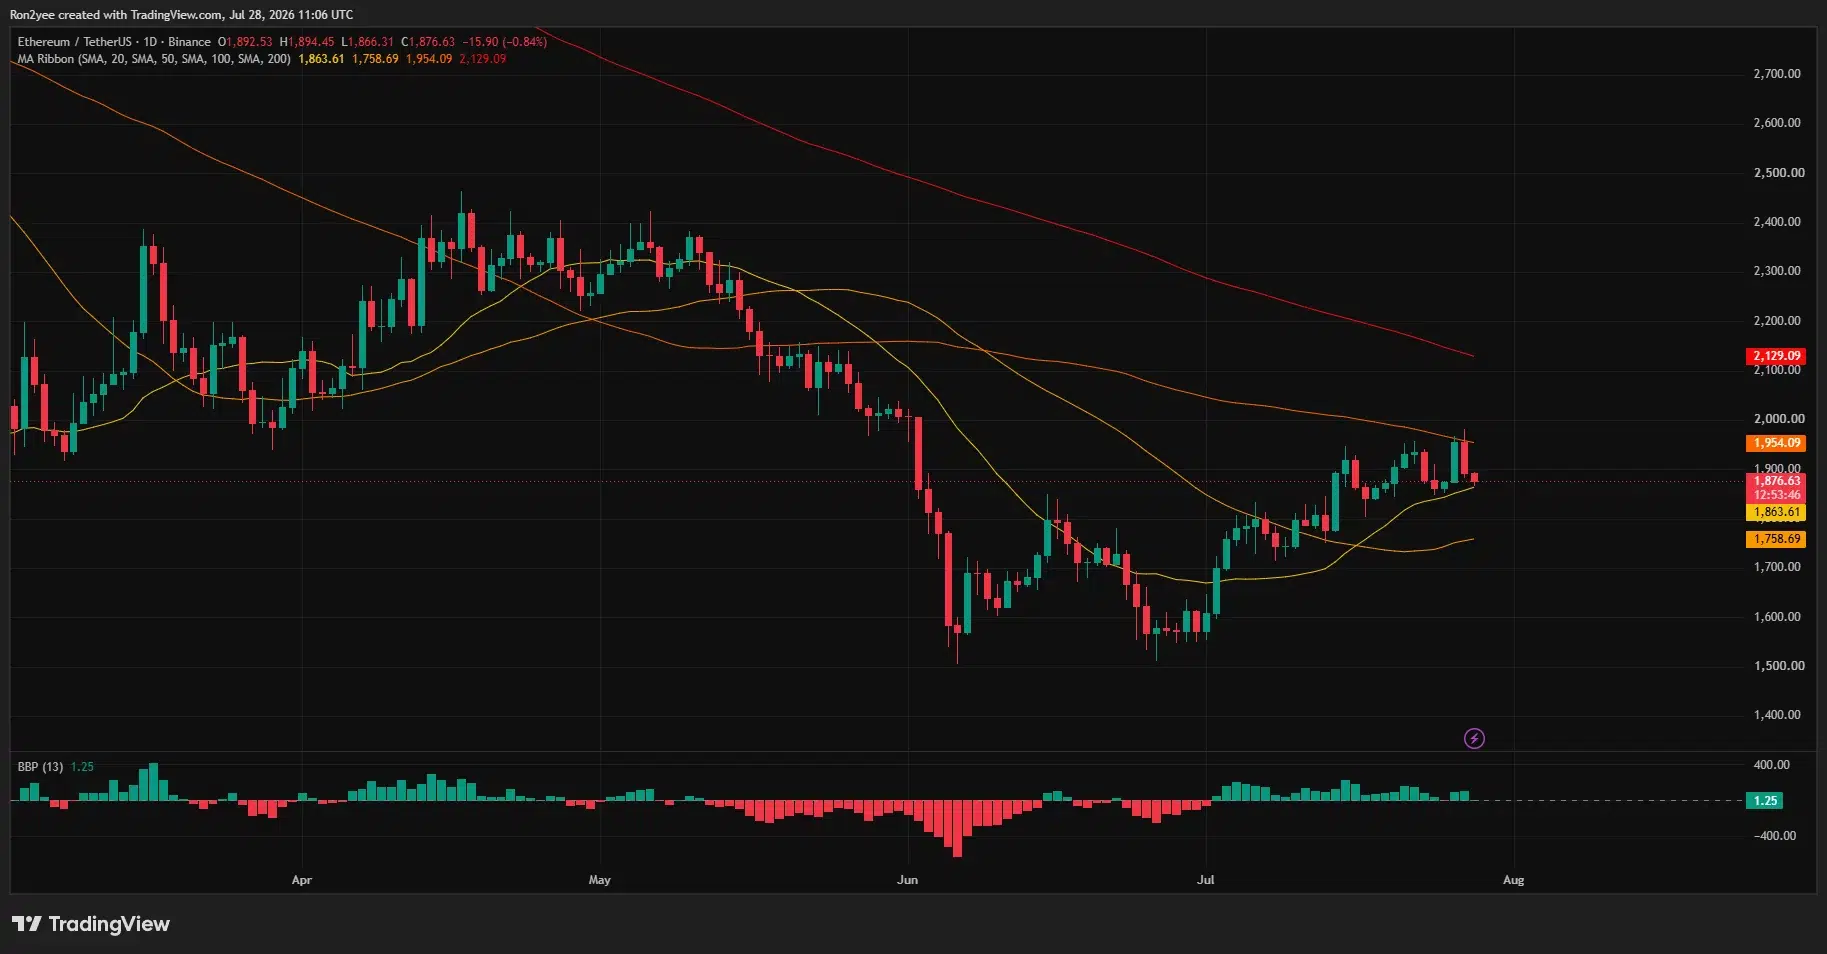
On the upside, ETH must first recover $1,900. Further resistance sits between $1,950 and $1,975, where the recent high and the 200-day SMA near $1,954 create a stronger supply zone.
A daily close above $1,975 would weaken the bearish setup and give buyers another chance to test $2,000. Until that happens, rebounds into the resistance zone may continue to attract selling.
Analysts identify $1,840 as the decisive support
Crypto analyst Ted Pillows described the current trading area as a key support zone for Ethereum.
“ETH is back into its key support zone. As long as this holds, Ethereum will continue to outperform Bitcoin.”
Pillows’ chart places support around $1,840, followed by possible recovery levels near $1,956, $2,030, and $2,195. A breakdown below the current zone, however, could shift attention toward approximately $1,700 and $1,530.
Market commentator Rain pointed to corporate accumulation as a potential source of longer-term demand. Rain noted that BitMine added nearly 10,000 ETH during the previous week, taking its reported holdings to approximately 5.79 million ETH.
Rain also said ETH had gained about 2.4% over the week while Bitcoin declined roughly 0.7%, pushing the ETH/BTC ratio to a three-month high. The relative strength suggests some investors continue to favor Ethereum despite the latest intraday correction.
Corporate buying may support ETH over longer periods, but it cannot prevent short-term volatility when leveraged positioning becomes crowded. The immediate outlook still depends on whether buyers can defend the $1,840–$1,870 region.
Fed expectations add pressure for US traders
US investors are also monitoring Treasury yields and expectations surrounding Federal Reserve policy. Higher risk-free yields can reduce demand for speculative assets and make Ethereum’s staking yield less attractive relative to government bonds.
Demand for US-listed spot Ethereum exchange-traded funds represents another key variable. Continued institutional inflows could help absorb exchange-based selling, while sustained outflows would remove a source of demand that supported the July recovery.
Regulatory uncertainty around staking services and liquid staking products remains relevant for US holders. Changes to the treatment or availability of those services could affect institutional demand and the way investors value Ethereum’s yield.
For now, $1,840 remains the principal downside level, while $1,950–$1,975 is the range bulls must reclaim. Holding support would preserve Ethereum’s July recovery structure, but a daily close beneath it could expose the 100-day SMA near $1,758.
Disclosure: This article does not represent investment advice. The content and materials featured on this page are for educational purposes only.

Lido, the major liquid staking protocol for Ethereum, has announced an upgrade to its staking infrastructure aimed at improving validator efficiency while keeping decentralization on the roadmap. The change is introduced through a new component called Curated Module v2, which Lido says brings broader support for Ethereum’s newer withdrawal credential format.
According to a Lido update published on Monday, the upgrade adds support for Ethereum’s 0x02 withdrawal credentials. The practical upshot is that validators operating through Lido infrastructure can raise their effective balance from 32 ETH to as much as 2,048 ETH, while still being orchestrated within the protocol’s staking framework.
Key takeaways
- Curated Module v2 adds support for Ethereum’s 0x02 withdrawal credentials within Lido’s staking setup.
- Lido projects validator counts could fall from about 880,000 to roughly 628,000, a drop of around one-third, based on its internal assumptions.
- Lido says the migration has not started yet; the numbers reflect projections rather than realized outcomes.
- The upgrade is expected to reduce messaging and participation needs on the consensus layer, while not targeting changes to the execution layer fee and gas activity.
- New accountability measures for node operators include bonding and penalty mechanisms, with future stake allocation potentially influenced by performance and ecosystem contribution.
What Lido’s Curated Module v2 changes
Lido’s model relies on smart contract coordination and a network of node operators that run Ethereum validators. The protocol’s announced upgrade centers on expanding how those validators are configured, specifically through withdrawal credentials that Ethereum supports via the 0x02 format.
Lido states that this credential support enables validators to operate with a larger effective balance—up to 2,048 ETH. In systems like Ethereum’s staking architecture, larger effective balances can translate into fewer independent validator instances needed to steward a given amount of stake.
Importantly for stakers, Lido emphasized that users do not need to take action. Since Lido is a liquid staking protocol, stakers hold stETH, and Lido said the migration will be handled at the protocol level.
Projected impact on Ethereum validator counts
Lido’s update includes a quantification of what the migration could look like. The protocol said the shift could reduce Ethereum’s validator count from approximately 880,000 to about 628,000, implying a roughly 33% reduction.
Lido also stressed that the migration is not underway yet. The figures are based on the protocol’s projections rather than results that have already been observed on-chain.
From an investor and market-structure standpoint, validator-count changes matter less for token price mechanics and more for how efficiently the network runs under load. If fewer validators and fewer validator messages are required to maintain consensus, it can lower certain overhead costs and complexity—particularly during periods when validator participation is highly dynamic.
Consensus layer efficiency—without changing execution-layer fees
Beyond the raw validator count, Lido expects the upgrade to affect Ethereum’s consensus layer by reducing the number of validators and validator messages required for the network to operate.
Lido also drew an explicit boundary around what the upgrade does not intend to change: it is not designed to alter execution-layer activity. The execution layer is where transaction fees and gas costs arise, so the protocol’s stated aim is to improve consensus-side operational characteristics rather than influence fee markets directly.
For users watching network performance, this distinction is crucial. Upgrades that affect validator messaging and participation typically influence consensus efficiency, while execution-layer changes are the ones most directly tied to the user experience around gas and transaction inclusion.
New operator accountability: bonds, penalties, and weighting performance
Lido’s announcement also goes beyond infrastructure configuration by outlining additional accountability measures for its node operators. The protocol said the upgrade introduces bonding and penalty mechanisms, intended to increase alignment between operator behavior and protocol expectations.
According to Lido, operator incentives will evolve as part of this framework. Lido further suggested that future stake distribution could place more weight on a broader set of factors—potentially including operator performance, fees, and contributions to the broader Ethereum ecosystem.
In other words, the upgrade is not only about reducing how many validator entities are used; it is also about changing how operators are evaluated and economically constrained. That matters for decentralization, since more robust accountability mechanisms can help ensure that operator quality and reliability are not treated as afterthoughts when scaling staking infrastructure.
Lido described Curated Module v2 as a “next major step” in the evolution of its architecture, citing new operator incentives, bond-based security mechanisms, and governance improvements.
What stakers and observers should monitor next
As Curated Module v2 moves from announcement to migration execution, the main things to watch are how quickly Lido completes the change and whether the projected reduction in validator count and messaging levels comes close to the protocol’s stated estimates. Since Lido says the migration is handled at the protocol level, the practical signal for stakers will likely be tracking network-level behavior during and after the rollout—especially consensus-layer efficiency metrics—while keeping in mind Lido’s assertion that execution-layer fee dynamics are not the target of this upgrade.


Decentralized exchange (DEX) aggregator 1inch opened Aqua, its shared liquidity protocol, to users across 13 Ethereum Virtual Machine-compatible chains.
Aqua lets liquidity providers use the same wallet balance across multiple positions instead of splitting their assets among separate pools, with tokens remaining in the provider’s wallet until a matching swap executes.
The protocol allows “tokens to stay in your wallet, under your control, while one balance backs multiple positions across different strategies rather than being split between smart contract deposits,” 1inch co-founder Sergej Kunz told CoinDesk.
A $100,000 balance could support three positions quoting a combined $300,000, according to 1inch. That is quoted liquidity rather than additional capital, and orders can only execute against assets held in the wallet, and a swap fails if the balance cannot cover it.
1inch first unveiled Aqua last year, including its software development kit, libraries and documentation. The public interface lets users create full-range, concentrated or pegged positions across chains including Ethereum, Base, BNB Chain, Arbitrum and Robinhood Chain.
The rollout follows research commissioned by 1inch that found 85% of $1.84 billion tracked across major concentrated-liquidity exchanges was underutilized in the first half of 2026.
Crypto World
South Korea’s worst market day in years and a stalled Clarity Act put crypto on the back foot

Bitcoin has lost 0.53% since midnight UTC, having shed around 2% during the U.S. session overnight.
Two catalysts are weighing on sentiment.
First, chipmaking stocks tumbled in South Korea, dragging the benchmark Kospi stock index down 11%. The drop, one of its worst single-day declines in years, sent shockwaves across global risk assets.
And on the regulatory front, the U.S. Senate shelved the Crypto Clarity Act for now, opting to prioritize a Russia sanctions bill and federal nominations with just two weeks remaining before the summer recess begins on Aug. 8. The bill’s fate this year is now genuinely uncertain.
Ether (ETH) fell 0.56% to $1,880 having failed to rise through the psychological level of $2,000 on Monday. Both the Fed’s interest-rate decision on Wednesday and the Senate’s remaining floor time loom large over the market this week.
Traditional markets are broadly lower, with Nasdaq 100 index futures down 0.70%, gold shedding 0.93% and silver off 1.50%.
Derivatives positioning
- Taker volume flips bearish: The taker long/short volume in futures has flipped gloomy, with shorts, or bearish plays, now at 51.5%. This marks a complete turnaround from the bullish bias seen in recent days. A taker is a market participant that trades at prevailing prices.
- XRP open interest rises: XRP’s futures open interest has risen to 2.35 billion tokens, up nearly 6% from a day ago. Meanwhile, open interest has held steady in BTC, ETH and SOL futures. That’s been the trend in majors mostly, with participation remaining modest through the price bounce from early June lows.
- Other tokens see outflows: Futures linked to other tokens, such as SHIB, AVAX, LINK and DOGE, have seen open interest decline in a sign of capital outflows.
- CVD turns negative: Other metrics, like the 24-hour open interest-adjusted cumulative volume delta, also paint a bearish picture. For the first time in at least three weeks, the top 25 coins have negative CVDs. That means bears are leading the price action by shorting via market orders rather than passive limit orders.
- Funding rates shift: Funding rates for BTC hover near 0%, a sign of balanced positioning. Meanwhile, those for ETH, SOL, XRP and TRX have flipped negative, a sign of growing bias for bearish plays.
- Volatility remains calm: While key events such as the Fed meeting and the core U.S. PCE inflation figure are due this week, BTC and ETH volatility surfaces do not show any sign of traders pricing genuine stress. BTC and ETH’s 30-day implied volatility indexes remain near recent lows, a sign of market calm.
- Options show put bias: In Deribit-listed options, BTC and ETH put-call skews have climbed slightly, consistent with the overnight losses in the spot price. The bias for puts in ETH options is considerably lower than in BTC. However, volume rankings show puts or downside protection taking the top spot in both BTC and ETH.
Token talk
- Lighter (LIT) is the crypto market’s standout gainer, rising 3.97% to $2.21 as it continues to rebuild after last week’s profit-taking, with the $2.10 support level being defended for the third time this month.
- and ethena (ENA) are among the few other tokens in the green, gaining 1.54% and 1.46%, respectively, and maintaining a run of DeFi resilience even as broader sentiment sours.
- FET led the losses over 24 hours, falling 9.48%, with NEAR, HYPE and WLD all shedding 8%-9%. AI and layer-1 tokens took the brunt of the overnight selloff.
- gave back 3.07% after Monday’s strong session. It is still higher than where it was over the weekend as speculators begin to take profit.
- CoinMarketCap’s “Altcoin Season” indicator is hovering at 53/100, down slightly from Monday but higher than where it has been for the majority of July.
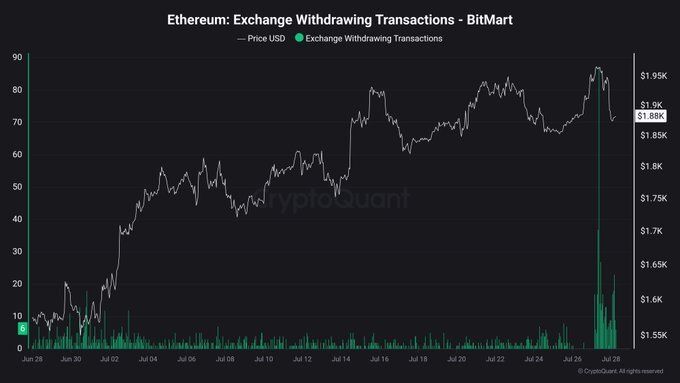
Ethereum withdrawals from BitMart have jumped to their highest level in a year. Users are rushing to pull ETH before the exchange finishes winding down its trading platform.
The exchange had frozen withdrawals briefly, then reopened them within the last day. That reopening triggered an immediate rush for the exits.
BitMart’s move followed a July 26 announcement confirming it would shut down trading entirely over the coming months. Years of declining liquidity had already pushed the exchange out of the top 10 by trading volume. The notice still caught many remaining users off guard.
Ethereum Withdrawals Hit a 2026 High
Data tracked via the blockchain analytics platform CryptoQuant highlights this massive exodus. The metrics reveal Ethereum withdrawal transactions from BitMart climbing past every prior reading since July 2025. That marks a clear signal that holders are moving funds off the exchange while they still can.
The surge tracks closely with BitMart’s own shutdown timeline. Registrations, deposits, and new trading orders paused on July 26. Full trading services end on August 26. Withdrawals stay open through January 2027, giving remaining users a narrow but real window to retrieve their holdings before the final deadline.
BitMart’s exit adds to a run of 2026 shutdowns. Its own token, BitMart Token (BMX), tumbled after the wind-down announcement rattled traders. The closure landed just three days after derivatives exchange BitMEX confirmed its own exit from the market.
Decentralized exchange Dango also halted its blockchain this month. The project shut down entirely after finding no path to lasting success, becoming the third notable platform to close in July alone.

Analysts Call the Wave a Healthy Reset
Historically, exchange failures spark brief panic before conditions settle. Several analysts, meanwhile, are reading these closures as a healthy correction rather than a warning sign for the broader market.
Some traders view the shakeout as clearing out weaker platforms, not as evidence of wider contagion. Smaller exchanges carrying similar liquidity problems could face the same pressure to consolidate or close before the year is out, industry watchers suggest.

Ethereum (ETH) itself has held steady through the turmoil. The token is trading near $1,881, according to the latest BeInCrypto data. Trading volume across the broader market has stayed largely unaffected by the BitMart news, suggesting the impact remains contained to the exchange itself.
Therefore, the withdrawal rush looks like an isolated reaction to one exchange’s closure rather than a market-wide flight from centralized platforms. Ethereum’s price action, in particular, shows little sign of stress spilling beyond BitMart’s own user base.
Still, the pattern raises a question for the rest of 2026. More struggling exchanges could follow BitMart, BitMEX, and Dango toward the exit before the year ends. For now, BitMart users have a shrinking window to move their funds. The CryptoQuant data suggests many are taking it while they still can.
The post Ethereum Withdrawals From BitMart Surge After Wind-Down Notice appeared first on BeInCrypto.

Apple Sued Over Alleged Bitcoin Wallet Scam Scheme
“Spider-Man” team calls “Brand New Day” the start of something new: ‘It’s a beginning’

Candice Swanepoel Leads Victoria’s Secret Very Sexy Ad


-

 Fashion4 days ago
Weekend Open Thread: Brooks Brothers
-

 NewsBeat7 days ago
How a former Blue Peter presenter stunned America’s Got Talent judges
-

 Tech1 day ago
Intel is reversing course and bringing hyper-threading back to its server chips
-
 Business6 days ago
New Jersey voter registration controversy explained: How 6,600 noncitizens got on the rolls, and what happens next
-
 Entertainment7 days ago
Johnny Depp’s R-Rated Gothic Cult Classic Gets New Release Ahead of Sydney Sweeney Remake
-

 Crypto World6 days ago
Ethics, other provisions in crypto Clarity Act to be further discussed
-

 Politics1 day ago
Luke Littler dismantles Gerwyn Price to retain title in Blackpool
-
 Sports2 days ago
Commonwealth Games boxing: Jadumani Singh seals dominant 5-0 win over Pakistan’s Sumama Rehman to enter quarter-finals | Commonwealth Games News
-

 Sports4 days ago
2026 3M Open leaderboard: Scottie Scheffler finds putter in Round 1, sits three back
-

 Fashion4 days ago
16 Dresses for the High Summer Event
-

 News Videos5 days ago
The Peugeot Family: How 200 Years of an “Old Money” Dynasty Died in A Boardroom
-

 Politics2 days ago
Spain sweeps the board at 2026 World Cup with individual awards
-

 Politics3 hours ago
The Part of the Electric Transition Nobody Wants to Discuss
-

 News Videos2 days ago
BITCOIN JUST ENTERED THIS CRITICAL ZONE…
-
 Entertainment4 days ago
A New Post-Apocalyptic Gundam Anime Series Blasts Into SDCC
-

 Crypto World2 days ago
XRP Ledger adds $2.6B as RWA inflows rank second
-

 Crypto World3 days ago
Ripple bought a bank in pieces. The $4 billion audit
-

 Tech3 days ago
Anthropic launches Claude Opus 5, a cheaper AI model for coding, agents and enterprise workflows
-

 Crypto World5 days ago
Uniswap (UNI) pushes deeper into tokenized RWAs with permissioned trading pools
-

 Entertainment2 days ago
Sara Gilson Killed By Husband After Viral “Pedophile” TikTok Video
You must be logged in to post a comment Login