
Crypto World
Ethereum price slips below $1,900 as long liquidations surge

Ethereum price fell 5% from $1,973 to $1,873 on July 28 after another rejection below $2,000 triggered forced selling and pushed ETH into a key technical support zone.
- Ethereum price dropped below $1,900 after buyers failed to break the $1,975–$2,000 resistance zone.
- Leveraged positions accelerated the decline as ETH moved through several long-liquidation clusters.
- ETH is testing the lower boundary of a rising wedge near $1,870 on the 4-hour chart.
- The next large concentration of downside liquidity sits around $1,840–$1,850.
Ethereum price falls below $1,900 after $2,000 rejection
According to data from crypto.news, Ethereum (ETH) price traded near $1,875 at the time of writing, down from an intraday high close to $1,973. The decline erased most of the gains from the previous session, when ETH reached its highest level since early June.
Selling intensified after buyers failed to push the price through the $1,975–$2,000 resistance range. The rejection trapped traders who had opened leveraged long positions in anticipation of a breakout above the psychological threshold.
ETH subsequently moved below $1,900, activating stop-loss orders and forcing position closures. The price reached approximately $1,873 before stabilizing around the lower end of the daily range.
Despite the decline, Ethereum remains above its early July low near $1,560. The token has gained roughly 20% from that level, meaning the wider recovery has weakened but has not yet been invalidated.
Leveraged longs accelerate the ETH sell-off
Derivatives positioning appears to have increased the speed of the decline. Bullish traders had built exposure as Ethereum approached $2,000, leaving the market vulnerable when spot demand failed to sustain the move.
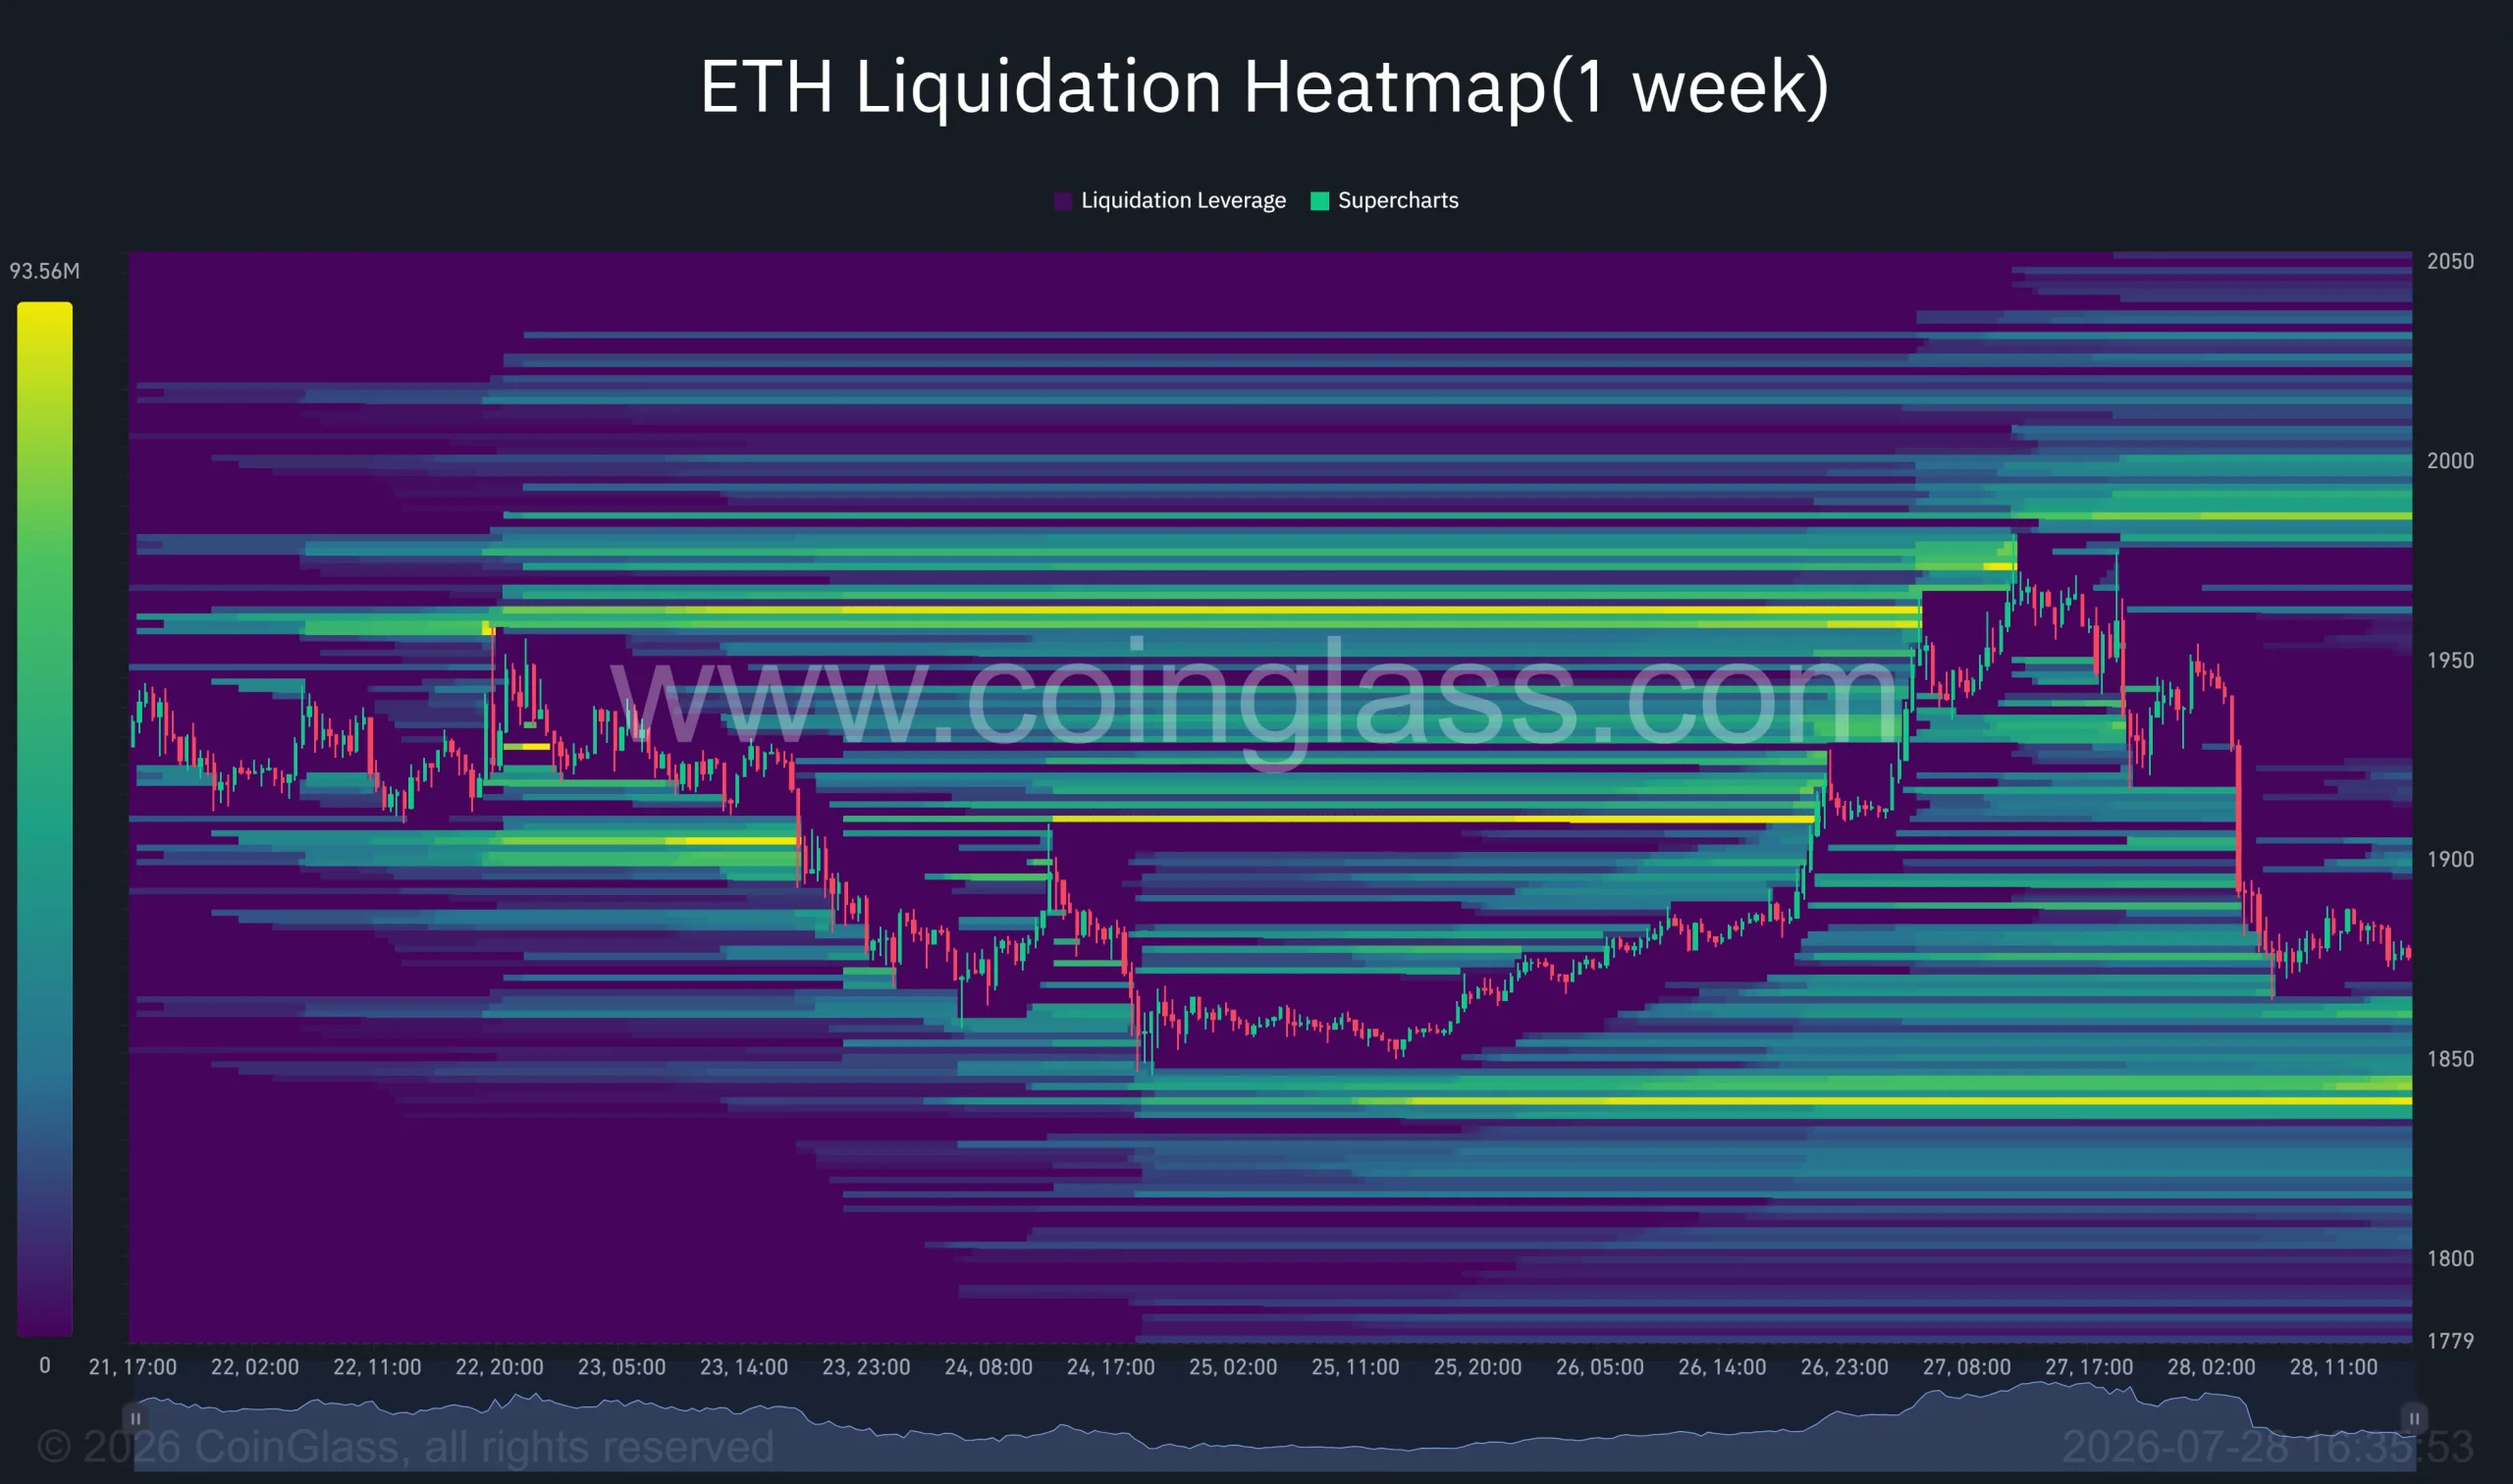
The one-week ETH liquidation heatmap shows that the price passed through multiple areas of leveraged exposure between $1,950 and $1,890. Forced closures likely added sell orders as Ethereum broke through those levels.
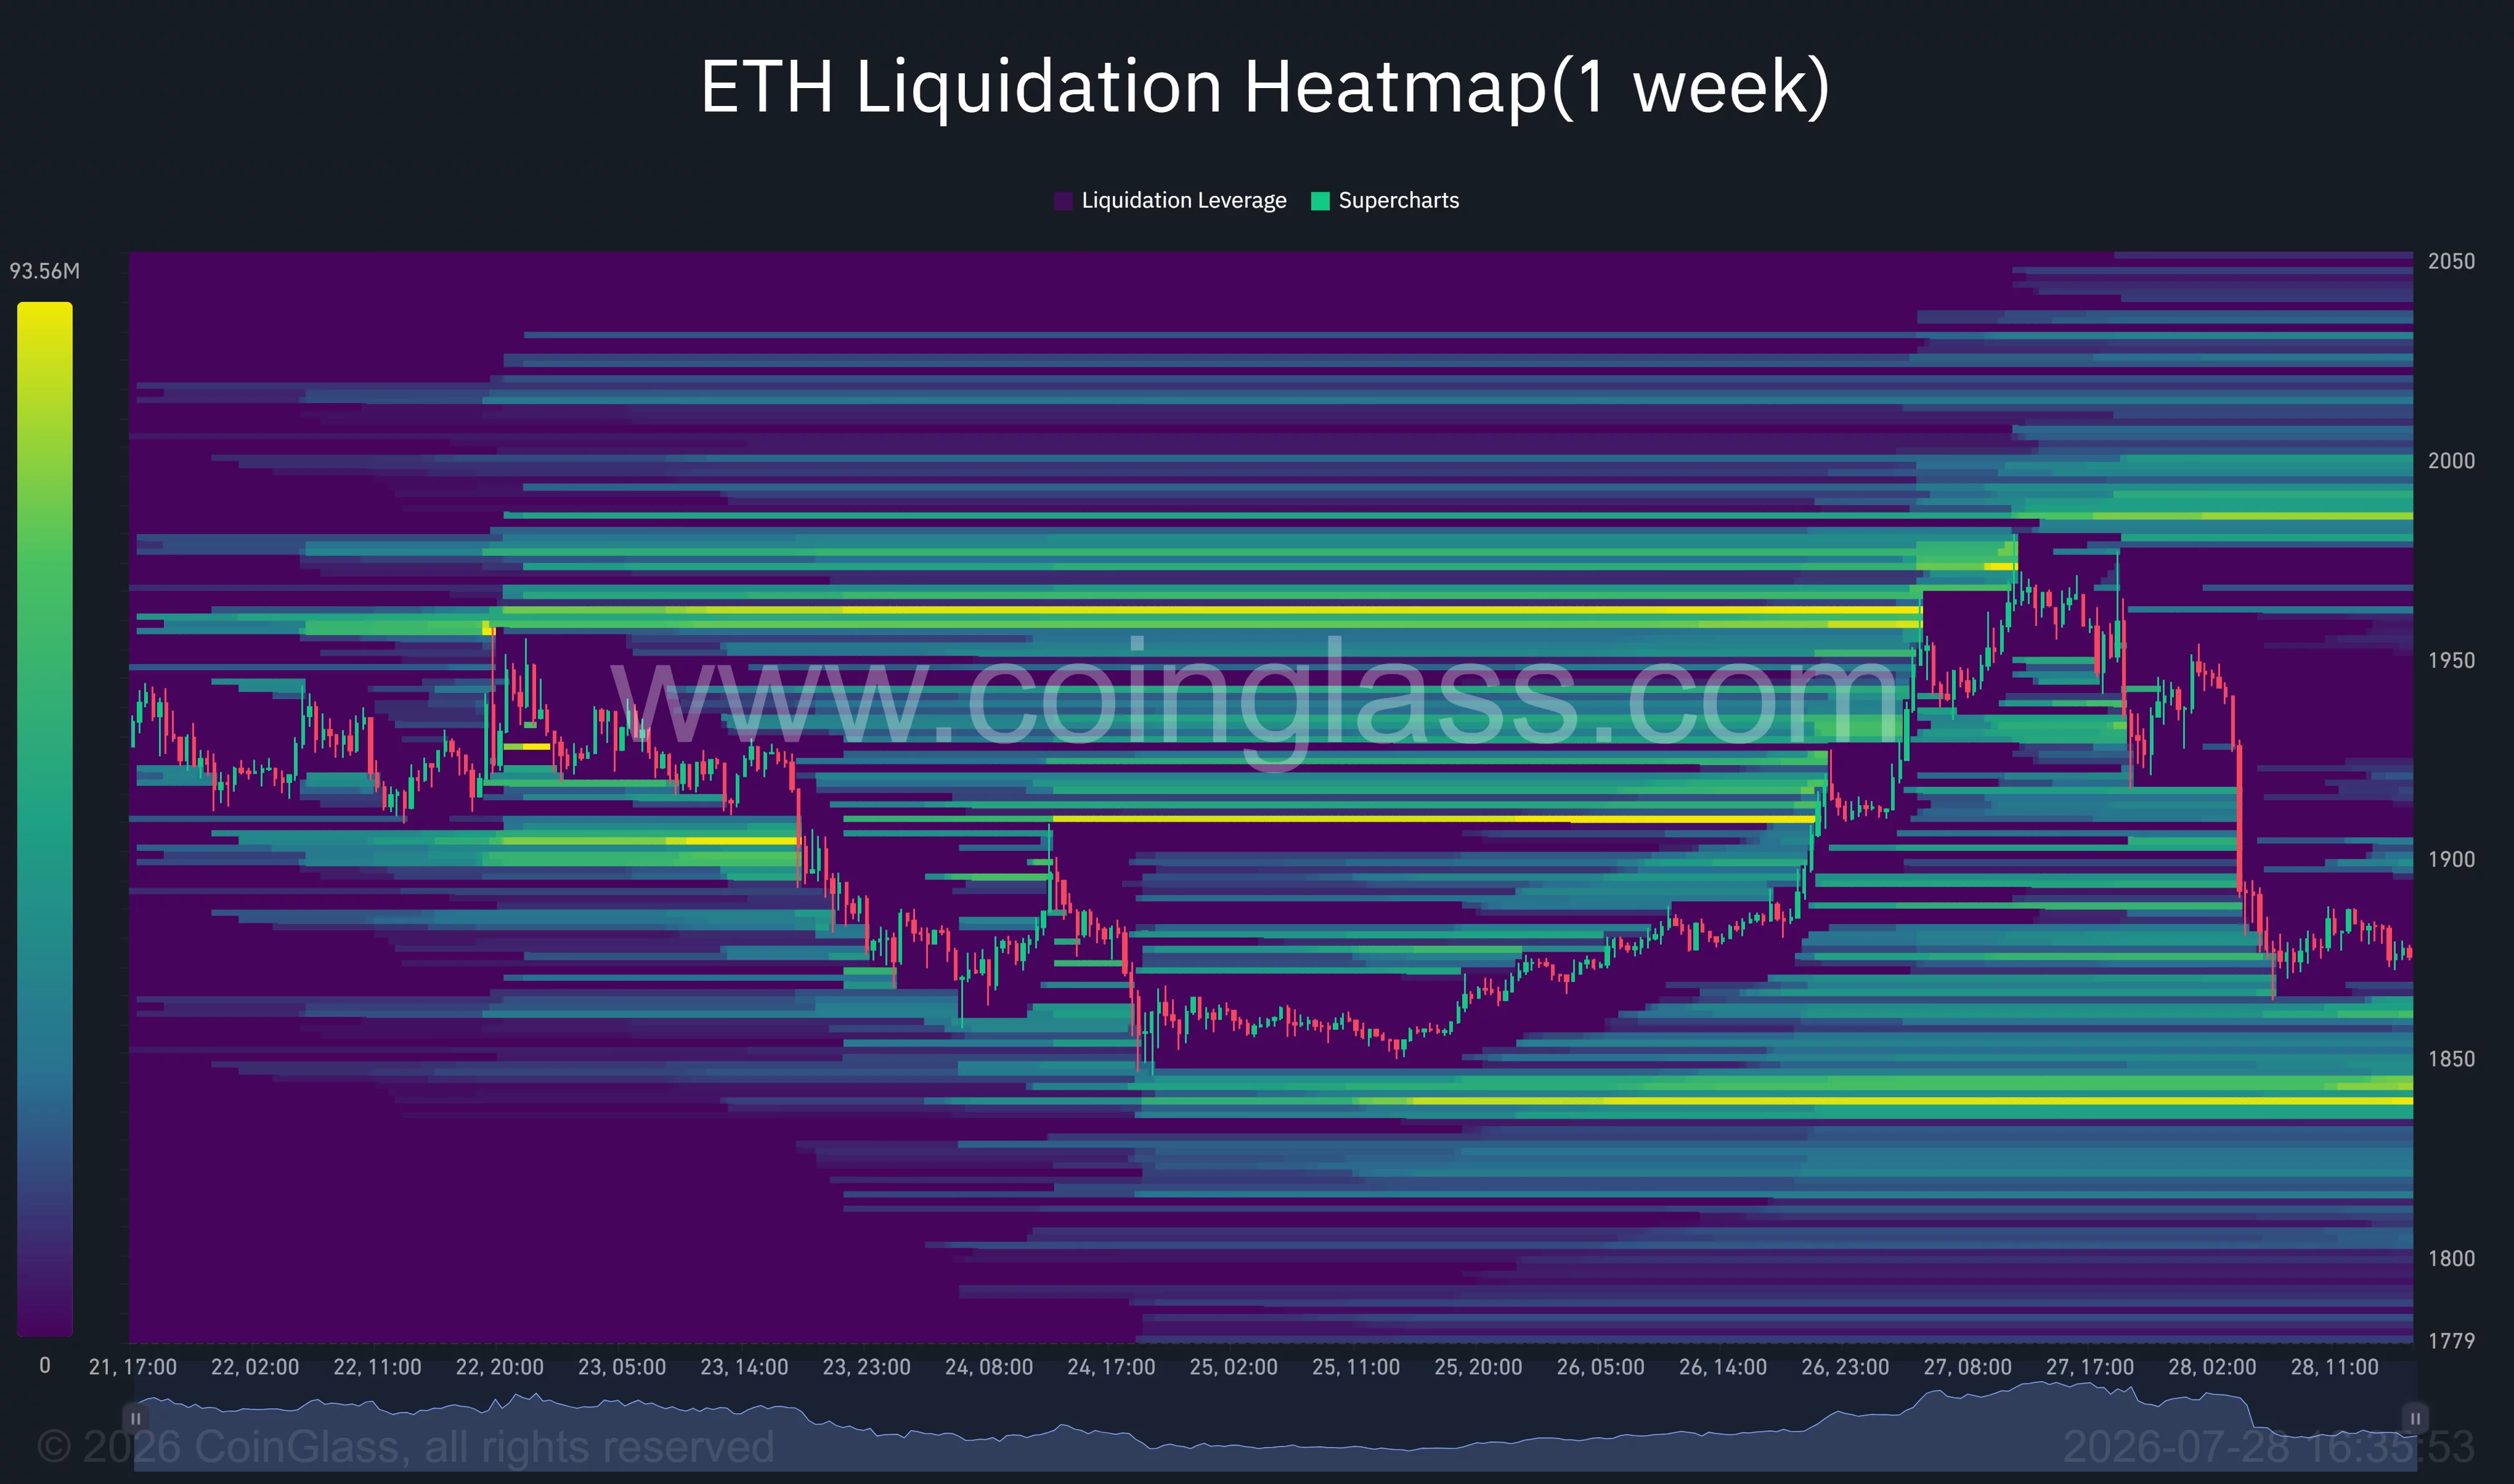
The heatmap now shows a larger concentration of liquidity around $1,840–$1,850. Price can gravitate toward such areas because liquidations produce additional trading activity, although the data does not guarantee that ETH will reach the zone.
Transfers from large wallets to centralized exchanges may also have added to the pressure. Exchange deposits increase the amount of ETH available for sale, but they do not confirm that the holders have liquidated their assets.
Broader weakness across technology stocks contributed another source of pressure. Concerns about the financial returns from heavy artificial intelligence spending have increased volatility across global equities, encouraging investors to reduce exposure to risk assets, including cryptocurrencies.
ETH tests rising support near $1,870
Ethereum’s 4-hour chart shows the price testing the lower boundary of a rising wedge near $1,870. The trendline has supported the recovery since the middle of July, making the current area important for the token’s next move.
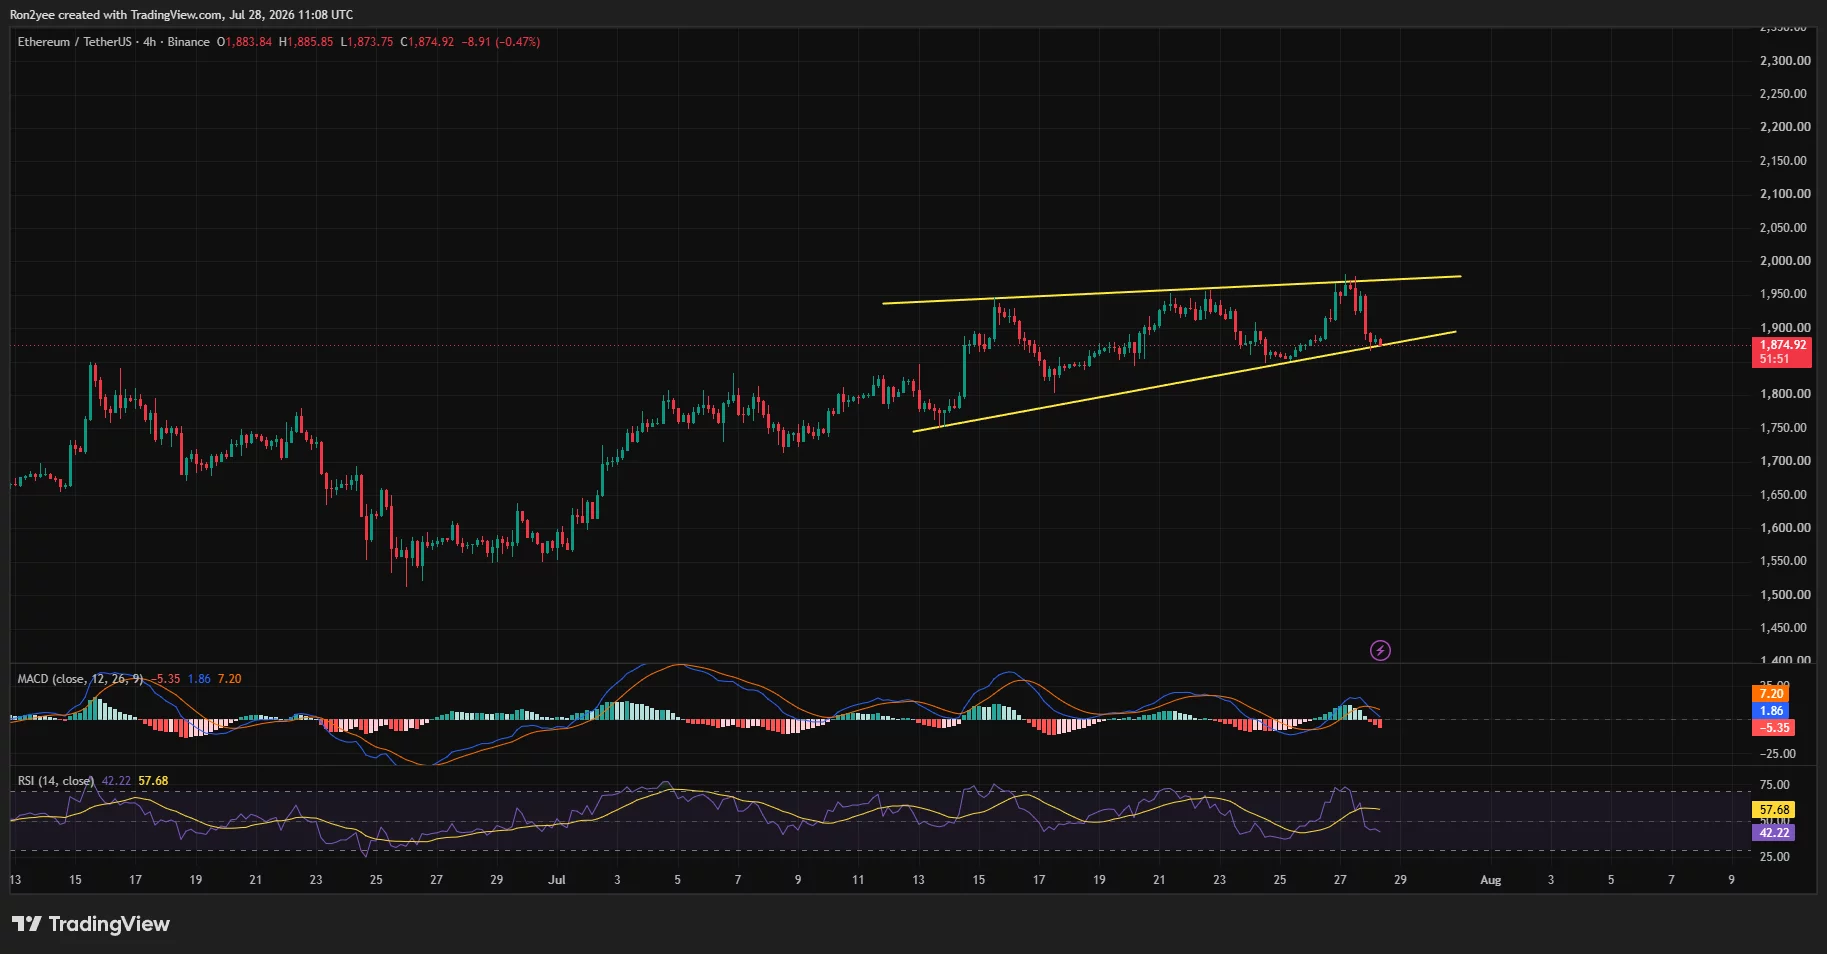
A decisive close below the trendline would weaken the rebound and could send ETH toward the $1,850–$1,840 liquidity zone. Failure to hold that area would expose the 100-day simple moving average near $1,758.
Momentum indicators support a cautious short-term outlook. The 4-hour relative strength index has fallen to 42.22, below its moving average of 57.68. The reading shows weakening demand but remains above the oversold threshold of 30.
The moving average convergence divergence indicator has also turned bearish. The MACD line has fallen below its signal line, while the histogram has moved into negative territory, showing that sellers retain short-term control.
On the daily chart, Ethereum price remains above its 20-day SMA, currently near $1,864, offering immediate support around the present price. The 50-day SMA stands lower at approximately $1,759.
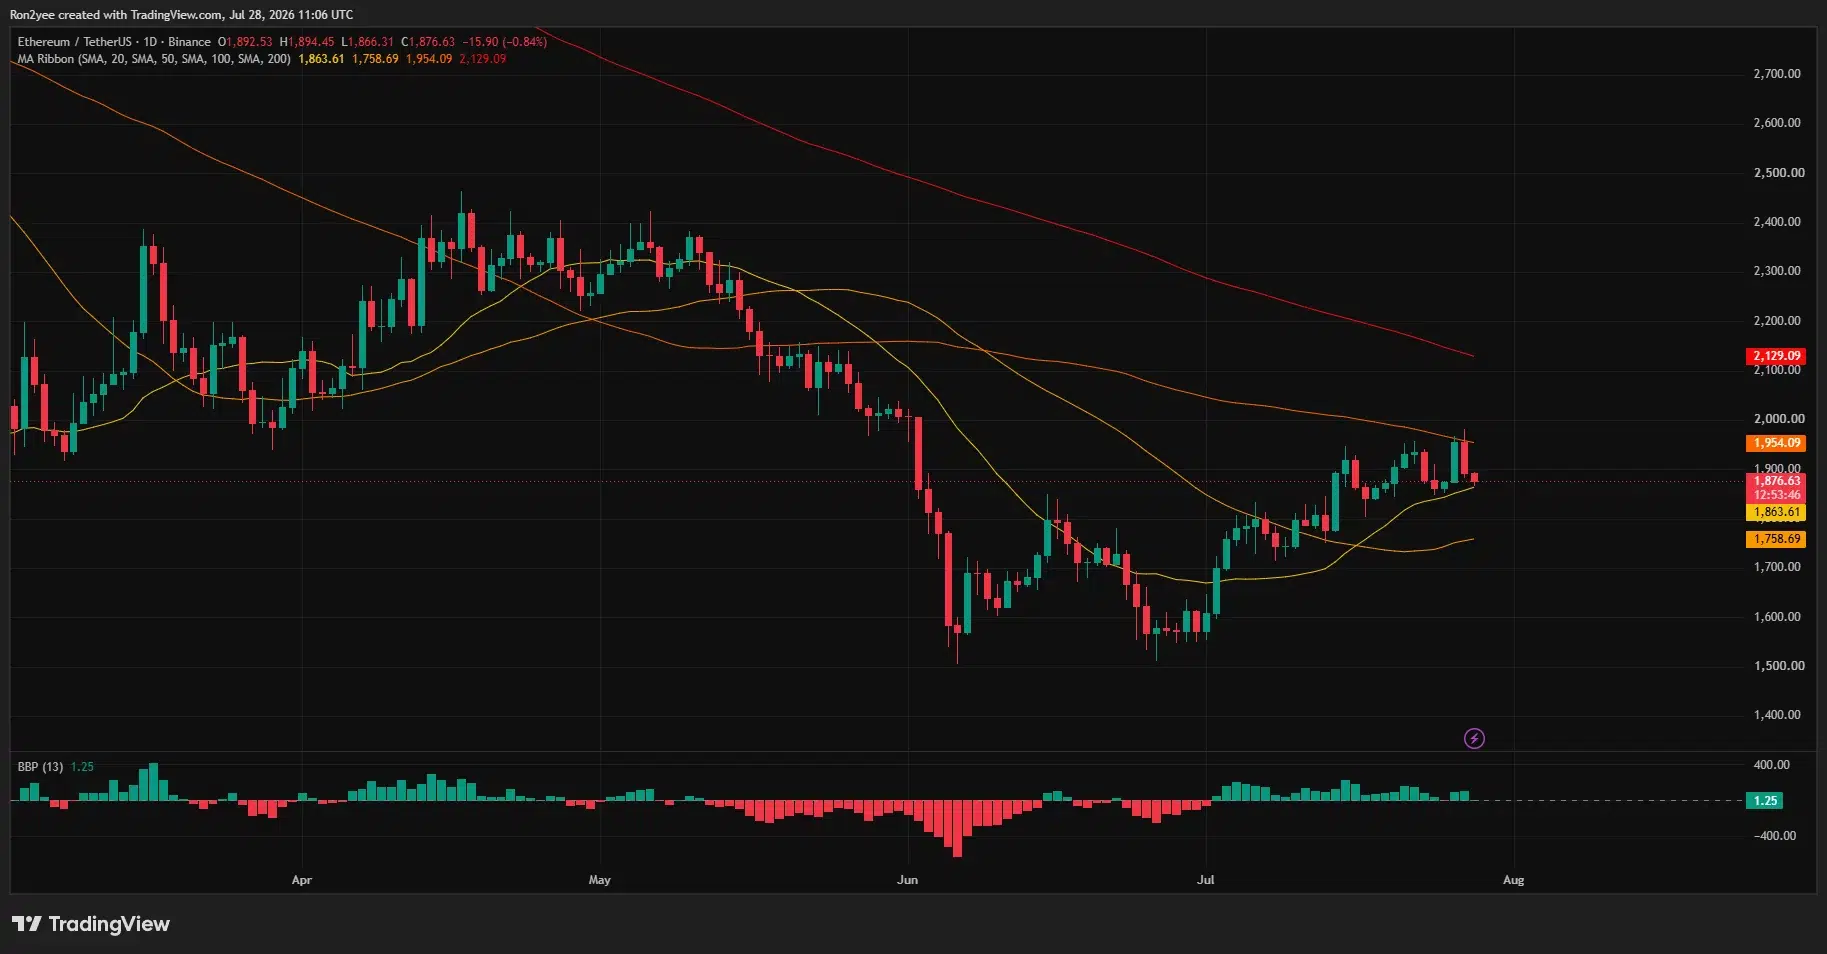
On the upside, ETH must first recover $1,900. Further resistance sits between $1,950 and $1,975, where the recent high and the 200-day SMA near $1,954 create a stronger supply zone.
A daily close above $1,975 would weaken the bearish setup and give buyers another chance to test $2,000. Until that happens, rebounds into the resistance zone may continue to attract selling.
Analysts identify $1,840 as the decisive support
Crypto analyst Ted Pillows described the current trading area as a key support zone for Ethereum.
“ETH is back into its key support zone. As long as this holds, Ethereum will continue to outperform Bitcoin.”
Pillows’ chart places support around $1,840, followed by possible recovery levels near $1,956, $2,030, and $2,195. A breakdown below the current zone, however, could shift attention toward approximately $1,700 and $1,530.
Market commentator Rain pointed to corporate accumulation as a potential source of longer-term demand. Rain noted that BitMine added nearly 10,000 ETH during the previous week, taking its reported holdings to approximately 5.79 million ETH.
Rain also said ETH had gained about 2.4% over the week while Bitcoin declined roughly 0.7%, pushing the ETH/BTC ratio to a three-month high. The relative strength suggests some investors continue to favor Ethereum despite the latest intraday correction.
Corporate buying may support ETH over longer periods, but it cannot prevent short-term volatility when leveraged positioning becomes crowded. The immediate outlook still depends on whether buyers can defend the $1,840–$1,870 region.
Fed expectations add pressure for US traders
US investors are also monitoring Treasury yields and expectations surrounding Federal Reserve policy. Higher risk-free yields can reduce demand for speculative assets and make Ethereum’s staking yield less attractive relative to government bonds.
Demand for US-listed spot Ethereum exchange-traded funds represents another key variable. Continued institutional inflows could help absorb exchange-based selling, while sustained outflows would remove a source of demand that supported the July recovery.
Regulatory uncertainty around staking services and liquid staking products remains relevant for US holders. Changes to the treatment or availability of those services could affect institutional demand and the way investors value Ethereum’s yield.
For now, $1,840 remains the principal downside level, while $1,950–$1,975 is the range bulls must reclaim. Holding support would preserve Ethereum’s July recovery structure, but a daily close beneath it could expose the 100-day SMA near $1,758.
Disclosure: This article does not represent investment advice. The content and materials featured on this page are for educational purposes only.

OSL Digital Securities has opened XRP trading to retail investors in Hong Kong, creating a regulated fiat on-ramp as US lawmakers continue debating federal crypto market rules.
Summary
- OSL became Hong Kong’s first SFC-licensed platform to offer direct retail spot access to XRP.
- Retail users can access XRP/USD through Flash Trade and XRP/USD and XRP/HKD through OTC trading.
- XRP joins Bitcoin, Ethereum, and Solana among assets available to OSL’s retail clients.
- The launch follows XRP’s December 2025 listing for professional investors on the same platform.
OSL opens XRP trading to Hong Kong retail investors
OSL Digital Securities launched retail XRP trading on July 29, according to an announcement from the company. The platform operates as a subsidiary of OSL Group, which is publicly listed in Hong Kong under stock code 863.
The rollout makes OSL the first platform licensed by Hong Kong’s Securities and Futures Commission to give retail investors direct spot access to XRP.
OSL introduced an XRP/USD pair through its Flash Trade service. Its over-the-counter service also supports XRP/USD and XRP/HKD, with transactions settled through the XRP Ledger.
The Hong Kong dollar pair gives local investors a direct fiat route into XRP through a regulated venue. Retail users previously had fewer options and often depended on offshore exchanges that do not operate under the city’s licensing framework.
XRP now joins Bitcoin, Ethereum, and Solana as the four digital assets available to retail clients on OSL. The company holds Type 1 and Type 7 licenses from the SFC and is registered under Hong Kong’s Anti-Money Laundering and Counter-Terrorist Financing Ordinance.
OSL also says its custody setup carries $1 billion in insurance coverage for client assets.
XRP access expands beyond professional investors
The retail launch follows OSL’s initial XRP listing in December 2025, when access was limited to professional investors, including institutions and qualifying high-net-worth clients.
That earlier rollout supported XRP/HKD, XRP/USD, and XRP/USDT through Flash Trade. Extending access to everyday investors marks the next stage of OSL’s XRP offering and reflects Hong Kong’s gradual expansion of regulated crypto products.
The launch also adds another regulated entry point for XRP in Asia as institutional firms build blockchain-based financial infrastructure across the region.
Japan’s SBI Holdings, a long-time Ripple partner, expanded that strategy on July 28 by restructuring a wholly owned subsidiary around the Canton Network. SBI Security Solutions became SBI Digital Practice, creating a dedicated business for institutional on-chain finance.
The subsidiary will develop financial applications and infrastructure on Canton, covering regulatory compliance, implementation support, and cross-border transaction systems. The move adds Canton to SBI’s existing work involving Ripple and the XRP Ledger.
XRP institutional demand and XRPL activity grow
OSL’s retail expansion comes as investment products tied to XRP continue attracting capital. XRP spot exchange-traded funds have recorded eight consecutive weeks of inflows, lifting cumulative inflows to about $1.49 billion.
Activity on the XRP Ledger has also expanded beyond XRP transfers. RWA.xyz placed the XRP Ledger’s combined distributed and represented real-world asset value at about $4.37 billion on July 29, including $313.3 million in distributed assets and $4.06 billion in represented assets.
Ripple’s RLUSD stablecoin recorded another source of network growth. Messari reported that RLUSD’s market capitalization on the XRP Ledger rose 44.9% quarter over quarter to $340.3 million at the end of Q1 2026, making it the network’s largest stablecoin.
Hong Kong moves as US crypto legislation stalls
Hong Kong’s licensed rollout contrasts with the slower development of federal crypto market rules in the United States.
Ripple CEO Brad Garlinghouse recently urged Congress to pass the Digital Asset Market Clarity Act despite unresolved disagreements. Garlinghouse backed Ripple Chief Legal Officer Stuart Alderoty’s argument that lawmakers should not abandon the legislation while seeking a perfect compromise.
“Perfect can’t be the enemy of good. Let’s get this done!” Garlinghouse wrote.
The CLARITY Act remains caught in a Senate dispute over consumer protection, ethics restrictions, enforcement powers, and illicit-finance safeguards. Seven Senate Democrats have opposed the current text while leaving negotiations open.
For US investors, OSL’s launch does not create access unless they meet the platform’s jurisdictional and eligibility rules. Its broader importance lies in showing how Hong Kong is adding assets to licensed retail venues while the United States continues working toward a national framework for classifying and supervising digital assets.
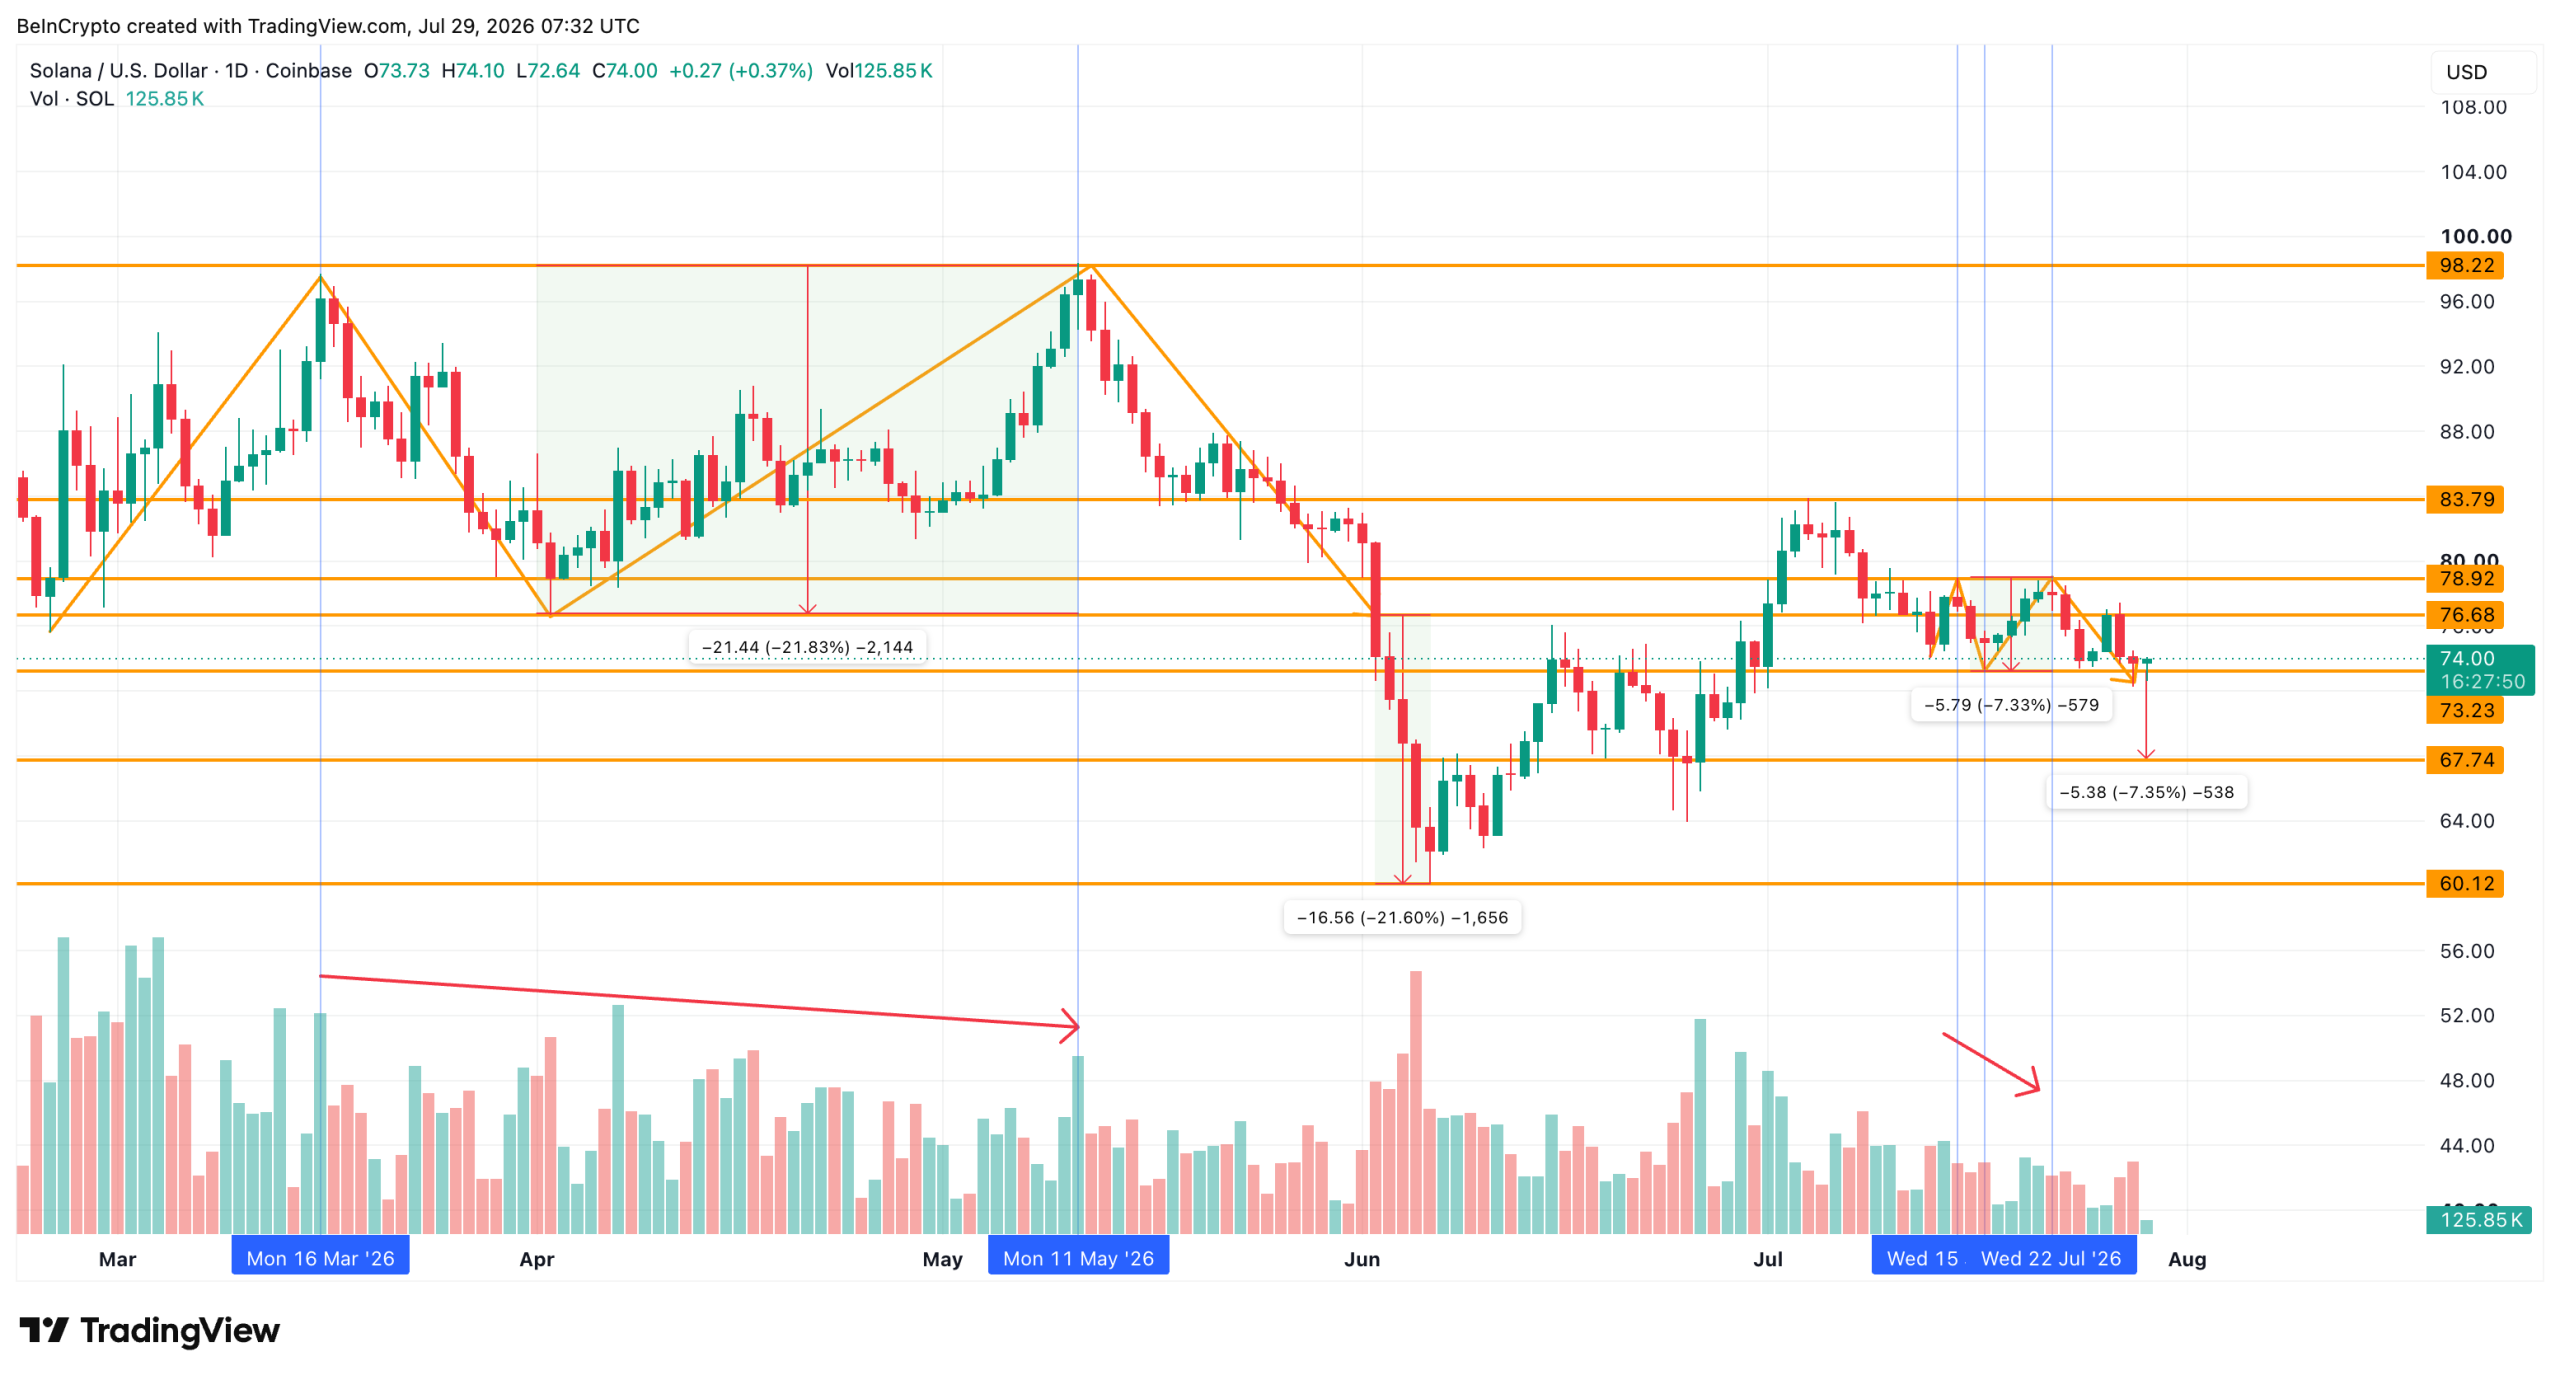
Solana (SOL) price is rebuilding the same chart pattern that pulled it down about 21% earlier this year, and it has resurfaced right at $74.
This time, the structure looks weaker and less symmetrical, yet on-chain data carries a warning that the spring version never did. The next few sessions will decide whether buyers can break the sequence.
Solana’s Double Top Returns on Fading Volume
Solana price is tracing a double top. It is a bearish pattern where price hits a similar high twice and stalls, with the dip between the two peaks acting as the neckline. The two peaks formed around July 15 and July 22, with the neckline dip near July 17.
Want more token insights like this? Sign up for Editor Harsh Notariya’s Daily Crypto Newsletter here.
The setup is building around falling buy volume, which typically supports a bearish read. This is because fewer buyers are defending each push higher. That echoes the spring double top, which formed between mid-March and May 11 on similarly fading volume and led to a drop of about 21%.

From an exploratory view, the neckline sits near $73, and a clean break would project a slide of roughly 7% toward the $67 area. The risk stays alive while Solana’s price action holds below the $79 zone. Below $79, the risk of additional tops remains intact.
The exchange net position change, a metric that tracks tokens moving in and out of exchanges, helps test how closely this repeats the spring move. During that earlier top, the reading ran deeply negative, near 8 million SOL in mid-March before easing to about 5.4 million by May 11.

The current top has formed on far lighter flows, from roughly 0.2 million SOL in mid-July to about 0.9 million by July 22. The much smaller readings suggest weaker distribution pressure this time, which may explain why the pattern looks less symmetrical.

That lighter selling or rather more aggressive buying, however, is only half the story.
Long-Term Holders Break From the Spring Playbook
The HODL Waves metric, which groups SOL supply by how long each coin has stayed unmoved, flips the tone. The one-to-two-year band matters most here because it tracks conviction holders who tend to sit still through volatility.
During the spring double top, that band held roughly flat near 15.9%, a sign long-term holders were not selling into the weakness. This time the reading has slipped from about 15.7% in mid-July to 15.17% by July 28.

The steady decline suggests these holders are trimming exposure as the pattern forms, support the spring version never lost. It appears they are reacting to the setup rather than anticipating it, which leaves the price chart to settle the argument.
Solana Price Levels That Decide the Double Top
The Solana price now sits near $73, just above the pattern base at $72. A daily close below that base would confirm the double top. Moreover, that would project the measured move of about 7% (mentioned earlier) toward $67. That could open the $60 floor if selling extends.
For the bulls, the double-top risk stays intact while SOL trades under $78.92 (the $79 zone from earlier). A daily close above $81 and ideally $84 would invalidate the near-term pattern and reopen the higher range.

Because this pattern is less symmetrical and forms on lighter exchange flows, any breakdown may prove shallower than the spring 21% slide. Still, the slipping long-term-holder support keeps the downside risk live, so the Solana price prediction hinges on one line.
The $72-$73 neckline zone separates a failed double top from a confirmed breakdown toward $67.
The post One Pattern That Predicted the 21% Solana Price Drop Has Returned appeared first on BeInCrypto.

Crypto’s latest cycles repeatedly show a familiar pattern: attention and narrative momentum often arrive before fundamentals do. Behavioral finance researchers say this isn’t unique to digital assets—it’s simply intensified in a market where new themes can spread quickly and investors may treat the hunt for transformative wealth as the main goal.
In comments shared with Magazine, Samar Sen, head of international markets at Talos, argued that in younger markets “price discovery… tends to be driven by attention before it’s driven by analysis.” That dynamic helps explain why newer tokens built around a fresh story can capture headlines even when older, revenue-producing protocols continue to improve their underlying businesses.
Key takeaways
- Behavioral research suggests many investors allocate capital to “life-changing” outcomes, not only to maximizing risk-adjusted returns.
- Crypto narratives can propagate faster than protocol fundamentals, causing prices to move ahead of underlying fundamentals.
- A research comparison by MarketWise framed alongside behavioral theory shows speculative winners and “lottery ticket” behavior can dominate outcomes across asset types.
- Institutional investors typically evaluate liquidity, custody, and operational resilience earlier than upside potential, which can leave them positioned differently from retail in fast-moving cycles.
Why narratives can outrun fundamentals
In behavioral finance terms, the “attention first” problem emerges when investors respond to an easy-to-underwrite story rather than doing the deeper work required to assess an established project. Sen told Magazine that evaluating a mature protocol involves understanding real usage, revenue generation, token design, and competitive positioning—tasks that are harder than quickly absorbing a new narrative.
The broader implication is that crypto cycles can resemble a cycle of storytelling rather than a steady appraisal of economic fundamentals. Even as the industry matures—adding institutional participation, revenue-generating protocols, and more real-world use—the market still gravitates toward the next theme that promises outsized returns.
From poker hands to “transformation” portfolios
One reason investors may repeatedly chase the next cycle is that, according to Meir Statman—a behavioral finance pioneer and professor at Santa Clara University—people often invest for reasons that go beyond conventional assumptions of return maximization. Statman argues that investors mentally separate wealth into two layers: a “not-poor” layer designed to preserve living standards and avoid falling into poverty, and a “be-rich” layer intended for transformative goals such as buying a house or achieving financial independence.
Within this framework, concentrated bets may not be irrational. Diversification can be statistically sensible, but investors with limited capital may feel it offers a poor chance of reaching transformative outcomes—especially if the available pool of candidates doesn’t look capable of delivering that “be-rich” outcome.
MarketWise senior writer James Royal echoed this view, telling Magazine that loyalty tends not to attach to asset classes themselves—whether crypto, stocks, or collectibles. Instead, investors rotate toward whatever promises lucrative returns next. Royal also suggested that while investors may not be seeking risk for its own sake, “FOMO” around potential life-changing returns can lead to underestimating downside risk.
The MarketWise comparison: attention versus outcomes
A recent MarketWise study, linked in the report, compared hypothetical $10,000 investments across multiple categories—including cryptocurrencies, stocks, exchange-traded funds, and collectibles—between January 2021 and April 2026. According to the study, a sealed Pokémon card box outperformed Bitcoin in the comparison, and limited-edition sneakers nearly matched Dogecoin’s returns.
In the same timeframe, the study found that some popular AI-focused funds lagged the broader stock market even as AI dominated headlines. The takeaway is not simply that some assets beat others, but that “better story” dynamics can outweigh fundamentals in how capital gets allocated, especially when investors are searching for transformative outcomes.
Statman ties this together by arguing that investors are not always buying the “best” asset in a narrow sense. Instead, they may be buying a lottery ticket aimed at a life-changing result—an approach that can apply to a digital asset as easily as to collectible memorabilia or even certain stocks.
DeFi fundamentals versus token excitement
The tension between protocol fundamentals and token excitement shows up clearly in decentralized finance. Even when large platforms generate substantial revenue and attract significant capital, their tokens may not capture the same level of attention as newer narratives.
To illustrate, the article cited Aave trading around $98 at the time of writing—about 85% below its 2021 peak—while Aave’s total value locked (TVL) was described as over $14 billion, and as having reached more than $37 billion during the bull market peak in October 2025. The underlying point is that on-chain activity and value lock can look strong even as token price performance fails to match the same level of speculative enthusiasm.
Thomas Probst, a research analyst at Kaiko, emphasized that fundamentals still matter in the long run, particularly resilience, liquidity, and volatility, and the robustness of market structure. However, the article argued that a token tied to an established protocol can struggle to compete for investor attention against the possibility—however unlikely—of extreme upside.
Royal summarized the mismatch by saying investors may confuse “a great technological breakthrough with a great investment opportunity.” In other words, innovation can remain valuable while the market’s willingness to pay for upside can shift as narratives evolve.
Institutions evaluate differently—and arrive at different times
Sen said institutions operate under constraints that make pure narrative chasing difficult. He argued that institutional mandates typically don’t allow investors to focus solely on speculative, outsized returns. Instead, institutions tend to underwrite risk-adjusted performance, liquidity, custody arrangements, and operational resilience before looking at upside.
This difference can shape when institutions enter a cycle. Sen described a recurring pattern: themes often begin with something real—technical breakthroughs or new use cases. But once speculative money starts flowing, prices can move faster than fundamentals. According to Sen, investors who arrive later may respond to the narrative itself as much as the original fundamentals that launched it. Meanwhile, institutional capital—often guided by process and discipline—may be a step behind the first narrative impulse but ahead of the subsequent correction.
Timing risk: buying the cycle versus buying at the peak
The MarketWise report highlighted how entry timing can dominate outcomes in narrative-driven markets. It reported that a hypothetical $10,000 Bitcoin investment made in January 2021 would have grown to more than $24,000 by April 2026, implying a +141% gain. Yet the same hypothetical investment made at Bitcoin’s cycle peak in October 2025 would have fallen to just over $6,000 by April, a -38% return, with an estimated value of about $5,000 “today” in the article’s context.
The article further suggested that an investor who chased another popular name late in the same period would have faced large losses, using the example of an AAAVE-related purchase around the same timeframe being down roughly 85% at the time of writing. While individual outcomes vary widely, the larger lesson is consistent with the behavioral framing: narratives can temporarily overwhelm fundamentals, and buying after the story has already gained momentum can change the risk profile dramatically.
For market participants, the immediate question isn’t whether the “next 100x” will keep being chased—it likely will—but how investors will distinguish between a genuinely new unlock and a narrative that has already been priced in. Watching liquidity conditions, protocol-level usage and revenue trends, and whether price action continues to outpace fundamentals may offer a practical way to separate the two as the next cycle narrative takes hold.
Key points:
- KOSPI’s back-to-back circuit breakers wiped $620 billion in two days, worsened by leveraged retail bets
- Hyperscaler CDS jumped from 115 basis points to 162bps in recent months, implying ~12% five-year default odds, with Oracle’s OpenAI exposure the biggest red flag
- Hynix posted a record 60.54 trillion Korean won profit but still missed the 64 trillion won estimate
Korea sees two-day, $620 billion wipeout
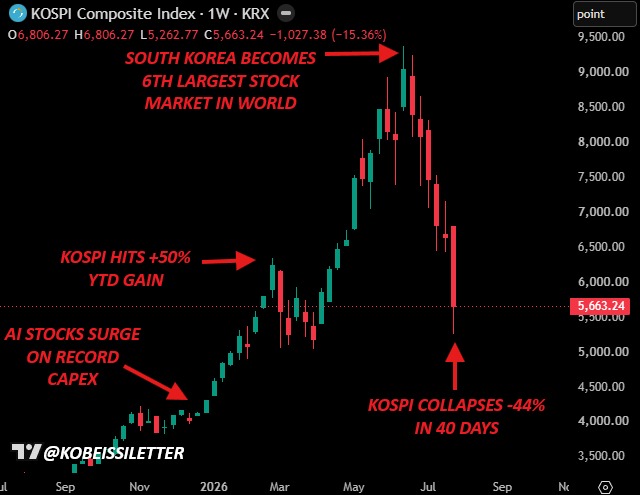
Korean equities saw the second day of a historic sell-off on Wednesday with market-wide circuit breakers again halting trading. Combined with Tuesday’s drop, the KOSPI has now shed nearly 17%, wiping out $620 billion in market capitalization. This has prompted the government to convene an emergency meeting of its financial authorities.
The initial trigger for the sell-off was SK Hynix’s Q2 earnings miss. The stock was down another 4% today, extending Tuesday’s 15% drop. Taken together with Samsung Electronics, the company makes up nearly half of the Korean index.
Related: Trade.xyz to cover SK Hynix perp liquidation losses tied to price anomaly
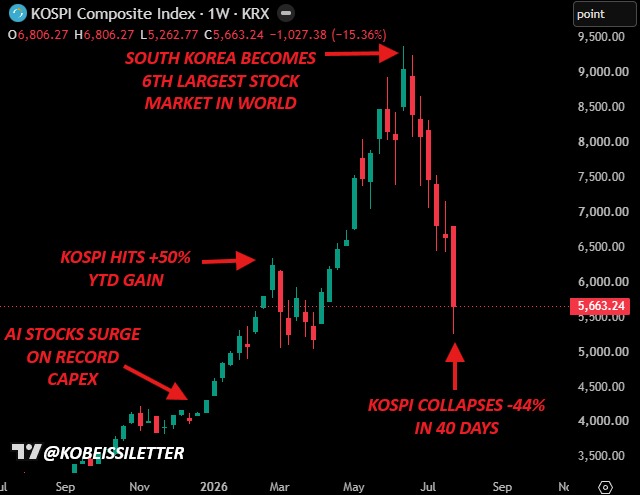
Current KOSPI sell-off on a high timeframe. Source: Kobeissiletter, Tradingview
Among a generation of Koreans priced out of housing and squeezed by a tightening labor market, all-or-nothing bets on high-risk instruments are increasingly popular. This week’s sell-off is hitting risk-loving young Korean retail traders, who have historically had an affection for the crypto sector, but flocked to AI and semiconductor equities in recent months. Korean crypto volumes are down 28%, while the KOSPI remains up 31% year-to-date.
With the approval and launch of single-stock leveraged exchange-traded funds for retail trading in May, those retail investors were drawn into the market and have added additional leverage. The assets under management of these products crossed $50 billion in July. After hefty losses in recent days, top policymakers have now apologized for the decision and called for a renewed ban on retail trading for these instruments.
The sell-off is a further sign that semiconductor and AI stocks are priced for flawless execution, leaving substantial downside if the sector’s aggressive growth targets are not met. Although Hynix brought in a record 60.54 trillion won ($41.25 billion) operating profit, up 557% year-over-year, this figure fell short of the 64 trillion won analyst consensus.
Bond vigilantes eye AI trade
The semiconductor sell-off is consistent with broader signs of fatigue in the AI trade. The uncertainty accruing in the sector has swept over from equity to credit markets. 5-year credit default swaps on a basket of the five largest US hyperscalers — Amazon, Meta, Microsoft, Google and Oracle — have jumped from 115bps to 162bps in recent months and is now at a record high. These instruments let a bondholder pay a periodic fee to a counterparty in exchange for a payout if the underlying borrower defaults. When compared to equal-dated government bonds, the resulting credit spread paints an even more concerning picture.
The market currently implies default odds of 12% for these companies within five years. Sage Advisory said hyperscalers have more than doubled their collective dollar debt footprint since September to more than $360 billion as free cash flow turns negative.The biggest contributor to the credit risk is Oracle after its aggressive AI investments. While the company boasts a massive contract backlog, a significant percentage of it is tied to OpenAI as a single customer, which has struggled to generate cashflow and delayed its IPO.
Combined 2026 capex guidance from Alphabet, Microsoft, Amazon, and Meta is now tracking toward $725 billion-$730 billion. Even Alphabet posted its first cash burn on record in the second quarter, at $5.9 billion, despite its cloud unit posting 82% growth. Meta is slated to report Q2 results later today after US markets close.
Related: Bitcoin lows pierce $63K as Asia chip-stock crash spreads to Wall Street


This same story repeated in June but from a different angle: the month’s largest loss, more than $30 million at Humanity Protocol, came from a private key compromised on a team member’s machine, with the contract untouched, per the project’s own account.
This is the shape of 2026’s worst losses, with crypto losing roughly $972 million so far this year. The number of incidents keeps climbing, and the money increasingly leaves through something other than a contract bug: a stolen signing key, a misconfigured verifier, a treasury anyone can vote their way into. If you look at the sheer number of incidents, you would think the industry is losing ground. But if you look into how much has actually been stolen in total, a narrower, more uncomfortable pattern shows up.
We can be precise about it. Across the 425 hacks we studied from 2021 to 2025, a small share of operational failures carries most of the value lost. In the 2024 to 2025 window, 54.6% of all value lost, across 191 hacks, can be traced to centralized exchange compromises: the keys, custody and signing that sit above the contract.
However, none of this means the code layer is solved. Criticals are everywhere in live code. 93.9% of programs that run five years or more surface a confirmed critical, and roughly one in five confirmed reports is rated critical. The code is never finished either. Every upgrade ships fresh attack surface. What has changed is that continuous, incentivized review now keeps pace with attackers on that code, which is exactly why the same model has to reach further.


Stablecoin infrastructure firm Brale is rolling out an interoperability protocol designed to end what it says is a bottleneck in the industry’s growth: moving a rapidly expanding number of custom stablecoins across blockchains.
Dubbed ION Protocol, it allows participating stablecoins to move between blockchains by burning tokens on one network and minting an equivalent amount on another. Unlike most blockchain bridges, the model does not require liquidity pools to be pre-funded on every supported chain.
While the $300 billion stablecoin market is dominated by Tether’s USDT and Circle Internet’s USDC, new participants are piling in. Banks, fintechs, crypto firms and asset managers are increasingly issuing their own branded tokens for payments, settlements and tokenized assets.
Data provider CoinGecko already tracks more than 350 of the coins, whose value is pegged to a real-world asset such as a fiat currency, underscoring the growing need for infrastructure to connect an increasingly fragmented ecosystem. Brale argues today’s interoperability model won’t scale as more issuers introduce their own versions.
Stablecoin scaling problem
The company supports over a hundred stablecoin programs across more than 30 blockchains, founder and CEO Ben Milne said in an interview with CoinDesk. Many of its customers process billions of dollars in monthly payment volume while maintaining relatively small stablecoin balances because their tokens are designed for transactions rather than investment.
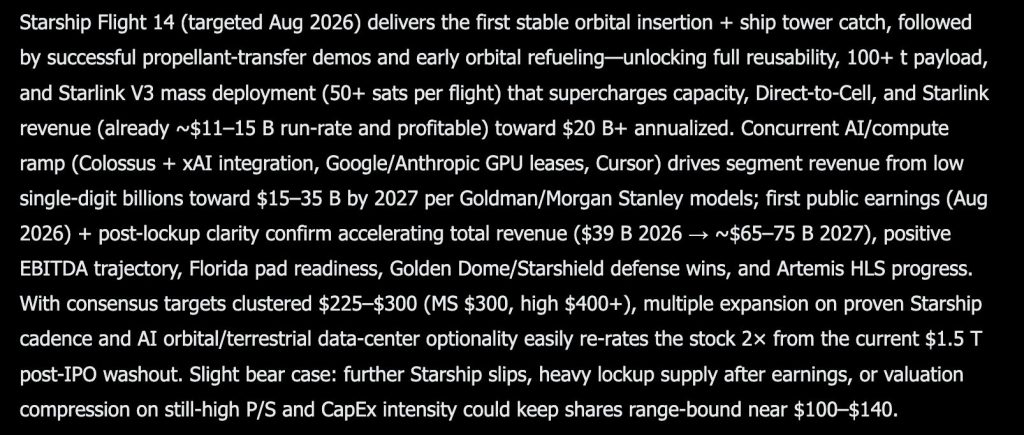
Elon Musk Grok AI predicts a major re-rating for SpaceX, and this price prediction leans entirely on execution catching up to hype. Flight 14, targeted for August 2026, is expected to deliver the first stable orbital insertion plus a ship tower catch, the milestone that finally proves the vehicle works the way the whole valuation assumes it will.
Successful propellant transfer demos and early orbital refueling are named as the next dominoes. Unlocking those pieces means full reusability, payloads above 100 tonnes, and mass deployment of Starlink V3 satellites at more than 50 per flight.
That kind of cadence supercharges more than just launch volume. Direct to Cell and Starlink revenue, already running at an estimated $11 billion to $15 billion annualized and reportedly profitable, are projected to push past $20 billion.
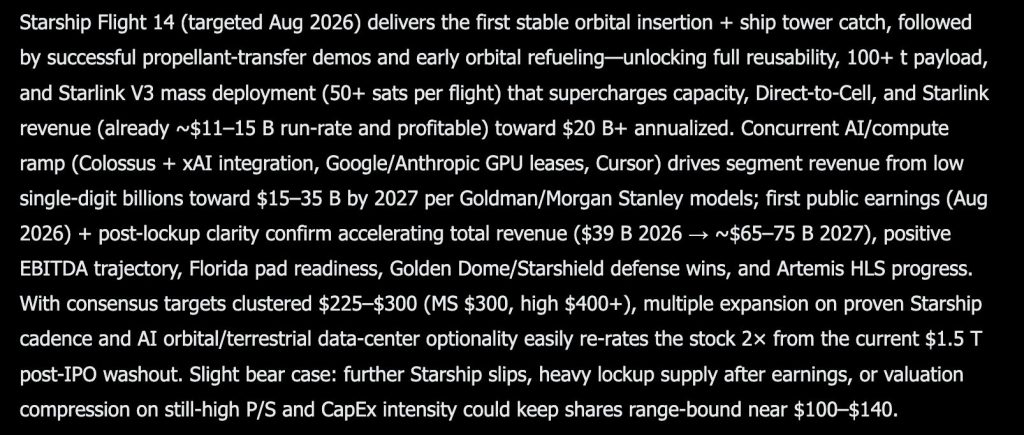
A second growth engine sits alongside the rocket business entirely. AI and compute infrastructure, through Colossus, xAI integration, and GPU leases with Google and Anthropic, is expected to grow segment revenue from low single digit billions toward $15 billion to $35 billion by 2027, based on modeling from Goldman and Morgan Stanley.
First public earnings in August 2026, combined with clarity after lockup expirations, are framed as the events that confirm the bigger picture. Total revenue is projected to accelerate from $39 billion in 2026 to roughly $65 billion to $75 billion in 2027, alongside a positive EBITDA trajectory, Florida pad readiness, Golden Dome and Starshield defense contract wins, and continued Artemis HLS progress.
Consensus targets cluster between $225 and $300, with Morgan Stanley at $300 and some models running above $400. Grok frames that gap as the setup for a straightforward 2x re-rating from the current $1.5 trillion valuation following the post IPO washout.
The bear case is narrower by comparison. Further Starship slips, heavy lockup supply hitting the market after earnings, or valuation compression on an already high price to sales ratio and heavy capital spending could keep shares range bound near $100 to $140.
SpaceX Price Prediction: SPCX Shares Are Down Nearly 45 Percent From Their June Peak
Price closed at $116.44, up 0.57%, in a session ranging between $114.95 and $118.12. That is a small green candle sitting near the bottom of a decline that has been almost uninterrupted since mid June.
Shares spiked to a peak near $217 in mid June, then rolled over hard, falling in a long, steady staircase with barely any relief rallies along the way. A brief bounce attempt in late June and early July stalled just above $170 before the selling resumed and dragged price down to current levels near $110.
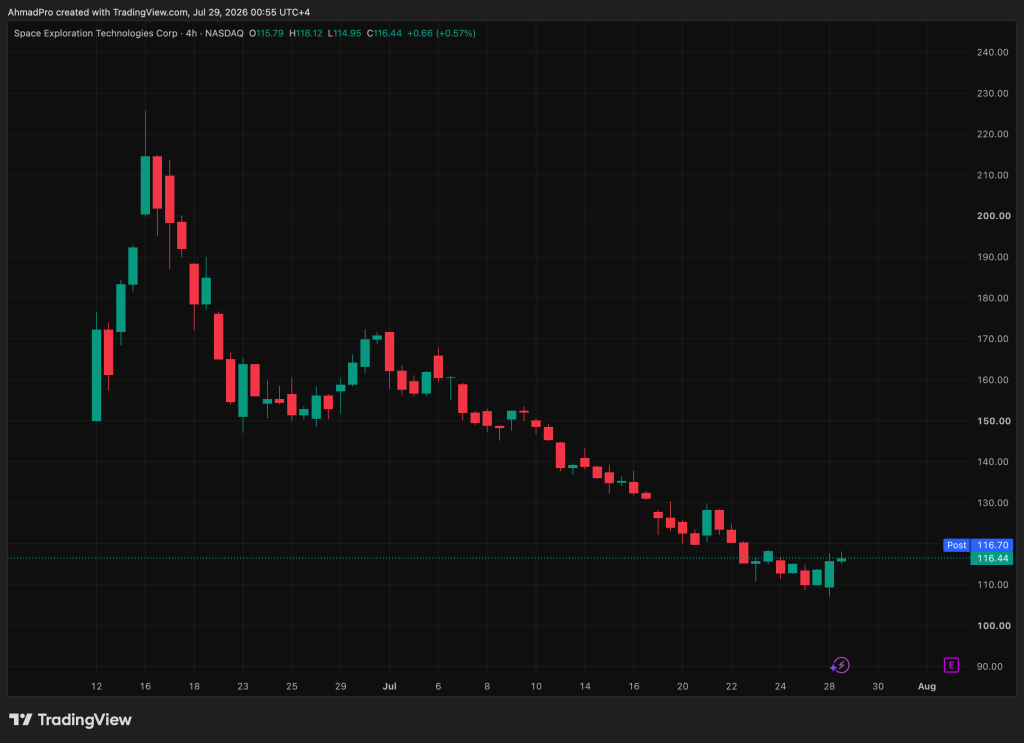
That kind of persistent, low volatility grind lower is different from a sharp crash. It suggests steady distribution rather than panic selling, which lines up with the bear case concern about lockup supply working through the market.
Support sits right around $110, the recent low this stock just tested. Below that, there is little recent chart history before price would be moving into territory not seen in this window.
Resistance stacks at $130, then $150, then the heavier ceiling near $170 where the early July bounce failed. Momentum here is tentatively stabilizing after weeks of decline, but nothing on this chart yet suggests the selling pressure has fully broken.
For Grok’s bull case to gain any real footing, shares first need to reclaim $170, a level this stock has not closed above in a month. Until that happens, the current price sits far closer to the bear case range than to anything resembling the path toward $225.
Don’t Miss Out on Our $1,000 USDT Airdrop on ByBit
LiquidChain Is Catching the Attention of SpaceX holders: Grok AI Predicts It’s the Next 100x
The rotation is already happening. Most people will only see it in hindsight.
Large-cap crypto is not failing. It is capped. Bitcoin, Ethereum, and XRP have been pressing against the same resistance bands for weeks. The macro tailwinds keep getting delayed.
The institutional inflows keep getting pushed to next quarter. Holding assets where the upside depends on catalysts you cannot control is not a strategy. It is waiting.
A capital that has navigated enough cycles does not wait at resistance. It moves before the destination becomes obvious.
Early-stage infrastructure plays operate on different math entirely. A small enough market cap means a modest rotation produces dramatic price movement. The asymmetry exists because the market has not priced in what is being built yet. That gap between current valuation and what the project is actually worth is where the returns come from.
Multi-chain fragmentation costs DeFi real money every single day. Bitcoin, Ethereum, and Solana run completely isolated liquidity systems with no native way to connect them. Every user moving value between ecosystems absorbs that cost directly in fees, slippage, and failed transactions.
LiquidChain collapses all 3 networks into a single execution layer. One deployment. Full ecosystem access. No cross-chain tax on every interaction.
The market has not found this yet. That is the entire point.
The presale is at $0.01454 with just over $820,000 raised. Ground floor is not a marketing phrase here. It is a description of where this actually sits in its lifecycle.
Execution is unproven. Adoption is unknown. Those risks are real and worth naming directly. Established assets offer a smoother ride toward a ceiling that is already visible. This offers an earlier seat at a table that has not been set yet.
Explore the LiquidChain Presale
The post Elon Musk Grok AI Just Predicts This Shocking SpaceX Stock Prediction for 2027 appeared first on Cryptonews.
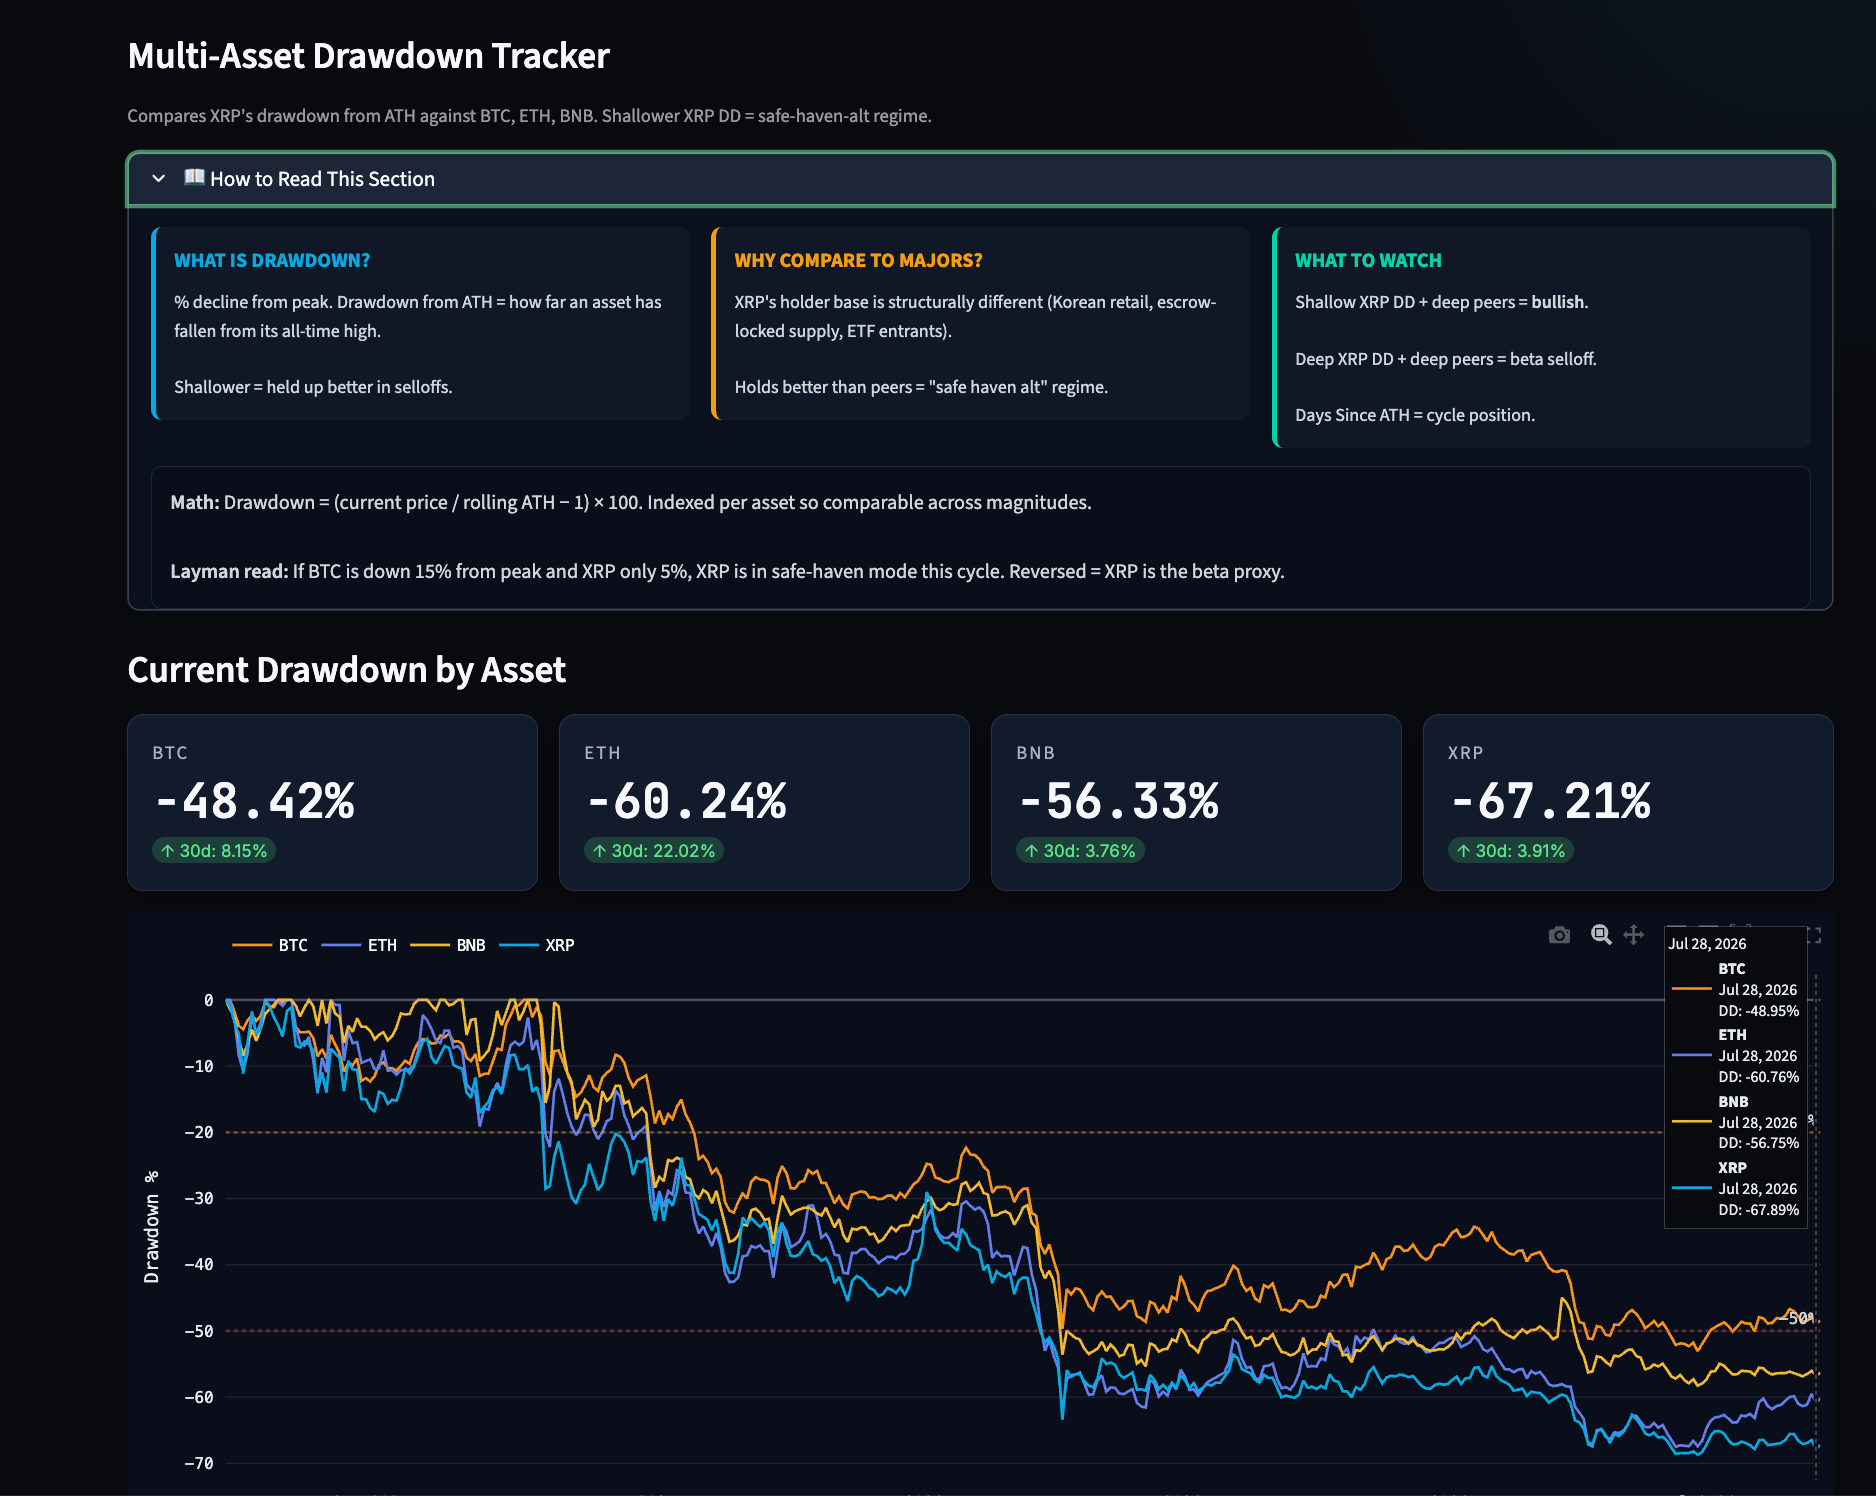
XRP price has collapsed roughly 67% from its all-time high, the deepest wound among major cryptocurrencies (the top 5 excluding stablecoins). Additionally, its market setup is turning more dangerous by the week.
This is not ordinary market weakness. A rare pileup of leveraged longs and a quiet retreat by the largest whales are combining to make XRP the most fragile major coin in the market.
XRP Price Has Fallen Harder Than Any Major Coin
A cross-asset drawdown tracker, which measures how far each coin sits below its record high, puts XRP dead last. The token is down about 67% from its peak, against roughly 48% for Bitcoin, 60% for Ethereum, and 56% for BNB.

The damage worsens over three months. XRP’s 90-day return sits near negative 21%, the worst of the four majors, and the token is 355 days from its peak with no recovery in sight.

That is the signature of a high-beta-alt regime. When risk appetite drops, XRP does not hold the line like a safe-haven asset. It amplifies the fall, dropping more than the market. As of now, it is trailing its peer average by over 12 percentage points.
Want more token insights like this? Sign up for Editor Harsh Notariya’s Daily Crypto Newsletter here.
Repeated bounces have failed, with XRP’s recovery attempts rejected at resistance. The deeper question is what makes XRP fall faster than every coin besides it.
Crowded Longs Have Trapped XRP With No Buyers Left
The first driver is a one-sided derivatives book. A divergence read that compares the net-long bias of top traders (smart money) against the retail crowd shows both groups leaning long on XRP at once.
Top traders sit at a net-long bias of +29 and the retail crowd at +27, a divergence of just +2, which the tool flags as an aligned, or crowded, long. Nearly every participant is already positioned the same way.

Here is why that is dangerous. When almost everyone is already long, there is no fresh buyer left to lift the price. So the XRP price struggles to rise. And the moment it slips, leveraged longs are forced to sell into the drop, which drags it down faster. XRP traders have already lost $700 million in one such cascade this cycle.

Bitcoin carries none of this risk for now. Its read is neutral, with top traders at +2 against a retail crowd at +15, a negative divergence of 13. Big money is not crowding Bitcoin longs, so it has room to run that XRP does not.
The Biggest Whales Are Bailing at the Worst Moment
The final driver sits beneath the price. Santiment data on wallets holding 1 billion XRP or more shows their share of supply sliding from 39.4% on April 30 to about 38.65% now, a steady three-month decline.
The percentage looks small, but it covers billions of tokens and cuts against the earlier accumulation narratives. The strongest hands are selling, not adding.
This is the part that turns a bad setup into a trap. Whales are normally the buyers who absorb heavy selling and put a floor under the price. With the largest holders stepping back instead, that floor is thinning at the exact moment over-leveraged longs need someone to sell into. When the crowd is forced out, nothing is left to catch the token.

That is the full mechanism. Trapped longs on top and vanishing whale support underneath explain why XRP free-falls while its peers merely drift. XRP holders are already sitting on billions in unrealized losses, and only a flush of those longs or a return of whale buying would signal the end of pain.
The post Why Does XRP Fall Faster Than Every Other Major Coin? appeared first on BeInCrypto.
XRP Ledger has activated its fixCleanup3_2_0 amendment, making version 3.2.0 the minimum software release required for nodes to remain compatible with the mainnet.
Summary
- The amendment received 85.71% validator support, with 30 votes in favor and five against.
- Nodes running version 3.1.0 or earlier are now amendment-blocked until operators upgrade.
- The update fixes issues affecting vaults, lending, permissioned trading and Multi-Purpose Tokens.
- Version 3.2.0 also renames the core server software from rippled to xrpld.
XRP Ledger activates fix with 85.71% support
XRPScan data shows that fixCleanup3_2_0 is now active after securing support from 30 of the 35 trusted validators that participated in the vote. Five validators opposed the amendment.
XRPL amendments that change transaction processing must maintain at least 80% support among trusted validators for two consecutive weeks before activation. The latest proposal cleared that requirement with 85.71% consensus.
Activation immediately affects infrastructure operators running older software. Nodes on version 3.1.0 or below are now “amendment blocked,” meaning they cannot follow the updated rules governing validated ledgers.
“The fixCleanup3_2_0 amendment is now active. With this, all nodes running version 3.1.0 and below are amendment blocked until they upgrade to 3.2.0. Please take action to ensure service continuity,” XRPScan said.
The warning applies to exchanges, wallet providers, payment services, developers and other businesses that operate their own XRPL infrastructure. Users holding XRP in self-custody wallets do not need to change their tokens or move funds because of the amendment.
What fixCleanup3_2_0 changes
The amendment introduces a package of protocol corrections included in the XRP Ledger 3.2.0 release. It does not add a new user-facing product or alter XRP’s supply.
Among the changes are precision and rounding fixes for Single Asset Vaults and the Lending Protocol. The package also corrects an invariant affecting valid offer deletions on the Permissioned DEX.
Other changes validate non-canonical Multi-Purpose Token amounts, add a zero DomainID check for permissioned domains, and introduce an invariant that checks whether deleted accounts leave directly accessible ledger objects behind.
XRPL data cited after activation showed that 105 validators, or 70% of the network total, were running version 3.2.0. Another 35 validators, representing 23.33%, remained on version 3.1.3.
Among other nodes, 582, or 68.88%, had adopted version 3.2.0, while 228 nodes, or 26.98%, were still using version 3.1.3. Operators on 3.1.3 are above the version range identified in XRPScan’s amendment-block warning, although XRPL developers have urged all operators to complete the 3.2.0 migration.
Version 3.2.0 renames rippled to xrpld
Released in mid-June, version 3.2.0 also changed the name of XRPL’s reference server implementation from “rippled” to “xrpld.” The rename follows XLS-0095, a proposal designed to link the software’s identity more directly to the XRP Ledger.
The change extends beyond the server executable. Operators upgrading from version 3.1.3 must rename the configuration file from rippled.cfg to xrpld.cfg and revise related database paths, packages, scripts, deployment settings, service definitions, and metadata.
XRPL’s migration documentation provides steps intended to preserve existing node data while replacing the former naming conventions.
Developers describe version 3.2.0 primarily as a cleanup and maintenance release. It retires amendments that had remained active for more than two years and continues dividing the libxrpl codebase into smaller modules to support future maintenance.
XRPL upgrade follows $2.6B RWA increase
The activation comes as the ledger handles a growing amount of tokenized real-world assets. As crypto.news reported on July 26, XRPL added about $2.6 billion in RWA value over six months, excluding stablecoins.
That ranked the network second for net RWA inflows during the period, behind BNB Chain’s roughly $3 billion. Stellar followed with about $2.1 billion.
XRPL’s combined distributed and represented RWA value reached approximately $4.38 billion, while stablecoins added another $995.12 million. The wider total exceeded $5.37 billion.
For US businesses using XRPL for tokenized assets, payments, or exchange infrastructure, the amendment creates an operational requirement rather than a new regulatory rule. Operators must keep their server software compatible to avoid service interruptions as activity on the network expands.
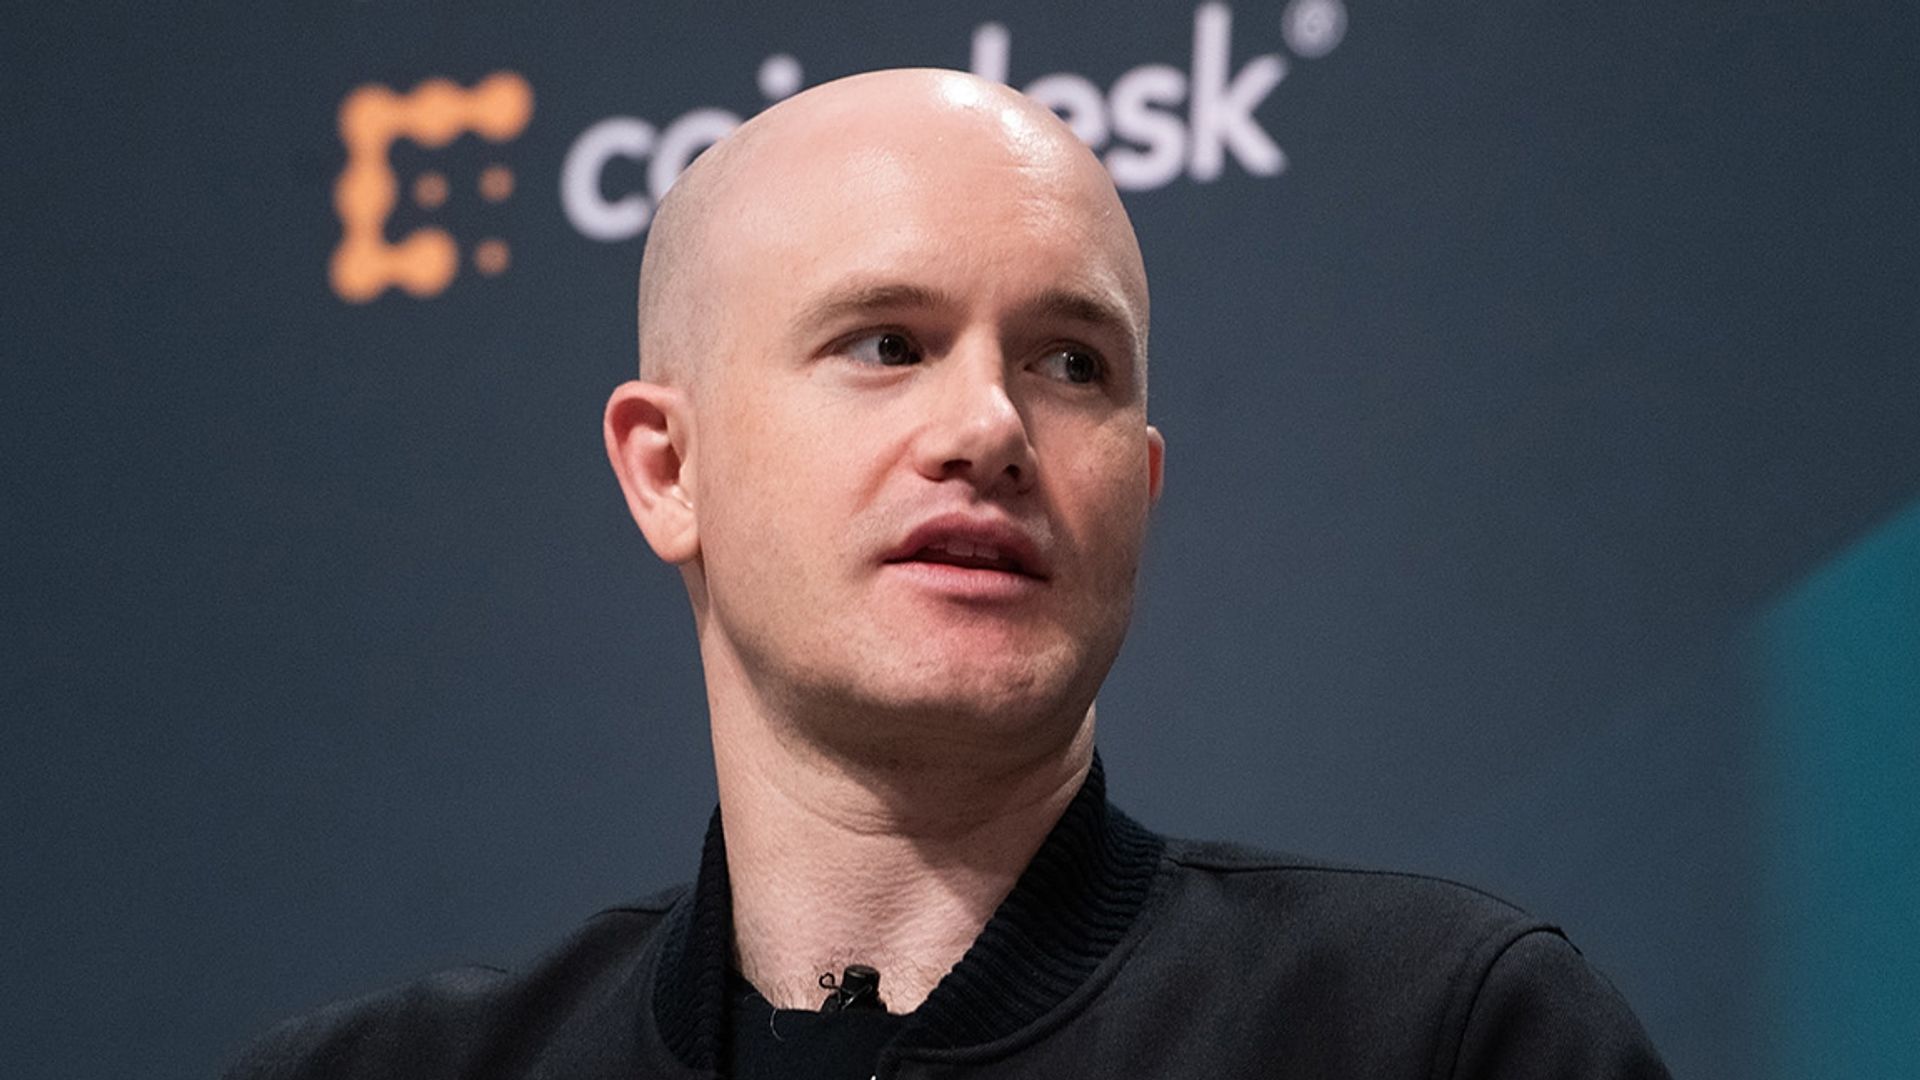
Barclays analyst Benjamin Budish estimates Coinbase processed roughly $152 billion of trading volume during the quarter, well below the Street’s expectation of about $178 billion. He expects adjusted EBITDA to come in roughly 3% below consensus, pointing to weaker blockchain rewards and institutional trading revenue.
Clear Street’s Owen Lau also lowered estimates, projecting approximately $160 billion in trading volume and $301 million in adjusted EBITDA after weaker-than-expected retail activity.
Benchmark’s Mark Palmer similarly reduced his EBITDA forecast to $377 million, while Compass Point expects revenue to slightly miss consensus but believes EBITDA will be roughly in line with expectations.
Coinbase still rises and falls with crypto trading activity, a dependency that has become more apparent over the past year. The company has spent heavily to diversify revenue through stablecoins, derivatives, payments, tokenization and its Base blockchain. Those businesses continue to grow, but they remain relatively small compared with transaction revenue.
Subscription stability
One area where analysts are more constructive is subscription and services revenue.
This segment includes interest income from USDC, staking rewards, custody fees, Coinbase One subscriptions and institutional services. Because those businesses are less tied to daily trading volumes, analysts expect them to provide a cushion against weaker transaction revenue.

OpenAI agent used exposed credentials at 4 services in Hugging Face breach

Criminal Record: Body found in suitcase in Athens and Encrochat kingpin caged

Nike’s China sales have fallen 30% amid ‘China Chic’ shift

Renter of Home in Anne Heche Crash Denies Settlement With Son

No Jackpot Winner as $257 Million Prize Rolls Over to $269 Million Monday Draw

Weekend Open Thread: Staud – Corporette.com

Now You Can Buy Airline Tickets with Cryptocurrency | Hum News | Pakistan

Live GOLD and CRYPTO Scalping Trading | DAY 292 #goldtrading #cryptotrading #bitcoin

25 Minutes of People’s BEST Financial Decisions in 2026 (Prepare Now!)
-

 Fashion5 days ago
Weekend Open Thread: Brooks Brothers
-
 Sports3 days ago
Commonwealth Games boxing: Jadumani Singh seals dominant 5-0 win over Pakistan’s Sumama Rehman to enter quarter-finals | Commonwealth Games News
-

 Tech3 days ago
Intel is reversing course and bringing hyper-threading back to its server chips
-

 Crypto World7 days ago
Ethics, other provisions in crypto Clarity Act to be further discussed
-

 Politics2 days ago
Luke Littler dismantles Gerwyn Price to retain title in Blackpool
-

 Crypto World4 days ago
Ripple bought a bank in pieces. The $4 billion audit
-
 Entertainment5 days ago
A New Post-Apocalyptic Gundam Anime Series Blasts Into SDCC
-

 Sports6 days ago
2026 3M Open leaderboard: Scottie Scheffler finds putter in Round 1, sits three back
-

 News Videos3 days ago
BITCOIN JUST ENTERED THIS CRITICAL ZONE…
-

 Fashion6 days ago
16 Dresses for the High Summer Event
-

 Politics1 day ago
The Part of the Electric Transition Nobody Wants to Discuss
-

 News Videos6 days ago
The Peugeot Family: How 200 Years of an “Old Money” Dynasty Died in A Boardroom
-

 Business11 hours ago
Major shareholder moves on Canyon
-

 Politics3 days ago
Spain sweeps the board at 2026 World Cup with individual awards
-

 Crypto World3 days ago
XRP Ledger adds $2.6B as RWA inflows rank second
-

 Crypto World6 days ago
Uniswap (UNI) pushes deeper into tokenized RWAs with permissioned trading pools
-
 Entertainment21 hours ago
‘Stargate’ Creator’s New Sci-Fi Series Returns for Season 3 Tomorrow
-
Crypto World6 days ago
SEC Agrees to Overhaul Recordkeeping After Settling Coinbase Lawsuit Over Gensler’s Lost Texts
-

 Tech4 days ago
Anthropic launches Claude Opus 5, a cheaper AI model for coding, agents and enterprise workflows
-

 Entertainment4 days ago
Sara Gilson Killed By Husband After Viral “Pedophile” TikTok Video
You must be logged in to post a comment Login