When I think about TCW Flexible Income ETF (FLXR) I think about an income-oriented fund that can concretely stimulate the expected return function of the bond component of a portfolio without excessively raising the risk function.
And it does so with a portfolio that for almost 50% cannot be covered by classic bond ETFs. This makes it interesting, but from a certain point of view, also difficult to interpret.
Intro and Definition
The fund is domiciled in the TCW ETF Trust and is an active multi-sector fixed income ETF classified as Multisector Bond born in 2018 as a mutual fund, then converted into an ETF and listed on the NYSE on June 24, 2024 with today an AUM exceeding $3.2 billion. It moves with a primary objective of obtaining a high level of current income and as a secondary objective, long-term capital appreciation. To calibrate on results, the declared benchmark is the classic Bloomberg U.S. Aggregate Bond Index; this is used as a reference for comparative metrics, but the fund systematically invests outside the index universe.
Advertisement
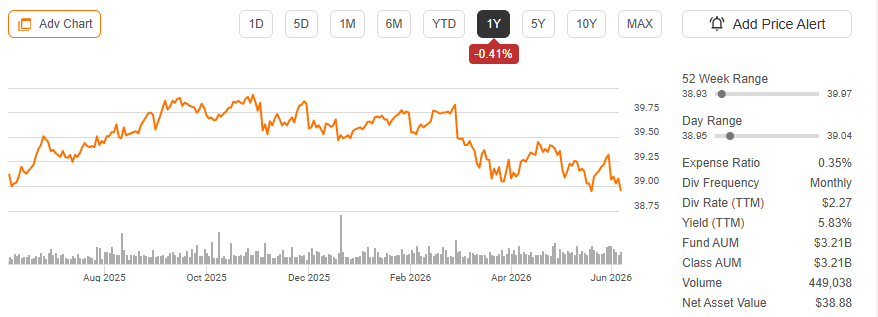
FLXR – fund profile (Seeking Alpha)
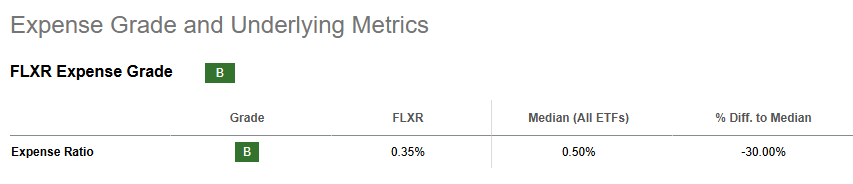
The expense ratio is not negligible for a bond ETF: it is 0.40%, decisively higher than fully passive aggregate solutions, to which a 0.05% average bid-ask spread is added. To put it in perspective, compared to BND there are overall 37 bps of cost spread; that is not nothing.
FLXR – expense grade (Seeking Alpha)
Not by chance does it have a 30-Day SEC Yield of 5.63% and a yield-to-worst of 6.75% distributed monthly, with a risk profile that, however, structurally leans toward IG/securitized. Of course, the yield will change relative to various interest rate environments in the future.
Advertisement
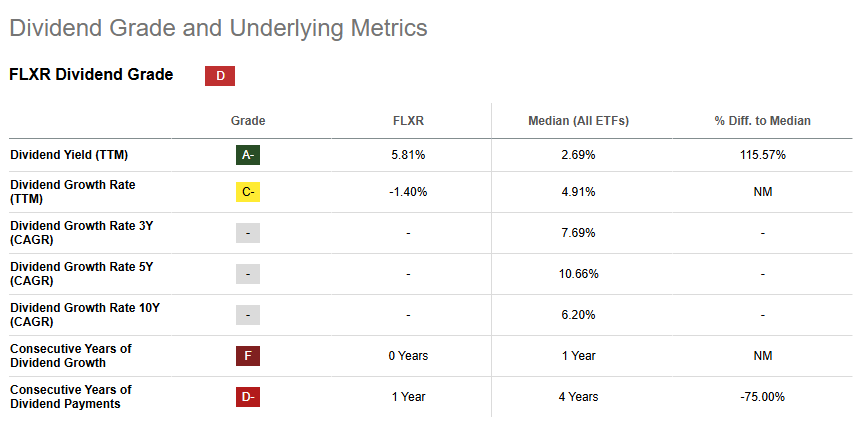
The fund qualifies as a Regulated Investment Company (RIC) under U.S. regulations, avoiding taxation at the corporate level on the condition of timely distributing income. For this reason, distributions are taxed as ordinary income or long-term capital gains.
FLXR – dividend grade (Seeking Alpha)
How Is FLXR Built?
It has 1,624 securities as of March 31, 2026 with a turnover of 295%. No single position exceeds 1% of the portfolio, with the exception of some positions in MBS and Treasuries that by structural nature can be more concentrated. The granularity of the portfolio is extreme: with 1,624 lines, the idiosyncratic risk on a single issuer is almost zeroed out. The implication is that drawdowns do not derive from credit events on individual issuers but from systemic spread or rate movements across entire segments.
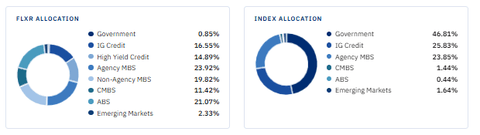
FLXR – allocation vs benchmark (Author)
Advertisement
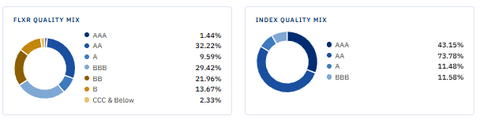
The table reveals the true architecture of the portfolio: FLXR is fundamentally a securitized + credit fund with almost zero government exposure (0.85% vs. 46.81% of the index). Specifically, the underweight on Government bonds of almost 46% is the most radical structural choice of the fund and explains why its behavior is structurally different from any traditional bond ETF. At the rating level, there is a tilt toward AA and BBB (or lower, especially BB and B).
FLXR quality mix vs benchmark (Author)
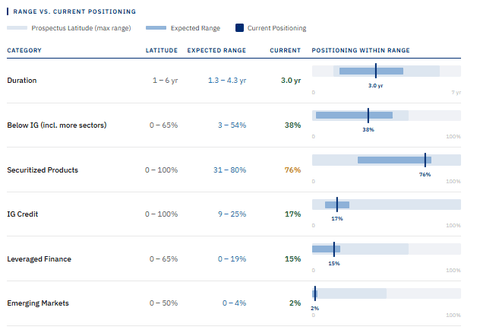
The result? An Effective Duration of 3.03 years, an Average Maturity of 6.19 years, and a negative convexity of 0.38. At least these are the figures that emerged from my reworking of the shared data.
FLXR metrics (Author)
Advertisement
What Does FLXR Do?
Its shorter duration (3.03 years) results in lower sensitivity to rate movements compared to the benchmark. At the same time, it must be said that the negative convexity (-0.38) is not usual for aggregate bond portfolios, which pairs well with a core portfolio of positive convexity on the traditional aggregate bond segment. So it interfaces well in a diversified portfolio while still operating in the American bond market, but with a clear deliberate preference for those segments that large passive indices ignore. Not by chance, FLXR invests over 48% in hard-to-access segments, such as non-government-guaranteed securitized mortgages (Non-Agency MBS), asset-backed securities like residential rentals and data centers (ABS), securitized commercial real estate (CMBS), high-yield corporate bonds, emerging markets.
The management team works on two simultaneous levels: how much rate risk to take on, which bond sectors offer the best risk-adjusted return at any given moment, and how much to hold of riskier bonds versus safer ones.
At the operational level, it selects individual securities, enters positions gradually.
How? The approach is explicitly opportunistic and counter-cyclical: the team tends to increase exposure to riskier segments precisely when the market is selling them.
Advertisement
Who Is FLXR For?
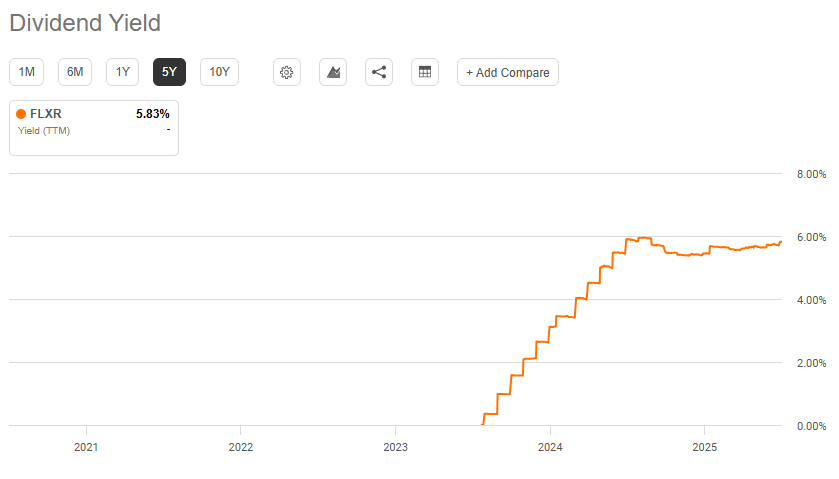
This process produces a quite respectable monthly dividend in the speculative bond landscape. The current annualized yield (30-day SEC Yield) is 5.63%, with a Yield-to-Worst of 6.75%.
FLXR – yield (Seeking Alpha)
For comparison, pure investment-grade bond funds yield today around 4-4.6%, while pure high-yield funds reach 6.5-7% but with almost double the volatility compared to FLXR. And it is therefore clear that it presents itself as a fund targeting the investor looking for a distributed income stream.
But be careful; it is not a pure defensive instrument. Rather, it’s an instrument that would almost seem to adapt as a bond satellite in a diversified portfolio, with the specific function of generating high and stable monthly income with a deliberately contained sensitivity to interest rates (duration 3 years, almost half of the broad bond market). To take stock of the situation, FLXR seems built for an investor who wants a high and steady monthly income, is willing to accept an underlying complexity that cannot be directly controlled, and has an investment horizon of at least 2-3 years that allows them to navigate any phases of volatility without having to liquidate the position at the worst moments.
Advertisement
Peer Comparison
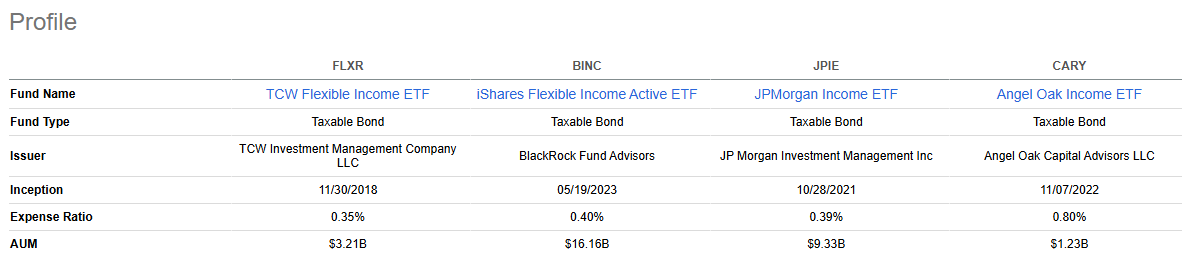
We are therefore in the macro-category of supplementary funds for a core component, and there are some managers that are standing out quite a bit. Personally, I would include the active managers of the iShares Flexible Income Active ETF (BINC), the JPMorgan Income ETF (JPIE), and the Angel Oak Income ETF (CARY).
FLXR – peer comparison (Seeking Alpha)
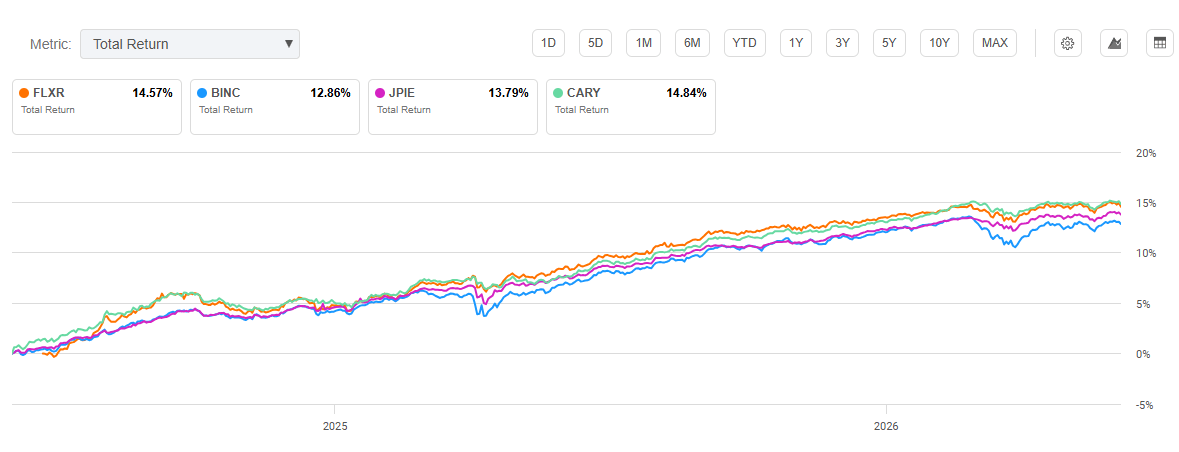
BINC is exposed to similar segments, both active multi-sector with exposures to MBS, ABS, CMBS, and HY. Then it must be said that BINC has different weights in sectoral allocations, with less emphasis on the Non-Agency MBS segment. JPIE instead is another active manager that tries to cover, albeit partially and more tilted toward quality ratings, the segment of FLXR. And I would put CARY on the same level. It is curious to note how since launch, FLXR has been able to maintain a competitive total return, albeit with spreads not so marked compared to peers.
Peer: total return (Seeking Alpha)
Advertisement
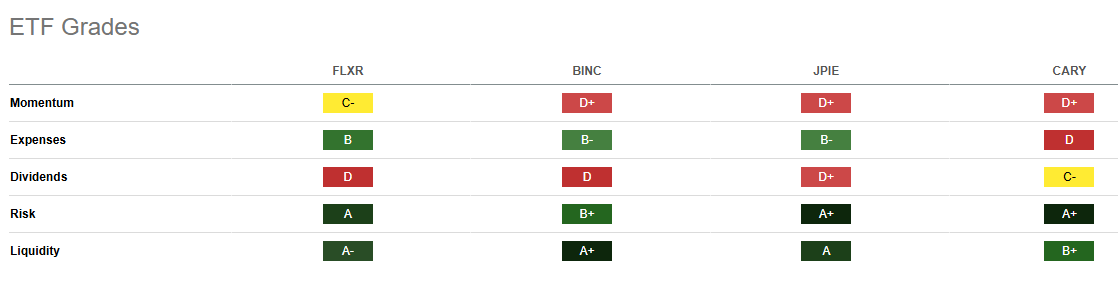
For a more specific comparison, it can make sense here to take a look at the ETF grades from Seeking Alpha, which, in my opinion, clearly show the differences between the ETFs. In this sense, FLXR has greater momentum, which clearly plays in favor of the active management and “market timing” we have seen. And working on “discounts” leads to lower returns (distributions), especially in a rising rate environment. Even though the spread between yields is not so marked, FLXR has a TTM yield of 5.83% per SA, while the competitor with the highest yield is CARY with 5.94%. We are talking about a few basis points.
ETF grades (Seeking Alpha)
Risks
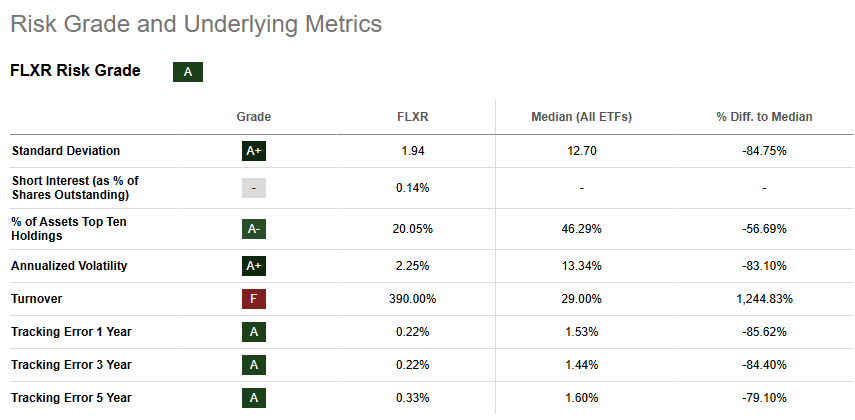
About 37.96% of the portfolio is sub-investment grade (BB 21.96% + B 13.67% + CCC 2.33%). Credit risk is therefore not marginal: in a recession scenario with widening HY spreads, this component will suffer losses that may not be offset by the stability of Agency MBS. It must be said, though, that the Non-Agency MBS component (19.82%), CMBS (11.42%), and non-traditional ABS include assets with limited secondary liquidity. In systemic stress environments, the liquidity of these instruments dries up quickly. And the full recession test has not yet occurred during the ETF’s life as an ETF. So it is not easy to define a concrete risk dimension, even though for SA the risk grade remains A with an annualized volatility of just 2.25%.
FLXR – risk grade (Seeking Alpha)
Advertisement
Pros and Cons
There are therefore clearly positive elements that cannot be ignored:
Yield at the competitive risk/return meeting point of the bond market: From what the data seems to show, it captures a good portion of HY yield without concentrating all the risk on sub-IG bonds
Genuine diversification across 8 bond macro-categories: 1,624 holdings, no position >1% (except some MBS/Treasuries), 8 sectors simultaneously represented
Structural access to the “invisible 48%” of the U.S. bond market: The Bloomberg Agg covers 52% of the market; FLXR systematically invests in the other 48% (non-traditional ABS, Non-Agency MBS, CMBS SASB, CLO)
Short duration protects in high or rising rate environments, little price oscillation, and monthly distributed and competitive yields.
Naturally, there are also negative elements that we cannot brush past lightly:
ETF track record too short to validate the strategy in extreme scenarios
To this is added a liquidity risk in illiquid securitized assets, an underestimated tail risk
Then it is quite expensive: Expense ratio 0.40% + a portfolio turnover of 295% means implicit transaction costs (bid-ask spread on illiquid bonds, market impact) are not captured in the expense ratio and not quantified in any official material
This article answers three questions about FLXR:
How does FLXR select its securities?
What impacts FLXR’s performance?
Where can FLXR fit in a portfolio?
Editor’s note: This article is intended to provide a general overview of the ETF for educational purposes only and, unlike other articles on Seeking Alpha, does not offer an investment opinion about the ETF.
Cbiz shareholders will receive $55 per share, a 17.8% premium to the stock’s previous close. The shares rose 17.5% in premarket trade after the announcement.
The deal will make Grant Thornton the fifth-largest provider of professional, tax and advisory services in the US, behind Deloitte, EY, KPMG and PwC. The combined platform will have a presence in more than 20 countries and territories and generate nearly $7.5 billion in revenue.
“By combining our multinational platform with CBIZ’s strong market presence, we’re broadening our ability to support businesses through every stage of growth — from early development to global scale,” Grant Thornton Advisors CEO Jim Peko said.
Advertisement
The transaction is expected to close in the fourth quarter of 2026. It includes a “go-shop” period that allows CBIZ to seek competing offers until August 27.
The acquisition announcement came alongside CBIZ’s second-quarter results, which showed a clear earnings beat but weaker-than-expected revenue.
For the quarter ended June 30, 2026, CBIZ reported adjusted diluted earnings per share of $0.91, above analysts’ estimate of $0.8046. Revenue came in at $682.2 million, about 3.2% below the $704.9 million expected by analysts.
Revenue was down 0.2% from a year earlier, hurt by a similar decline in the company’s core financial services business. Adjusted EBITDA fell 14.3% year-on-year to $103.1 million. Adjusted EBITDA margin narrowed to 15.1% from 17.6%.
Advertisement
On a GAAP basis, net income dropped 55.6% to $18.6 million, or $0.31 per diluted share. The decline reflected higher operating expenses and acquisition-related costs tied to the integration of Marcum, which CBIZ bought in 2024.
The CBIZ deal is another sign of consolidation in the US accounting industry, where mid-tier firms are trying to build scale and narrow the gap with the Big Four.
Baker Tilly and Moss Adams combined last year in a $7 billion deal. CBIZ had also expanded through acquisitions, including its $2.3 billion purchase of accounting firm Marcum in 2024.
Grant Thornton has been expanding since receiving investment from a consortium led by New Mountain Capital in 2024. New Mountain is making a fresh investment to support the CBIZ transaction, which the companies said is the largest deal of its kind in more than 25 years.
Bitcoin traded at $63,860.26 as of Wednesday afternoon, up a modest $13.14, or roughly 0.02%, as cryptocurrency markets settled into a holding pattern ahead of a Federal Reserve interest rate decision that traders across both traditional and digital asset markets have described as unusually difficult to predict.
Bitcoin opened Wednesday at $63,853.49, up 0.2% from Tuesday’s opening price, before climbing as high as $64,244.18 during the morning session, according to pricing data. The cryptocurrency’s relatively flat overall movement Wednesday followed a volatile stretch earlier in the week, including a sharp pullback Tuesday when bitcoin opened 2.5% lower than the previous day, dropping to around $63,327 as investors broadly reduced exposure to riskier assets ahead of the Fed’s two-day policy meeting.
The Federal Reserve’s rate decision, due later Wednesday, has emerged as the dominant catalyst shaping crypto market sentiment this week. According to data from the CME Group’s FedWatch tool, market participants assigned a 35.8% probability to a rate increase following the meeting’s conclusion, up sharply from 25.7% just a week earlier. Separate estimates cited by CoinDesk showed a somewhat different split, with roughly a 70% probability assigned to rates remaining unchanged and a 30% chance of a surprise quarter-point increase. Some analysts have characterized the meeting as among the hardest Fed decisions to forecast in recent years, given the unusual combination of economic signals policymakers are currently weighing.
Ether, the second-largest cryptocurrency by market value, moved somewhat more sharply than bitcoin during the same period. Ethereum opened Wednesday at $1,919.73, up 1.5% from Tuesday’s opening price, before slipping back to $1,904.82 by mid-morning, according to pricing data. Bitcoin and ether moved in opposite directions for stretches of Wednesday’s session, a divergence that market watchers attributed to renewed airstrikes in the Middle East combined with the approaching Fed announcement, both of which have added competing sources of uncertainty for crypto investors this week.
Advertisement
Broader cryptocurrency market data showed modest overall improvement heading into Wednesday. The total global cryptocurrency market capitalization rose 0.4% to reach approximately $2.28 trillion, recovering from a 1.6% decline recorded the previous day, according to data from CoinMarketCap. Bitcoin’s dominance within the broader crypto market held steady at approximately 56.3%, while ether accounted for roughly 10.2% of total market value. Despite the modest recovery in headline prices, a widely tracked measure of investor sentiment, the Fear and Greed Index, remained in “fear” territory at a reading of 28 to 29, reflecting continued caution among traders even as prices stabilized somewhat.
Institutional flows into bitcoin exchange-traded funds showed signs of softening in recent sessions. Spot bitcoin ETFs recorded a net outflow of $11.6 million on July 27, ending a streak of seven consecutive sessions of net inflows, with asset managers BlackRock and Fidelity leading the pullback, according to data on ETF flows. Even so, some corporate treasury activity continued during the same window, with Hyperscale Data disclosing a bitcoin treasury holding of 1,106 bitcoin, valued at approximately $71.7 million, as of July 28, signaling that at least some institutional accumulation of the cryptocurrency has continued despite broader market softness.
Macroeconomic factors beyond the Fed decision have also weighed on crypto sentiment this week. Rising oil prices, driven by renewed hostilities between the United States and Iran, have added to broader inflation concerns across financial markets, a dynamic that traditionally creates headwinds for risk assets including cryptocurrencies. At the same time, a strengthening U.S. dollar has added further pressure, with analysts noting that the combination of higher oil prices and dollar strength has increased overall macro-volatility risk heading into the Fed’s announcement.
Trading data suggested bitcoin has largely oscillated within a defined range in recent sessions, generally trading between roughly $62,700 and $65,500. Some market analysts have pointed to that range as a key technical zone to watch in the near term, with the lower boundary near $62,700 serving as a support level and the $64,500 to $65,500 zone acting as resistance that bitcoin has struggled to convincingly break through in recent trading.
Advertisement
Beyond bitcoin and ether, individual cryptocurrency tokens showed more significant divergence Wednesday. Jupiter, a decentralized finance token, rose nearly 6% to lead gains within a broader recovery among DeFi-focused tokens, while artificial intelligence-linked tokens continued to struggle, with Fetch.ai falling more than 4% on the day as AI-related crypto tokens continued unwinding gains posted the previous month.
Bitcoin’s current price level remains well below its all-time highs reached earlier in the cryptocurrency’s price cycle, though the asset has still posted substantial gains compared with prior years, with its market capitalization standing at approximately $1.27 trillion to $1.33 trillion depending on the specific pricing snapshot used, maintaining its position as by far the largest cryptocurrency by market value, well ahead of ether’s market capitalization of roughly $233 billion.
With the Federal Reserve’s decision expected to be announced later Wednesday, crypto traders and analysts broadly expect increased volatility to follow the announcement, regardless of whether the central bank opts to raise rates, hold steady, or signal a different policy path than markets currently anticipate, given how closely digital asset prices have tracked broader shifts in monetary policy expectations throughout the past several weeks of trading.
Amazon Web Services India Pvt Ltd has reported a more than 10-fold growth in consolidated net profit to Rs 242.8 crore in the financial year 2026, as per a document shared by market intelligence firm Tofler.
The cloud services arm of e-commerce giant Amazon had posted net profit of Rs 23.1 crore in FY25.
Its consolidated revenue from operations grew by about 21 per cent to Rs 20,225.6 crore in FY26 from Rs 16,744.9 crore in FY25.
AWS, however, reported a decline of around 14 per cent in standalone net profit to Rs 242.4 crore in FY26, compared to Rs 281.5 crore in FY25.
Advertisement
The company’s revenue from operations on a standalone basis grew by 21.4 per cent to Rs 20,225.6 crore during the period under review from Rs 16,659 crore in the year-ago period.
Live Events
“The company’s total expenses for the fiscal were reported at Rs 19,888 crore (on a standalone basis),” Tofler said.
The initial costs are expected to be recouped through ticket prices
07:49, 29 Jul 2026Updated 07:50, 29 Jul 2026
A British Airways plane taking off from Heathrow Airport(Image: Daniel Leal-Olivas/PA Wire)
Heathrow will be allowed to pass the enormous bill it has accumulated in preparing its third runway bid on to passengers, the aviation watchdog has confirmed, in a ruling that looks set to cement the airport’s status as the costliest in the world.
The Civil Aviation Authority (CAA) ruled that Heathrow Airport Limited (HAL) will be entitled to recoup the £320m it has already spent competing to secure the megaproject contract by increasing the fees attached to travellers’ air fares.
Advertisement
Rival bidder Heathrow West was also granted permission to recover the £4.2m it has so far spent on its own proposal.
The two operators have been competing fiercely to persuade ministers to back their respective third runway plans, assembling extensive planning documents and feasibility studies, while also enlisting the services of expensive third-party advisers to bolster their bids.
For incumbent HAL, that investment has already stretched into the hundreds of millions, the CAA noted, with the hub previously arguing it needs to cover its early outlay if the expansion is to remain financially attractive, reports City AM.
In its ruling, the aviation regulator said without the design and planning efforts both bidders have undertaken to develop credible expansion proposals, the timely delivery of the third runway project would have been put at risk.
Advertisement
It added that both parties would need to demonstrate their claims had been independently scrutinised line by line before being permitted to pass on the costs.
“Our decision strikes a balance between supporting the delivery of benefits to consumers through timely progress on Heathrow expansion, whilst also protecting them from undue increases in costs,” said Tim Johnson, the UK Civil Aviation Authority’s director of consumers and markets.
“The costs Heathrow can recover are capped, independently scrutinised and subject to efficiency reviews, helping ensure that passengers only pay for efficient costs that are justified.”
Under the compensation scheme, agreed following a consultation held last year, HAL will be permitted to add 10p to every passenger fare over the next 20 to 25 years. It will also be responsible for recouping Heathrow West’s more modest costs, should the rival bid led by hotel magnate Surinder Arora fail to succeed.
Advertisement
The CAA reached its decision alongside a wide-ranging review of Heathrow’s overarching regulatory framework, in which it will determine whether rival operators will be permitted to own and run key infrastructure within the airport.
Airlines operating at the hub have grown increasingly frustrated with the exorbitant charges they are forced to pass on to passengers, and – in lockstep with Arora – some have established a pressure group lobbying for a wholesale shake-up of red tape at the airport.
At £28.80, the airport’s charges are already the costliest in the world, and are anticipated to climb by as much as £50 once the full expenditure of the third runway is factored in.
Wednesday’s CAA ruling will see the airport charge per passenger rise by approximately 15 pence in 2028, climbing to 30 pence in subsequent years.
Advertisement
The initial costs incurred by bidders are expected to be recouped through ticket prices over a period of roughly 20 to 25 years.
Automatic Data Processing, Inc. (ADP) Q4 2026 Earnings Call July 29, 2026 8:30 AM EDT
Company Participants
Matthew Keating – Vice President of Investor Relations Maria Black – President, CEO & DIrector Peter Hadley – Chief Financial Officer
Advertisement
Conference Call Participants
Mark Marcon – Robert W. Baird & Co. Incorporated, Research Division Jason Kupferberg – Wells Fargo Securities, LLC, Research Division Samad Samana – Jefferies LLC, Research Division Bryan Keane – Citigroup Inc., Research Division Tien-Tsin Huang – JPMorgan Chase & Co, Research Division Dan Dolev – Mizuho Securities USA LLC, Research Division Daniel Jester – BMO Capital Markets Equity Research
Presentation
Advertisement
Operator
Good morning. My name is Michelle, and I’ll be your conference operator. At this time, I would like to welcome everyone to ADP’s Fourth Quarter Fiscal 2026 Earnings Call. I would like to inform you that this conference is being recorded. [Operator Instructions] I will now turn the conference over to Matt Keating, Vice President, Investor Relations. Please go ahead.
Matthew Keating Vice President of Investor Relations
Advertisement
Thank you, Michelle, and welcome, everyone, to ADP’s, Fourth Quarter Fiscal 2026 Earnings Call. Participating today are Maria Black, our President and CEO; and Peter Hadley, our CFO. Earlier this morning, we released our results for the quarter. Our earnings materials are available on the SEC’s website and our Investor Relations website at investors.adp.com, where you will also find the investor presentation that accompanies today’s call.
During our call, we will reference non-GAAP financial measures, which we believe to be useful to investors and that exclude the impact of certain items. A description of these items, along with a reconciliation of non-GAAP measures to their most comparable GAAP measures can be found in our earnings release. Today’s call will also contain forward-looking statements that refer to future events and involve some risk. We encourage you to review our filings with the SEC
New industry figures show the UK’s warehouse market has expanded by 61% since 2015, reflecting changing supply chains, ecommerce growth and businesses carrying larger inventories.
If you wanted to understand how British businesses have changed over the past decade, you could do worse than look inside their warehouses.
The days of keeping stock levels to an absolute minimum are fading. Businesses that once relied on perfectly timed deliveries are increasingly choosing resilience over efficiency, carrying more inventory, diversifying suppliers and rethinking how quickly they can get products into customers’ hands.
For Britain’s SMEs, it’s a shift that is changing everything from cash flow to expansion plans.
Advertisement
Why are businesses holding more stock?
Not long ago, “just-in-time” inventory management was seen as the gold standard. The less stock sitting on shelves, the better.
Then came a succession of shocks. The pandemic exposed just how fragile global supply chains could be. Shipping delays became front-page news, manufacturers struggled to source components and retailers were left with empty shelves.
Since then, geopolitical tensions, rising freight costs and disruption to major shipping routes have reinforced the same lesson: relying on everything arriving exactly when it’s needed is a gamble many businesses no longer want to take.
Instead, more companies are building a buffer. Holding extra stock isn’t simply about preparing for the unexpected; it’s about giving themselves greater control over how they serve customers when the unexpected inevitably happens.
Advertisement
What else is driving demand?
The growth of ecommerce has quietly rewritten the rules.
Customer expectations have changed dramatically over the last decade. Fast delivery, accurate stock information and hassle-free returns have become standard rather than exceptional. Businesses that can fulfil orders quickly are increasingly the ones winning repeat customers.
That has had a knock-on effect throughout the logistics sector.
The number of so-called mega warehouses has surged, online retailers now occupy significantly more warehouse space than they did a decade ago and investment continues to flow into distribution centres designed to process thousands of orders every day.
Advertisement
It’s no coincidence that the logistics sector now contributes around £175 billion to the UK economy and supports approximately 2.7 million jobs. Warehousing has evolved from a back-office necessity into a critical part of modern commerce.
What does this mean for SMEs?
While much of the investment has come from major retailers and logistics operators, smaller businesses are facing many of the same decisions.
As companies grow, one of the first challenges often isn’t finding more customers but finding somewhere to put the products those customers are buying.
Extra stock quickly takes over offices, workshops and spare rooms. Leasing larger premises can be expensive, particularly in areas where industrial space remains in high demand, yet running with too little inventory can leave businesses vulnerable to delays and missed sales.
Advertisement
For many SMEs, the question is no longer whether logistics deserves attention, but how much of it should remain in-house.
Is this a short-term trend?
Probably not. Many of the forces driving warehouse growth are structural rather than temporary. Ecommerce continues to reshape buying habits, businesses remain cautious about supply chain disruption and customers show little appetite for waiting longer for deliveries.
The result is a logistics sector that looks very different from the one that existed ten years ago. Warehouses have become bigger, inventory has become more strategic, flexibility has become more valuable.
Those changes may not be immediately visible from the high street, but they are reshaping the way British businesses operate behind the scenes.
Advertisement
For SMEs, that’s perhaps the biggest takeaway of all. The warehouse is no longer just somewhere products are stored. Increasingly, it’s becoming a barometer of how confident, resilient and prepared a business is for whatever comes next.
The World Cup is one of the last events on earth that still gathers a genuinely mass audience. Billions of people watch. For a few weeks, the whole conversation bends toward one thing.
Official sponsorship of that moment costs a fortune. Most businesses will never pay it, and most do not need to. The brands generating the loudest buzz around a tournament are frequently not the official partners at all.
That is the opportunity. You can reach an engaged, attentive audience during the World Cup without ever buying a sponsorship. You just need to be smart about how you show up.
Buy attention where the fans already are
Sponsorship buys official status. It does not buy a monopoly on attention. During a tournament, football fans are online constantly, checking scores, arguing about referees, and reading match reaction. That attention is available to any advertiser willing to place ads where those fans gather.
This is where targeted digital advertising does the heavy lifting. Instead of paying for a global sponsorship badge, you pay to appear in front of the specific people who are following the tournament. Programmatic and specialized ad networks let smaller brands buy that reach directly.
Advertisement
Networks such as AdsNetwork, which focus on verticals including iGaming, fintech, and crypto, are one route for brands whose audience clusters around sports betting and online gaming during major tournaments. The wider principle applies to everyone. Identify where your customers pay attention during the World Cup, then buy inventory there rather than chasing a sponsorship you cannot justify. A tightly targeted campaign on the right sites will usually outperform a scattergun spend on the biggest platforms.
Mind the trademark rules
Before you write a single line of copy, understand what you cannot say.
Governing bodies protect their marks aggressively. Official tournament names, logos, trophies, and certain phrases are restricted. Using them without a licence invites legal trouble, even for a small business.
The workaround is simple. Reference the broader sporting moment rather than the protected terminology. Talk about the summer of football, the tournament, the big match, or the games everyone is watching. You can join the cultural moment without borrowing the official language. Plenty of well-known brands run entire campaigns this way, and audiences barely notice the distinction.
Advertisement
When in doubt, keep your wording generic and your intent obvious. Fans understand what you mean.
Ride the moment with real-time content
The biggest advantage a small brand has over a global sponsor is speed.
Sponsors sign off campaigns months ahead. Their creative is locked long before kick-off. A nimble business can react to what actually happens on the pitch, the same day it happens. A surprise result, a memorable goal, a moment that everyone is talking about by lunchtime.
This is where non-sponsors often win. Reactive social posts tied to live moments consistently outperform pre-planned sponsor content on engagement. The reason is simple. They feel timely and human rather than scheduled.
Advertisement
Set yourself up to move fast. Have a designer on standby during big matches. Pre-agree what you will and will not say, so approval takes minutes rather than days. Watch what is trending and connect it back to your brand only when the link feels natural. Forced football references are worse than none.
Give your audience a reason to act now
Attention is only half the job. The tournament also creates a natural sense of urgency you can build on.
Match days are deadlines. A limited-time offer tied to a specific fixture gives people a reason to act before the whistle. This is the same psychology behind flash sales and pre-launch hype, where scarcity and timing drive people to move. There are smart, and less obvious, ways to build genuine demand and urgency that go beyond a simple discount code.
Tie the offer to the rhythm of the tournament. A deal that runs until the next match. A prize that pays out if a certain team wins. A countdown that mirrors the fixtures. The event supplies the urgency for free. Your job is to attach your offer to it in a way that feels part of the fun.
Advertisement
Match the mood, not just the moment
Timing gets you noticed. Tone decides whether people warm to you.
Football is emotional. Fans swing between joy, heartbreak, and disbelief, sometimes within a single half. Brands that read that mood correctly earn goodwill. Brands that misread it look tone-deaf.
Pay attention to your specific market too. Some sectors boom during a tournament, particularly hospitality, food delivery, and betting, and UK businesses across pubs, bookmakers, and takeaways are braced for a significant tournament-driven spending boost. Others see attention drift away while the games are on. Know which camp you are in. If your customers are glued to the football, join them. If they are trying to escape it, that is useful to know as well.
Not every brand should suddenly pivot to full football mode. The ones that succeed find a genuine reason to be there.
Advertisement
Turn attention into something lasting
A tournament is a spike. The smart play is converting that spike into something that outlives it.
Use the surge in traffic to capture contacts, not just clicks. Grow your email list. Encourage a follow. Offer a reason to come back after the final whistle. A campaign that wins attention for a week but keeps nothing is a missed opportunity.
Measure as you go. Watch which posts, offers, and placements actually drive action, and shift budget toward them while the tournament is still running. The advantage of digital over a fixed sponsorship is exactly this. You can adjust in real time.
Common questions
How can a brand market around the World Cup without being an official sponsor?
Focus on the audience rather than the event’s official status. Reach fans through targeted digital advertising on the sites and platforms they use during the tournament. Reference the broader sporting moment instead of protected trademarks and official names. Create fast, reactive content tied to real match moments, since speed is where non-sponsors beat sponsors. Add time-limited offers linked to fixtures to turn attention into action. Done well, this reaches the same fans a sponsor reaches, at a fraction of the cost.
Advertisement
Which types of ad networks work best for reaching sports and betting audiences during a tournament?
Specialized ad networks that focus on relevant verticals tend to work better than broad platforms for this audience. Networks concentrating on iGaming, sports betting, fintech, and crypto, such as AdsNetwork, carry inventory on sites where engaged sports and betting audiences already spend time. That targeting produces cleaner traffic and less wasted spend than a general campaign. The right choice depends on your sector, but the principle holds. Buy where your specific audience gathers rather than paying a premium for the largest possible reach.
Final thoughts
You do not need a sponsorship to win during the World Cup. You need to understand where the attention is, respect the rules around official branding, and move faster than the big brands can.
Buy targeted reach instead of official status. React in real time. Tie offers to the fixtures. Match the emotional mood of the moment. Then capture something that lasts once the tournament ends.
For brands whose audience sits in sports betting, gaming, or fintech, AdsNetwork is one example of a network built to reach that crowd during moments like these.
Advertisement
The tournament belongs to the fans, not the sponsors. Any brand willing to show up thoughtfully can share in the moment.
Natalie Portman shared a new photo showing off her growing baby bump on Instagram, offering fans a glowing glimpse of her pregnancy as the Oscar-winning actress prepares to welcome her third child.
The photo, posted to Portman’s Instagram account, shows the actress standing in front of a sunlit window with her baby bump visible beneath her shirt. She captioned the post, “Counting the days until we meet you,” accompanied by a pink heart emoji, along with a credit to the photographer. Comments on the post were restricted to select accounts, though those who were able to respond flooded the section with supportive messages, including one from former child star Macaulay Culkin, who simply wrote, “Gee whiz.”
Portman first announced her pregnancy publicly in July, describing the experience as “such a privilege and a miracle.” The baby will be her first child with her partner, French musician Tanguy Destable. Portman previously shared two children, son Aleph, now 15, and daughter Amalia, now 9, with her ex-husband, choreographer and director Benjamin Millepied.
Despite the demands of raising two children while now expecting a third, Portman has continued to maintain an active and varied acting career in recent years. Her most recent major role came this year in the film “The Gallerist,” in which she played a character named Polina Polinski alongside a cast that included Sterling K. Brown, Jenna Ortega and Catherine Zeta-Jones.
Advertisement
Portman first rose to international prominence through her roles in two of the biggest franchises in modern film history. She played Padmé Amidala across the “Star Wars” prequel trilogy, and later joined the Marvel Cinematic Universe as astrophysicist Jane Foster, who also becomes the superhero Mighty Thor, appearing in multiple films within that franchise. Both of her characters in those franchises have since died within their respective storylines, making a return to either role unlikely for the actress going forward.
Beyond her tentpole franchise work, Portman has built a career defined by a wide range of roles across film and television. In recent years, she has starred in projects including the limited series “Lady in the Lake” and the film “May December,” both of which drew significant critical attention. She has also taken on more unexpected projects, including a one-episode voice cameo as the “Whale Doco Narrator” in the popular children’s animated series “Bluey.”
Looking ahead, Portman has several projects already lined up, including the films “Pumping Black,” “Good Sex” and “Photograph 51,” suggesting her upcoming pregnancy and the arrival of her third child are unlikely to significantly slow her ongoing acting career, consistent with the balance she has maintained between her professional work and family life throughout her two prior pregnancies.
Portman won the Academy Award for best actress for her role in the 2010 psychological thriller “Black Swan,” a performance that remains one of the defining achievements of her career and helped establish her as one of Hollywood’s most respected dramatic actresses. She began acting professionally as a child, making her film debut in 1994’s “Léon: The Professional,” and has continued working steadily across film, television and voice acting in the decades since.
Advertisement
Portman’s relationship with Destable became public in recent months following her earlier divorce from Millepied, with whom she was married for more than a decade before the couple’s split. Portman and Millepied met while working together on the 2010 film “Black Swan,” in which Millepied served as a choreographer, and the couple went on to have two children together during their marriage.
News of Portman’s third pregnancy adds to a wave of recent celebrity pregnancy and family announcements that have drawn significant attention from entertainment media in recent months, with fans and fellow celebrities alike continuing to express excitement and support for the actress as she prepares to expand her family for a third time.
Portman has generally maintained a measured, selective approach to sharing details of her personal and family life publicly throughout her career, making moments like her recent Instagram pregnancy announcement and subsequent baby bump photo notable events that tend to generate substantial engagement and media coverage whenever she chooses to share them with her audience.


























































You must be logged in to post a comment Login