When I think about TCW Flexible Income ETF (FLXR) I think about an income-oriented fund that can concretely stimulate the expected return function of the bond component of a portfolio without excessively raising the risk function.
And it does so with a portfolio that for almost 50% cannot be covered by classic bond ETFs. This makes it interesting, but from a certain point of view, also difficult to interpret.
Intro and Definition
The fund is domiciled in the TCW ETF Trust and is an active multi-sector fixed income ETF classified as Multisector Bond born in 2018 as a mutual fund, then converted into an ETF and listed on the NYSE on June 24, 2024 with today an AUM exceeding $3.2 billion. It moves with a primary objective of obtaining a high level of current income and as a secondary objective, long-term capital appreciation. To calibrate on results, the declared benchmark is the classic Bloomberg U.S. Aggregate Bond Index; this is used as a reference for comparative metrics, but the fund systematically invests outside the index universe.
Advertisement
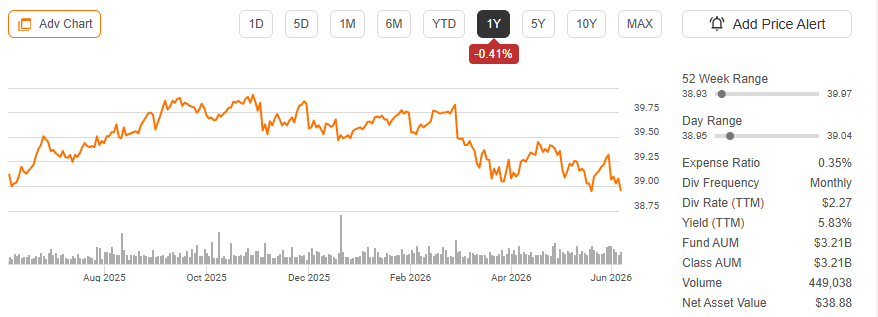
FLXR – fund profile (Seeking Alpha)
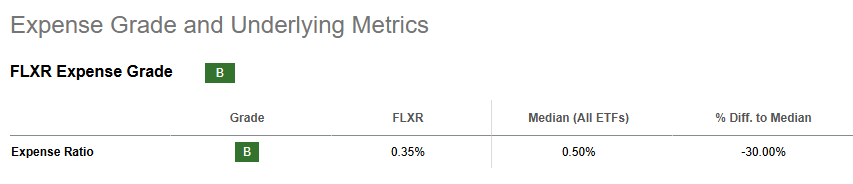
The expense ratio is not negligible for a bond ETF: it is 0.40%, decisively higher than fully passive aggregate solutions, to which a 0.05% average bid-ask spread is added. To put it in perspective, compared to BND there are overall 37 bps of cost spread; that is not nothing.
FLXR – expense grade (Seeking Alpha)
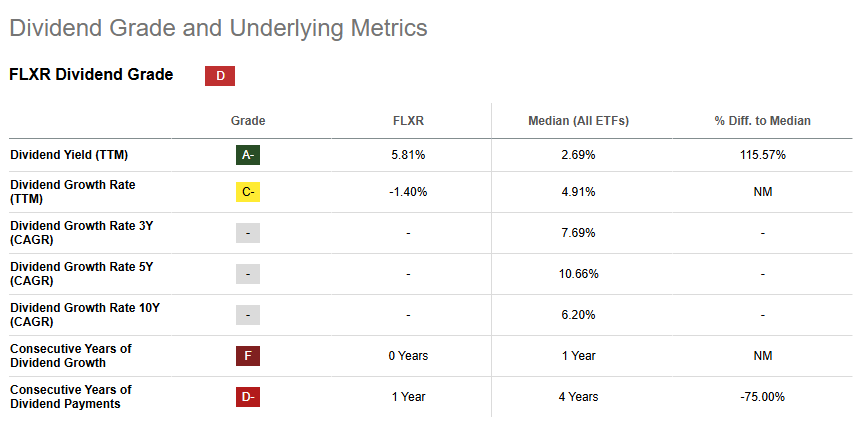
Not by chance does it have a 30-Day SEC Yield of 5.63% and a yield-to-worst of 6.75% distributed monthly, with a risk profile that, however, structurally leans toward IG/securitized. Of course, the yield will change relative to various interest rate environments in the future.
Advertisement
The fund qualifies as a Regulated Investment Company (RIC) under U.S. regulations, avoiding taxation at the corporate level on the condition of timely distributing income. For this reason, distributions are taxed as ordinary income or long-term capital gains.
FLXR – dividend grade (Seeking Alpha)
How Is FLXR Built?
It has 1,624 securities as of March 31, 2026 with a turnover of 295%. No single position exceeds 1% of the portfolio, with the exception of some positions in MBS and Treasuries that by structural nature can be more concentrated. The granularity of the portfolio is extreme: with 1,624 lines, the idiosyncratic risk on a single issuer is almost zeroed out. The implication is that drawdowns do not derive from credit events on individual issuers but from systemic spread or rate movements across entire segments.
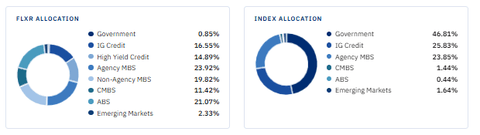
FLXR – allocation vs benchmark (Author)
Advertisement
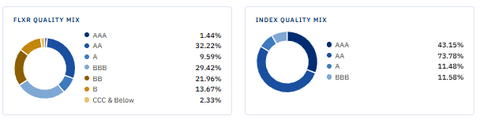
The table reveals the true architecture of the portfolio: FLXR is fundamentally a securitized + credit fund with almost zero government exposure (0.85% vs. 46.81% of the index). Specifically, the underweight on Government bonds of almost 46% is the most radical structural choice of the fund and explains why its behavior is structurally different from any traditional bond ETF. At the rating level, there is a tilt toward AA and BBB (or lower, especially BB and B).
FLXR quality mix vs benchmark (Author)
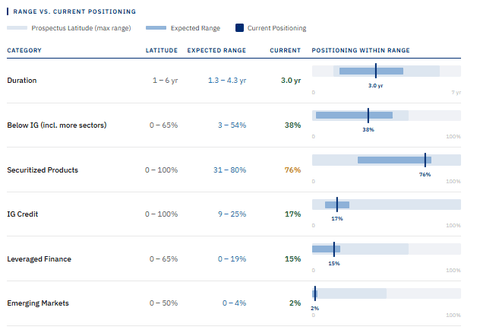
The result? An Effective Duration of 3.03 years, an Average Maturity of 6.19 years, and a negative convexity of 0.38. At least these are the figures that emerged from my reworking of the shared data.
FLXR metrics (Author)
Advertisement
What Does FLXR Do?
Its shorter duration (3.03 years) results in lower sensitivity to rate movements compared to the benchmark. At the same time, it must be said that the negative convexity (-0.38) is not usual for aggregate bond portfolios, which pairs well with a core portfolio of positive convexity on the traditional aggregate bond segment. So it interfaces well in a diversified portfolio while still operating in the American bond market, but with a clear deliberate preference for those segments that large passive indices ignore. Not by chance, FLXR invests over 48% in hard-to-access segments, such as non-government-guaranteed securitized mortgages (Non-Agency MBS), asset-backed securities like residential rentals and data centers (ABS), securitized commercial real estate (CMBS), high-yield corporate bonds, emerging markets.
The management team works on two simultaneous levels: how much rate risk to take on, which bond sectors offer the best risk-adjusted return at any given moment, and how much to hold of riskier bonds versus safer ones.
At the operational level, it selects individual securities, enters positions gradually.
How? The approach is explicitly opportunistic and counter-cyclical: the team tends to increase exposure to riskier segments precisely when the market is selling them.
Advertisement
Who Is FLXR For?
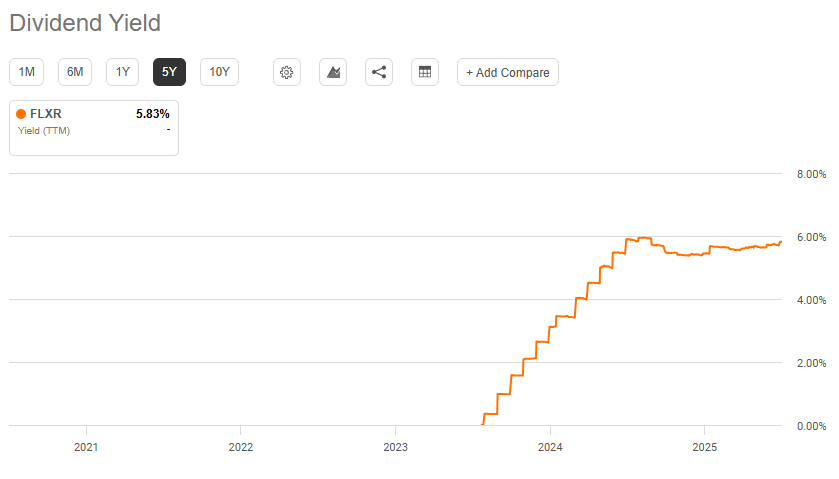
This process produces a quite respectable monthly dividend in the speculative bond landscape. The current annualized yield (30-day SEC Yield) is 5.63%, with a Yield-to-Worst of 6.75%.
FLXR – yield (Seeking Alpha)
For comparison, pure investment-grade bond funds yield today around 4-4.6%, while pure high-yield funds reach 6.5-7% but with almost double the volatility compared to FLXR. And it is therefore clear that it presents itself as a fund targeting the investor looking for a distributed income stream.
But be careful; it is not a pure defensive instrument. Rather, it’s an instrument that would almost seem to adapt as a bond satellite in a diversified portfolio, with the specific function of generating high and stable monthly income with a deliberately contained sensitivity to interest rates (duration 3 years, almost half of the broad bond market). To take stock of the situation, FLXR seems built for an investor who wants a high and steady monthly income, is willing to accept an underlying complexity that cannot be directly controlled, and has an investment horizon of at least 2-3 years that allows them to navigate any phases of volatility without having to liquidate the position at the worst moments.
Advertisement
Peer Comparison
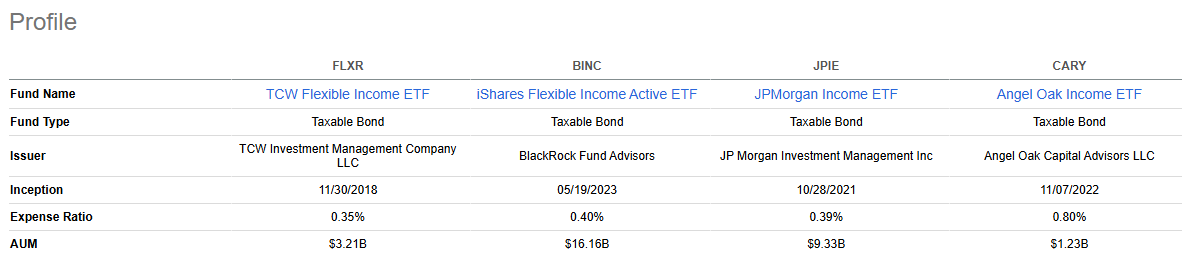
We are therefore in the macro-category of supplementary funds for a core component, and there are some managers that are standing out quite a bit. Personally, I would include the active managers of the iShares Flexible Income Active ETF (BINC), the JPMorgan Income ETF (JPIE), and the Angel Oak Income ETF (CARY).
FLXR – peer comparison (Seeking Alpha)
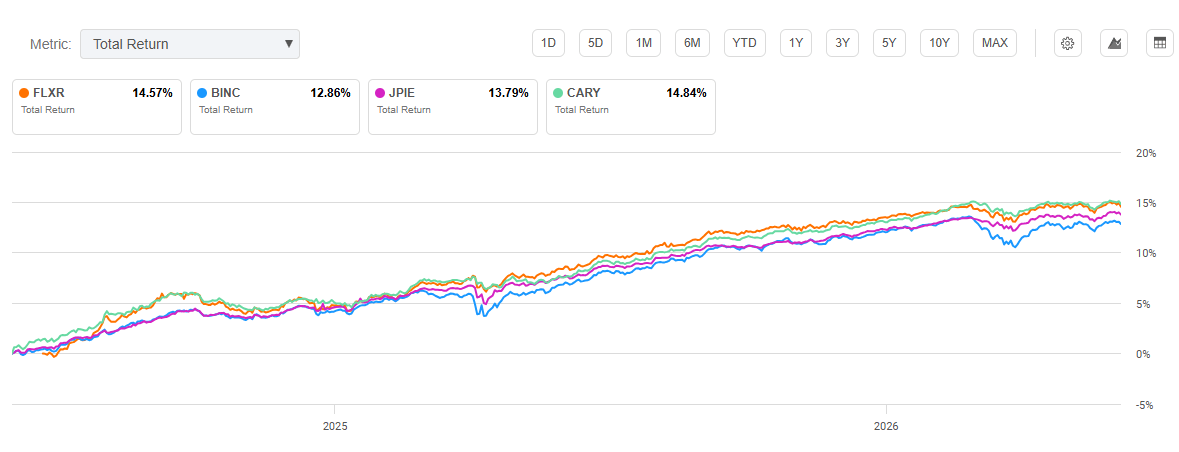
BINC is exposed to similar segments, both active multi-sector with exposures to MBS, ABS, CMBS, and HY. Then it must be said that BINC has different weights in sectoral allocations, with less emphasis on the Non-Agency MBS segment. JPIE instead is another active manager that tries to cover, albeit partially and more tilted toward quality ratings, the segment of FLXR. And I would put CARY on the same level. It is curious to note how since launch, FLXR has been able to maintain a competitive total return, albeit with spreads not so marked compared to peers.
Peer: total return (Seeking Alpha)
Advertisement
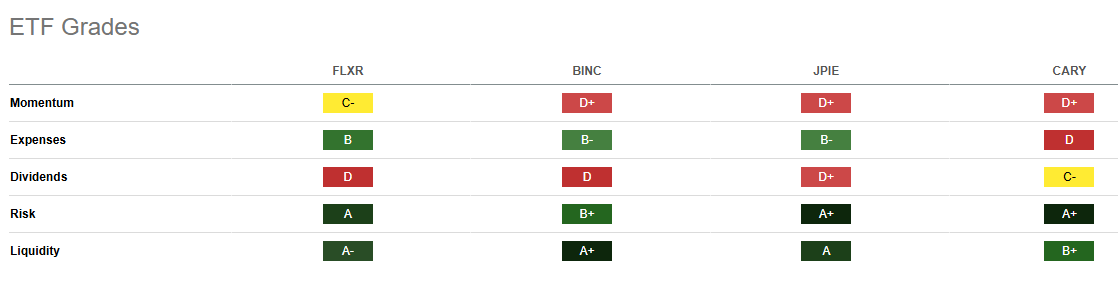
For a more specific comparison, it can make sense here to take a look at the ETF grades from Seeking Alpha, which, in my opinion, clearly show the differences between the ETFs. In this sense, FLXR has greater momentum, which clearly plays in favor of the active management and “market timing” we have seen. And working on “discounts” leads to lower returns (distributions), especially in a rising rate environment. Even though the spread between yields is not so marked, FLXR has a TTM yield of 5.83% per SA, while the competitor with the highest yield is CARY with 5.94%. We are talking about a few basis points.
ETF grades (Seeking Alpha)
Risks
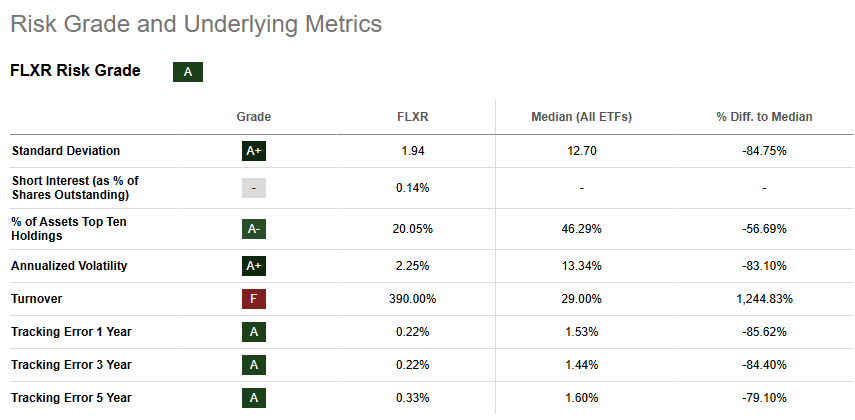
About 37.96% of the portfolio is sub-investment grade (BB 21.96% + B 13.67% + CCC 2.33%). Credit risk is therefore not marginal: in a recession scenario with widening HY spreads, this component will suffer losses that may not be offset by the stability of Agency MBS. It must be said, though, that the Non-Agency MBS component (19.82%), CMBS (11.42%), and non-traditional ABS include assets with limited secondary liquidity. In systemic stress environments, the liquidity of these instruments dries up quickly. And the full recession test has not yet occurred during the ETF’s life as an ETF. So it is not easy to define a concrete risk dimension, even though for SA the risk grade remains A with an annualized volatility of just 2.25%.
FLXR – risk grade (Seeking Alpha)
Advertisement
Pros and Cons
There are therefore clearly positive elements that cannot be ignored:
Yield at the competitive risk/return meeting point of the bond market: From what the data seems to show, it captures a good portion of HY yield without concentrating all the risk on sub-IG bonds
Genuine diversification across 8 bond macro-categories: 1,624 holdings, no position >1% (except some MBS/Treasuries), 8 sectors simultaneously represented
Structural access to the “invisible 48%” of the U.S. bond market: The Bloomberg Agg covers 52% of the market; FLXR systematically invests in the other 48% (non-traditional ABS, Non-Agency MBS, CMBS SASB, CLO)
Short duration protects in high or rising rate environments, little price oscillation, and monthly distributed and competitive yields.
Naturally, there are also negative elements that we cannot brush past lightly:
ETF track record too short to validate the strategy in extreme scenarios
To this is added a liquidity risk in illiquid securitized assets, an underestimated tail risk
Then it is quite expensive: Expense ratio 0.40% + a portfolio turnover of 295% means implicit transaction costs (bid-ask spread on illiquid bonds, market impact) are not captured in the expense ratio and not quantified in any official material
This article answers three questions about FLXR:
How does FLXR select its securities?
What impacts FLXR’s performance?
Where can FLXR fit in a portfolio?
Editor’s note: This article is intended to provide a general overview of the ETF for educational purposes only and, unlike other articles on Seeking Alpha, does not offer an investment opinion about the ETF.
One Nation leader Pauline Hanson has confirmed speculation her recent trip to the Dolce and Gabbana fashion show in Italy was paid for by mining billionaire Gina Rinehart.
I am an experienced Risk Management Business Analyst at a Systemic Greek Bank, with a strong background in finance and risk analysis. I hold an MSc in Applied Risk Management from the University of Athens and have completed the ACA Certificate Level. My expertise lies in financial analysis, risk management, data analysis using SQL, Python, and machine learning tools. I have worked in diverse roles, from assurance to financial analysis and trade operations, across leading firms like EY, PwC, Alpha Bank, and the National Bank of Greece. My primary areas of interest include risk management, financial analysis, data science, and the impact of economic factors on the financial markets. I aim to write on topics related to risk assessment, financial modeling, and stock analysis. With my solid technical background, I approach investing with a focus on data-driven analysis and long-term value creation. My motivation for writing on Seeking Alpha stems from my passion for translating complex financial data into actionable insights for investors. I aim to provide informed analysis on market trends, risk management practices, and investment strategies to support informed decision-making.
Analyst’s Disclosure: I/we have no stock, option or similar derivative position in any of the companies mentioned, but may initiate a beneficial Long position through a purchase of the stock, or the purchase of call options or similar derivatives in ORCL over the next 72 hours. I wrote this article myself, and it expresses my own opinions. I am not receiving compensation for it (other than from Seeking Alpha). I have no business relationship with any company whose stock is mentioned in this article.
Seeking Alpha’s Disclosure: Past performance is no guarantee of future results. No recommendation or advice is being given as to whether any investment is suitable for a particular investor. Any views or opinions expressed above may not reflect those of Seeking Alpha as a whole. Seeking Alpha is not a licensed securities dealer, broker or US investment adviser or investment bank. Our analysts are third party authors that include both professional investors and individual investors who may not be licensed or certified by any institute or regulatory body.
Shares of FMCG major Hindustan Unilever (HUL) declined over 6% to Rs 2,034 on the NSE on Tuesday after the company’s first quarter earnings missed analyst estimates.
The company reported a 3% year-on-year decline in net profit to Rs 2,673 crore for the first quarter of FY27. The company said the decline in PAT resulted from a one-off tax credit in the previous quarter.
Revenue from operations, however, rose 10.2% year-on-year to Rs 17,149 crore in Q1 FY27, compared with Rs 15,552 crore reported in the corresponding quarter of the previous financial year.
HUL reported an underlying sales growth (USG) of 10%, driven equally by volume and price, marking the company’s highest growth in thirteen quarters.
Advertisement
EBITDA for the quarter stood at Rs 3,947 crore, up 8% from Rs 3,640 crore in the year-ago quarter. However, the EBITDA margin declined 40 basis points to 23% from 23.4% in the same period last year, HUL said in its investor presentation.
Live Events
HUL Q1 segment-wise performance
Home Care: Home Care delivered 14% USG, its highest growth in three years, driven by high-single-digit UVG. Disciplined market development and consumer-centric innovations helped strengthen market leadership while maintaining volume resilience. Beauty & Wellbeing: The segment recorded 12% USG, supported by high-single-digit UVG. Hair Care posted double-digit USG, led by Premium Hair Care, including future formats, while continuing to strengthen market leadership. Skin Care and Colour Cosmetics delivered high-single-digit USG, driven by double-digit growth in Premium Skin Care. Personal Care: Personal Care reported 4% USG, led by pricing as palm oil inflation persisted for the second consecutive year. Skin Cleansing recorded mid-single-digit USG, with Premium Bars delivering competitive volume-led double-digit growth. The segment also strengthened its market leadership in Bodywash.
Foods: Foods delivered 7% USG, driven by mid-single-digit UVG and continued strong performance in Lifestyle Nutrition and Coffee. Premium Tea recorded low-single-digit UVG, while Coffee delivered double-digit, volume-led growth, with RTD and Bru Gold continuing to scale up. Lifestyle Nutrition maintained its double-digit growth momentum. Boost crossed the Rs 1,000 crore annual turnover milestone, while Horlicks Superfoods and RTD continued to see encouraging traction.
HUL outlook
HUL expects FY27 to be better than FY26, led by portfolio and channel transformation. Commodity volatility continues to persist, with inflationary pressures expected to remain in the short term.
Advertisement
The company expects consolidated EBITDA margin to remain around the current guided range, while its focus remains on driving competitive, volume-led revenue growth anchored to its key priorities.
(Disclaimer: Recommendations, suggestions, views and opinions given by the experts are their own. These do not represent the views of The Economic Times)
The FTSE 100 giant revealed it would launch a new £1bn share buyback after pre-tax profit jumped 17 per cent from the prior year
Barclays beat market expectations
Barclays profit soared beyond forecasts in the second quarter as widespread market turbulence drove an exceptional showing in its equities trading arm.
The FTSE 100 banking giant announced it would initiate a fresh £1bn share buyback programme after pre-tax profit climbed 17 per cent year-on-year to £6.1bn over the first six months. The figure surpassed City analysts’ expectations of £5.9bn.
The British bank reported income for the three months ending in June of £8.2bn, representing a £2.1bn increase on the corresponding quarter last year.
The lender’s investment banking division capitalised on extensive market volatility during the second quarter triggered by the conflict in Iran, as reported by City AM.
Advertisement
Revenue in the unit advanced 20 per cent, propelled by the showing of its global banking operations and investment banking fees. Overall investment banking income reached £3.95bn, exceeding the £3.65bn forecast by City analysts.
Revenue from its equities trading arm surged 45 per cent compared with the equivalent period last year to £1.26bn. That result lagged behind Wall Street banks, which posted an average 69 per cent rise in equities over the same timeframe, boosted by the substantial SpaceX initial public offering that helped drive US earnings.
Chief executive CS Venkatarishnan, known as Venkat, is pursuing an agenda to overhaul the bank’s investment banking operation, committing to reduce its proportion of group risk-weighted assets. Barclays‘ private bank and wealth management division (PBWM) also posted a five per cent rise in income to £713m, underpinned by growth in client balances.
Chris Beauchamp, Chief Market Analyst at investing and trading platform IG, said: “With the share price sitting at post financial crisis highs there is little room for error for Barclays, but these results provide the reassurance that the group is well-placed for the rest of the year.
Advertisement
“A solid run for the investment banking division helps allay concerns around the size of the motor finance claims, and for now the bigger concern will be how the deeply uncertain outlook for the global economy will play out in the months to come.”
The bank declared a dividend of 5.9p per share, up from 3p per share in the previous year.
The lender also revised its 2026 income target upwards to approximately £31.5bn, citing “robust growth” within its investment banking arm.
Shares of Tata Power were trading about 1% lower at Rs 373 during Tuesday’s session, even as Wall Street brokerage Morgan Stanley maintained its “Equal Weight” rating on the stock. The brokerage retained its target price of Rs 399 following the company’s decent Q1 FY27 performance, which saw net profit rise 11% year-on-year and revenue grow 8%. In an exchange filing dated July 27, Tata Power reported a consolidated profit after tax (PAT) of Rs 1,401 crore for Q1FY27, compared with Rs 1,262 crore in the same quarter last year, marking an 11% year-on-year growth.
The company’s revenue from operations increased to Rs 18,898 crore in Q1FY27 from Rs 17,464 crore in Q1FY26, registering an 8% YoY growth. EBITDA also improved by 8% to Rs 4,249 crore from Rs 3,930 crore in the corresponding quarter.
Tata Power deployed its highest-ever quarterly capital expenditure of Rs 5,375 crore during Q1FY27 as it accelerated investments across renewable energy, transmission, distribution, and clean energy infrastructure.
The company’s core businesses, including Generation, Transmission & Distribution, and Renewables, delivered strong growth, supported by improved operational efficiency. These segments recorded a 12% increase in revenue, a 12% rise in EBITDA, and a 14% growth in PAT on a year-on-year basis.
Live Events
Tata Power’s renewable energy segment continued to be a key growth driver, with PAT rising 15% YoY to Rs 612 crore in Q1FY27. The company’s solar manufacturing business reported a sharp improvement, with Solar Cell and Module Manufacturing PAT jumping nearly 3.9 times year-on-year to Rs 371 crore. The rooftop solar business also witnessed strong momentum, with PAT increasing 1.7 times YoY to Rs 145 crore, supported by higher adoption across consumer segments and nationwide project execution. The Transmission & Distribution (T&D) business reported PAT of Rs 492 crore and EBITDA of Rs 1,541 crore in Q1FY27, reflecting growth of 11% and 14%, respectively.
Tata Power’s Odisha DISCOM operations posted PAT growth of 6% YoY to Rs 111 crore. The company also became the first private utility in the state to cross the milestone of one crore registered customers.
Advertisement
The company is also progressing with its pumped hydro storage expansion plans, with 324 MW of the 1,000 MW Bhivpuri Pumped Storage Project capacity already tied up with the Solar Energy Corporation of India (SECI).
Morgan Stanley maintains ‘Equal Weight’ rating
According to an ET Now report, global brokerage firm Morgan Stanley has retained its “Equal Weight” rating on Tata Power with a target price of Rs 399.
The brokerage noted that Tata Power’s quarterly performance was broadly in line with expectations, supported by consistent earnings growth across its diversified business portfolio.
Management outlook
Dr Praveer Sinha, CEO and Managing Director of Tata Power, said the company is well positioned to participate in India’s transition toward reliable, round-the-clock clean energy. He highlighted the company’s integrated renewable energy approach combining solar, wind, battery storage, and pumped storage solutions.
Advertisement
He added that capital expenditure worth over Rs 5,000 crore during the quarter has strengthened Tata Power’s growth roadmap, while milestones such as the return of Mundra plant operations, strong rooftop solar expansion, and cross-border energy partnerships reinforce its position as an integrated power major.
(Disclaimer: Recommendations, suggestions, views and opinions given by the experts are their own. These do not represent the views of The Economic Times)
























































You must be logged in to post a comment Login