

Crypto World
Understanding the Inverted Cup and Handle Chart Pattern

Understanding chart patterns is fundamental for market participants. This article delves into the inverted cup and handle formation, a bearish signal indicating a potential downward movement. Explore its identification, trading strategies, psychological underpinnings, common pitfalls, and more to boost your trading knowledge.
What Is the Inverted Cup and Handle Pattern?
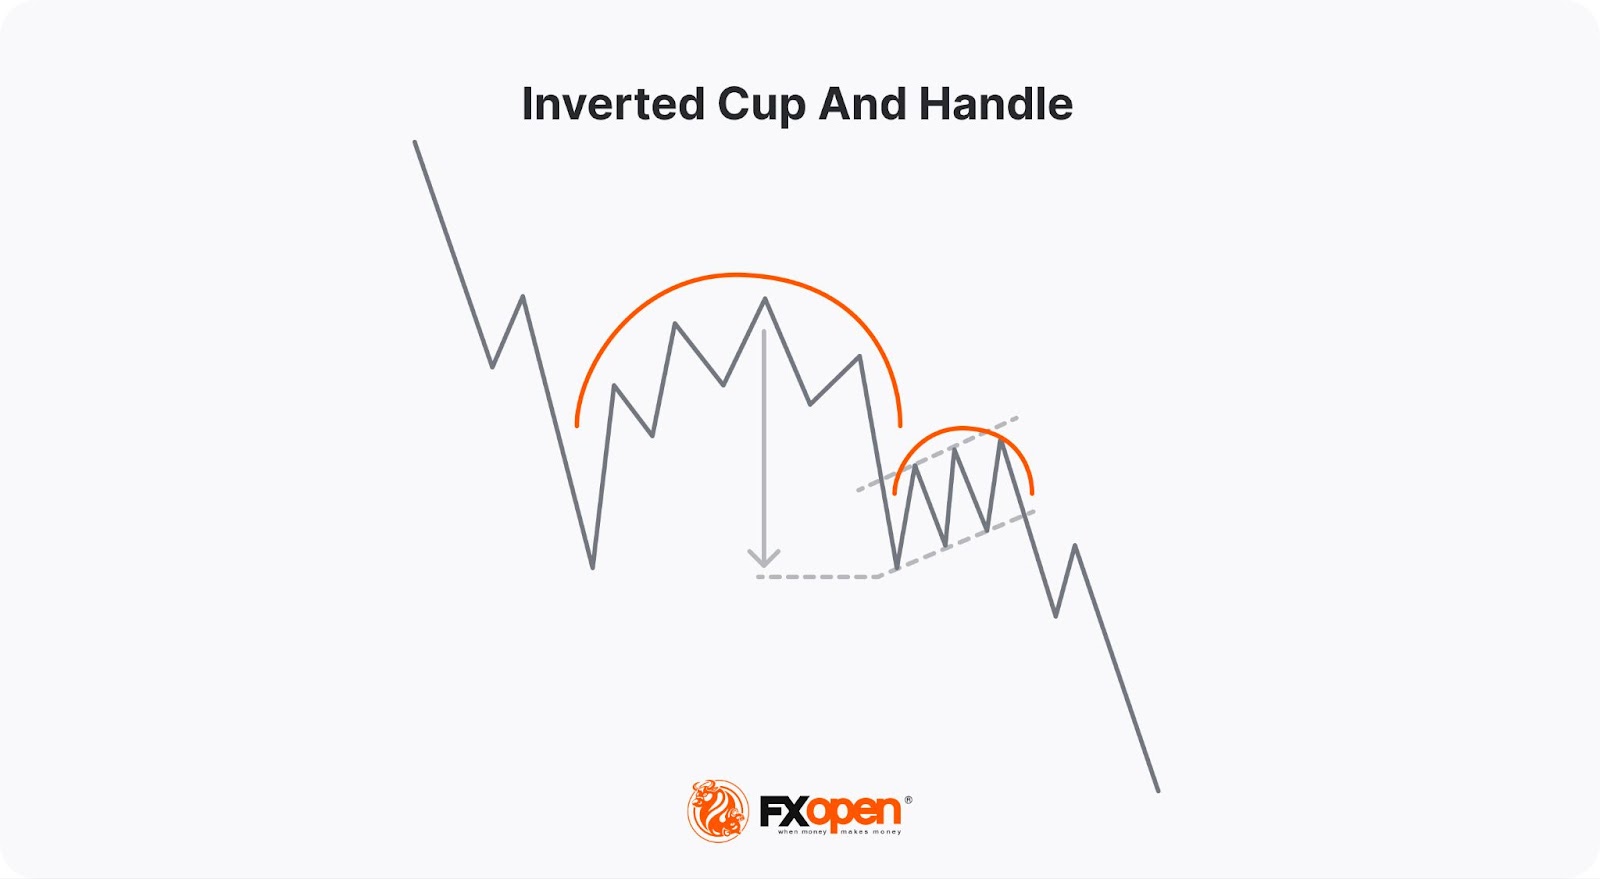
The inverted cup and handle, sometimes called an upside-down cup and handle pattern, is a bearish chart pattern that may appear during up- and downtrends. It is the opposite of the traditional cup and handle pattern, which is bullish. The inverse formation consists of two main parts: the “cup,” which is an inverted U-shape, and the “handle,” a small upward retracement following the cup.
Identifying the Inverted Cup and Handle Pattern
Identifying the inverse cup and handle pattern involves recognising a specific sequence of market movements that signal a potential bearish move. Here’s a step-by-step overview of identifying this formation:
Cup Formation
- Shape: The pattern begins with an inverted U-shaped “cup.” The price gradually rises, consolidates, and then begins to decline, reflecting a shift from bullish to bearish sentiment.
- Depth: The cup should have a rounded top, not a sharp V-shape, indicating a gradual reversal. The depth of the cup can vary but typically represents a significant portion of the preceding movement.
Handle Formation
- Upward Retracement: After the cup’s formation, prices usually experience a minor upward retracement or consolidation, forming the “handle.” This movement should be relatively short and not exceed the initial high of the cup.
- Shape and Duration: The handle often appears as a small flag or pennant and should be brief in duration compared to the cup. An optimal handle retraces no more than half of the cup’s depth.
Breakout Confirmation
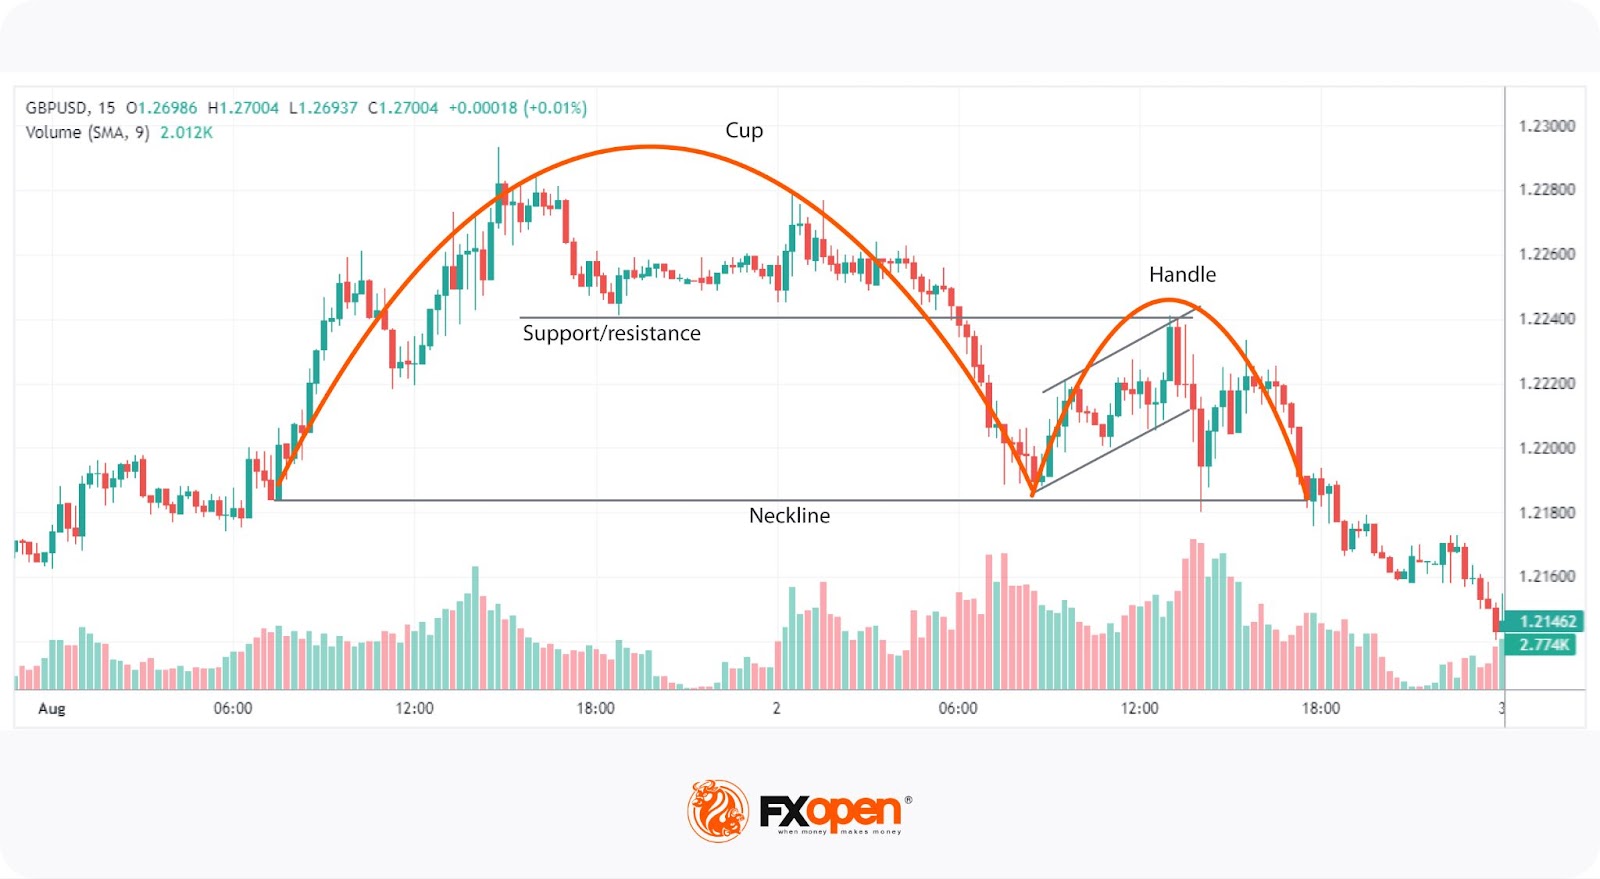
- Neckline Break: The pattern is confirmed when prices break below the neckline, the lowest point of the handle. This breakout often leads to a significant decline in prices, signalling a bearish trend.
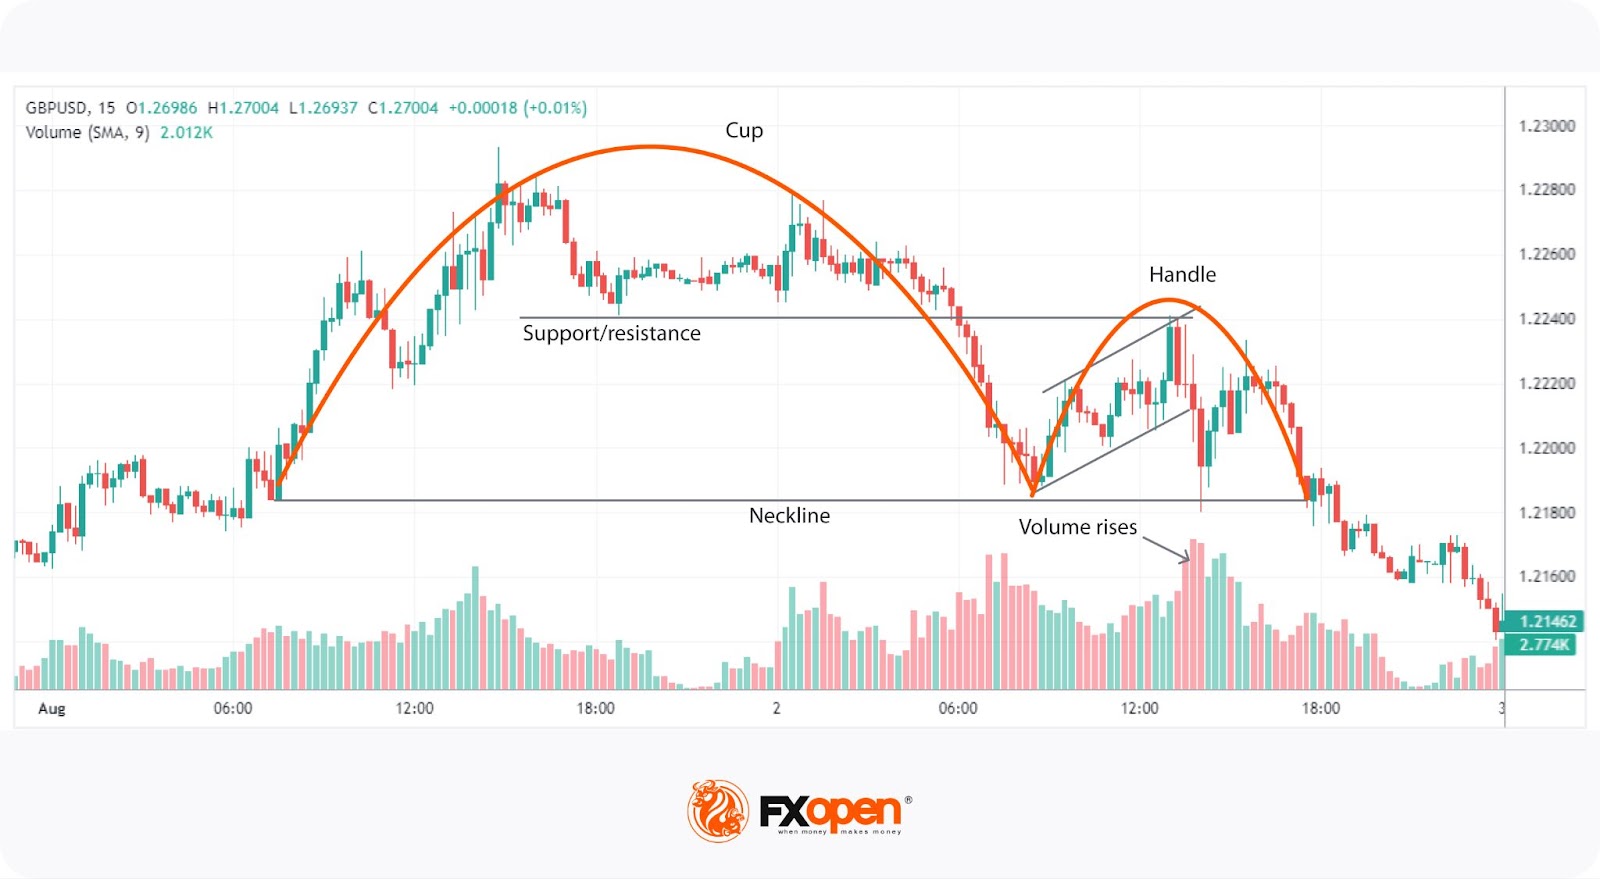
- Volume Surge: Volume typically decreases during the formation of the cup and increases as prices decline, especially during the handle formation. A substantial increase in volume during the breakout can validate the pattern and minimise the risk of false signals.

The Psychology of the Inverted Cup and Handle
The psychology behind the inverse cup and handle pattern is rooted in market sentiment and behavioural finance. This bearish pattern reflects a shift from optimism to pessimism among traders.
- Initial Uptrend: The formation starts with an upward movement, where traders are generally bullish, driving prices higher. This phase is marked by growing confidence and increasing demand.
- Formation of the Cup: As prices peak, consolidate, and start to decline, some traders begin to take profits, leading to reduced buying pressure. The rounded decline of the cup signifies a gradual shift in sentiment from bullish to bearish as traders become cautious and selling pressure mounts.
- Handle Formation: The minor upward retracement forming the handle indicates a brief period of consolidation where the market tests the resolve of buyers. It can be considered a dead cat bounce. This phase often traps optimistic traders who expect the uptrend to resume, but the overall sentiment remains fragile and cautious.
- Breakout and Decline: The decisive break below the neckline represents a culmination of bearish sentiment. At this point, selling pressure overwhelms any remaining bullishness, leading to a sharp decline. The volume surge during this breakout confirms the shift in market psychology from hopeful to bearish as traders rush to exit their positions or initiate short sales.
Trading the Inverted Cup and Handle Pattern
Trading the inverted cup and handle pattern involves careful identification and strategic decision-making to maximise potential returns. This pattern presents two primary entry points for traders: during the handle formation or after the neckline break.
FXOpen’s advanced TickTrader platform allows users to identify the inverted cup and handle formation in real-time across hundreds of markets.
Entry on the Break of the Handle
- Risk-Reward Advantage: Entering on the breakout of the handle’s lower boundary offers a better risk-to-reward ratio but requires more skill and confidence in pattern recognition.
- Technical Tools: Traders often use a medium-term moving average (like 21 periods) to confirm the downward leg of the handle. A decisive close below the moving average indicates a continuation of the downward handle leg.
- Momentum Indicators: Using momentum indicators like the RSI (Relative Strength Index) or stochastic oscillator helps confirm downward movement. Bearish divergence suggests that the bearish trend is likely to continue.
- Volume Analysis: Increasing volume during the handle’s breakout indicates strengthening seller control. High volume often validates the pattern and potentially reduces the risk of false signals. Note that volume data may be less reliable in a decentralised forex market.
- Stop Loss and Profit Target: Traders typically place a stop loss above the handle’s high to potentially protect against upward spikes. The reverse cup and handle pattern target is usually set at a distance equal to the cup’s height, projected downward from the handle’s breakout point, although it can be greater if the retracement is particularly shallow.
Entry After the Neckline Break
- Confirmation Advantage: Waiting for the neckline break offers greater confirmation of the formation but may provide a less favourable risk-to-reward ratio.
- Price Action: A decisive close below the pattern’s low, ideally with a strong candlestick and minimal wicks, indicates a reliable breakout. This typically confirms the bearish trend and provides a clear entry signal.
- Volume Confirmation: Higher volume during the neckline break can further validate the pattern and indicate that the breakout is genuine and not a false signal.
- Stop Loss and Profit Target: In this scenario, the stop loss is typically set above the handle’s high. The profit target remains the same, projecting the cup’s height downward from the breakout point.
Common Mistakes to Avoid
When trading the upside-down cup and handle pattern, avoiding common mistakes is key for maximising potential returns. Some of the more common mistakes traders make include:
- Premature Entry: Entering a trade too early, before the handle completes or the neckline breaks, can lead to false signals and losses. Most traders wait for clear confirmation, such as a decisive close below the neckline with increased volume.
- Ignoring Volume: Volume is a critical component in confirming the pattern. Low volume during the breakout phase may indicate a fakeout. Traders typically look for a substantial increase in volume to validate the pattern.
- Incorrect Pattern Identification: Misidentifying the pattern is a common error. The cup should have a rounded bottom, not a sharp V-shape, and the handle should be relatively short. Accurate identification requires practice and attention to detail.
- Overlooking Market Conditions: External factors, such as news events or broader market trends, can impact the pattern’s reliability. Traders consider these conditions when planning their trades.
Advantages and Disadvantages
As with all chart patterns, the inverted cup and handle pattern comes with its pros and cons. Here are some key advantages and disadvantages of using this pattern:
Advantages
- Clear Signal: The pattern provides a clear signal of a potential bearish movement, helping traders anticipate market declines.
- Risk Management: With defined entry and exit points (handle high for stop loss and cup depth for profit target), it aids in effective risk management.
- Flexibility in Analysis: Several forms of analysis, from support/resistance and momentum indicators to volume and price action, can be used to trade the pattern.
- Versatility: Applicable across various timeframes and markets, including stocks, forex, and commodities, making it a versatile tool for different trading strategies.
Disadvantages
- Complex Identification: Accurately identifying the pattern can be challenging, requiring significant experience and skill.
- Rarity: The pattern doesn’t occur frequently, limiting trading opportunities.
- False Breakouts: Like all chart patterns, it is susceptible to false breakouts, especially if not confirmed with volume and other technical indicators.
- Timing Sensitivity: Entering too early during the handle formation can result in premature positions, while waiting for the neckline break might reduce the risk-to-reward ratio.
The Bottom Line
Mastering the inverted cup and handle pattern can help boost your trading performance. To put this knowledge into practice with tight spreads from 0.0 pips, low commissions, and access to four trading platforms, open an FXOpen account. With over 600+ markets to choose from, FXOpen provides a comprehensive trading environment for all your needs.
FAQ
What Is the Inverse Cup and Handle Pattern in Forex?
The inverse cup and handle pattern in forex is a bearish chart pattern. It features an inverted U-shaped cup followed by a small upward retracement (the handle). This pattern suggests that sellers are gaining control, and prices are likely to decline further once the neckline is broken.
How Can You Trade the Inverse Cup and Handle?
Traders can enter positions either on the break of the handle’s lower boundary or after the neckline break. Entering during the handle might offer a better risk-to-reward ratio, while waiting for the neckline break provides greater confirmation. Key tools to validate the breakout include moving averages, momentum indicators like RSI or stochastic oscillator, and volume analysis.
What Happens After the Reverse Cup and Handle Pattern?
After the reverse cup and handle pattern is completed, the price typically moves downward strongly. This bearish movement is often confirmed by a strong breakout below the neckline with increased volume, signalling a sustained decline in prices.
What Is the Opposite of the Cup and Handle?
The opposite of a cup and handle is the inverse cup and handle pattern. While the cup and handle indicates a bullish movement, the inverse version signals a bearish trend.
Is the Inverted Cup and Handle Bullish or Bearish?
The inverted cup and handle pattern is bearish. It indicates that the price will move downwards, suggesting that traders may open short trades.
This article represents the opinion of the Companies operating under the FXOpen brand only. It is not to be construed as an offer, solicitation, or recommendation with respect to products and services provided by the Companies operating under the FXOpen brand, nor is it to be considered financial advice.


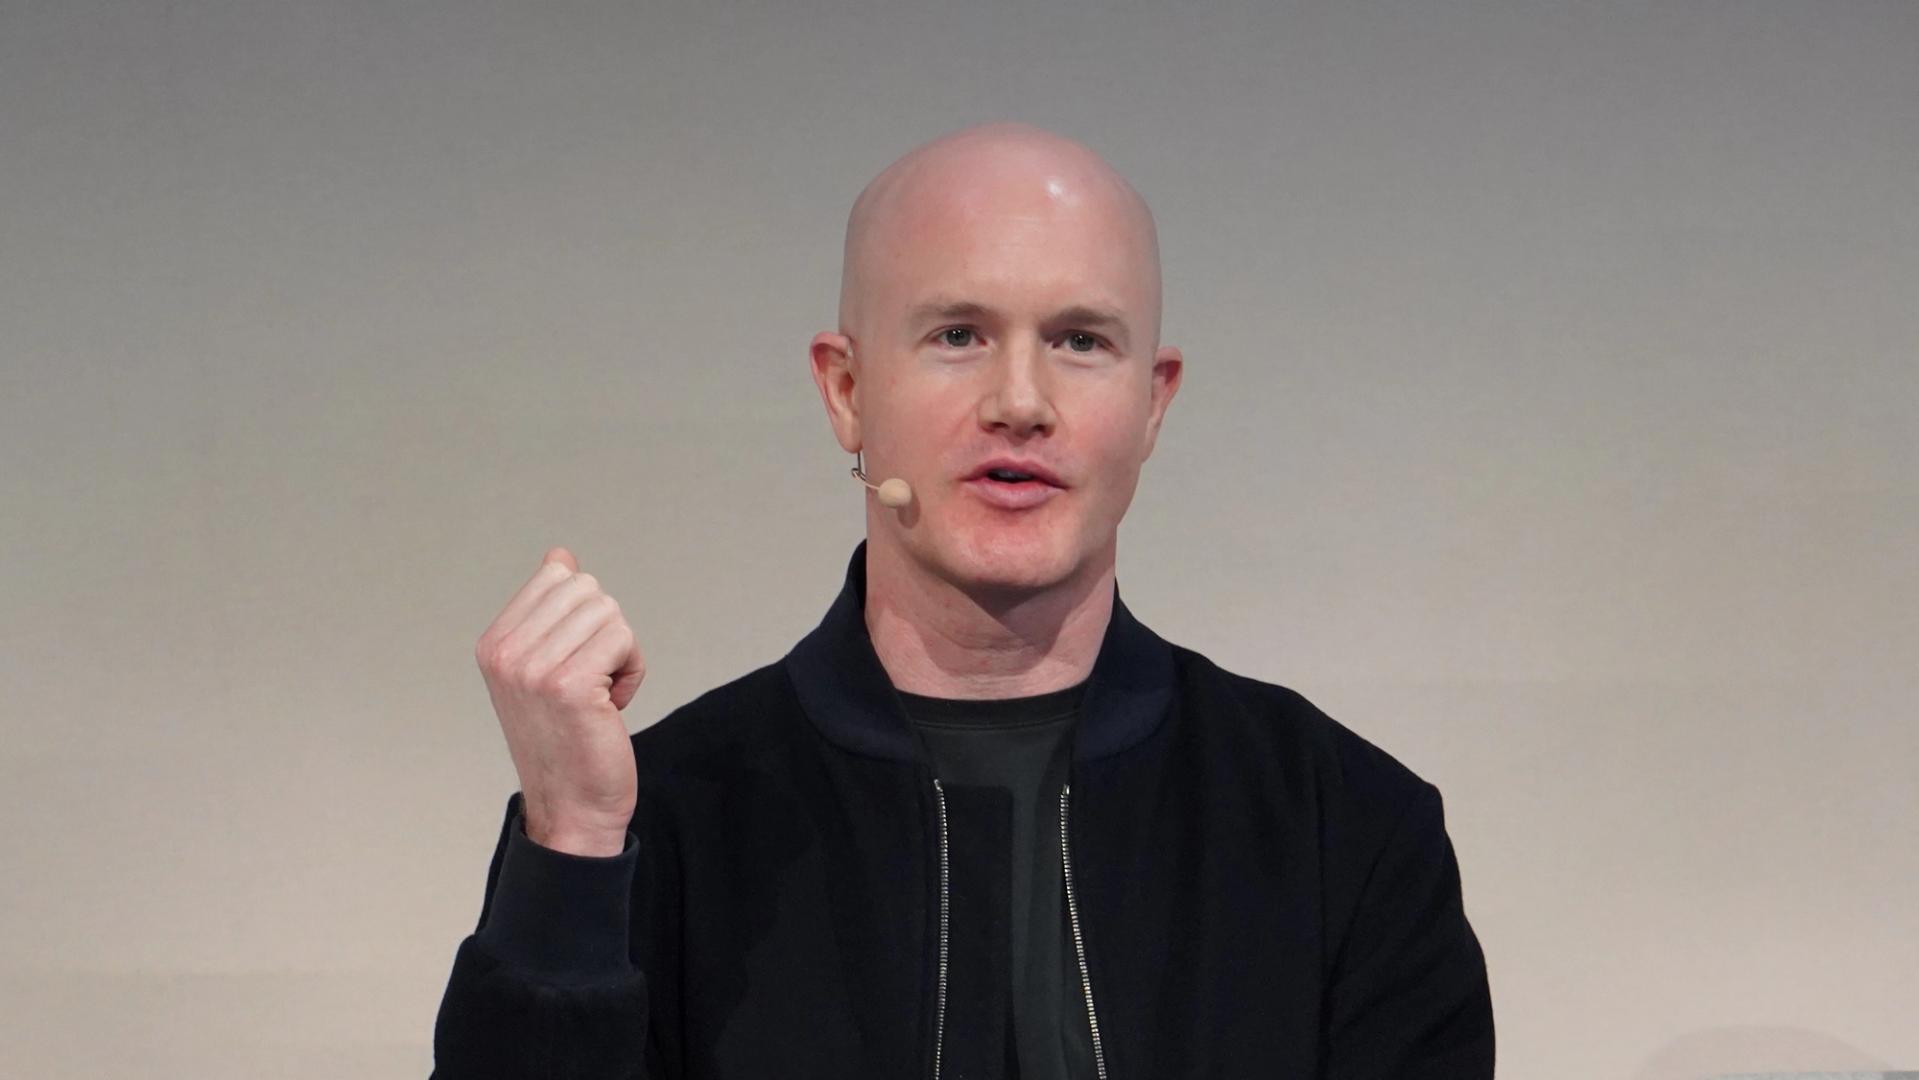
Coinbase (COIN) CEO Brian Armstrong believes bitcoin may have bottomed near $60,000.
“My instinct is we probably have bottomed at this point, maybe at the sixty K number, but nobody can say for sure,” Armstrong said in a video posted on X on Monday. He added that he remains long bitcoin and expects prices to be significantly higher by 2030.
“I think bitcoin is the new digital gold,” he said.
Bitcoin traded above $66,000 on Monday, up nearly 3% over 24 hours, after the US and Iran reached a deal to reopen the Strait of Hormuz. The token touched a low near $59,743 on June 5, its weakest level since October 2024, before recovering.
Armstrong pointed to bitcoin’s four-year halving cycle, which has historically alternated between bull and bear markets at roughly regular intervals, as a framework for reading the current drawdown. Bitcoin is now roughly 50% below its October 2025 all-time high near $126,000.
The Coinbase chief also said last week that the drop in bitcoin’s price was masking broader health in the crypto market. “Derivatives, stablecoins, prediction markets are all up,” he wrote on X on June 5. “It will take some time for this to sink in.”

World Liberty Financial’s USD1 stablecoin paid out $250,000 in fighter performance bonuses at UFC Freedom 250. The mixed martial arts and likely WLFI crypto event is held on the White House South Lawn starting on June 14, President Trump 80th birthday.
WLFI served as the presenting partner of the bonus pool, distributing USD1 across seven matches on the card. It is the most prominent consumer-facing deployment of the Trump stablecoin to date.
Land of the free. Home of the brave. — The White House (@WhiteHouse) June 15, 2026
 @UFC Freedom 250 has KICKED OFF! pic.twitter.com/6YKW9UTniC
The UFC activation did not happen in isolation; it arrived alongside a WLFI token surge of 3% on sponsorship news, a concurrent Binance rewards campaign allocating 178 million WLFI governance tokens to USD1 holders, and a separate $1 million CRO-denominated bonus pool from Crypto.com co-presenting the same event.
The total crypto-based fighter bonuses on the night approached $1.65 million.
Discover: The Best Crypto to Diversify Your Portfolio
Trump Crypto Venture: How the USD1 Bonus Pool Actually Worked
WLFI funded a $250,000 performance bonus pool denominated in USD1, distributed to fighters across seven bouts based on performance criteria standard to UFC fight-night bonus structures.
Payouts were made in USD1, a dollar-pegged stablecoin backed by cash and short-duration U.S. Treasuries custodied through BitGo. This means fighters received an asset functionally equivalent to dollars, just issued by a Trump family-affiliated DeFi venture.
Todd Phillips, crypto expert at the Klaros Group, framed the commercial logic: “Paying the fighters in the USD1 stablecoin would have the same economic function as writing them a check. Announcing to the world they are doing it in USD1 sounds like they are advertising to the world that USD1 is out there and that it is connected to the UFC and the White House.”
The White House as a Marketing Venue: The Conflict of Interest
Trump political brand has always been inseparable from his crypto and commercial brand, and voters who elected him understood that. A president who openly holds over $50 million in a crypto venture, uses the White House South Lawn to host a UFC card, and pays fighters in his family’s stablecoin is at least being transparent about the integration.
The White House maintains that Trump’s assets are managed through a trust run by his children. That is the administration’s position.
The Trump family reportedly receives approximately 75% of net proceeds from WLFI token sales, plus a share of yields generated on USD1 reserves. The venue for the UFC event is a taxpayer-owned property. The regulatory environment for stablecoins is being shaped in part by an administration with a direct financial interest in a stablecoin issuer.
— Coinpaper (@coinpapercom) May 9, 2026
 LATEST: A former New York Fed examiner says #Trump-linked crypto project World Liberty Financial may have issued an unregistered security.
The criticism centers on whether the $WLFI token qualifies as more than a simple governance token under recent SEC guidance. pic.twitter.com/8zuRHlrA7I
The SEC issued an investor bulletin specifically flagging USD1 as a privately issued stablecoin affiliated with the sitting president’s family.
The spectacle is effective. Trump understands that crypto runs on attention, and a White House UFC event is attention on an industrial scale. But retail participants holding USD1 in DeFi pools should understand they are operating inside a product whose issuer has already demonstrated willingness to push pool utilization to 93% for its own borrowing needs.
USD1 is in active litigation with Justin Sun over frozen holdings and is simultaneously pursuing a federal banking charter.
Discover: The Best Token Presales
The post Trump USD1 Crypto Stablecoin Debuts as Fighter Bonus Currency at White House UFC Event appeared first on Cryptonews.

A Spacex Flacon 9 rocket lifts off from Space Launch Complex 40 on June 12, 2026 in Cape Canaveral Space Force Station, Florida.
Joe Raedle | Getty Images
SpaceX made its debut at the Nasdaq on Friday, climbing more than 19% on its first day of trading and rising above a $2 trillion market valuation. But while the arrival of the company to public markets is squared away, some of its other long-term plans are years in the future.
Elon Musk’s company in its initial public offering prospectus with the Securities and Exchange Commission repeatedly focused on the “Moon, Mars and beyond.” The company’s goal for Mars is so large that Musk won’t get a bonus of restricted shares unless SpaceX establishes a colony on the planet with more than 1 million inhabitants.
But when that will happen is years from now, traders on prediction market platform Kalshi think.
Traders see just an 18% chance that SpaceX launches a human mission to Mars by 2030. Since the event contract first launched in March 2024, traders have never seen more than one-in-four odds of the mission happening this decade.
The event contract will resolve to yes if SpaceX verifies a manned mission to Mars by Dec. 31, 2029.
Traders’ uncertainty mirrors SpaceX’s own plans. In its prospectus, SpaceX made clear it doesn’t have a vision for when a Mars mission may happen.
“Many of our initiatives… involve significant technical complexity, unproven technologies or technologies that do not exist, and such initiatives may not achieve commercial viability,” SpaceX said. “As a result, the timeline for certain of our initiatives involving unproven or new innovations … may be difficult or impossible to determine.”
But while an exact timeline may be unknown, the company’s focus on Mars is clear. The planet was mentioned 63 times in the prospectus itself, and once in a photo caption featured in the document.
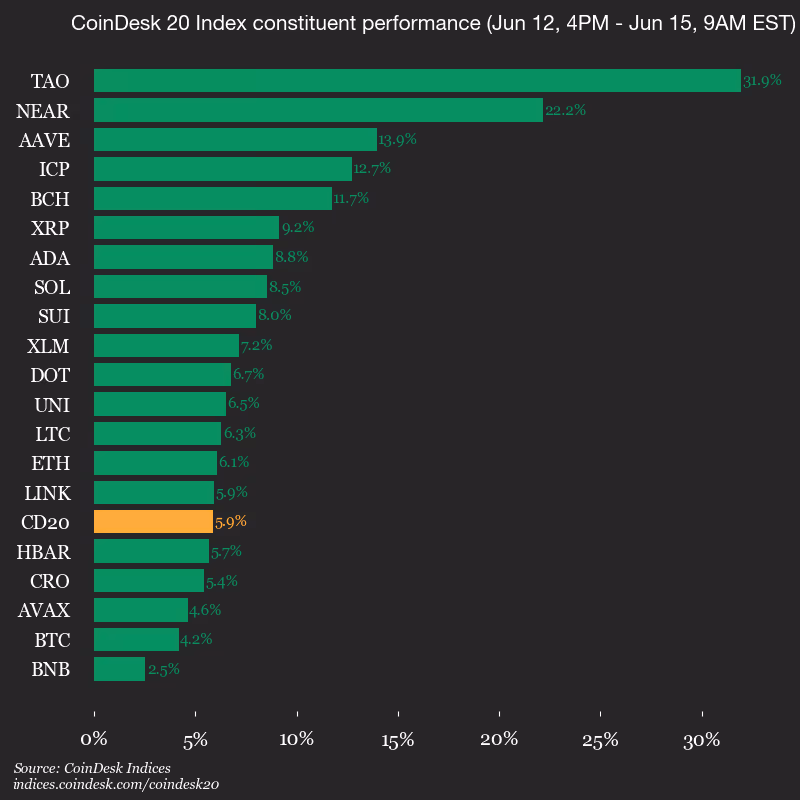
CoinDesk Indices presents its daily market update, highlighting the performance of leaders and laggards in the CoinDesk 20 Index.
The CoinDesk 20 is currently trading at 1812.32, up 5.9% (+100.88) since 4 p.m. ET on Friday.
All 20 assets are trading higher.

Leaders: TAO (+31.9%) and NEAR (+22.2%).
Laggards: BNB (+2.5%) and BTC (+4.2%).
The CoinDesk 20 is a broad-based index traded on multiple platforms in several regions globally.

BitMine Immersion Technologies said its Ethereum holdings reached 5,620,754 ETH as of June 14, bringing the company closer to its goal of owning 5% of the total ETH supply.
Summary
- BitMine now holds 5.62 million ETH, equal to 4.66% of total Ethereum supply today overall.
- The company says staked ETH stands at 4.72 million, supporting projected annual staking revenue.
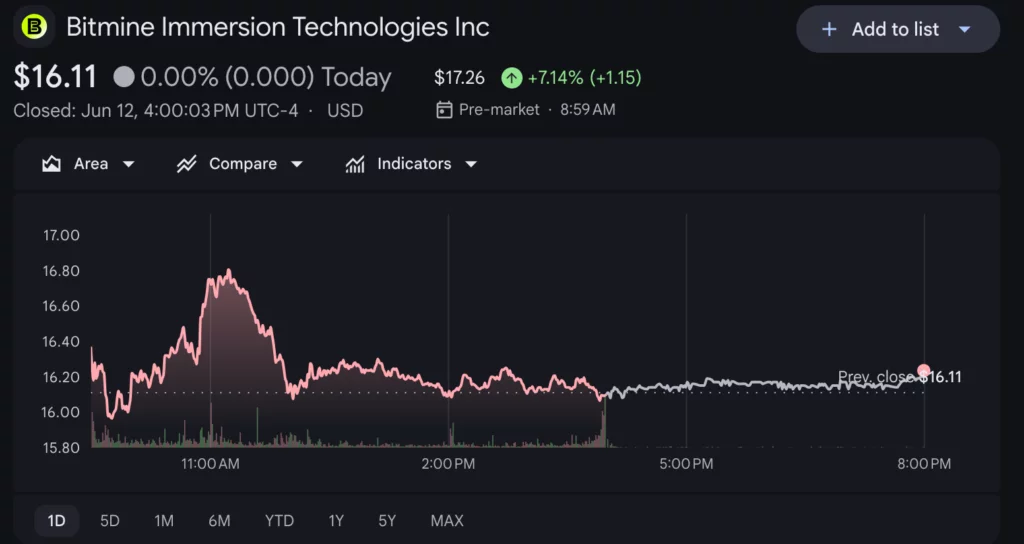
- BMNR traded near flat after the update, with shares at $16.11 in midday trading.
In a Monday announcement, the company said the position equals 4.66% of Ethereum’s 120.7 million token supply.
Meanwhile, the company also reported total crypto, cash, marketable securities and “moonshots” holdings of $10.4 billion. Its holdings include 204 BTC, $502 million in cash and marketable securities, a $180 million stake in Beast Industries and an $88 million stake in Eightco Holdings.
Staking operation backs preferred stock plan
BitMine said it has staked 4,718,677 ETH, worth about $8.1 billion at $1,718 per ETH. The company said this makes it the largest Ethereum treasury in the world and the second-largest crypto treasury behind Strategy.
“Over the past week, we acquired 76,881 ETH,” said chairman Thomas “Tom” Lee.
He said BitMine kept a higher buying pace because it believes the recent ETH pullback does not reflect stronger Ethereum fundamentals.
BitMine also closed the sale of 3,500,000 shares of 9.50% Series A Perpetual Preferred Stock on June 10. The company raised about $273.8 million in net proceeds after fees and expenses.
Lee said the preferred stock sale gives BitMine balance sheet diversification. He added that projected annual staking rewards of about $219 million provide recurring cash flow to support dividends on the preferred shares.
BMNR stock reaction stays muted
BitMine’s preferred shares are expected to start trading on the NYSE under the ticker BMNP on June 16. The company also declared a weekly cash dividend of $0.2639 per preferred share, expected to be paid on July 6 to holders of record on June 26.
BMNR stock showed little movement after the update. Google Finance data showed shares near $16.11, down about 0.03%, with a market capitalization of about $7.32 billion at the time checked.
The muted reaction came after several weeks of heavy attention on BitMine’s Ethereum treasury model. The company said BMNR ranks among the most traded U.S. stocks, with average daily dollar volume of about $550 million over five days as of June 12.
Ethereum treasury race gains fresh attention
crypto.news recently reported that BitMine had raised its ETH holdings to 5.42 million tokens after buying 26,497 ETH. The report also noted that the firm had staked 4.72 million ETH and remained one of the largest public Ethereum treasury plays.
Moreover, as crypto.news reported, BitMine had moved closer to its 5% ETH target after further buying activity tied to large wallet transfers. That report also noted pressure on BMNR shares as ETH prices weakened and investors weighed the scale of the treasury bet.
The latest release shows BitMine has continued to add ETH while also building cash reserves and preferred stock financing. The next focus for investors will be whether the company can keep growing ETH per share while meeting weekly dividend obligations.

The Next Evolution of Decentralized Finance
Decentralized Finance (DeFi) was built on the promise of creating an open, permissionless financial system accessible to anyone with an internet connection. Yet despite billions of dollars flowing through decentralized exchanges, lending protocols, and on-chain financial products, one major obstacle remains: complexity.
For years, users have been expected to manage wallets, sign transactions, bridge assets, understand gas fees, navigate multiple blockchains, and interact with unfamiliar interfaces. While crypto-native users have adapted, mainstream adoption continues to face significant friction.
This challenge has sparked a new trend across the industry: abstraction. Increasingly, DeFi builders are racing to hide blockchain complexity behind seamless user experiences. The goal is simple yet transformative—allow users to benefit from decentralized finance without needing to understand the underlying infrastructure.
The future of DeFi may not be about adding more protocols. It may be about making those protocols invisible.
Why Abstraction Matters
The average internet user has little interest in learning blockchain mechanics.
Most people do not want to understand:
- Private key management
- Network switching
- Token approvals
- Transaction routing
- Liquidity fragmentation
- Layer-2 infrastructure
They simply want financial products that work.
Traditional fintech applications gained adoption because users never needed to understand payment rails, banking infrastructure, or settlement systems.
DeFi must reach a similar level of simplicity if it hopes to compete with mainstream financial services.
Abstraction is becoming the bridge between blockchain innovation and real-world usability.
Account Abstraction: The Foundation Layer
One of the most important developments driving this trend is account abstraction.
Traditional crypto wallets are often difficult for new users to manage. Losing a seed phrase can mean losing access to funds permanently.
Account abstraction introduces programmable wallet functionality that can dramatically improve user experience.
Features include:
- Social recovery
- Biometric authentication
- Multi-factor security
- Automated transaction execution
- Subscription payments
- Spending limits
Instead of behaving like rigid blockchain accounts, wallets become flexible financial operating systems.
This shift allows crypto applications to offer experiences that feel much closer to modern mobile banking.
The Rise of Intent-Based Finance
Another major innovation is the emergence of intent-based systems.
Historically, users have needed to specify exactly how transactions should be executed.
Intent-based finance flips this model.
Users simply express an objective.
For example:
- “Swap ETH for the highest amount of USDC.”
- “Earn the best stablecoin yield available.”
- “Transfer assets to another chain.”
Specialized networks, solvers, or agents then determine the optimal path to achieve the desired outcome.
This creates a user experience that resembles search engines or AI assistants rather than traditional financial software.
The complexity shifts from the user to the protocol layer.
Cross-Chain Abstraction Is Eliminating Blockchain Silos
One of the largest challenges in DeFi today is fragmentation.
Liquidity is distributed across numerous ecosystems, including:
- Ethereum
- Solana
- Base
- Arbitrum
- Optimism
- Avalanche
- BNB Chain
Historically, moving assets between these networks has required bridges, multiple wallets, and considerable technical knowledge.
Cross-chain abstraction aims to eliminate these obstacles.
Users increasingly interact with applications that automatically:
- Route transactions
- Bridge assets
- Manage liquidity
- Select execution venues
In the future, users may not even know which blockchain is processing their transaction.
The network becomes a backend service rather than a visible destination.
AI Agents Are Accelerating Abstraction
Artificial intelligence is emerging as a powerful force in the abstraction movement.
AI-powered agents can:
- Monitor markets
- Rebalance portfolios
- Execute trades
- Manage risk
- Optimize yield strategies
- Handle recurring financial tasks
Rather than manually interacting with multiple DeFi protocols, users can delegate objectives to autonomous systems.
Imagine saying:
“Allocate my capital across the safest opportunities earning more than 8% APY.”
An AI agent could evaluate markets, execute transactions, and continuously optimize positions.
As AI capabilities improve, financial management may become increasingly autonomous.
The Competitive Race Among DeFi Protocols
Protocols are recognizing that usability is becoming a competitive advantage.
Early DeFi focused primarily on:
- Liquidity
- Security
- Token incentives
The next phase is increasingly focused on:
- Simplicity
- Automation
- Accessibility
- User retention
Projects that successfully abstract complexity may gain significant market share by attracting non-technical users.
In many ways, DeFi is entering a new stage where user experience could become just as important as protocol design.
The winners may not be those with the most sophisticated technology, but those who make sophisticated technology disappear.
Risks of Increasing Abstraction
While abstraction improves usability, it also introduces new considerations.
Potential challenges include:
Reduced Transparency
Users may lose visibility into how transactions are executed.
Centralization Risks
Some abstraction layers may rely on intermediaries, solvers, or service providers.
Security Complexity
Additional automation can introduce new attack surfaces.
User Dependence
Overreliance on automated systems may reduce users’ understanding of financial risks.
The industry must balance convenience with transparency, security, and decentralization.
The Endgame: Invisible DeFi
The ultimate destination of abstraction is a world where blockchain technology becomes largely invisible.
Users may eventually interact through:
- Mobile applications
- AI assistants
- Embedded finance platforms
- Autonomous financial agents
Without needing to know:
- Which chain are they using
- Which bridge is involved
- Which protocol executes the trade
- How settlement occurs
They receive the benefits of an open, programmable financial infrastructure.
Just as internet users rarely think about TCP/IP, servers, or routing protocols, future DeFi users may never think about wallets, gas fees, or blockchain networks.
Conclusion
DeFi’s race toward abstraction represents one of the most important shifts in the industry’s evolution. While early decentralized finance proved that permissionless financial systems could exist, the next challenge is making them accessible to everyone.
Account abstraction, intent-based systems, cross-chain infrastructure, and AI-powered agents are collectively transforming how users interact with blockchain networks. The focus is moving from technical execution to user outcomes.
The future of DeFi may not be defined by more complexity, more chains, or more protocols. Instead, it may be defined by how effectively the industry can make those complexities disappear, creating a financial system that is both decentralized and effortless to use.
In that future, the most successful DeFi experience may be the one users never realize is DeFi at all.
REQUEST AN ARTICLE
Crypto World
Ethereum Price Prediction: ETH is Still Below Its 200 Week SMA, and Tom Lee Buying Spree Might End Soon
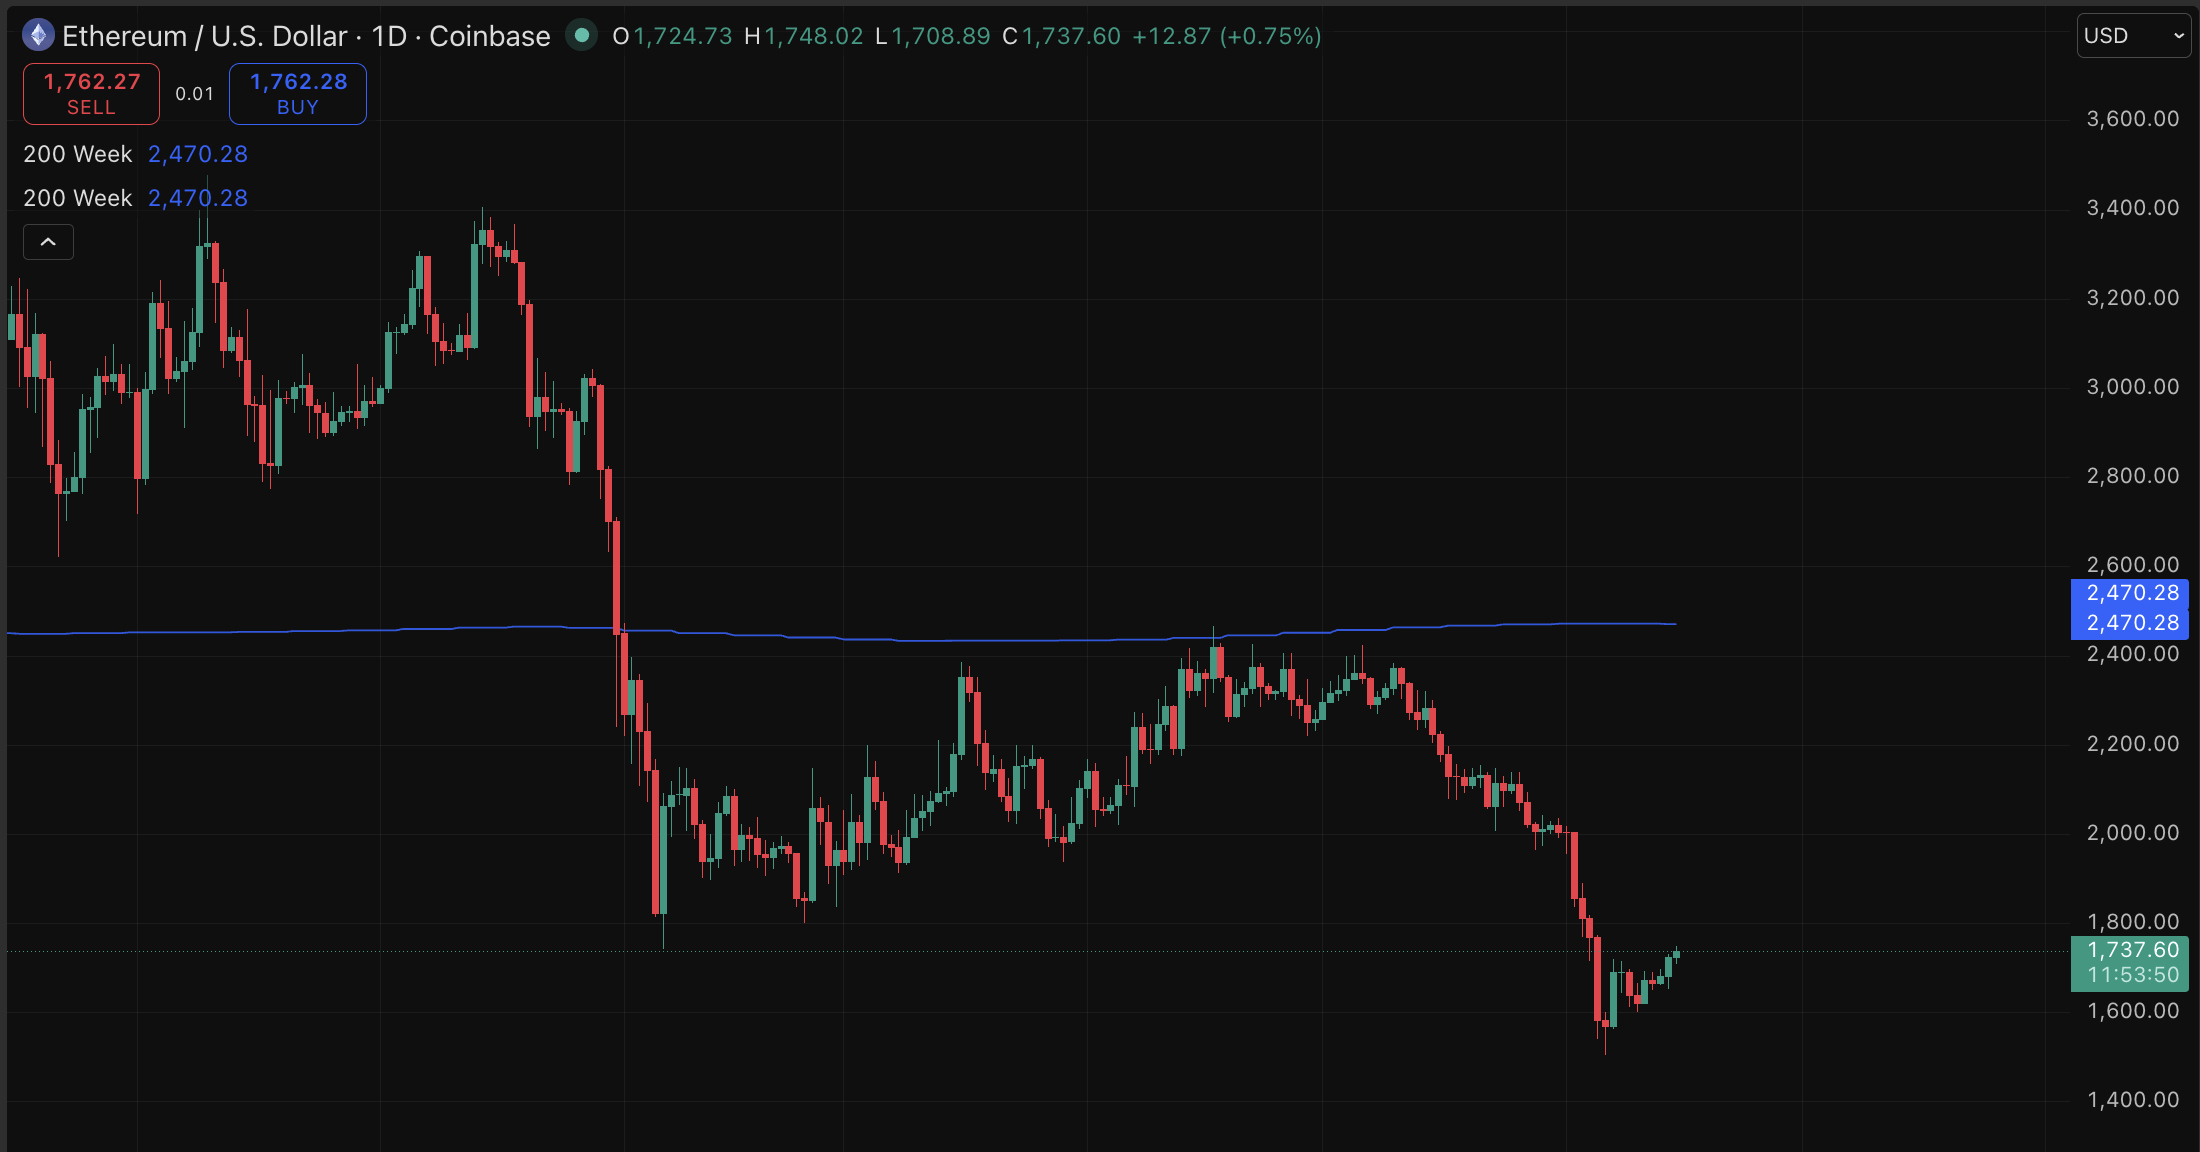
Ethereum price is trading above $1,700 after running for 5% today, and even our prediction model is calling for more leg higher. However, ETH remains pinned below its 200-week simple moving average, a level that historically separates accumulation floors from genuine bull market re-entries.
Tom Lee, after weeks of aggressive buying, is finally closing in on Bitmine 5% supply target. He is getting closer to his target, and Ethereum might lose its support defender.

Ethereum is doing well, but whether this bounce has legs or is simply just a dead-cat bounce is the question every ETH holder is asking.
Discover: The Best Crypto to Diversify Your Portfolio
Ethereum Price Prediction: Reclaim $1,800 Before Momentum Fades?
Spot ETH is closing to $1,800, price is recovering. Key levels are well-defined. Support clusters between $1,600 and $1,665, with the strongest floor sitting at $1,640.02. It’s anchoring its key support at $1,665.
Immediate resistance runs from $1,715 to $1,740. ETH has to close above $1,740 on meaningful volume to open a realistic path toward the $1,840 area that short-term forecasting models flag as a mid-June target.

The macro backdrop matters here, too. Institutional sentiment around the debasement trade has kept crypto broadly bid, but ETH specifically has been an underperformer relative to BTC this cycle. It’s a dynamic that doesn’t resolve on technicals alone.
Staking-related sell pressure has eased, which removes one headwind, but the 200-week SMA overhead remains a significant gravitational ceiling.
Discover: The Best Token Presales
LiquidChain Targets Early-Mover Positioning as Ethereum Tests Structural Resistance
ETH at $1,760 with a $200B market cap and a ceiling at its 200-week SMA is not the setup that generates 10x returns from here, not in the near term. Traders looking for asymmetric exposure during this consolidation window have been rotating toward earlier-stage infrastructure plays where price discovery hasn’t yet occurred.
LiquidChain ($LIQUID) is one project gaining traction in that context. It’s a Layer 3 infrastructure protocol built around a single execution environment that fuses Bitcoin, Ethereum, and Solana liquidity, a genuinely differentiated architecture at a time when cross-chain fragmentation remains one of DeFi’s most persistent friction points.
LiquidChain is always cooking something new.
This is what happens when a great idea meets innovation.pic.twitter.com/qYbth0impA
— LiquidChain (@getliquidchain) June 15, 2026

The project’s Unified Liquidity Layer and Deploy-Once Architecture mean developers write once and access all three ecosystems, which is the kind of structural utility that institutional-grade builders actually care about.
Presale figures as of writing: $0.0147 per $LIQUID, with $840K raised to date.
For traders who want exposure to the infrastructure layer while ETH consolidates overhead resistance, researching LiquidChain is worth the time.
The post Ethereum Price Prediction: ETH is Still Below Its 200 Week SMA, and Tom Lee Buying Spree Might End Soon appeared first on Cryptonews.


Strategy (MSTR) last week acquired 1,587 bitcoin for approximately $100 million, increasing its total holdings to 846,842 BTC, according to a Monday morning filing.
The latest purchase was made at an average price of $63,024 per bitcoin. The company disclosed it had also increased its USD Reserve by $100 million to $1.1 billion via the sale of common stock.
The purchase ran from June 8 to June 14, the same week Strategy raised $209 million by selling about 1.73 million MSTR shares through its at-the-market program.
The reserve is the money Strategy set aside in December 2025 to cover dividends on its preferred shares and interest on its debt. Building it up while continuing to buy bitcoin signals the company is funding both its accumulation and its obligations through equity issuance rather than touching its bitcoin or its cash cushion.
The buy lifts Strategy’s holdings to 846,842 BTC, worth about $56 billion at current prices and bought at an average of $75,656 per coin for a total of around $64 billion. The company remains the largest corporate holder of bitcoin, at roughly 4% of the supply that will ever exist.
Strategy disclosed on June 1 that it had sold 32 bitcoin to fund preferred dividends The company’s shares are up 5% pre market with bitcoin trading above $66,000.
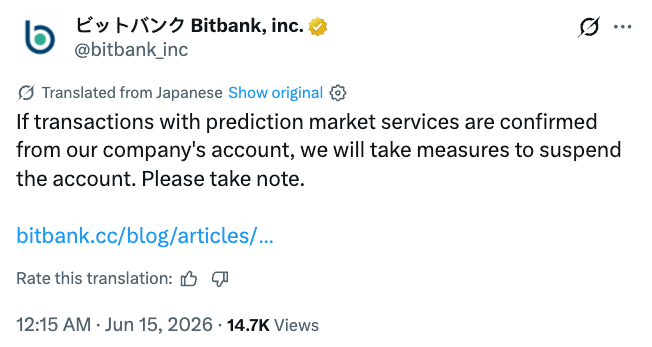
Bitbank, one of Japan’s largest cryptocurrency exchanges, warned users that transactions linked to prediction market platforms such as Polymarket could result in account suspensions due to potential conflicts with the country’s gambling laws.
In a notice published on Monday, Bitbank said it may restrict accounts making deposits or withdrawals connected to prediction market services.
The warning highlights the regulatory uncertainty surrounding prediction markets in Japan, where local gambling laws may complicate Polymarket’s previously stated interest in expanding into the country.
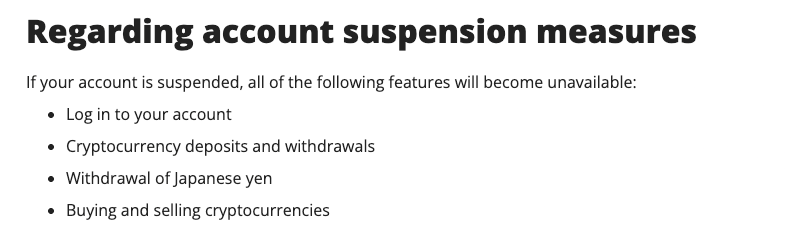
Bitbank warns of sweeping account restrictions
Bitbank said users whose accounts are suspended would lose access to a wide range of services, including account logins, deposits and withdrawals, as well as crypto trading.
“We will not be liable for any damages incurred by our customers as a result of the account suspension measures,” the exchange added.

Source: Bitbank (translated by Google)
The announcement urged customers to exercise caution when using external services and avoid becoming involved in criminal activity or legal disputes.
Bitbank did not cite any specific regulatory action or government directive behind the warning. It said prediction market platforms that allow users to bet on election results, sports outcomes and other future events could be considered gambling under Japanese law when used for financial gain.
Related: SBI eyes Bitbank deal as Japan’s crypto exchange market consolidates
Cointelegraph asked Bitbank what prompted the notice but had not received a response by publication.
Questions emerge as Polymarket eyes expansion
Bitbank’s notice comes as prediction markets face growing scrutiny globally, with regulators in multiple jurisdictions taking action against Polymarket and Kalshi over gambling concerns.
Polymarket currently lists Japan among 35 restricted jurisdictions in its access policy. The company signaled in May that it was exploring expansion in Japan, raising questions about how it may navigate potential conflicts with local gambling laws.
Source: Bitbank
Japan has not issued formal guidance specifically on prediction markets, but Bitbank’s warning indicates that at least some crypto companies are taking a more cautious approach to services that could be classified as gambling.
Magazine: Should users be allowed to bet on war and death in prediction markets?
The gold vs silver trade is no longer moving as one. As a cooling oil trade and a tentative Iran peace deal reshape the macro backdrop, capital is quietly rotating toward one metal and away from the other. The latest positioning data shows the split across precious metals widening.
What looks like a calm market on the surface hides a clear preference underneath. The precious metals trade has started to favor one side, and the reason sits in how each metal relates to oil.
Where the Money Is Actually Going
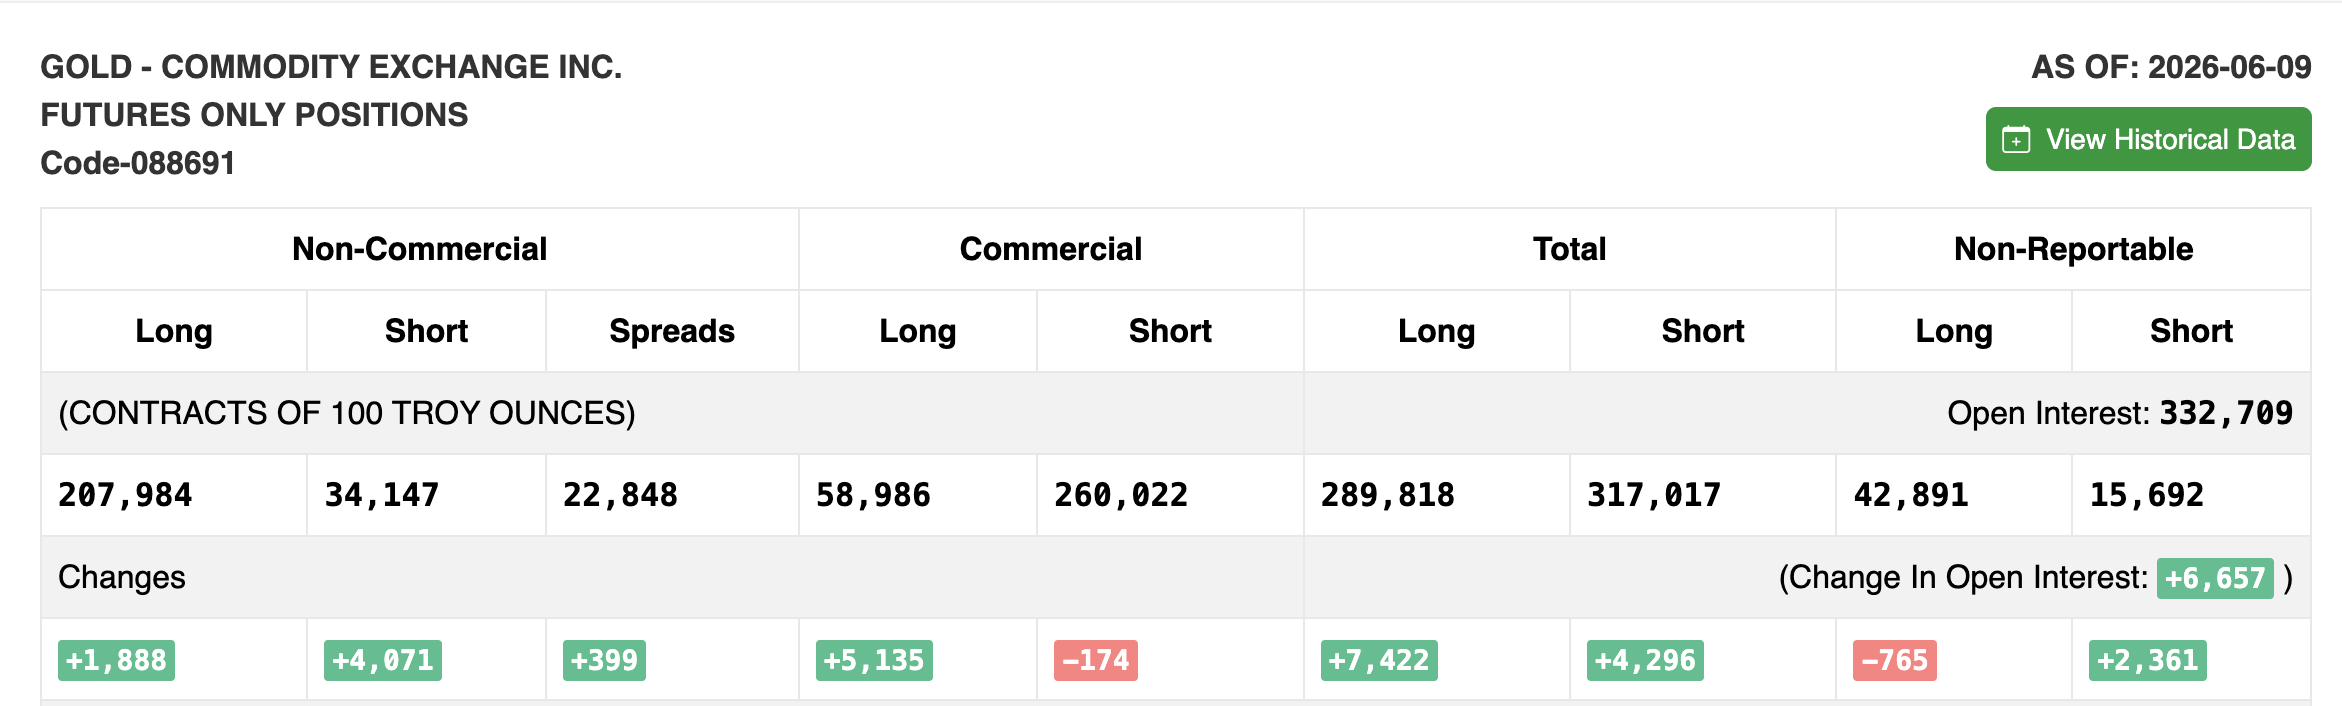
The clearest read comes from the Commitments of Traders report for June 9. This report breaks down how futures traders are positioned. Gold saw broad buying. Non-commercial longs rose 1,888 contracts, commercial longs jumped 5,135, and total open interest climbed 6,657, a build that spanned both speculators and hedgers. Open interest is the total number of contracts still active in the market, so a small rise means little fresh money committed.

Silver told a thinner story. Its non-commercial longs fell 1,446 contracts, and while total longs edged up 1,055, open interest rose just 631. The contrast is the signal. Gold drew conviction buying while silver positioning barely moved. Also gold’s open interest, by contrast, climbed 6,657, nearly ten times more, which shows new capital pouring in rather than traders simply swapping positions.

That divergence sets the tone for the whole precious metals complex. When traders crowd into gold over silver, they favor the metal that behaves like a safe haven over the one tied to industrial demand. The next layer explains why that choice makes sense right now.
Oil Is Quietly Steering the Trade
The reason traces to correlation, or how closely these assets move together. Over the past 30 days, gold and crude oil show a negative correlation of 0.34, meaning gold tends to rise as oil falls. With the Iran deal pulling the oil trade sharply lower, that inverse link is working directly in gold’s favor.
Silver sits in a more conflicted spot. It correlates 0.82 with gold, so the two largely move together, but silver also carries heavy industrial demand, which loosely ties it to the same growth signals that move oil. Also, the silver-oil correlation is way lower at -0.15.

That dual identity dilutes its safe-haven pull exactly when the macro story is about falling energy and easing inflation. A weaker oil trade is a clean tailwind for gold but a mixed message for silver.

The gold silver ratio captures the tilt in a single number. It sits near 61.7, up off its recent lows, and a rising ratio signals a risk-off lean where gold is preferred, while a falling one points to reflation with silver leading.

The direction now favors gold, and relative performance confirms it, with gold holding near the top of the group while oil sits well below.
The Signal That Confirms Gold’s Edge
The options market adds a check, and read carefully, it actually backs the gold side in the gold vs silver debate.
On the gold ETF, the put-call volume ratio rose from 0.73 to 0.78 since June 2. Also, the open-interest ratio edged up from 0.56 to 0.58, a tilt toward puts. That looks bearish at first, but it fits a crowded long. Traders who bought gold aggressively, as the futures data shows, tend to buy downside protection once the position has run, so rising put activity reads as hedging a winning trade rather than betting against it.

Silver’s ETF (SLV) leaned the other way, but only slightly. Its put-call volume ratio fell from 0.44 to 0.40, a small shift toward calls. The open-interest ratio held near 0.53.
Want more insights like this? Sign up for Editor Harsh Notariya’s Daily Newsletter here.
The contrast is telling. On gold, the rising put activity comes alongside the heavy futures buying from the COT data. Therefore, the same metal drawing conviction longs is also the one whose holders are paying for downside protection. That is what a serious, crowded position looks like: money commits, then insures itself. Silver shows neither side of that. Its mild shift toward calls sits on top of flat futures positioning, which points to light speculative interest, a few traders reaching for upside rather than large players building and defending a stake.

Put together, the options confirm the hierarchy rather than break it. Gold is the crowded, hedged trade that money takes seriously, and silver is the lighter side bet. Until that changes, the gold vs silver trade stays leaning toward gold as the defensive metal of choice, with silver lagging unless reflation takes hold and the oil trade turns back up.
The post The Gold vs Silver Debate Picks a Side as the US-Iran Deal Sinks Oil appeared first on BeInCrypto.
Kyle Bevan murder trial LIVE as prison staff found weapons after child murderer stabbed to death ‘by killer trio’ – updates

VIX Plunges 7.86% to 16.29 as US-Iran Peace Deal Triggers Sharp Drop in Market Fear Gauge

Bitcoin may have bottomed at $60,000, says Coinbase (COIN) CEO


-

 Business22 hours ago
No Jackpot Winner as $257 Million Prize Rolls Over to $269 Million Monday Draw
-

 Crypto World4 days ago
Oppenheimer backs SpaceX as $70 billion retail frenzy builds
-

 Crypto World4 days ago
Markets Rally as SpaceX IPO Looms Amid Iran Tensions and Inflation Surge
-

 Fashion3 days ago
Weekend Open Thread: Tuckernuck – Corporette.com
-

 Sports7 days ago
FIFA WC 2026 Group C: Morocco, Scotland challenge Brazil’s hunt for glory | FIFA World Cup 2022
-
 Crypto World14 hours ago
Zimbabwe Requires Crypto Businesses to Register Annually Under New FIU Regulations
-

 Entertainment6 days ago
The Ryan Gosling True Crime Thriller On Netflix That Gets Even Stranger, Stream It Now
-
 Sports6 days ago
Bangladesh beat Australia after 20 years in ODIs, register only their second win over six-time world champions | Cricket News
-

 Tech3 days ago
This Week In Security: Microsoft On Microsoft, Register Your Domains, Linux On ARM, And FreeBSD Joins The File Cache Club
-

 Tech3 days ago
NanoClaw integrates JFrog registries to secure AI agent downloads
-

 Crypto World2 days ago
Bitget enters Argentina’s regulated crypto market through PSAV registration
-

 Politics4 days ago
Politics Home | Healey Resignation Is “Colossal Failure Of Government”, Says Former Labour Defence Secretary
-
 Tech4 days ago
Dutton Ranch star claims they ‘didn’t see any disruption’ on set following Chad Feehan’s exit from Yellowstone spinoff fueled by Taylor Sheridan clash rumors
-
 Tech5 days ago
‘This is Seattle’s position on AI’: City Council votes unanimously to pause big new data centers
-

 NewsBeat4 days ago
El Nino has formed in the Pacific and could set records, forecasters say
-
 Entertainment4 days ago
Donnie Wahlberg & More Heat Up Las Vegas at Circa’s Barry’s Downtown Prime
-

 Sports4 days ago
First Time Since 1971: Australia Register Historic Low In ODI Cricket
-
 Tech4 days ago
Opendoor Ends India Operations, Fueling a Bigger Conversation About AI and Outsourcing
-

 Politics4 days ago
Belfast burns, while Met chief points finger at Iran and Russia
-

 NewsBeat3 days ago
FBI searches office of Ohio voter registration group
You must be logged in to post a comment Login