
Crypto World
Polymarket vs Kalshi: Where are Fans Placing Their FIFA World Cup Predictions?
FIFA World Cup predictions have become the biggest business in prediction markets. Polymarket’s tournament winner market alone holds $2 billion in bets, while Kalshi runs 48 markets on the same question and banks the industry’s largest fees.
The two platforms agree on the football yet split the money in very different ways. BeInCrypto’s Dune dashboards across three venues show where volume, fees, and leftover crypto bets sit.
Sports Built a Record May for Prediction Markets
By Binance Research’s accounting, prediction markets turned over a record $31.2 billion in May, up roughly 15% from January. The same report puts Kalshi at 58% of that flow and Polymarket at 28%, with industry open interest reaching $1.3 billion.
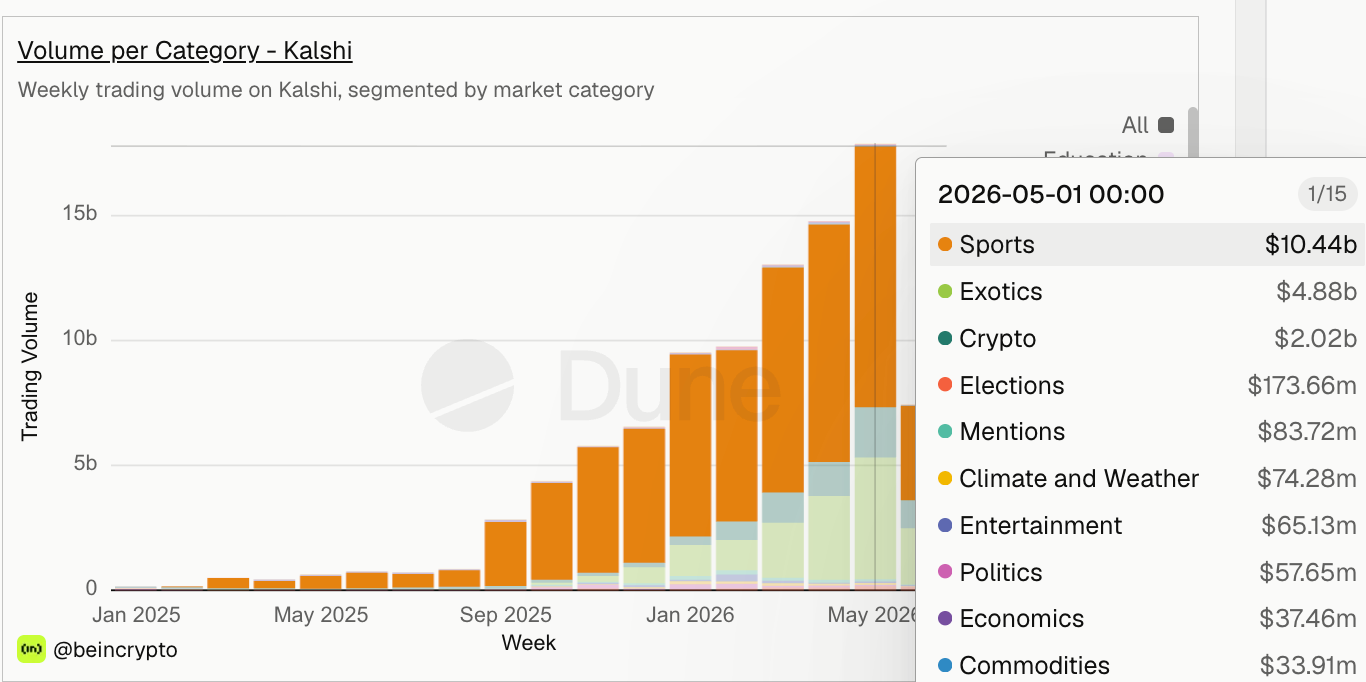
BeInCrypto’s own data shows what filled Kalshi’s share. In the platform’s biggest month of 2026, that is May, sports trading volume reached $10.44 billion.
Elections, the category that made Kalshi famous, managed just $173.66 million that month, roughly 60 times less.

Crypto markets did $2.02 billion on Kalshi in the same period, while a sports-adjacent exotics bucket added $4.88 billion more. The pattern suggests the 2026 World Cup calendar, not politics or coin prices, now powers the platform’s growth.
Note: All weekly data points have been condensed into monthly data points.
June is already seeing Sports lead the way. And with almost the entire World Cup fixture to go, this figure might surge. It is worth mentioning that the Elections category on Kalshi is already nearing its May levels. This category might therefore steal some of Sports’ thunder.

The single biggest football market shows how concentrated that engine is.
One $2 Billion Market Against 48 Smaller Ones
Polymarket’s World Cup Winner market holds $2 billion in lifetime volume, $436 million in liquidity, and traded $137 million on Thursday alone. The platform’s FIFA World Cup section spans more than 330 active markets.

Kalshi’s equivalent event has built $182.3 million across 48 markets. On the largest listed events, the gap runs roughly 11 to 1 in Polymarket’s favor, and Thursday’s flow on Polymarket alone approached the lifetime volume of Kalshi’s biggest listed World Cup event.

The venues disagree on structure, not on football. Both books price the World Cup odds identically, with Spain favorite at exactly 17% and Kalshi paying 5.56x on Spain and France alike.
Kalshi spreads flow across dozens of match-level books while Polymarket pools it in one tournament-scale market. Kalshi still clears more total volume platform-wide, per Binance Research’s 58% share, so the contest is breadth against depth rather than big against small.
That concentration shows up across Polymarket’s entire year.
Sports have Led Polymarket All Year, and It’s Cooling
Sports topped every weekly category split on Polymarket in 2026. January saw sports at $6.20 billion, or 43% of the $14.34 billion total, ahead of politics at $4.49 billion and crypto at $3.65 billion.
Note: All weekly data points have been condensed into monthly data points.

The peak came in March, when sports did $8.77 billion of a record $19.58 billion in a month. By June this time, the total had cooled about 70% to $5.91 billion, yet the sports share climbed to 56.5%. Crypto held $1.73 billion and politics shrank to $831.25 million.

In other words, football dominance is not a tournament artifact. It predates the World Cup hype, and it deepens even as overall activity cools into the group stage.
Volume tells half the story. The fees tell the rest.
Kalshi Takes the Fees, Opinion Shows the Endgame
In May, Kalshi collected $137.86 million in trading fees, compared with Polymarket’s $28.07 million and Opinion’s $159,330. That is nearly a five-to-one revenue gap, consistent with Binance Research’s finding that Kalshi clears the most volume.

The dashboard tracks Kalshi fees from April onward, and both tracked months sit far above anything Polymarket has earned. So the betting money splits two ways, but the fee money flows overwhelmingly to Kalshi.
The smaller venue Opinion shows where this trend ends. In January, crypto led the platform with $729.52 million of a $1.46 billion week.
Note: All weekly data points have been condensed into monthly data points.

By the week of June 1, sports accounted for 99.4% of activity, while crypto fell below $500,000. FIFA World Cup predictions did not just grow there; they replaced the categories on which prediction markets were built.

The surprises stack up. Sports have now beaten crypto on every venue tracked, including the crypto-native ones, and politics collapsed to a rounding error barely a year after carrying the industry.
The platforms agree completely on the football, both pricing Spain. Most striking, the record May arrived while overall activity was already cooling.
What happens next decides the FIFA World Cup predictions race. Daily group-stage games favor Kalshi’s match-level structure, while knockout drama should feed Polymarket’s deep tournament pool, so the lead may change hands week by week.
Traders should watch whether kickoff revives total volume, whether the rebounding elections category claws share back from sports, and whether open interest keeps building into the knockouts.
If the group stage cannot reverse the slowdown, the prediction market boom will have peaked before the first whistle.
The post Polymarket vs Kalshi: Where are Fans Placing Their FIFA World Cup Predictions? appeared first on BeInCrypto.


James’ office described Kalshi’s event contracts as bets and said the platform takes wagers on professional and college sports, elections and culture. The lawsuit alleges Kalshi allows users aged 18 to 20 to wager and lists markets involving New York college teams, both prohibited for licensed sportsbooks in the state.
“New York’s gambling laws protect children from underage betting and help combat gambling addiction,” James said in the statement. “No matter what they call themselves, prediction markets like Kalshi are gambling platforms, plain and simple.”
The World Cup helped boost Kalshi’s numbers, adding 3 million during the course of the tournament, according to CNBC. That’s more than double the 2 million the firm said it had at the start of May.
According to the attorney general’s statement, the lawsuit follows an October cease-and-desist order from the New York State Gaming Commission.
A federal judge denied Kalshi’s bid to block state regulators on July 7 and rejected an injunction pending appeal on July 27.
CoinDesk approached Kalshi for comment outside of regular U.S. office hours, and had not heard back by publication time.


- Bybit’s new simulator previews both Dual Asset settlement outcomes clearly.
- Redesigned interface reduces steps needed to compare terms and place orders.
- VIP-tier products with enhanced APR rates open to all users every Friday.
Bybit said on Friday that it had upgraded its Dual Asset product with a new investment simulator, a simplified interface and broader access to products carrying VIP-tier annual percentage rates.
The Dubai-based company, which describes itself as the world’s second-largest cryptocurrency exchange by trading volume, said the changes are intended to make the short-term structured investment product easier to understand and use.
Bybit Dual Asset is a non-principal-protected product that allows users to set a target price for buying or selling cryptocurrency.
Investors earn APR rewards on their principal at settlement, regardless of whether the selected target price is reached.
A simulator for settlement outcomes
The main addition is a simulator that lets users preview potential outcomes before placing an order. Traders can choose a token from a searchable list, enter their investment amount and select from the available durations.
The tool displays the two possible settlement scenarios side by side in a single illustration, giving users a clearer view of the product’s possible outcomes.
A “Match My Assets” filter also highlights coins based on a user’s existing holdings.
Bybit said this feature is designed to make product selection more efficient. Users can reach the simulator by switching on “Beginner Mode” under “Choose Product Plan”.
The company has also redesigned the wider Dual Asset interface. The updated layout reduces the number of steps needed to compare product terms and place an order.
VIP products open to all on Fridays
Bybit is also expanding access to Dual Asset products previously limited to VIP customers. Every Friday, all users will be able to access selected VIP-exclusive products with enhanced APR rates without holding a VIP membership.
The weekly access window extends the higher-rate offering to a broader section of the exchange’s user base while retaining the existing product structure.
Bybit said users can earn a competitive yield when a target trade is executed, settling at the preset price while also receiving APR rewards.
The product may also allow users to buy at a lower price or sell at a higher price than through a direct trade when the target price is reached.
When the target is not triggered, users receive their principal back together with the APR rewards accrued during the investment period.
The company noted, however, that the product remains non-principal-protected and that terms, eligibility requirements and potential restrictions apply.


The political heat around Donald Trump’s crypto holdings is translating into pressure across politically linked digital assets. The official TRUMP crypto token trades at $1.45, down 0.3% over the past 24 hours and 9.4% during the last seven days.
Sen. Elizabeth Warren cited a fresh Echelon Insights survey showing 55% of voters disapprove of Trump’s cryptocurrency earnings. Meanwhile, 44% said they strongly disapprove. Another Progressive Policy Institute and GBAO survey found 71% to 75% support banning federal officials and their families from profiting from crypto, even after respondents were reminded that Trump is a successful businessman.
Federal disclosures indicate Trump earned roughly $1.2 billion to $1.4 billion from crypto ventures over the past year. Warren argues those gains came while many Americans still struggle to cover everyday expenses. As a result, the issue has become a growing political flashpoint instead of a niche crypto debate.
What this polling momentum means for regulatory risk is the real market story. If public disapproval turns into legislative action, politically branded tokens could face added pressure. That would make political sentiment a direct pricing factor instead of simple market noise.
Discover: The Best Crypto to Diversify Your Portfolio
Can TRUMP Crypto Token Hold Key Levels as Political Headwinds Mount?
TRUMP trades at $1.45, hovering near the lower end of its $1.44 to $1.47 daily range. The $1.44 area is acting as immediate support. A decisive break below that level could send the token toward the psychological $1.40 mark. Meanwhile, light trading volume leaves room for sharp moves in either direction.
The approval data continues to weigh on sentiment. Emerson College polling puts Trump’s crypto-specific approval at 25%, while 39% disapprove. Those readings have stayed largely unchanged across multiple survey cycles. In addition, 62% of Americans distrust the Trump administration on crypto regulation. Another 89% of Democrats said they would oppose candidates supporting Trump’s crypto profits.
The bull case remains intact if regulatory gridlock keeps enforcement limited. In that scenario, TRUMP could rebound toward $1.47 and pressure short sellers. The base case points to continued trading between $1.44 and $1.47 as markets wait for a legislative catalyst.
The bear case changes if Congress advances a bill targeting presidential crypto conflicts. That could quickly push TRUMP toward $1.35 as political risk increases.
Trade Memecoins on Bybit and Get a Chance to Win Our $1,000 USDT Airdrop
Maxi Doge Targets Early Mover Upside as Trump Tests Key Levels
Trump grinding sideways with no clear breakout catalyst is, frankly, the argument for looking earlier on the risk curve. Established meme tokens at this market cap require macro tailwinds and viral momentum simultaneously — a rare combo. Early-stage presales offer asymmetric entry before either ingredient is needed.
Maxi Doge ($MAXI) is positioning itself as the trading community’s meme token, built around a 240-lb canine juggernaut persona and a culture of 1000x leverage trading energy. The tagline is “Never skip leg-day, never skip a pump,” which is either peak meme or quietly brilliant marketing.
The presale has raised $4.8 million at a current price of $0.0002831 on Ethereum. Features include holder-only trading competitions with leaderboard rewards, a Maxi Fund treasury for liquidity and partnerships, and dynamic staking APY for early participants.
The meme-first, gym-bro aesthetic is deliberate, with viral humor having driven more meme token breakouts than any whitepaper.
Traders with a meme allocation looking for early-stage exposure can research Maxi Doge here.
Discover: The Best Token Presales
The post Trump Crypto Empire Under Fire After Poll Shows Majority Disapprove appeared first on Cryptonews.
This Friday, we examine Ethereum, Ripple, Cardano, Binance Coin, and Hyperliquid in greater detail.
Ethereum (ETH)
Ethereum’s price remained flat compared to last week because sellers stopped the rally at the $2,000 resistance and pushed it into a pullback. At the time of this post, ETH was found around $1,890, and it may retest the support at $1,800 next.
Despite the recent gains from $1,500, this cryptocurrency remains in a macro downtrend with clear lower lows and lower highs. If buyers want to put a stop to this, they need to turn $2,000 into support.
Looking ahead, Ethereum may be consolidating between $2,000 and $1,800 until a clear breakout takes place. Bulls will also have to do their best to stop any price below $1,800 to avoid new lows.

Ripple (XRP)
XRP fell by 3% this week and is back just above the $1 support level. This price action has also formed a pennant. That could highlight a continuation of the prevailing trend once the asset escapes it. In this case, that’s bearish.
The volume also continues to fall and is making clear lower lows. That’s not encouraging if buyers hope to reverse the ongoing downtrend. A break below $1 would settle the matter and see XRP make new lows, with $0.80 as a key target.
Looking ahead, best to wait for the pennant to break and then reassess. Until that happens, the price will compress at the apex of this formation before it escapes.

Cardano (ADA)
ADA managed to close this week in the green, albeit with only a 2% gain. Still, the support at $0.15 has been reconfirmed, and this cryptocurrency has a good shot at moving towards $0.20. Eventually, the resistance at $0.23 must be reclaimed to turn bullish.
Because the most recent push higher has been on low volume, this shows buyers remain weary and will need to see more gains before they gather sufficient confidence to step up their presence on the orderbook.
Looking ahead, Cardano may be about to exit a very difficult period between 2025 and 2026 when the price went from $1.2 to $0.14. To do that, ADA will have to hold above $0.15 and aim for $0.23 next.

Binance Coin (BNB)
Binance Coin is up 4% this week after buyers managed to take it above the support at $580. As long as this key level holds, bulls have the upper hand, and they may be aiming for $690 next, which is the key resistance.
At the time of this post, the ongoing uptrend is still early, and sellers could at any time reverse it. Therefore, best to wait for a confirmation of this breakout to avoid a bull trap scenario.
Looking ahead, BNB could continue to consolidate between $580 and $690. If so, the drop under $580 could be interpreted as a short-term deviation in the price action.

Hyperliquid (HYPE)
Similar to last week, HYPE disappointed again with a price that closed in red and lost 7% of its valuation. More concerning, however, is the fact that this cryptocurrency appears to have lost its uptrend.
The support at $60 has now turned into a resistance and HYPE is well on its way to test the next support at $52. If both these levels are lost in quick succession that’s an extremely bearish signal that hints at a major correction.
Looking ahead, it is becoming clearer that Hyperliquid’s best days may be behind it after the price topped around $76. Since then, it’s been down only. Should $52 not stop sellers, then the next key support will be found at $45.

The post Crypto Price Analysis July-31: ETH, XRP, ADA, BNB, and HYPE appeared first on CryptoPotato.

Real-world asset (RWA) perpetual futures are starting to look less like a side experiment and more like a meaningful part of crypto derivatives. Data shared by Talos indicates that, over the past week, trading volume in RWA-linked perpetuals on major venues came close to Bitcoin perpetuals—an outcome that underscores how quickly tokenized finance is finding a home in onchain markets.
Talos estimates that tracked seven-day volume across RWA perps reached $61.7 billion as of a Thursday snapshot, equivalent to 99.2% of Bitcoin perpetual volume on Hyperliquid and Binance, the two venues where most of the activity is concentrated. Equity-linked contracts made up the largest share at 57.8%, followed by commodities at 28.2%.
Key takeaways
- RWA perpetuals nearly match Bitcoin perpetuals—tracked seven-day RWA perp volume was $61.7 billion, or 99.2% of Bitcoin perp volume on Hyperliquid and Binance.
- Equities dominate the RWA mix, accounting for 57.8% of RWA perp volume, while commodities represent 28.2%.
- Hyperliquid leads the category, reporting $25.1 billion in RWA perpetual trading volume for July 13–19.
- Tokenized RWA activity is expanding beyond trading, with onchain RWA value cited at about $36.8 billion excluding stablecoins (per RWA.xyz).
- RWA perps still remain a fraction of overall derivatives, with tracked RWA perpetuals at roughly 7.5% of total futures volume over the same seven-day period.
RWA perpetuals surge toward parity with Bitcoin derivatives
The acceleration in RWA perpetual futures is notable because it reflects demand for tradable exposure to tokenized assets—equities, commodities, and other instruments—using the same core mechanics that have driven much of crypto’s derivatives growth.
According to Talos, the combined seven-day volume of tracked RWA perps was $61.7 billion, representing 99.2% of Bitcoin perpetual volume across Hyperliquid and Binance. The breakdown highlights that traders have leaned most heavily into tokenized equity exposure, with 57.8% of the RWA perp tally linked to equity contracts. Commodities accounted for 28.2% of volume, while the remainder came from other categories including indexes.
Talos also frames the activity as broadly aligned with the current market concentration: Hyperliquid and Binance capture the majority of perp trading for these instruments, making them the key venues to watch for continued RWA derivatives traction.
Hyperliquid posts a clear lead as RWA contracts diversify
Venue-level data further clarifies where liquidity is forming. Hyperliquid recorded $25.1 billion in RWA perpetual trading volume during the week of July 13 to July 19—more than the combined volume of all other perpetual categories on its platform during that period, based on Talos’ reporting.
That performance is consistent with a broader narrative from market participants who argue onchain perpetuals offer structural advantages over traditional, expiry-based products. Pantera Capital previously suggested that perpetual futures could evolve into a dominant trading instrument beyond crypto, pointing to factors such as 24/7 trading, the absence of contract expiries, easier position management, and continuous price discovery (earlier coverage referenced by the article).
As for the composition during the early days of the current week, Talos’ dashboard shows RWA perpetual trading volume already at $37.2 billion, exceeding Bitcoin perpetual volume by about 9%. In that same snapshot, equity-linked contracts were $22.8 billion, commodities were $9.1 billion, and indexes were $4.2 billion. ETFs contributed about $338 million, while foreign exchange, pre-IPO, and other RWA contracts made up the remainder.
Why traders and platforms are leaning into tokenized assets
Beyond the perps themselves, the ecosystem backdrop also matters. The article cites RWA.xyz for the claim that the value of onchain RWAs has grown to about $36.8 billion, excluding stablecoins. While that figure is separate from derivatives volume, it provides context for why tokenized instruments are becoming more frequently used in trading strategies rather than simply being held or settled.
Crypto exchanges are also expanding past “pure” crypto listings, increasingly offering tokenized stocks and commodities alongside digital assets. This kind of product expansion can reduce friction for mainstream participants—particularly those already familiar with equity and commodity exposure—while also giving crypto-native traders additional instruments to hedge, speculate, or rotate into.
Circle co-founder and CEO Jeremy Allaire tied this momentum to a market narrative shift in an X post dated July 24, suggesting that rising RWA trading on Hyperliquid indicates crypto markets are moving “away from speculating on endogenous digital commodities.” While that framing is opinion, it aligns with the measurable trend Talos reports: RWA-linked perp activity is large enough to meaningfully compete with the scale of Bitcoin perpetuals on major venues.
Regulatory pressure and the “24/7” question for traditional markets
As onchain perpetuals grow in importance, traditional finance is starting to engage more directly with how regulation should treat blockchain-based markets. Intercontinental Exchange CEO Jeffrey Sprecher, whose company owns the New York Stock Exchange, has urged regulators to create a “level playing field” for 24/7 onchain perpetual futures—arguing that market structure should not block development of blockchain-based trading (referenced by the article’s link).
The central tension is that perpetual futures are built around continuous trading and perpetual exposure, while many legacy market products are tied to standardized trading sessions and defined product mechanics. If onchain platforms continue to deepen liquidity in tokenized instruments, regulators may face increasing pressure to define how such venues and products should be supervised, including issues around participant access, disclosures, and market integrity.
That said, Talos’ figures also imply that RWA perpetuals are still early relative to the full derivatives universe. The article states that aggregate futures trading volume across tracked platforms was about $821.4 billion over the past seven days, with tracked RWA perpetuals accounting for roughly 7.5% of that total—large enough to matter, but not yet dominant.
Going forward, traders and builders should watch whether weekly RWA perp volume can sustain the momentum indicated by Talos’ early-week snapshot (already $37.2 billion, ahead of Bitcoin perps by about 9%) and whether Hyperliquid’s outsized RWA activity persists as more venues potentially deepen liquidity. The bigger question for the market is whether RWA derivatives continue to move from experimental exposure into a durable, mainstream trading category—especially as regulators decide how to handle 24/7 onchain perpetual futures.

I also reached out to Lisa Fucito, a professor of psychiatry at Yale and the director of the Tobacco Treatment Service at Smilow Cancer Hospital.“Alcohol, cannabis, and other psychoactive substances do not address the behavioral and cognitive processes that perpetuate insomnia,” she said. “While these substances may provide short-term sedation, their sleep effects tend to diminish with tolerance in as little as a few days and can worsen sleep continuity and quality.” Tolerance can develop within days, and is often followed by rebound sleep disruption in the second half of the night.
As a psychologist, I venture that most people who use substances to sleep are trying to help, not harm, themselves. They are likely not informed about the potential damaging effects of these substances or their ineffectiveness.
The research evidence overwhelmingly supports that cognitive behavioral therapy is a safer, more effective long-term solution for many sleep difficulties, even if it lacks the appeal of a quick fix. This can help address the root cause of behaviors such as spending excessive time in bed awake, maintaining irregular sleep schedules, and conditioned arousal such as worrying about sleep.

IBM CEO Arvind Krishna said quantum computing will measurably affect the company’s revenue and earnings by 2028 or 2029. He projected $1 trillion in value from the technology by the end of the 2030s.
The forecast signals quantum hardware is commercializing faster than many Bitcoin (BTC) holders assumed. Roughly a third of the supply remains exposed to a future quantum attack.
Quantum Gets an Earnings Date
Krishna made the comments on Thursday on CNBC.
“I think that in 2028 or 2029, you’ll see it have a measurable impact on our top line and bottom line. By the end of the 2030s, we are now pretty convinced this is a trillion dollars of value,” he said.
The remarks came the same day IBM and Algorithmiq said they had demonstrated what they called quantum advantage. The firms reported that a quantum computer outperformed leading classical computing methods on a specific simulation task.
“It demonstrates that quantum computers can provide trusted solutions more efficiently, more cheaply, or more accurately than leading classical compute methods — which has long been considered a key milestone in the field,” the team noted.
Follow us on X to get the latest news as it happens
Bitcoin’s Quantum Defense Clock Keeps Shrinking
Quantum machines cannot break encryption today, but their pace of progress is what security planners act on. Google Quantum AI’s findings from March slashed the qubit count needed to break elliptic curve cryptography by roughly 20-fold, to under 500,000.
Meanwhile, the exposure is substantial. Over 34% of Bitcoin’s supply is held in addresses with publicly revealed keys, per the BIP-361 proposal. That equals roughly 6.8 million BTC, worth about $437 billion at press time.
However, Bitcoin still lacks an agreed migration path. Developers merged BIP-360 into the proposal repository in February, while the broader BIP-361 draft remains contested.
Nonetheless, institutional money has started to respond. Galaxy Digital launched its Bitcoin Quantum Readiness Initiative on July 21, committing up to $5 million in developer grants.
Coinbase also set up an Independent Advisory Board on Quantum Computing. Both firms are among nine founding members of the Bitcoin Security Consortium, which pledged $15 million alongside BlackRock, Fidelity Digital Assets, and Strategy.
Subscribe to our YouTube channel to watch leaders and journalists provide expert insights
The post Bitcoin’s $437 Billion Quantum Exposure Meets IBM’s 2028 Deadline appeared first on BeInCrypto.


New York has sued Kalshi, seeking to block its prediction markets and recover at least $36 billion in penalties and restitution over alleged violations of the state’s gambling laws.
Summary
- New York has sued Kalshi, seeking to block its prediction markets and recover at least $36 billion in penalties and restitution.
- State officials alleged Kalshi offered unlicensed gambling products and allowed underage users to access its markets.
- The lawsuit came days after a federal judge refused to stop New York from enforcing its gambling laws against Kalshi.
According to the New York Attorney General’s Office, Attorney General Letitia James filed the lawsuit on Friday, asking the court to stop Kalshi from operating prediction markets in the state and require the company to pay restitution to affected users along with civil penalties.
The complaint alleges that Kalshi has been offering event contracts tied to sports, elections and cultural events without obtaining a license from the New York State Gaming Commission. State officials argue those contracts fall within New York’s legal definition of gambling rather than federally regulated derivatives.
New York also alleged that Kalshi allowed residents under the state’s legal gambling age of 21 to participate in its markets, exposing them to financial risks while bypassing consumer protections required under state law. The lawsuit further accused the platform of avoiding taxes associated with gambling operations.
Filed alongside the complaint, New York’s motion for a temporary restraining order asks the court to immediately halt Kalshi’s relevant event contracts in the state. The filing also seeks restitution for users, disgorgement of revenue earned through the offerings, treble damages and an additional $100,000 penalty for each offering.
Court filings cited by the attorney general’s office estimate that the requested compensatory damages could reach at least $36 billion, subject to a complete accounting of Kalshi’s business in New York.
“Kalshi has chosen to ignore New York’s gaming laws, which exist to protect consumers, prevent problematic gambling, deliver funding for critical public services, and ensure that every company plays by the same rules,” New York Governor Kathy Hochul said in a statement released by the attorney general’s office.
Attorney General Letitia James also defended the lawsuit, saying, “New York’s gambling laws protect children from underage betting and help combat gambling addiction. No matter what they call themselves, prediction markets like Kalshi are gambling platforms, plain and simple.”
New York has expanded its legal challenge against Kalshi
The latest lawsuit follows several months of legal disputes between New York regulators and Kalshi over whether the company’s sports-related event contracts fall under federal commodities law or state gambling rules.
Earlier this week, U.S. District Judge Analisa Torres again declined Kalshi’s request for emergency relief while its appeal continues before the Second Circuit.
As previously reported, Torres denied Kalshi’s request for an injunction pending appeal on July 27 after concluding that the company had not satisfied the higher legal standard required for emergency relief. The judge also rejected Kalshi’s request for short-term administrative protection from New York enforcement.
Her decision followed an earlier July 7 ruling that found the Commodity Exchange Act was unlikely to preempt New York’s gambling laws as applied to Kalshi’s sports-event contracts. Kalshi appealed that ruling to the U.S. Court of Appeals for the Second Circuit, where the case remains pending.
In rejecting the emergency request, Torres said Kalshi’s claim that compliance with New York law could jeopardize its federal registration was speculative. She also found that the company’s expected compliance costs were largely financial and therefore did not amount to irreparable harm under the legal standard for an injunction pending appeal.
The judge further declined to rely on the Commodity Futures Trading Commission’s proposed June rule on prediction markets. Although the proposal states that the Commodity Exchange Act expressly preempts conflicting state laws for transactions on CFTC-registered exchanges, Torres said courts must independently interpret federal statutes under the Supreme Court’s Loper Bright decision because the proposal has not become a final rule.
The CFTC has continued pressing its federal jurisdiction argument
Separate from New York’s lawsuit, the Commodity Futures Trading Commission filed its own motion for a temporary restraining order on Thursday seeking to prevent New York from pursuing criminal or civil enforcement against Kalshi and other CFTC-registered prediction market platforms.
The regulator has argued in multiple cases that Congress gave it exclusive authority to oversee federally registered event-contract markets and that states should not regulate products listed on designated contract markets.
That position remains central to Kalshi’s appeal as the company continues arguing that its contracts fall within the CFTC’s exclusive jurisdiction under the Commodity Exchange Act.
The commission has also proposed a new regulatory framework that would establish a contract-by-contract review process for event contracts involving gaming, unlawful conduct, war, terrorism and assassination. The proposal’s public comment period closed on July 27, but the agency has not announced when it will issue a final rule.
Courts across the U.S. have reached different conclusions on prediction markets
New York’s latest action comes as courts around the country continue issuing conflicting rulings on prediction markets.
Only days ago, Judge Katherine Menendez temporarily blocked Minnesota from enforcing its new prediction market ban against CFTC-registered designated contract markets, including Kalshi and Polymarket US, before the law’s Aug. 1 effective date.
In that case, Menendez found that the plaintiffs were likely to succeed, at least in part, on their argument that the Commodity Exchange Act gives the CFTC exclusive jurisdiction over qualifying swaps traded on federally registered exchanges. At the same time, she emphasized that the ruling was only preliminary and did not establish that every prediction market contract offered by Kalshi or Polymarket qualifies for federal protection.
Menendez also noted that permanent relief could ultimately apply to fewer contracts after a detailed review because some event contracts may not meet the legal definition of swaps.
Minnesota Attorney General Keith Ellison has said the state will continue defending its law, maintaining that prediction markets constitute gambling and that Minnesota has authority to regulate unlicensed gambling activity.
Other states have taken a different path. Last month, a Michigan judge temporarily barred Kalshi from offering sports-related event contracts in the state, while a Washington court granted similar temporary relief last week after concluding that the platform was operating illegal gambling activities under state law.
Earlier this year, the Third Circuit ruled that New Jersey could not regulate Kalshi’s sports-event contracts because they fell within the CFTC’s exclusive jurisdiction. New York federal courts, however, have adopted a narrower interpretation of federal preemption, leaving the legal dispute unresolved as multiple appeals continue.
The outcome of Kalshi’s pending Second Circuit appeal, together with the CFTC’s future rulemaking and the growing number of state lawsuits, is expected to determine how far states can regulate prediction market platforms operating under federal registration.

Coinkite, the Canadian company behind the Coldcard hardware wallet, has warned users that Bitcoin funds may be at risk if their wallet seed was generated on certain affected firmware versions.
The company said the issue affects every Mk3 firmware release since version 4.0.1, released in March 2021, and is linked to the device-generated entropy used when creating seeds.
Funds Still at Risk
Seeds generated on Mk4 and Mk5 before firmware version 5.6.0, and on Q before version 1.5.0Q, are also affected, although Coinkite said the impact on those models is less severe but remains serious. According to the company, affected seeds have around 72 bits of entropy instead of the expected 128 bits. According to the update, TAPSIGNER, OPENDIME, and SATSCARD are not affected because they use different codebases.
Coinkite urged users with affected ones to migrate their funds to a newly generated seed on an unaffected device. The company said Mk4 and Mk5 users should first upgrade to firmware version 5.6.0 or later, while Q users should install version 1.5.0Q or later before generating a replacement seed.
Users were also advised to back up and verify the new seed, confirm a new receive address on the device, and send a small test transaction before moving the remaining funds. If the Mk3 is the only available option, it suggested temporarily using a strong, unique BIP-39 passphrase and carefully verifying the wallet fingerprint and receive address.
Large Scale Theft
The advisory came after several reports emerged on July 30 that Bitcoin had been drained from Coldcard wallets. Atlas21 reported that an automated operation swept 500 single-signature addresses across four consecutive blocks, from 960188 to 960191. The transactions moved 1,324 UTXOs totaling 594.5 BTC, which is worth around $38 million at current prices. Evidence pointed to weak private keys generated when the wallets were created.
No multisig or Taproot wallets were among the victims.
The median loss was 0.41 BTC, while 110 victims lost more than one Bitcoin. The largest loss was 29.9 units of the crypto asset, while the operation cost about 0.044 units in transaction fees. Atlas21 said the first public warning came from a victim on Reddit, who said their Coldcard had generated the 24-word seed phrase in 2021 and that the seed had never been entered on a computer.
Despite the massive drain, Bitcoin’s price remained unfazed as it continued to trade near $64,000.
The post Coldcard Mk3 Users Warned of Risk After 594 BTC Swept From 500 Addresses appeared first on CryptoPotato.
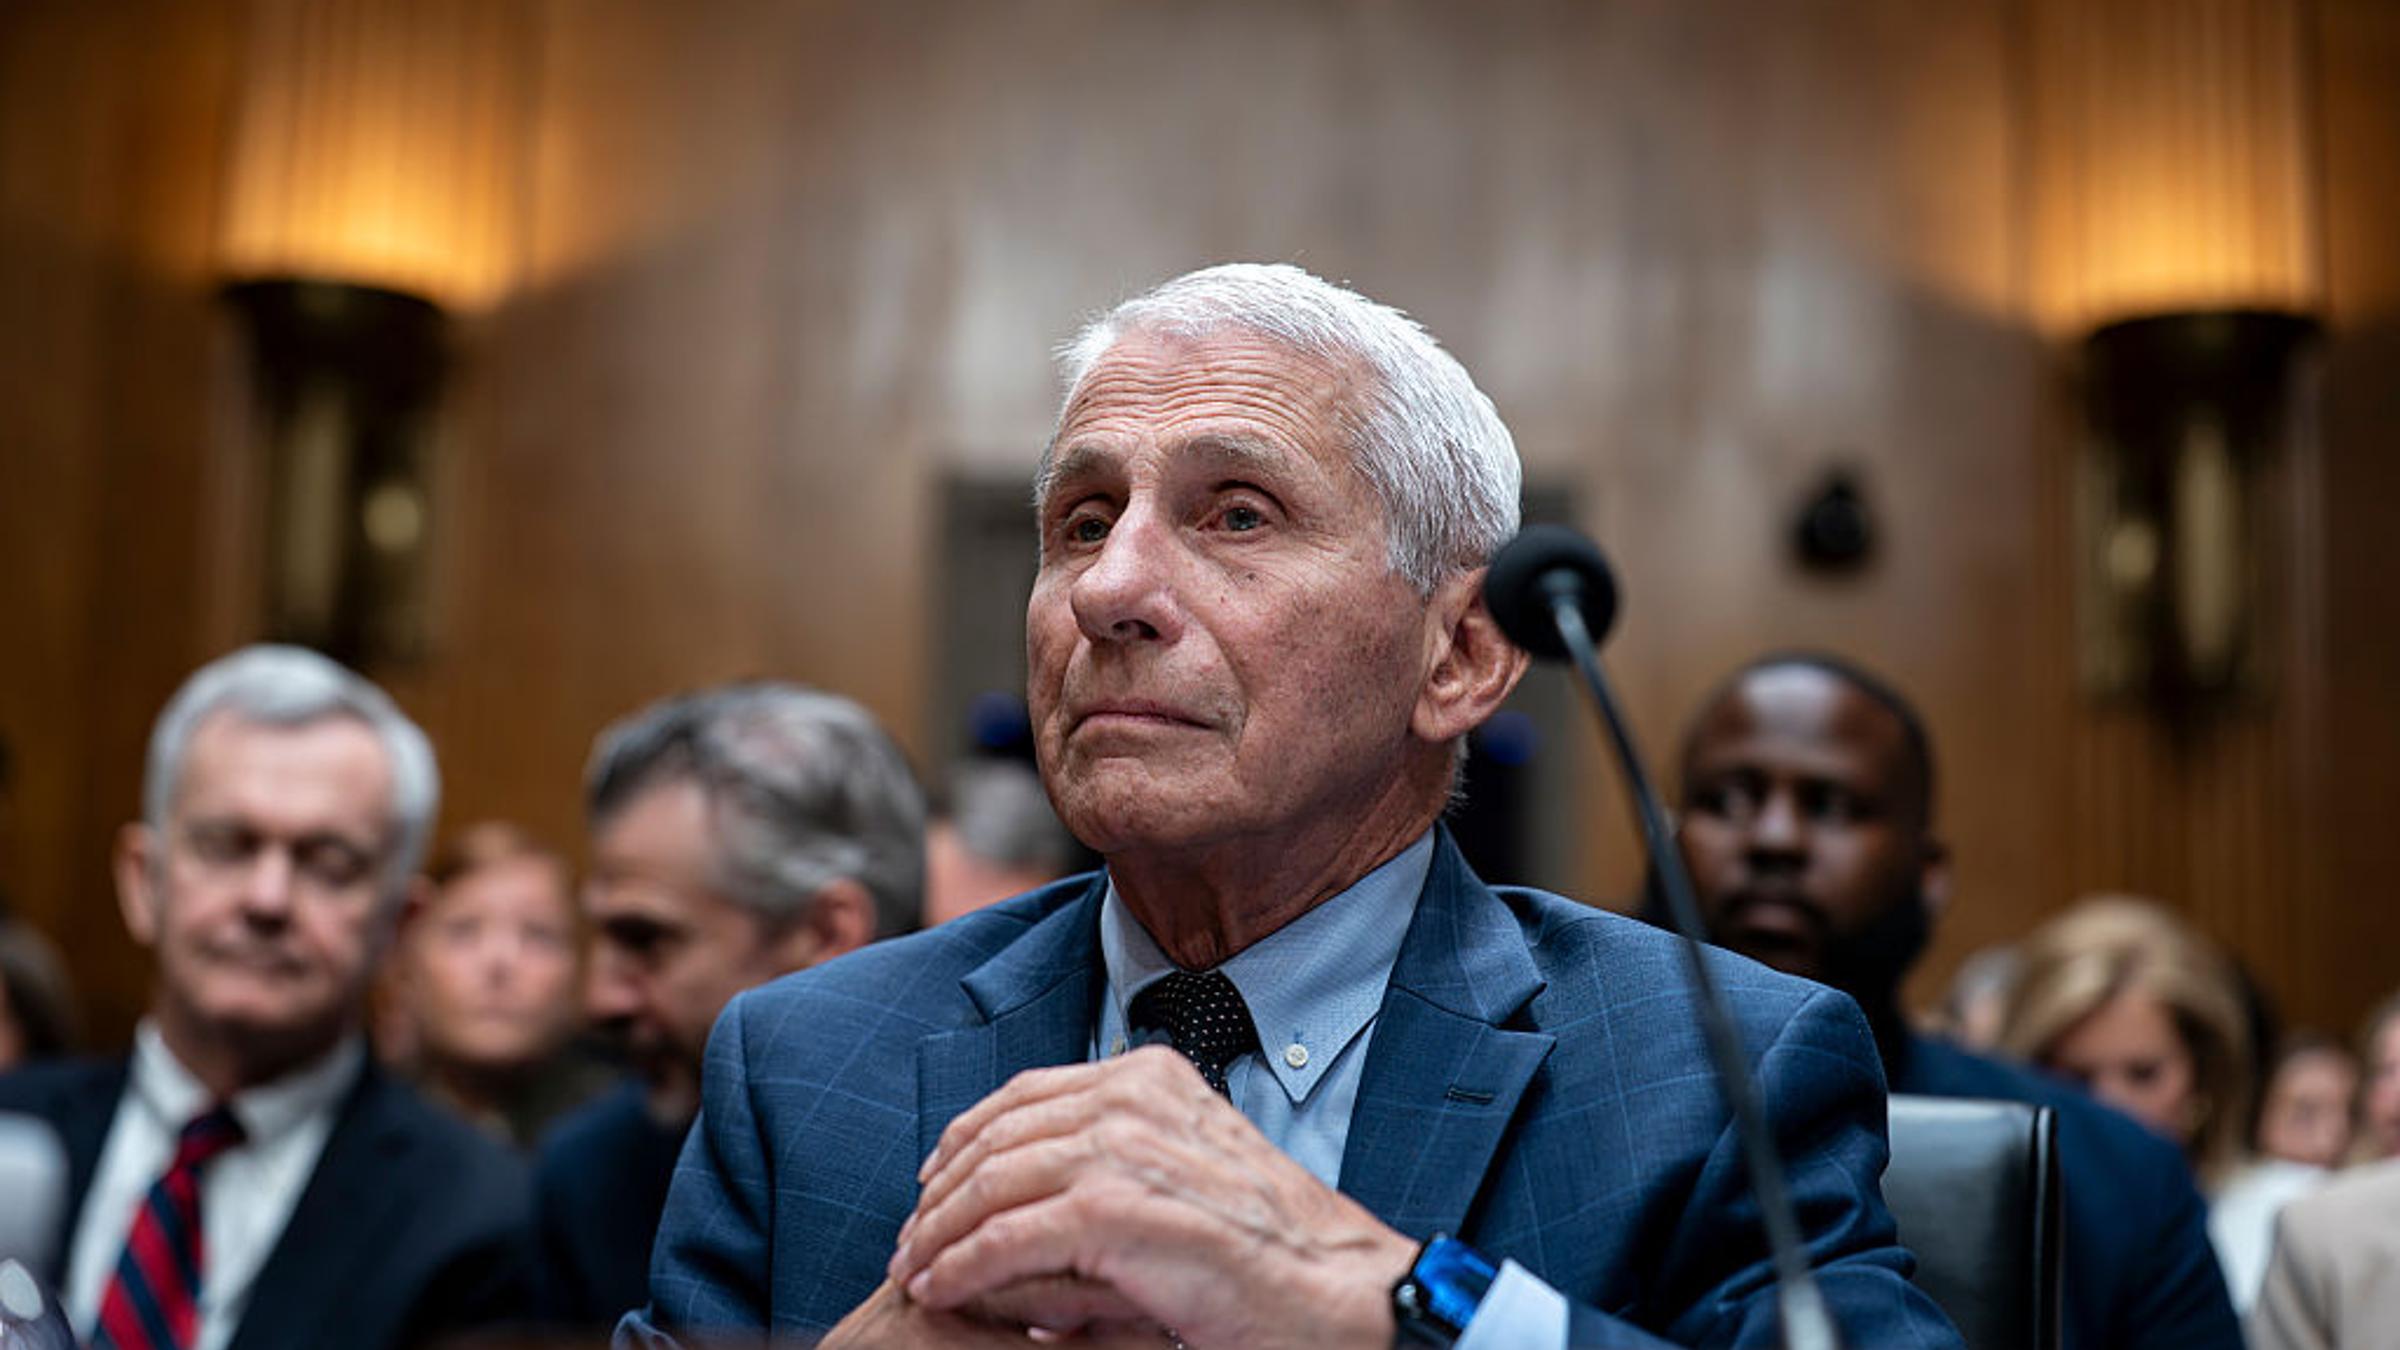
Why did Fauci invoke the Fifth Amendment?
In his opening statement to the Senate committee on Wednesday, Fauci accused Paul of having an “obvious obsession with calling for my prosecution.”
“The only conclusion I can reach is that the sole reason he is calling me before this committee is to get me to say something, anything, that could vindicate his repeated public pledges that I end up, in his words, ‘behind bars,’” Fauci said.
“Although it pains me to do so because of the respect that I have for the legislative branch of government and my decades-long record of cooperating with Congress,” he said, “under the advice of my attorneys, I will invoke my right under the Fifth Amendment of the Constitution to refrain from answering your questions.”
Shortly before former President Joe Biden left office, in January 2025, he preemptively pardoned Fauci. Biden said he was issuing the pardon to shield Fauci from “politically motivated prosecutions.”

NFF Postpones 2026 Elective Congress to September 27

D&D Rolls a Natural 20 on Nerd Collabs, Announcing World of Warcraft and Star Wars Sets

How I became a Millionaire before 30!


-

 Fashion7 days ago
Weekend Open Thread: Brooks Brothers
-
 Sports5 days ago
Commonwealth Games boxing: Jadumani Singh seals dominant 5-0 win over Pakistan’s Sumama Rehman to enter quarter-finals | Commonwealth Games News
-

 Business2 days ago
Why Trees Belong on the Risk Register
-

 Tech4 days ago
Intel is reversing course and bringing hyper-threading back to its server chips
-

 Crypto World6 days ago
Ripple bought a bank in pieces. The $4 billion audit
-

 Politics4 days ago
Luke Littler dismantles Gerwyn Price to retain title in Blackpool
-
 Entertainment7 days ago
A New Post-Apocalyptic Gundam Anime Series Blasts Into SDCC
-

 Politics3 days ago
The Part of the Electric Transition Nobody Wants to Discuss
-

 News Videos5 days ago
BITCOIN JUST ENTERED THIS CRITICAL ZONE…
-

 Business2 days ago
Major shareholder moves on Canyon
-

 Crypto World5 days ago
XRP Ledger adds $2.6B as RWA inflows rank second
-

 News Videos23 hours ago
Bitcoin Enters the 3rd Stage of the Bear Market
-

 Politics5 days ago
Spain sweeps the board at 2026 World Cup with individual awards
-
 Entertainment3 days ago
‘Stargate’ Creator’s New Sci-Fi Series Returns for Season 3 Tomorrow
-

 Entertainment5 days ago
Sara Gilson Killed By Husband After Viral “Pedophile” TikTok Video
-

 Crypto World2 days ago
Kraken Enables Retail Access to Jersey Mike’s IPO via Tokenized Shares
-

 Tech6 days ago
Anthropic launches Claude Opus 5, a cheaper AI model for coding, agents and enterprise workflows
-

 News Videos3 days ago
Claude: Build Financial Dashboards in Minutes (2026)
-

 Politics19 hours ago
Luke Littler’s dominance sparks GOAT debate
-

 Tech3 days ago
New macOS Sequoia & Sonoma security updates for older Macs
You must be logged in to post a comment Login