

Crypto World
What is tokenomics? Supply, FDV, Unlocks, and Vesting explained


Tokenomics is the study of how a crypto token’s supply, distribution, and incentives are designed, and it is the single most useful lens for telling a serious project from a trap. Once you can read a token’s supply schedule and unlock calendar, a lot of crypto stops being mysterious.
Summary
- Tokenomics determines how a crypto token’s supply, distribution, utility, and release schedule are structured, making it a key factor in assessing long term risk and value.
- Large gaps between circulating supply and fully diluted valuation can signal significant future dilution as locked tokens enter the market through vesting and unlock schedules.
- Insider allocations, token emissions, burn mechanisms, and real world utility often reveal whether a project’s token economy is built for sustainability or faces ongoing selling pressure.
Tokenomics is the design and study of a cryptocurrency token’s economy: how many tokens exist, how new ones are created or destroyed, who holds them, how they are released over time, and what they are actually used for. The word is a blend of “token” and “economics,” and it matters because a token’s price is driven not only by demand but by the supply mechanics baked into its design, mechanics that are written into code and published in advance. Two projects with identical hype can perform very differently because one releases its tokens slowly to aligned long-term holders while the other dumps a flood of unlocked tokens onto the market every month. Learning to read tokenomics is how you tell those two apart before you buy, not after.
This guide breaks tokenomics into the pieces that actually move prices, with no finance background assumed. It covers the different kinds of token supply and why the distinction matters, the difference between market capitalization and fully diluted valuation, how token distribution reveals who really controls a project, the vesting and unlock schedules that quietly determine future selling pressure, the supply mechanics like burning and emissions that expand or shrink a token over time, what gives a token actual utility, and a worked example that ties it all together. By the end you will be able to look at a token’s supply page and unlock calendar and form a grounded view of its risks, which is a skill that protects you from a large share of crypto’s most common traps.
The three kinds of supply
The first thing to understand is that “how many tokens are there” has three different answers, and confusing them is one of the most common and costly mistakes new buyers make. Circulating supply is the number of tokens actually available and trading on the market right now. Total supply is the number that exists today, including tokens that are locked, reserved, or otherwise not yet circulating. Maximum supply is the absolute ceiling, the most tokens that will ever exist. Bitcoin, famously, has a maximum supply of twenty-one million coins, a hard cap that can never change. Many tokens have no maximum at all, meaning new units can keep being created indefinitely.
The gap between these numbers is where danger and opportunity hide. A token might have a small, healthy-looking circulating supply that makes its price seem reasonable, while a vast reserve of locked tokens waits in the background, scheduled to flood the market over the coming years. When those locked tokens release, they add selling pressure that can crush the price even if nothing about the project has changed, simply because supply expanded. So the question is never just “what is the price.” It is “what is the price, how many tokens circulate now, how many will exist eventually, and how fast does the gap close.” A token where circulating supply is close to total supply has most of its dilution behind it. A token where circulating supply is a small fraction of the total has most of its dilution still to come, and that pending supply is a headwind every future buyer inherits.
Market cap versus fully diluted valuation
This brings us to two numbers that beginners constantly mix up, with expensive consequences: market capitalization and fully diluted valuation. Market capitalization, or market cap, is the token’s price multiplied by its circulating supply. It tells you what the market currently values the actively trading tokens at, and it is the right number for comparing the present size of two projects. A token priced at one dollar with one hundred million tokens circulating has a market cap of one hundred million dollars.
Fully diluted valuation, or FDV, is the token’s price multiplied by its total or maximum supply; in other words, what the project would be worth if every token that will ever exist were already trading at today’s price. The gap between market cap and FDV is the single most revealing ratio in tokenomics. Imagine that same one-dollar token has a market cap of one hundred million dollars but a maximum supply of one billion tokens, giving it an FDV of one billion dollars. That means ninety percent of the eventual supply is not yet circulating, and as it unlocks, either the price must fall to keep the valuation steady or new demand must absorb every one of those tokens just to hold the price flat. A low ratio of market cap to FDV is a flashing warning that enormous future supply is coming, and many tokens that look cheap by market cap are quietly expensive once you account for the dilution baked into their FDV. Always check both numbers, never just the one the project prefers to show you.
Distribution: who actually holds the tokens
Numbers about supply mean little without knowing who controls it, which is why token distribution, the breakdown of who received the tokens at launch, is so important. A typical allocation divides the supply among several groups: the team and founders, early investors such as venture funds, a treasury or foundation reserve, rewards for the community, and the portion sold or distributed to the public. The percentages and the conditions attached to each tell you how fairly a project is structured and where future selling pressure will come from.
The warning signs are recognizable once you know to look. If insiders, meaning the team and early investors, hold a very large share of the supply, they have the power to overwhelm the market when their tokens unlock, and their interests may not align with ordinary buyers who paid far higher prices. A project where eighty percent of the supply sits in a single wallet, or where private investors bought in at a fraction of the public price, is structurally tilted against late buyers. The opposite end is a fair launch, where no insiders get a privileged early allocation, and the tokens are distributed broadly from the start, an approach common among community-driven tokens. Most projects sit somewhere in between, and the goal is not to demand perfection but to understand the structure: a heavy insider allocation is not automatically fatal, but it is a risk you should price in, especially when combined with the unlock schedule that decides when those insiders can sell.
Vesting and unlocks: the calendar that moves prices
If there is one section of this guide to internalize, it is this one, because vesting and unlock schedules quietly determine a token’s future supply pressure more than almost anything else. Vesting is the practice of locking up tokens allocated to insiders and releasing them gradually over time, rather than all at once, so that the team and early investors cannot dump their entire allocation the moment trading begins. A vesting schedule typically has two features: a cliff, an initial period during which nothing unlocks at all, and a release schedule, the rate at which tokens drip out afterward. A common structure might be a one-year cliff followed by tokens releasing monthly over the next two or three years.
The reason this matters so much is that every unlock is a scheduled, predictable increase in circulating supply, and large unlocks often coincide with price weakness as newly freed tokens hit the market. A project might trade calmly for months and then face a “cliff unlock,” a single date when a huge tranche of team or investor tokens becomes sellable all at once, which can swamp demand and drive the price down regardless of how the project is doing. Because these schedules are published in advance, often tracked on dedicated unlock-calendar tools, you can see the supply waves coming. Before buying a token, checking its unlock calendar is as important as checking its price: you want to know whether a large unlock is days away, who it benefits, and how big it is relative to the circulating supply. A ten percent supply unlock landing next week is a very different proposition from a token whose insiders are already fully vested with no major unlocks left. Smart buyers treat the unlock calendar as a core part of the decision, not an afterthought.
Supply mechanics: burning, emissions, and inflation
Beyond the initial design, tokens have ongoing mechanics that expand or shrink the supply over time, and these determine whether a token is inflationary or deflationary. Emissions are newly created tokens released as rewards, for instance to stakers, liquidity providers, or miners. Emissions are how many networks pay for their own security and growth, but they are also a form of inflation: if a protocol mints lots of new tokens to hand out as rewards, the supply grows, and unless demand keeps pace, each token is worth proportionally less. A high-yield farm paying out in a freely inflating token is often quietly diluting the very holders it is paying.
The counterweight is burning, the permanent removal of tokens from circulation by sending them to an address no one can access. Projects burn tokens for several reasons: to offset emissions, to return value to holders, or as a built-in feature of the network. Ethereum, for example, burns a portion of the fees paid on every transaction, which means heavy network usage can shrink supply and partly or fully offset the new ether created for validators. When you assess a token’s long-term supply trajectory, the question is the net balance: are tokens being created faster than they are destroyed, or the reverse. A token with high emissions and little burning faces persistent inflationary pressure, while one with modest emissions and meaningful burning can hold or even reduce its supply. Neither is automatically good or bad, but the direction matters: inflation that outruns demand erodes price, while a credibly shrinking supply supports it.
Utility: what the token is actually for
All the supply analysis in the world cannot save a token that has no reason to exist, which is why utility, what the token actually does, sits at the foundation of sound tokenomics. A token’s utility is the set of real uses that create demand for holding or spending it. Strong forms of utility include paying for transaction fees on a network, staking to secure a blockchain and earn rewards, granting governance rights to vote on a protocol’s decisions, or serving as the required medium of exchange within a particular application. The more essential a token is to using something people genuinely want to use, the more durable the demand for it.
The weak case is a token with little purpose beyond speculation, where the only reason to buy it is the hope that someone else will pay more later. Many tokens are designed so that their utility is thin or circular, for example, a governance token for a protocol no one uses, or a reward token whose only function is to be farmed and sold. This does not mean such tokens never rise; plenty do, driven by narrative and momentum, and memecoins openly embrace having culture rather than utility as their value. But for a project presenting itself as serious infrastructure, the honest question is whether removing the token would break the system or merely remove a speculative chip. Real utility ties the token’s demand to the success of the product, aligning holders with usage. Thin utility leaves the price floating on sentiment alone, which is a far more fragile foundation, especially when the unlock schedule starts adding supply.
Red flags: tokenomics warning signs to watch
Once you can read the individual pieces, certain combinations should make you pause, and learning to spot them quickly is what turns tokenomics from theory into protection. The clearest warning sign is a very low ratio of market cap to fully diluted valuation paired with heavy insider ownership. A token where only a small fraction of the supply circulates and most of the rest sits with the team and early investors is a structure where enormous future supply is coming and the people who control it bought in cheaply. That does not doom the token, but it stacks the deck against anyone buying at the current price, because the insiders can profit handsomely while late buyers absorb the dilution.
A second red flag is a large unlock arriving soon. A token that has traded calmly can face a “cliff” date when a big tranche of insider or investor tokens becomes sellable all at once, and that wave of new supply can overwhelm demand regardless of how the project is doing. Because unlock schedules are public, a buyer who fails to check the calendar is choosing not to see a risk that is sitting in plain view. Pair a looming unlock with insiders sitting on large paper gains, and the incentive to sell into that unlock is obvious. A third sign is high emissions with little or no burning, which means the supply is inflating steadily; a juicy advertised yield paid in a freely inflating token can quietly dilute you faster than the yield enriches you.
The subtlest red flag is thin or circular utility. If you cannot answer the simple question “why would anyone need to hold or use this token,” the price is floating on sentiment alone, which is a fragile foundation, especially when the supply schedule is adding tokens. Watch for governance tokens attached to protocols nobody uses, reward tokens whose only purpose is to be farmed and sold, and projects whose pitch is all narrative with no mechanism that ties demand to real activity. None of these signs is automatically fatal on its own, and plenty of tokens with imperfect structures still rise on momentum. The point is not to find a flawless project but to see the structure clearly and price the risk, so that a token’s design informs your decision instead of ambushing you after you have bought.
A worked example: reading a token at a glance
Put the pieces together with a hypothetical token, and you will see how quickly the picture forms. Suppose a new project’s token trades at two dollars. Its circulating supply is fifty million tokens, giving a market cap of one hundred million dollars, which sounds like a modest, mid-sized project. But its maximum supply is five hundred million tokens, so its fully diluted valuation is one billion dollars, and right away you know that ninety percent of the eventual supply is not yet circulating. That single ratio reframes everything: the token is far more expensive than its market cap suggests once dilution is accounted for.
Now look deeper. The distribution shows that forty percent of the supply went to the team and early investors, who bought in at twenty cents, a tenth of the current price, so they are sitting on large paper gains and have strong incentive to sell. The vesting schedule reveals a one-year cliff that ends in two months, after which those insider tokens begin unlocking at five percent of total supply per month. Putting it together: a token trading at a rich fully diluted valuation, with most of its supply still locked, held heavily by insiders who are about to start unlocking large monthly tranches at a tenth of their cost basis. None of that guarantees the price will fall, but it tells you exactly where the pressure will come from and when, and it lets you weigh that against the token’s actual utility and demand. A buyer who checked only the one-hundred-million-dollar market cap would have missed all of it. A buyer who read the tokenomics sees the whole board. That is the entire value of this skill: it turns a token from a price on a screen into a structure you can actually evaluate.
Frequently Asked Questions
What does tokenomics mean?
Tokenomics is the design and study of a crypto token’s economy: how many tokens exist, how they are created or destroyed, who holds them, how and when they are released, and what the token is used for. It blends “token” and “economics.” Tokenomics matters because price depends not just on demand but on supply mechanics written into a project’s code, so reading them helps you judge a token’s risk before buying rather than after.
What is the difference between market cap and FDV?
Market capitalization is the token’s price multiplied by its circulating supply, the value of the tokens trading right now. Fully diluted valuation, or FDV, is the price multiplied by the total or maximum supply, the value if every token that will ever exist were already trading. A large gap between them means much of the supply is not yet circulating and will dilute holders as it unlocks. A token can look cheap by market cap yet be expensive once FDV reveals the pending supply.
Why do token unlocks affect price?
An unlock releases previously locked tokens, usually held by the team or early investors, into the circulating supply. That increases the number of tokens available to sell, and large unlocks often coincide with price weakness because the new supply can overwhelm demand. Because unlock schedules are published in advance, you can see these supply waves coming. Checking a token’s unlock calendar before buying tells you whether a big release is imminent and how large it is relative to the circulating supply.
What is vesting in crypto?
Vesting is the gradual release of tokens allocated to insiders such as the team and early investors, instead of giving them everything at launch. A typical schedule has a cliff, an initial period when nothing unlocks, followed by a steady release over months or years. Vesting is meant to align insiders with the project’s long-term success and to prevent them from dumping their entire allocation immediately. The schedule also tells future buyers when supply pressure from insider selling is likely to arrive.
What makes tokenomics good or bad?
Healthier tokenomics generally feature a circulating supply close to the total, a reasonable gap between market cap and FDV, broad distribution without excessive insider concentration, gradual vesting without enormous looming cliffs, a sustainable balance between emissions and burning, and genuine utility that ties demand to real usage. Riskier tokenomics show the opposite: heavy insider holdings, a tiny circulating fraction with huge pending unlocks, high inflation, and thin or speculative utility. The goal is to understand and price these traits, not to demand perfection.
What is the difference between inflationary and deflationary tokens?
An inflationary token has a supply that grows over time, usually through emissions that reward stakers, miners, or liquidity providers; unless demand keeps pace, each token’s share of value falls. A deflationary token has a supply that shrinks, typically through burning, the permanent removal of tokens from circulation. Many tokens combine both, creating and destroying units at the same time, so what matters is the net balance. Bitcoin is disinflationary with a hard cap, while some tokens burn enough to offset or exceed their emissions.
This guide is educational information, not financial advice. Tokenomics helps you assess risk but does not predict price, and supply figures, schedules, and valuations vary by project and change over time, as of June 24, 2026. Always verify a token’s current supply and unlock data from primary sources before relying on it.


Stablecoins are no longer a fringe market. Their total supply has exceeded $300 billion, and USDT₮, the largest stablecoin, briefly overtook Ethereum by market capitalization to become the second-largest digital asset behind bitcoin. Banks are right to pay attention.
But paying attention is different from pressuring Congress to slow the market down.
Stablecoins create new competition around payments, settlement, float, and customer relationships. Some of that competition will be uncomfortable for banks. It should be. Financial technology does not move forward only when incumbents are comfortable.
That does not make stablecoins a systemic threat to community banking.
There is a precedent for this. Over the last decade, fintech companies embedded banking features into consumer apps, business platforms, payroll tools, lending products, and payment systems. Many did so through bank partners. That changed how customers interacted with financial services. It created new competition. It pushed banks to modernize. But it did not wipe out community banking.
Fintech applications like PayPal and Stripe have popularized digital banking and built large user bases since their emergence. However, banks have never treated fintech as a threat, but rather as an opportunity to expand their offerings and improve user experiences through collaborations and integrations. Looking at the numbers alone, SoFi, the largest publicly traded fintech bank, had $37.5 billion in total deposits in the last quarter of 2025, accounting for less than 0.2% of the US bank’s $20 trillion deposit base. If fintech was never a threat, why treat stablecoins differently?
Crypto World
Bitcoin just broke below the floor of its famous Rainbow Chart into the ‘BTC is dead’ zone

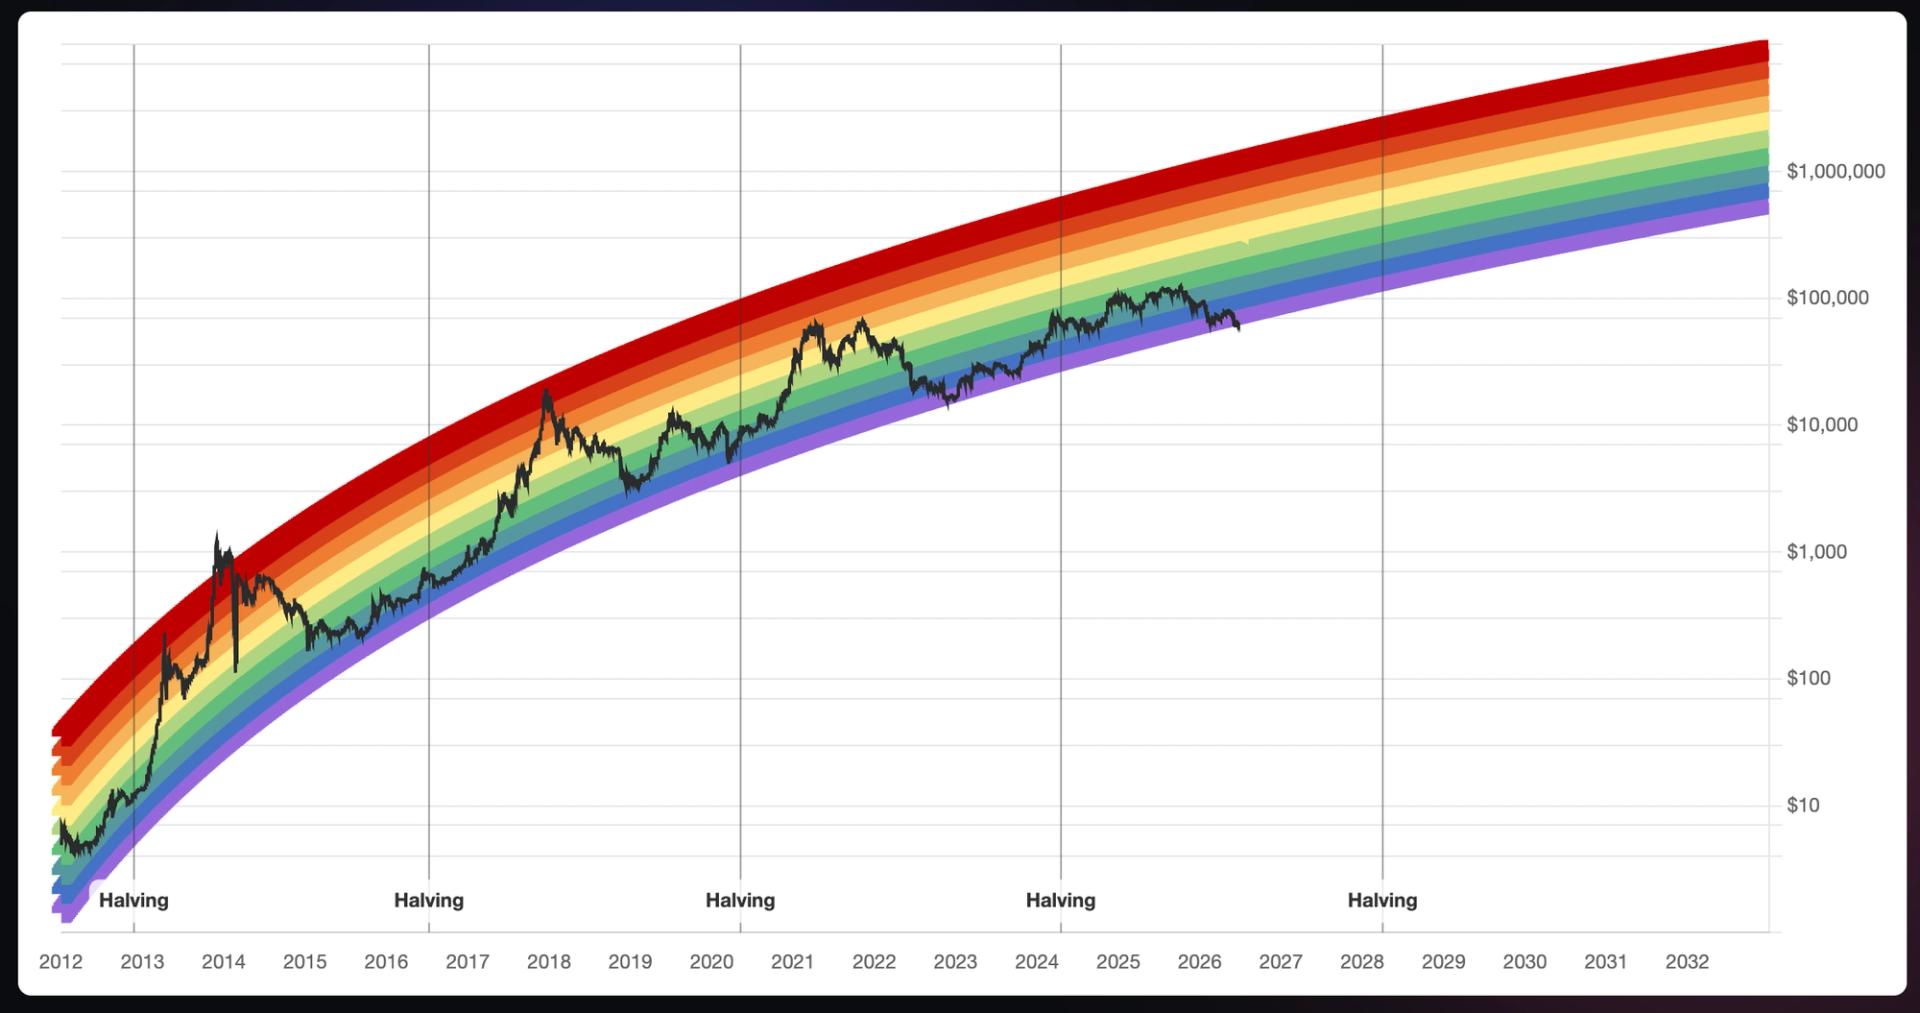
Bitcoin peaked at $126,000 in October without reaching the Rainbow Chart’s upper red bands. Now, with BTC near $62,500, the price has fallen below the chart’s floor.
The divergence comes as other widely followed bitcoin valuation models have also struggled. The Stock-to-Flow model, which links bitcoin’s price to its programmed supply reductions, projected significantly higher prices following the 2024 halving than bitcoin ultimately achieved.
Mark Zalan, CEO of GoMining, agreed that the bottom band does not indicate a permanent collapse.
Bitcoin dead zone
“The ‘Bitcoin is Dead’ zone doesn’t mean Bitcoin is actually dead,” Zalan told CoinDesk. “Historically, it has often marked periods of extreme fear and undervaluation, which were later followed by recoveries. It signals sentiment more than certainty.”
Zalan said the chart remains useful, but “less precise than it once was.”
“The 2025 cycle showed that BTC doesn’t have to follow old patterns exactly,” Zalan said. “ETFs, institutions and changing market structure have altered the game.”
Bitcoin is trading near its April 2024 halving price, a development that runs counter to expectations for the current four-year cycle.
Levin said the chart confirms what the “cycle data has been showing us, the exponential growth assumptions baked into this chart were calibrated to a retail-driven, illiquid asset, not a $1.25 trillion market with ETF flows and institutional balance sheets setting the marginal price.”


- World expands AgentKit for verified AI agents using World ID.
- AI agents can act online on behalf of verified human users.
- System aims to prevent bots while enabling trusted automation.
World is expanding access to AgentKit, its framework designed to create human-verified AI agents and allow individuals to connect those agents to a verified World ID.
The system enables AI agents to act on behalf of users across the internet while maintaining identity verification through World’s network.
The development comes as AI agents become increasingly capable of performing online tasks such as shopping, making reservations, navigating websites, and interacting with digital services.
This growing capability has created a challenge for businesses in distinguishing between agents representing real users and automated bot networks.
AgentKit is positioned as a response to that issue by linking AI agents directly to World ID, allowing websites and applications to verify when an agent is acting on behalf of a unique human.
The framework is designed to support task delegation while maintaining safeguards tied to identity verification and user control.
How AgentKit links AI agents to verified identity
To begin using AgentKit, individuals require a verified World ID, access to World App, and a supported AI agent, including tools such as Claude Code, Codex, Cursor, Hermes, or OpenClaw.
Users connect their proof of human through World’s ToolRouter interface, generate an API key, and link their AI agent within minutes.
Once connected, the agent can interact with services that support AgentKit and perform tasks on behalf of the user.
The system is designed to allow individuals to delegate digital tasks to AI agents while preserving controls tied to verified identity.
According to the framework description, this structure is intended to ensure that AI activity remains attributable to a real human user rather than anonymous or automated systems.
Demo shows real-world use case
The technology was recently demonstrated through a limited-edition release of 500 “Human in the Loop” hats available exclusively to verified World ID holders.
During the demonstration, AI agents discovered the drop, verified eligibility, navigated the storefront, and completed purchases on behalf of users while maintaining one-item-per-person limits tied to verified identities.
All 500 hats were claimed by verified individuals across multiple countries, including the United States, Germany, Japan, and the United Kingdom.
The demonstration was used to show how AI agents can execute real-world transactions while preserving identity-based constraints designed to limit abuse.
The example highlighted how businesses could allow AI agents to complete tasks on behalf of users while still preventing exploitation by bot networks.
Building a trust layer for the agent economy
As more services integrate AgentKit, World aims to create what it describes as a trust layer for an emerging agent economy.
The goal is to enable AI agents to transact and interact online while remaining accountable to the humans they represent.
The system is intended to support a growing range of use cases where AI agents operate autonomously but within a framework of verified identity and user authorization.
This includes both commercial applications and broader digital service interactions.
The World project was originally conceived by Sam Altman, Max Novendstern, and Alex Blania, and aims to provide proof of human, finance and connection for every human in the age of AI.
The company says AgentKit is part of its broader effort to support identity verification in an environment where AI agents are becoming increasingly capable of acting independently across online platforms.

Key Highlights
- Shares reached a 52-week peak of $76.56, gaining 2.32% in Tuesday’s session with a $7.28 billion market valuation
- Year-over-year gains stand at 40.32%, with a 31.8% increase recorded over the last six months
- Truist Securities maintains its Buy recommendation with an $85 target, highlighting robust marketplace trends continuing into mid-June
- First-quarter fiscal 2026 revenue exceeded expectations by approximately 3%, while adjusted EBITDA surpassed forecasts by roughly 5%
- The company upgraded its fiscal 2026 GMS growth forecast to low single-digit territory; divesting Depop is anticipated to enhance strategic concentration on the primary platform
Shares of Etsy (ETSY) climbed to a 52-week peak of $76.56 during Tuesday’s trading session on June 24, closing at $76.65 — representing a 2.32% intraday gain. The performance extends the stock’s impressive year-over-year advance of 40.32%.
The company’s market capitalization currently stands at $7.28 billion, with InvestingPro data indicating the shares remain undervalued at current price levels.
The rally coincides with an increasing chorus of optimistic analyst commentary. On June 23, Truist Securities reaffirmed its Buy stance alongside an $85 price objective, highlighting better-than-anticipated sales momentum extending through mid-June.
According to Truist’s examination of payment card transaction data covering the period through June 16, sales performance for the quarter-to-date period is outpacing initial projections. The primary marketplace — when Depop is excluded from calculations — is demonstrating recovery signals in both active buyer counts and gross merchandise sales volumes.
Truist projects that core Etsy marketplace GMS will expand in the mid-single-digit percentage territory on a year-over-year basis during Q2 2026. This would represent the second-strongest growth rate recorded since the pandemic era.
The investment firm attributes the acceleration to enhancements in search functionality, artificial intelligence-driven product discovery features, improved marketing return on investment, and increased mobile application engagement.
First Quarter Performance Exceeds Expectations
Etsy’s fiscal Q1 2026 financial results surpassed both internal company forecasts and Wall Street consensus estimates. Top-line revenue came in approximately 3% above expectations, while adjusted EBITDA exceeded projections by around 5%.
In response to these results, Guggenheim increased its price objective to $85 while maintaining its Buy recommendation. JPMorgan similarly raised its target to $75, characterizing the quarter as the first significant expansion in Etsy Marketplace GMS since the third quarter of 2023.
Argus took an even more decisive stance, elevating its rating from Hold to Buy. The research firm highlighted progress in active buyer metrics and GMS per active buyer statistics, which it linked to the company’s investments in personalization technologies and machine learning capabilities.
Following the first-quarter performance, Etsy management elevated its full-year fiscal 2026 GMS growth guidance to low single-digit percentage growth.
Strategic Divestiture of Depop Expected to Enhance Focus
The upcoming divestiture of Depop represents another significant development in Etsy’s strategic narrative. Company leadership intends to leverage this transaction to concentrate resources and attention on the core marketplace business.
The transaction is also projected to generate liquidity that could fund expanded share repurchase initiatives. According to InvestingPro metrics, management has already demonstrated a commitment to aggressive stock buyback programs.
Etsy’s PEG ratio currently registers at 0.46, indicating shares are trading at an attractive price-to-earnings valuation when normalized for projected growth rates. The company maintains gross profit margins of 71.6%.
During the 2026 Annual Meeting, shareholders approved the appointment of three Class II board members — M. Michele Burns, Josh Silverman, and Fred Wilson — who will serve three-year terms concluding at the 2029 annual gathering.
Truist continues to hold an optimistic perspective on Etsy’s trajectory as the quarter approaches its conclusion, with shares now trading at their strongest level over the past twelve months.

Crypto World
Nokia (NOK) Stock Climbs 1.88% Following Dual Partnership Announcements with Databricks and AWS

Key Highlights
- Nokia and Databricks successfully validated a cloud-neutral data platform designed for autonomous telecommunications networks through a proof of concept.
- The solution enables telecom carriers to implement real-time data analytics one time and execute them across multiple cloud environments without code modification.
- Simultaneously, Nokia revealed deeper integration with AWS, bringing its Autonomous Networks Fabric to Amazon’s cloud services.
- The company currently trades beneath InvestingPro’s Fair Value calculation and posted $23.1 billion in trailing twelve-month revenue with gross margins reaching 45%.
- Shares of NOK climbed 1.88% following the dual announcements.
Shares of Nokia (NOK) advanced 1.88% to reach $12.225 during Tuesday’s trading session after the telecommunications equipment manufacturer unveiled two significant strategic partnerships within hours of each other — collaborations with both Databricks and Amazon Web Services (AMZN).
The initial announcement centered on Databricks. Nokia partnered with the data and analytics specialist to successfully demonstrate a consolidated data infrastructure designed to power AI-enabled autonomous telecommunications operations.
The objective addresses a specific industry challenge: telecommunications providers typically maintain hundreds of disconnected operational and business support systems, each operating with isolated data architectures. The proof of concept validated that these disparate systems can be integrated without forcing carriers into exclusive relationships with single cloud providers.
Technical teams from both organizations conducted a real-time performance management test simulating tier-1 operator network conditions. They constructed data pipelines a single time and executed them across various platforms — eliminating the need for code rewrites.
Identical workflows functioned on both the Databricks infrastructure and an open-source technology stack incorporating Apache Flink, Kafka, and Iceberg, supporting real-time data streaming, batch operations, and query-based data products.
Nokia’s development team created transformation logic utilizing cloud-neutral Python code. A specialized compiler then automatically converted this logic into platform-specific formats — Delta Live Tables for Databricks environments, or Flink SQL for open-source implementations.
The technical validation also showcased AI-driven data product generation capabilities, where an intelligent system can produce new data products through natural language instructions, verify requirements, and autonomously deploy data pipelines.
“Collaborating with Databricks marks a significant milestone in our journey to establish the data infrastructure necessary for next-generation autonomous telecommunications networks,” stated Oguz Sunay, CTO of AI and Autonomous Networks at Nokia.
Nevash Pillay, Global Head of Telecommunications Industry at Databricks, noted that the unified infrastructure helps streamline operations and enable AI capabilities across network functions.
Nokia Strengthens AWS Partnership for Autonomous Networks
Later the same day, Nokia and AWS disclosed an expansion of their current partnership. The companies announced that Nokia’s Autonomous Networks Fabric will operate on AWS infrastructure, providing telecommunications carriers with AI capabilities and cloud resources required for achieving what the industry defines as Level 4 network autonomy.
The expanded AWS agreement builds upon Nokia’s existing portfolio of digital operations applications already deployed on the platform, including orchestration, network assurance, and unified inventory management. General availability is anticipated before year-end.
Nokia generated $23.1 billion in trailing twelve-month revenue with gross profit margins of 45%. Top-line revenue expanded 4.3%, while analysts project net income growth for the current fiscal period.
Financial Performance and Valuation Metrics
InvestingPro currently includes NOK among its Most Undervalued stocks selection, with shares trading at levels below the platform’s Fair Value calculation. The telecommunications company maintains a FAIR financial health score.
Beyond the data platform developments, Nokia has announced multiple strategic initiatives. The company revealed plans to expand its advanced testing and packaging facilities in Allentown, Pennsylvania, which will approximately double its local employee count. Nokia Defense recently formed a partnership with KNDS to deliver 5G connectivity solutions for armored military platforms, and introduced a modular 5G system with Lockheed Martin targeting U.S. and allied military applications.
Nokia’s Autonomous Networks Fabric running on AWS infrastructure is scheduled for commercial availability to telecommunications operators in the latter part of this year.
Crypto World
Bitcoin (BTC) price could fall to $55,000 to find a bottom in August-October, 10x Research says


Bitcoin likely has further downside ahead before the current bear market runs its course, according to 10x Research founder Markus Thielen.
Thielen’s call centers on the recent strength of the U.S. dollar, which historically acts as a headwind for bitcoin. The outlook has been reinforced by the Federal Reserve’s hawkish turn under new Chair Kevin Warsh. Markets are increasingly debating whether the Fed’s next move could be a rate hike rather than a cut, a backdrop that has supported the dollar and weighed on assets.
Still, Thielen doesn’t expect the downturn to last indefinitely.
Three separate indicators — global liquidity trends, the macro calendar and bitcoin’s seasonal patterns — all point to a potential market low between late August and October.
One model tracking the rate of change in global liquidity, which Thielen said correctly identified a buying opportunity in March and an exit signal in April, points to late August as the next key inflection date. Seasonal patterns also suggest September has historically been a weak month for bitcoin, often followed by stronger performance in October.

Meta is reportedly developing a prediction markets app that it’s calling Arena, which would allow users to place bets on real-world outcomes with points rather than actual money.
The app would be separate from Facebook, Instagram, WhatsApp and Messenger, the New York Times says, and Meta plans to grow it by channeling its existing social audience to the new product.
Arena App Details
In a June 23 exclusive, the NYT, citing sources with knowledge of the project, said that while Arena was experimental, it is a top priority for Mark Zuckerberg. If it comes to fruition, it would not require users to wager real money, at least initially, with a video game-style points system being the likely starting model. However, the sources did not rule out real-money betting for a later stage.
The app is one of several standalones that Meta is developing, with another called Meta Photos that uses AI to generate new types of media also in the pipeline. This push toward standalone apps reflects a bigger problem for the multinational tech company, as Facebook and Instagram have shifted heavily toward video, leaving fewer spaces inside those platforms to test new product ideas, thus forcing Meta to look outward.
It isn’t the first time Zuckerberg is dabbling with prediction markets. In 2020, his company released Forecast, a crowdsourced prediction market app built around the early days of the COVID-19 pandemic that used almost the same points-based structure. However, it shut down in 2022.
Meta has also been chasing emerging social trends with varying results in the last few years, including copying features from Snapchat and TikTok with mixed outcomes, as well as producing apps around podcasts, travel, and matchmaking that largely went nowhere.
The timing feels different now, though, with prediction markets growing at a pace that’s hard to ignore, with Kalshi and Polymarket combining for $51 billion in trades in 2025. That figure is even higher this year, having already hit $130 billion.
Meanwhile, Kalshi completed a $1 billion funding round that valued it at $22 billion, while Polymarket was in talks in April for a $400 million raise at a $15 billion valuation, with Bernstein projecting that by 2030, the total prediction market volumes could hit $1 trillion annually.
A Crowded Field
Meta is not the only company eyeing a slice of the prediction market space, with several crypto companies already getting a head start. In March, Binance added a prediction market functionality to its wallet, while Hyperliquid launched macro prediction markets to its own offerings the following month. Furthermore, Coinbase and Crypto.com also have products in the category, and Trump Media has also announced plans for the same.
However, the sector has also attracted legal heat, with federal prosecutors charging a US Special Forces soldier with using classified information to place bets on Polymarket about a secret plan to capture Venezuela’s Nicolas Maduro, which netted him $400,000.
There’s also been added scrutiny around data quality and trading behavior on some platforms, with blockchain investigator ZachXBT warning in June that Rain Protocol, a prediction market project valued at close to $9 billion, was showing signs of on-chain price manipulation.
The post Meta Bets on Prediction Markets as It Hunts for Next-Growth Engine (Report) appeared first on CryptoPotato.
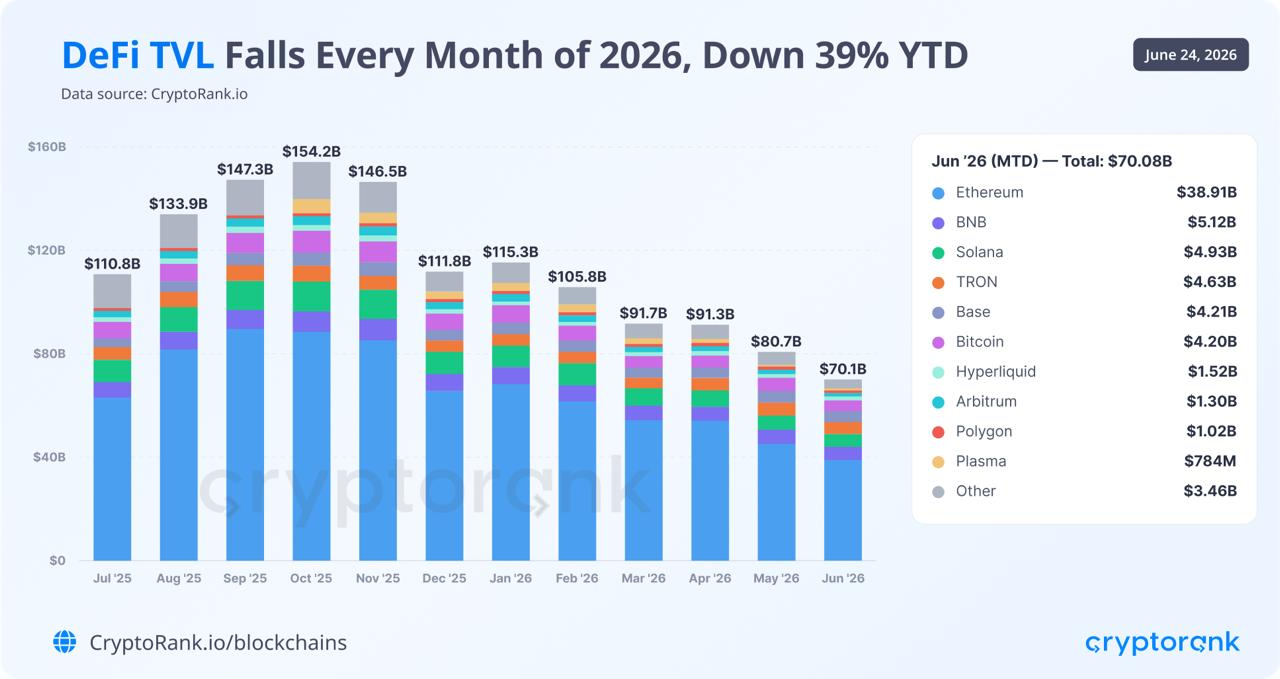
Total value locked (TVL) in decentralized finance (DeFi) has fallen by about 39% in 2026 so far, declining to just over $70 billion from roughly $115 billion in January.
A Wednesday report from crypto data aggregator CryptoRank attributed the decline to the broader market correction that followed the October 2025 crypto market peak.
After Bitcoin reached a record high above $122,000, a market-wide liquidation event on Oct. 10, 2025, erased more than $19 billion in leveraged positions and accelerated a deleveraging cycle across digital assets.
Despite the decline, CryptoRank noted that the current drawdown remains far smaller than during the 2021-2022 bear market, suggesting a more resilient DeFi market.

DeFi TVL, 1-year chart, monthly. Source: CryptoRank
Fallout from Kelp DAO exploit accelerated the DeFi TVL decline: analyst
CryptoRank said security incidents added another layer of pressure on DeFi in 2026, with 121 hacks and roughly $942 million in losses year-to-date. While exploits were not the primary driver of the decline, the data provider said their frequency likely weighed on user confidence and reinforced capital outflows from DeFi.
According to Nicolai Søndergaard, senior research analyst at crypto intelligence platform Nansen, the fallout from the $293 million Kelp DAO exploit on April 18 compressed into days what would otherwise have been weeks of DeFi outflows. Aave users withdrew about $15 billion in deposits in the four days following the exploit.
Related: CryptoQuant warns on Strategy’s dividend coverage as cash reserve falls 38%
The second quarter of 2026 became the most-hacked quarter on record by incident count, with 83 exploits targeting crypto protocols. However, the $755 million stolen during the quarter remained well below the $3.56 billion lost in the fourth quarter of 2020, the costliest quarter for crypto hacks on record.
The falling total value stolen is not due to more robust industry security but a sign that hackers are expanding their attack surface, according to Dmytro Matviiv, CEO of crowdsourced security and bug bounty platform HackenProof. He told Cointelegraph that the lower aggregate losses are “misread as progress,” but only the leading protocols have become harder to exploit, forcing attackers to expand their attack surface.
Alvin Kan, chief operating officer at Bitget Wallet, said that the cyber exploits are making users more cautious, but added that these may also result in capital leaving “weaker” DeFi protocols for those with “stronger venues and clearer yield models,” leading to more industry consolidation.
Magazine: Bitcoin, the ‘canary in the coal mine,’ XRP transaction demand falls 91.5%: Market Moves
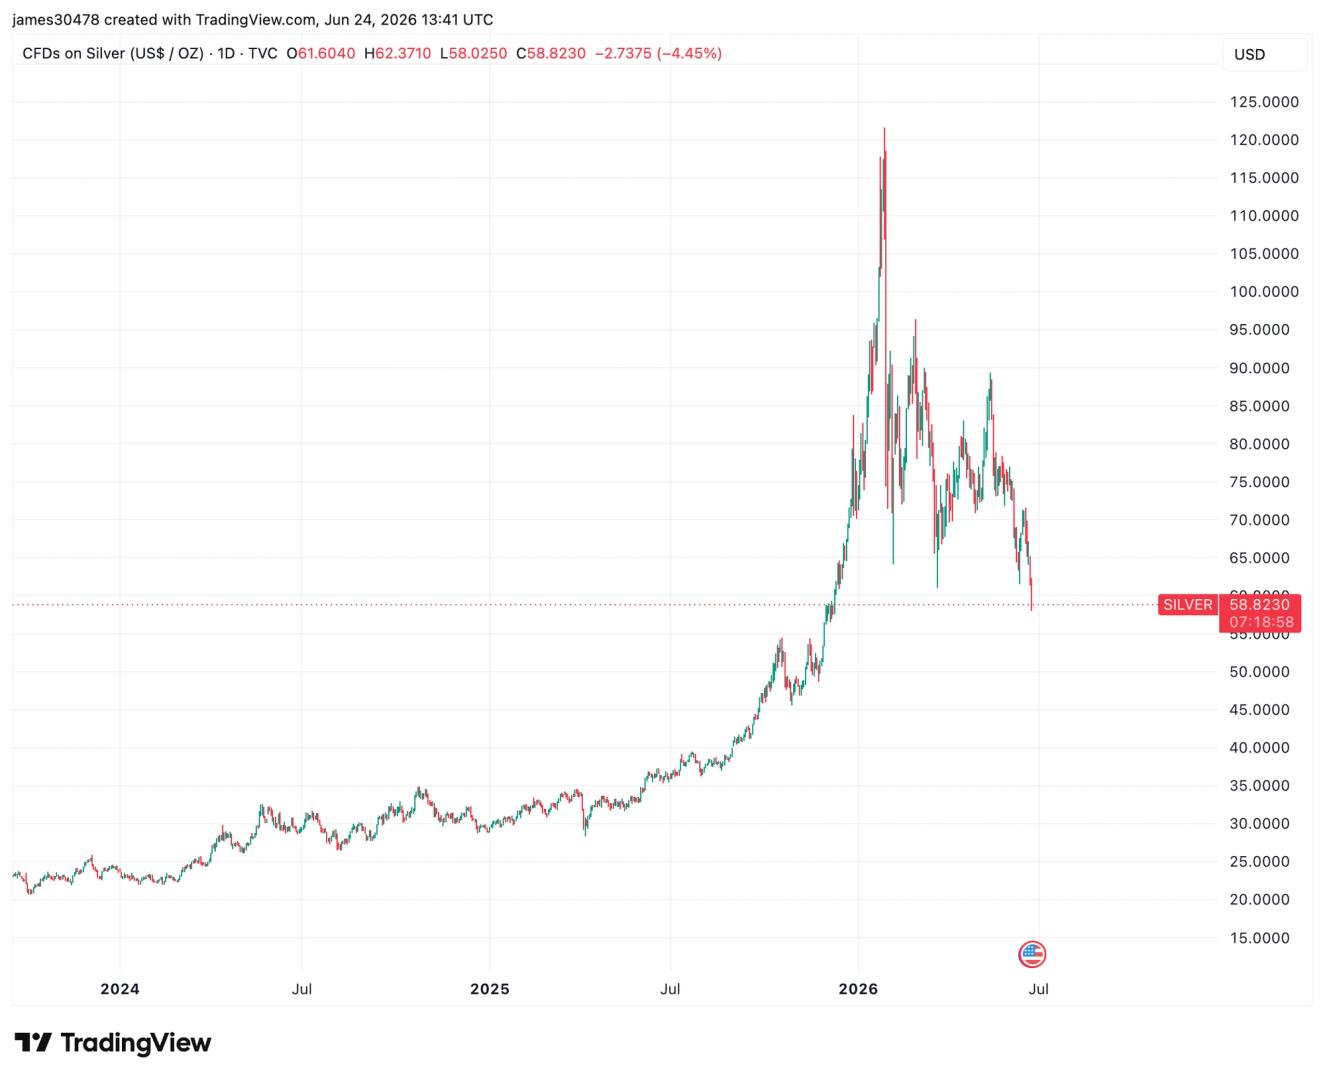

Gold and silver have both retreated sharply from their January 2025 highs, falling below key psychological milestones. Gold is down roughly 28% from its January peak of $5,600 and now trading below $4,000 per ounce, while silver has fallen more than 50%, slipping beneath $59 per ounce on Wednesday.
The sell-off has been driven largely by growing fears of tighter monetary policy under new Federal Reserve Chair Kevin Warsh. Markets are currently pricing in two 25 basis point rate hikes by March 2027, which would lift the federal funds rate to 4.00%-4.25% due to renewed inflation fears.
The reversal marks a dramatic shift from the dominant macro narrative of 2025, the “debasement trade“, the belief that persistent fiscal deficits and rising government debt would continue to erode the purchasing power of fiat currencies.
Bitcoin, however, largely stagnated throughout much of 2025, trading around the $100,000 level while gold and silver rallied aggressively. The divergence led many investors to question whether bitcoin still belonged in the debasement trade and whether its role as a hedge against fiat currency dilution had weakened.
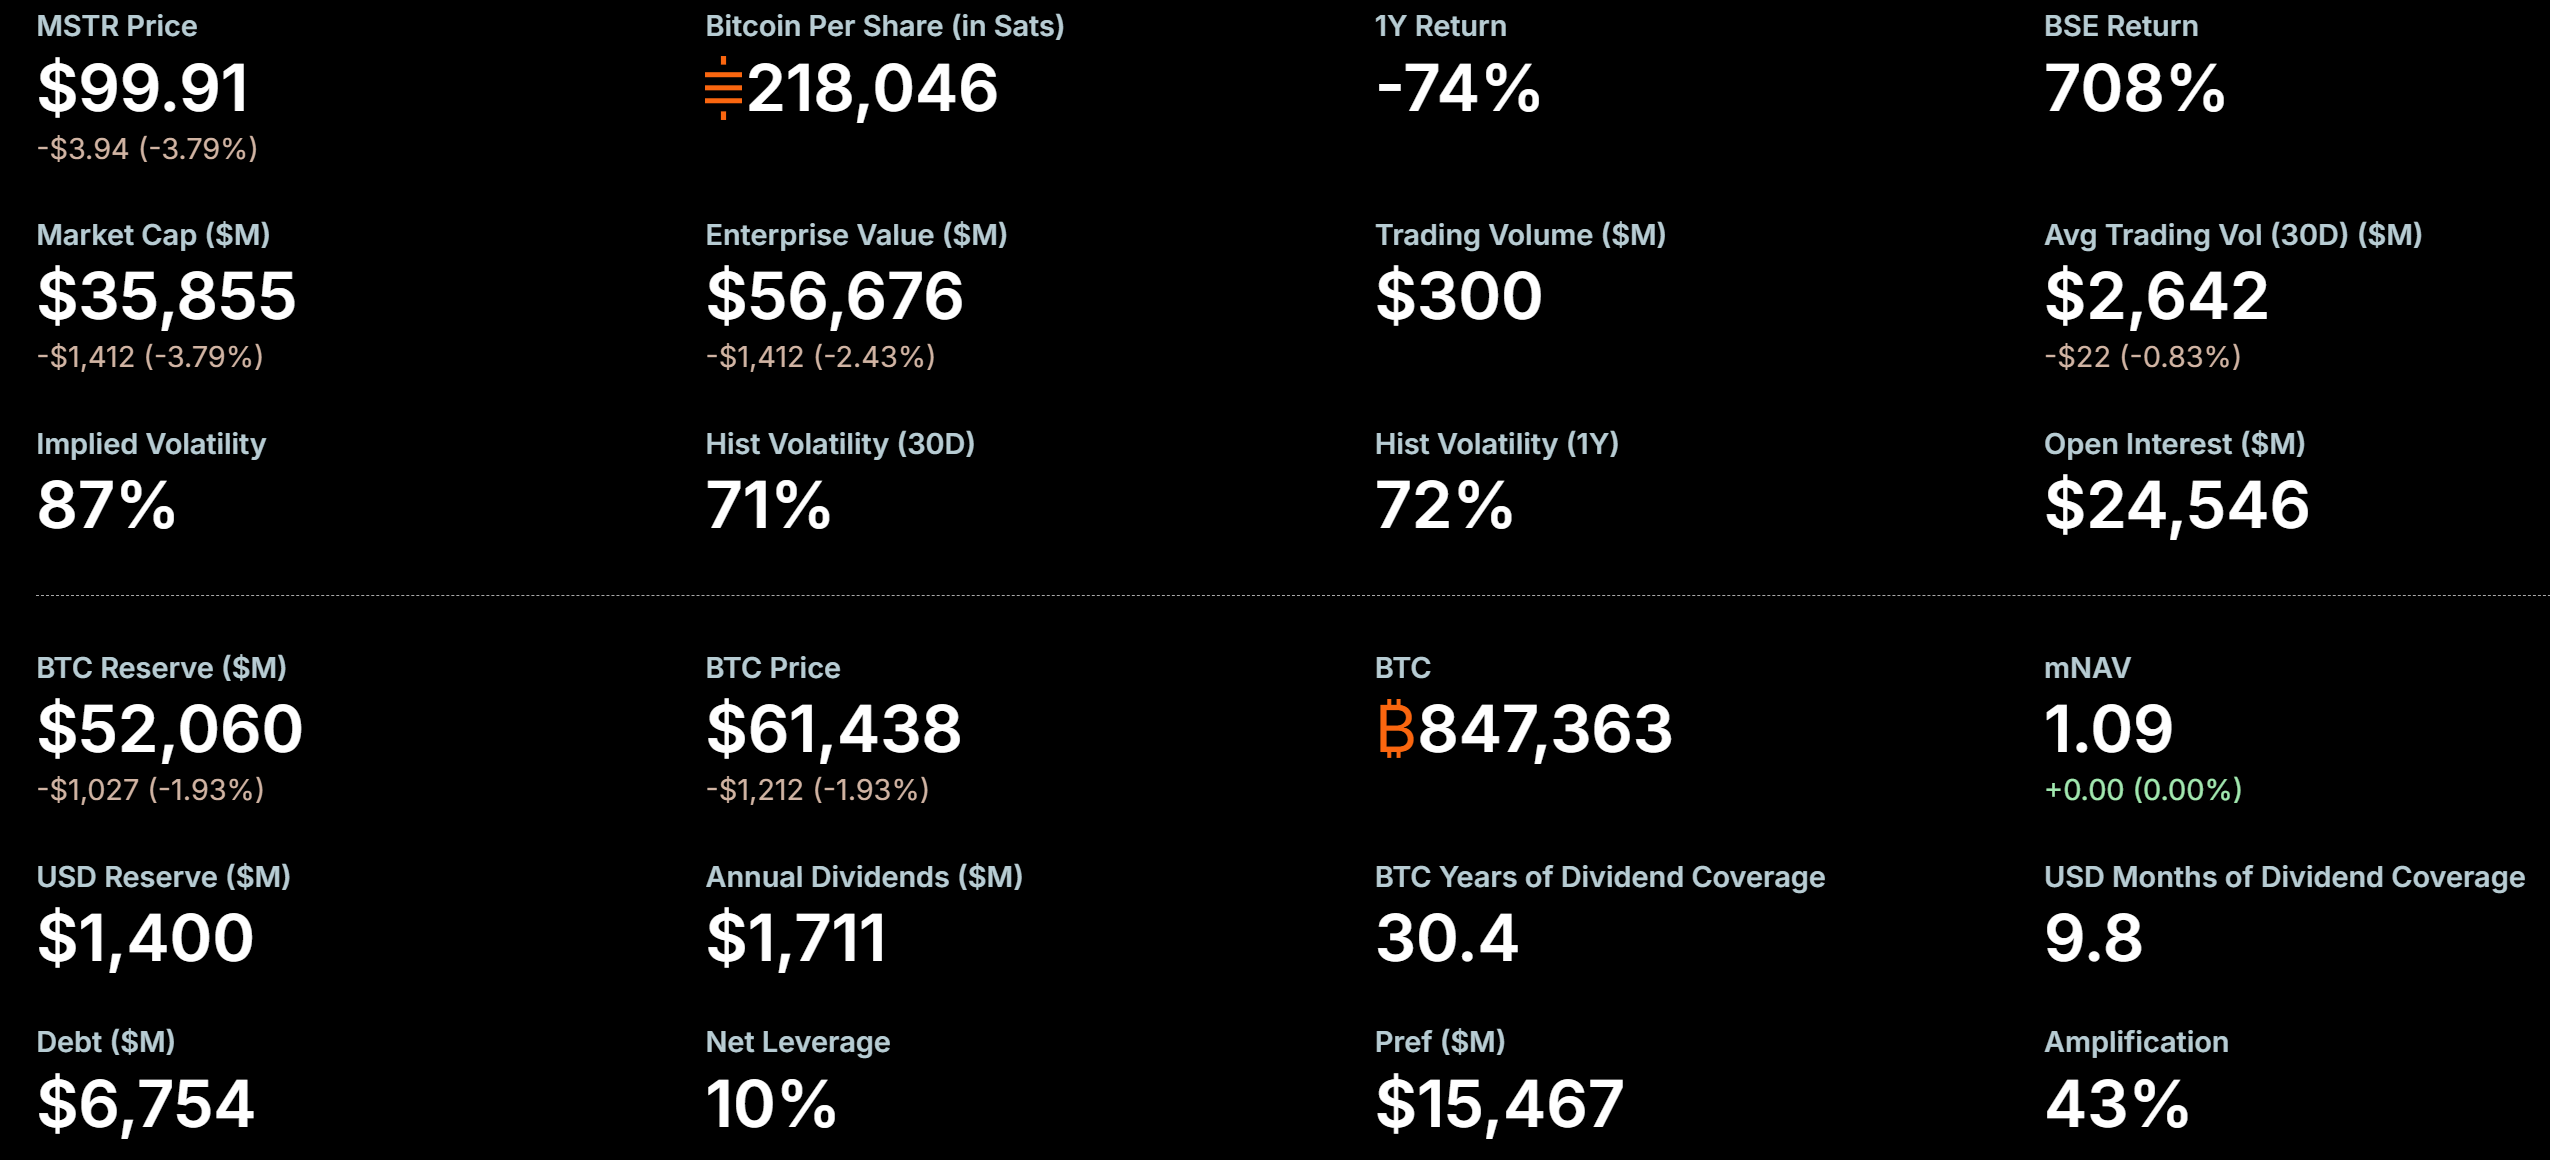
Strategy Inc. (MSTR) shares fell below $100 intraday on June 24, 2026, reaching levels not seen since March 2024, as Bitcoin traded near $61,300.
The breach highlights the amplified sensitivity of the company’s stock to cryptocurrency price action during periods of market pressure.

MSTR Tests Multi-Year Low
Shares declined from a June 23 close of $103.84, trading as low as the $99 range on elevated volume. The breach ends a long hold above $100 that persisted through the 2024–early 2025 rally.
From peaks above $450 in late 2024, the stock has dropped sharply, reflecting both broader market pressure and company-specific dynamics.
The post MicroStrategy Stock Drops Below $100 For the First Time Since March 2024 appeared first on BeInCrypto.

The banking lobby is wrong about stablecoins and community banks
Mac Jones Is Back in the Vikings Rumor Mill

Microsoft says its data centers use 90% less water than its earliest facilities as public concern grows


-

 Fashion5 days ago
Weekend Open Thread: Miami – Corporette.com
-

 Entertainment4 days ago
Renter of Home in Anne Heche Crash Denies Settlement With Son
-

 Tech2 days ago
Microsoft accidentally kills epic Outlook email threads
-
 Sports20 hours ago
Two goals and an assist by sheer aura: Cristiano Ronaldo just entered the World Cup chat
-

 Business4 days ago
Soccer-U.S. defends Iran World Cup travel restrictions, says discussions ongoing
-
Crypto World11 hours ago
Bitcoin (BTC) Dips Below $62K, Ethereum (ETH) Plunges 6% Daily: Market Watch
-

 Politics6 days ago
BBC Reporter Discusses Cross Party Criticism Of Trumps Iran Deal
-

 Crypto World8 hours ago
Securitize Wraps Roubini's SEC-Registered ETF as Dubai VARA Digital Security
-
Business14 hours ago
Entergy settles forward sale agreements, raises $672 million in cash proceeds
-
 Business4 days ago
Wall Street Week Ahead: Investors see Micron earnings as pulse check of AI rally momentum
-

 Politics4 days ago
Andy Burnham and the meaning of Makerfield
-

 Tech6 days ago
AWS enters the context layer race with a graph that learns from agents, not manual curation
-
 Crypto World4 days ago
Can Charles Hoskinson Really Rescue Cardano?
-

 Crypto World5 days ago
HIVE shares jump as $220M AI deal speeds Bitcoin mining pivot
-

 NewsBeat5 days ago
Keir Starmer Allies Question His Chances For No 10
-

 Crypto World4 days ago
Jake Chervinsky accuses CME of protecting derivatives monopoly
-

 Tech2 days ago
Nearly 7,000 fake Amazon domains registered ahead of Prime Day 2026, researchers warn
-
 Tech3 days ago
Signal’s Meredith Whittaker says AI chatbots ‘are not your friends’ and calls Copilot agents a backdoor
-

 Business6 days ago
Brexit cost 6% of UK economy, Bank of England company data suggests
-

 Sports6 days ago
FIFA World Cup 2026: Canada beat 9-men Qatar 6-0 to register first ever win | FIFA World Cup 2026
You must be logged in to post a comment Login