Strategy is turning to preferred stock to keep buying Bitcoin while easing pressure from market swings.
Summary
Strategy is issuing more preferred shares to fund Bitcoin purchases.
The “Stretch” stock pays an 11.25% variable dividend and aims for price stability.
The move targets investors seeking crypto exposure with lower risk.
Strategy is expanding its use of preferred stock as it looks for new ways to fund Bitcoin purchases while reducing pressure from market volatility.
The move comes as the company’s share price continues to closely track swings in the cryptocurrency market.
Advertisement
A new approach to managing risk
In a Feb. 12 interview with Bloomberg, chief executive officer Phong Le said the company is offering more perpetual preferred shares to attract investors who want exposure to digital assets without extreme price changes. The product, known as “Stretch,” pays a variable dividend that is adjusted each month.
The current dividend rate stands at 11.25%. The structure is designed to keep the stock trading close to its $100 par value. This helps limit sharp price movements that are common in Strategy’s regular shares.
Preferred shares sit above common stock in the company’s capital structure but below debt. They usually offer a steady income and priority on dividends, while giving up voting rights. This makes them appealing to investors who value stability over rapid growth.
Advertisement
Funding Bitcoin while limiting volatility
Over the past three weeks, Strategy raised about $370 million through common stock sales and another $7 million through preferred shares. The funds were used to buy more Bitcoin (BTC), pushing the company’s total holdings above 714,000 BTC, worth roughly $48 billion.
For years, Strategy’s business model has been built around using capital markets to accumulate Bitcoin. As a result, its stock often behaves like a leveraged version of the cryptocurrency. When Bitcoin rises, the stock tends to surge. When prices fall, losses are often amplified.
Bitcoin has dropped around 50% from its recent peak, which has weighed heavily on Strategy’s shares. This slowdown has made it harder for the company to rely only on common stock sales for funding.
Preferred stock offers another option. The steady dividend and price controls are meant to attract institutions such as pension funds, insurers, and banks. These investors often prefer predictable returns rather than high-risk exposure.
Advertisement
Co-founder Michael Saylor has repeatedly said the company has no plans to sell its Bitcoin. Strategy intends to continue buying more each quarter, regardless of market conditions.
Analysts say preferred shares also strengthen the company’s balance sheet. Compared with convertible bonds, they reduce refinancing risk and limit sudden dilution for existing shareholders.
Strategy raised about $5.5 billion through several preferred stock offerings in 2025. The latest issuance continues that pattern, showing that the company sees long-term value in this funding model.
Binance ETH reserve fell to 3.3M ETH, breaking below both the February and August 2024 historical lows.
Bitcoin reserves on Binance declined from 670,000 BTC in early February to 636,000 BTC by early April 2025.
USDT reserves on Binance grew from $35 billion on March 12 to $38 billion by April 2, reflecting rising dry powder.
USDC balances climbed from $4.6 billion in February to $6.6 billion by April 2, adding to total stablecoin buying power.
Binance ETH reserve has dropped to its lowest level in over a year, falling below key historical lows. At the same time, stablecoin balances on the exchange have been rising steadily.
On-chain data from CryptoQuant shows that these two opposing trends are reshaping the exchange’s liquidity structure.
The shift points to easing sell-side pressure alongside growing buying power among traders holding dollar-denominated assets.
ETH and BTC Reserves Record Notable Declines on Binance
Binance’s Ethereum reserve has fallen to 3.3 million ETH, according to CryptoQuant analyst Amr Taha. This level sits below the February 2024 low of 3.53 million ETH and the August 29, 2024 low of 3.49 million ETH. Breaking below both historical support levels marks a clear downward trend in ETH holdings on the exchange.
Binance ETH Reserve Drops Below February 2024 Low While USDT and USDC Reserves Climb
“If this trend continues, it could create a more supportive setup for price expansion.” – By Amr Taha pic.twitter.com/aFbrLcdObH
Bitcoin reserves on Binance have also moved lower over recent weeks. The BTC balance declined from approximately 670,000 BTC in early February to 636,000 BTC by early April. That drop reflects a similar pattern of reduced crypto asset supply sitting on the exchange.
When fewer coins rest on an exchange, available sell-side supply tends to shrink. This shift often reduces the immediate pressure that sellers can place on spot prices during periods of market activity.
Rising Stablecoin Reserves Point to Growing Buying Power
As crypto reserves declined, stablecoin balances on Binance moved in the opposite direction. USDT reserves grew from $35 billion on March 12 to $38 billion by April 2. USDC reserves also climbed from $4.6 billion in February to $6.6 billion over the same period.
Advertisement
Taha noted in his analysis: “If this trend continues, it could create a more supportive setup for price expansion.” The combined growth in USDT and USDC balances reflects an accumulation of dry powder sitting ready on the exchange.
Stablecoin reserves rising while crypto reserves fall is a well-known market structure among experienced traders. It suggests that capital has rotated out of volatile assets and into dollar-pegged holdings, without leaving the exchange entirely.
Whether buyers begin deploying those stablecoin balances into spot markets remains the key variable to watch in the coming weeks.
X is preparing to automatically lock Twitter accounts that mention crypto for the first time, and the ripple effect on memecoin communities built entirely on social momentum could be severe.
X Head of Product Nikita Bier confirmed the mechanism directly: “We are in the process of implementing auto-locking + verification if a user posts about cryptocurrency for the first time in the history of their account.”
Yeah we’re aware. We are in the process of implementing auto-locking + verification if a user posts about cryptocurrency for the first time in the history of their account. This should kill 99% of the incentive, especially since Google isn’t doing shit to stop the phishing…
The trigger is first-time crypto posting, not repeat offenders. Bier’s rationale targets the 99% of phishing incentives tied to hijacked accounts promoting fraudulent tokens and fake giveaways. The move follows a wave of fake copyright violation emails stripping users of login credentials and 2FA codes.
For memecoins that depend on viral first-post discovery, new wallets, new converts, and new degens, this is a direct hit to the top of the funnel.
Advertisement
The broader market context adds pressure. X’s bot crisis, driven by AI-powered scam accounts exploiting recommendation algorithms with deepfake-heavy promotions, has already eroded trust in platform-native crypto signals.
Crypto Twitter Lock Mechanism Could Be A Good Cure For The Space
X’s verification layer filters scam noise and actually improves signal quality for legitimate crypto Twitter projects, driving renewed institutional interest and bringing back trust back to the industry. But the market might see whether the auto-lock policy reduces spam effectively or simply chills organic growth.
Advertisement
However, policy friction could also reduce crypto posting from new users by a material margin, cutting viral discovery loops that memecoins depend on.
X is about to auto-lock your account the moment you post about crypto – if it's your first time. Head of Product Nikita Bier just announced it. Hackers break into accounts and immediately start shilling random tokens. X is now looking to freeze those accounts before the damage… pic.twitter.com/IWV7ZuB4fw
Bitcoin Hyper Targets Early Infrastructure Upside as Memecoins Face Platform Risk
When social-layer memecoins face existential platform risk, capital has historically rotated toward projects with utility that doesn’t depend on viral posting cycles. That rotation is already showing up in presale momentum, and it’s worth watching where that money is going.
Bitcoin Hyper ($HYPER) is positioning directly in that gap. The project claims the title of the first-ever Bitcoin Layer 2 with Solana Virtual Machine (SVM) integration, delivering a faster performance than Solana through extremely low-latency processing, a Decentralized Canonical Bridge for BTC transfers, and high-speed smart contract execution.
Bitcoin has core limitations of slow transactions, high fees, and near-zero programmability, and Hyper is here to fix them. Hard numbers back the early traction, $32 million raised at a current price of $0.013678, with staking at a high 36% APY for early participants. Presale capital has been flowing toward infrastructure plays as memecoin sentiment cools.
Two U.S. military aircraft were shot down in separate incidents during combat operations over Iran on April 3 — an F-15E Strike Eagle and an A-10 Thunderbolt II — with a search-and-rescue operation still ongoing for one missing crew member as Operation Epic Fury approaches its sixth week.
Summary
Iran shot down a U.S. F-15E Strike Eagle on April 3; one of the two crew members was rescued, the other remains unaccounted for
An A-10 Thunderbolt II dispatched during the rescue effort was also struck by Iranian fire; the pilot ejected and was subsequently recovered
The incidents directly contradict recent U.S. government claims of complete air dominance over Iran, complicating the administration’s public messaging on the war’s progress
U.S. officials confirmed to CBS News that the F-15E Strike Eagle — a two-seat aircraft flown by a pilot and a weapons systems officer — was shot down by Iranian forces. One crew member was rescued by U.S. forces following a combat search-and-rescue mission. The second crew member, a weapons systems officer, remains missing. Images verified by CNN showed low-flying rescue aircraft conducting operations over Khuzestan Province in central Iran.
A rescue helicopter that extracted the surviving pilot was hit by small arms fire during the operation, wounding crew members on board before landing safely. An A-10 Warthog dispatched as part of the search effort was then struck by Iranian fire, forcing its pilot to eject over the Persian Gulf before recovery.
Advertisement
Iran’s state media posted claims of downing the aircraft and announced a reward for the capture of any “enemy pilot or pilots.” Iran’s Parliament Speaker Mohammad Bagher Ghalibaf mocked the U.S. search effort publicly on X.
A Direct Contradiction
The downing conflicts with statements from President Trump, who said in a prime-time address two days earlier: “They have no anti-aircraft equipment. Their radar is 100% annihilated. We are unstoppable as a military force.” Defense Secretary Pete Hegseth and other officials have repeatedly asserted U.S. air dominance over Iran.
According to Axios, three F-15Es had previously been lost to friendly fire during the conflict. The war has now claimed 13 American lives and wounded 365 service members. Israel separately suspended airstrikes in areas relevant to the ongoing U.S. rescue effort, according to an Israeli official speaking anonymously to the Associated Press.
Advertisement
Economic Pressure
Iran’s response has escalated alongside the aircraft losses. Tehran has imposed what amounts to a toll system on the Strait of Hormuz, a waterway through which approximately 20% of globally traded oil transits. Missile and drone attacks struck oil, gas, and desalination facilities across the Persian Gulf on Friday. The Federal Reserve Bank of Chicago’s Austan Goolsbee told CBS News that the Iran war risks fueling inflation in a way that could prevent the Fed from cutting rates in 2026.
As analysts warned months ago, Middle East escalation carries supply chain and inflationary consequences that reverberate across all risk assets. Institutional capital flows have already shifted in response to the conflict’s progression, with large asset managers repositioning across both traditional and digital markets as geopolitical uncertainty deepens.
Leap Wallet will shut down its products by May 28, ending a crypto wallet project that began in the Terra ecosystem and later expanded to Cosmos and other chains.
Summary
Leap Wallet will shut down its apps, web platform, exchange tool, and validator service by May 28.
Users can still access assets through another wallet using their recovery phrase or private key.
Leap began in Terra and expanded into Cosmos after the 2022 collapse changed its path.
The closure affects its browser extension, mobile apps, web app, exchange tool, and validator service.
Leap said on Friday that it plans to sunset its software suite by May 28. The shutdown covers its browser extension, iOS and Android apps, Leap WebApp, Swapfast exchange platform, and Leap Cosmos Hub Validator.
Advertisement
The team said the decision came after building across multiple networks since 2022. In a post on X, it said, “We started Leap in 2022 to redefine what wallet experiences in crypto mean.” It added that the project later grew across “100+ chains.”
Leap also said the move was difficult for the team. It stated, “This decision was not made lightly,” while adding that it still believes in the long-term future of crypto and the interchain ecosystem.
Leap said noncustodial users will still be able to access their assets after the shutdown. The team explained that users can restore the same wallet address through another wallet by using a recovery phrase or private key.
Advertisement
The FAQ said there is no need to move assets to a new address. It explained, “There is no need to withdraw or send your assets to a new address,” because importing the recovery phrase or private key will restore access to the same address.
The team also issued a separate notice for Cosmos users who delegated ATOM to Leap’s validator. It asked them to redelegate to another validator if they want to keep earning staking rewards.
Project began in Terra ecosystem
Leap launched in late 2021 with a $50,000 grant from Terraform Labs, the now-defunct firm behind TerraUSD. In early 2022, the project raised a $3.2 million seed round co-led by CoinFund and Pantera Capital.
At the start, Leap positioned itself as a wallet focused on Terra, with tools for staking LUNA, trading, and connecting with applications such as Anchor and Mirror. It aimed to offer a wallet experience similar to what MetaMask built for Ethereum and Phantom built for Solana.
Advertisement
After the collapse of Terra in 2022, Leap shifted its focus and expanded into the wider Cosmos ecosystem. That move allowed the project to continue as a multi-chain wallet after its original market changed.
The shutdown now closes that chapter for the wallet. While the apps and related services will go offline, users will still retain control of their assets through standard wallet recovery tools supported by other providers.
Leap Wallet will sunset all products, including extensions and mobile apps, on May 28, 2026, across iOS and Android.
Users can migrate safely using their recovery phrase, as Leap is non-custodial and assets remain on the blockchain at all times.
ATOM delegators staking with Leap’s Cosmos Hub validator must redelegate early due to network unbonding period delays.
After the May 28 deadline, all installed Leap apps will stop functioning, though fund recovery via recovery phrase remains fully possible.
Leap Wallet has officially announced that it will discontinue all its products on May 28, 2026. The crypto wallet provider has been active since 2022, serving users across more than 100 blockchain networks.
The shutdown covers extensions, mobile apps, and several associated services. Users are advised to begin migrating their assets to other supported wallets ahead of the deadline.
All core wallet functions will remain available until that date to allow a smooth transition.
Products Scheduled for Discontinuation After the May Deadline
The shutdown affects a broad range of products tied to the Leap ecosystem. These include Leap Wallet browser extensions and mobile versions on iOS and Android.
Compass Wallet, the Leap WebApp, and the Swapfast service are also on the list. Leap Cosmos Hub Validator and Leap Cosmos Snaps will be discontinued as well.
Advertisement
The team behind Leap shared the news through an official tweet. They noted the wallet was launched to change what crypto wallet experiences could offer users.
Since launch, it expanded to support over 100 chains across multiple ecosystems. The post also reflected the care and responsibility the team felt toward its user base.
In the announcement tweet, the team wrote that the decision to shut down was not made lightly. They added that they continue to believe in the long-term future of the crypto space.
Leap Wallet: Sunset Notice
After careful consideration, we’ve made the decision to sunset Leap Wallet and its associated products.
Advertisement
The products will be sunset on 28th May, 2026, and all users should complete their migration before then.
We started Leap in 2022 to redefine what…
— Leap Wallet | Sunset on 28th May (@leap_wallet) April 2, 2026
They also extended appreciation to partners and users who supported the product over the years. The message was direct, measured, and absent of any bitterness or blame.
Advertisement
Until May 28, 2026, all listed products will retain their existing core functionality. Users can still view balances, send tokens, and manage their staking positions.
Exporting recovery phrases and private keys will also remain available throughout this period. No core feature will be removed before the official sunset date arrives.
What Users Must Do Before the Shutdown Date
Users holding assets in Leap Wallet are encouraged to move to another wallet provider. The team recommended Keplr, MetaMask, Phantom, and Rabby as compatible alternatives.
Since Leap is a non-custodial wallet, assets are held on the blockchain and not within the app. This means migration does not require any complex transfer of funds between addresses.
Advertisement
Any user with a recovery phrase can import it directly into another supported wallet. That process will restore all addresses and balances automatically across compatible chains.
No manual transfers are necessary for this to work correctly. Starting early reduces the risk of delays or missed steps before the deadline.
Those who delegated ATOM to Leap’s Cosmos Hub validator must also take a separate action. They need to redelegate to another validator to keep earning staking rewards.
Network unbonding periods can stretch over several days, so acting promptly matters. A detailed migration guide with full instructions is available at leapwallet.io.
Advertisement
After May 28, 2026, all Leap products will stop functioning, including already-installed apps. Users who miss the deadline can still recover their funds using their recovery phrase.
Importing it into any compatible wallet will restore full access to holdings. Migration support remains available at support@leapwallet.io until the shutdown date.
Polymarket removed a market tied to the fate of a missing US service member after mounting backlash, saying the listing violated its “integrity standards.”
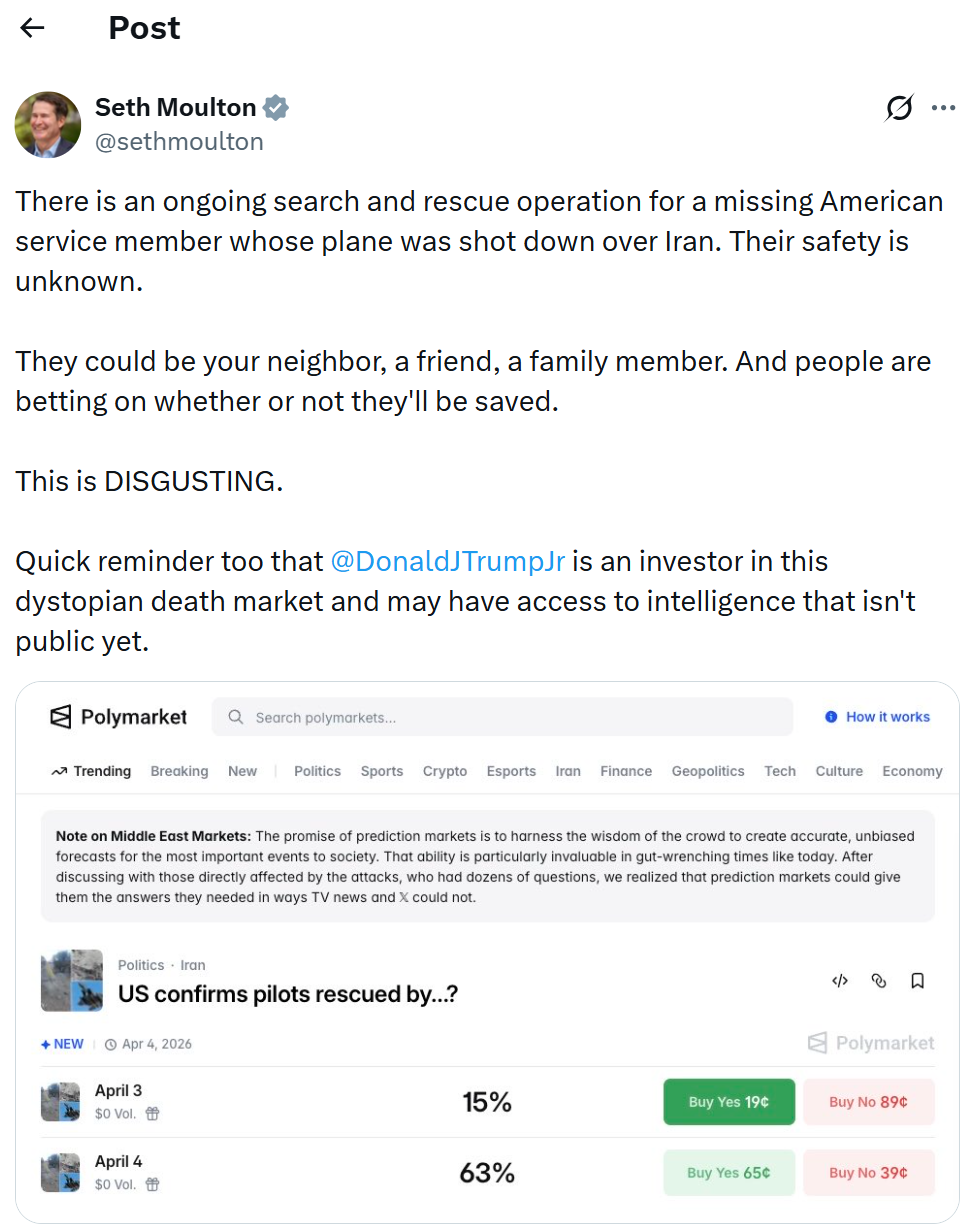
The controversy erupted after a prediction market appeared asking whether US authorities would confirm the rescue of a pilot reportedly shot down over Iran, with most users (over 60%) betting that they wouldn’t be rescued until Saturday.
US Representative Seth Moulton condemned the market, calling it “disgusting” and expressing concerns over people speculating on the fate of a potentially injured service member. “They could be your neighbor, a friend, a family member. And people are betting on whether or not they’ll be saved,” Moulton wrote.
Representative criticizes Polymarket market. Source: Seth Moulton
In response, Polymarket said it had taken the market down immediately, adding that it should not have been listed and that the company is reviewing how it passed internal safeguards. The platform did not provide further detail on what specific rule had been breached.
While Polymarket said it took the market down because it did not meet its integrity standards, the platform did not specify which rule had been violated, prompting further scrutiny from users.
“I’m looking at the “Market Integrity” page, and I checked the TOS, and I don’t see which prohibition is relevant here,” Jack Newsham, a correspondent on Business Insider’s national desk, wrote on X.
As Cointelegraph reported, Polymarket has seen a sharp rise in fees and revenue after expanding its fee model on March 30, with daily fees jumping from about $363,000 to over $1 million and revenue nearing $1 million at its peak. The increase follows broader taker fees across categories like finance, politics and tech, as the platform ramps up monetization.
Insider trading concerns rise on prediction markets
There have also been growing concerns about insider trading on prediction markets. Last month, it was reported that a group of traders made about $1 million by correctly betting on the timing of US strikes on Iran, with some placing trades just hours before the attacks. The activity, which involved newly created wallets focused almost entirely on strike-related bets, raised insider trading suspicions.
To address these concerns, at least 42 Democratic lawmakers have urged the US Commodity Futures Trading Commission and the Office of Government Ethics to warn federal employees against using non-public information to trade on prediction markets.
Cointelegraph is committed to independent, transparent journalism. This news article is produced in accordance with Cointelegraph’s Editorial Policy and aims to provide accurate and timely information. Readers are encouraged to verify information independently. Read our Editorial Policy https://cointelegraph.com/editorial-policy
Brian Armstrong has put himself personally on the line for Bitcoin quantum resistance, pledging direct oversight of Coinbase’s post-quantum cryptography research and implementation efforts at a moment when the threat has moved from theoretical to time-stamped.
The commitment signals that Coinbase is no longer treating quantum risk as a long-range problem for someone else’s roadmap.
Going to start spending time on this personally – seems like we all need to solve it sooner rather than later. https://t.co/qLUE6TCPL5
The urgency is not manufactured. Google Quantum AI and Caltech research published in late 2025 modeled a hypothetical advanced quantum computer cracking Bitcoin’s encryption in under nine minutes – barely inside the network’s 10-minute block confirmation window.
Advertisement
Armstrong’s personal involvement is a direct institutional response to that narrowing margin.
Key Takeaways:
Armstrong’s Commitment: Coinbase CEO Brian Armstrong has pledged personal oversight of the exchange’s Bitcoin quantum resistance initiatives, including collaboration with Bitcoin Core developers through a newly formed Quantum Advisory Council.
The Threat Window: Google Quantum AI research models a cryptographically relevant quantum computer breaking Bitcoin’s encryption in under nine minutes – inside the 10-minute block time – with Google targeting quantum readiness by 2029.
Protocol Reality: Bitcoin’s decentralized governance requires community consensus via the BIP process for any cryptographic upgrade – making Coinbase’s developer-facing engagement more consequential than a unilateral exchange decision.
Industry Alignment: MicroStrategy’s Michael Saylor and Coinbase CSO Philip Martin are actively contributing to quantum resistance efforts; BTQ Technologies deployed a quantum-resistant Bitcoin Core testnet in early 2026, with mainnet planned for Q2 2026.
What to Watch: BTQ Technologies’ Q2 2026 mainnet launch and the Coinbase Quantum Advisory Council’s first published migration standards are the two near-term signals that will indicate whether institutional momentum is translating into protocol-level action.
The Quantum Threat to Bitcoin Is Specific – and the Clock Is Running
Bitcoin’s cryptographic security rests on the elliptic curve discrete logarithm problem. Google’s quantum research has already prompted other blockchain ecosystems to accelerate post-quantum cryptography transitions, and Bitcoin – the most valuable target – faces the sharpest exposure.
Advertisement
The specific mechanism is Shor’s Algorithm: run on a sufficiently powerful quantum computer, it can derive a private key from an exposed public key, which is precisely what happens when a Bitcoin address transacts on-chain.
Many are wondering "what Google saw" that caused them to revise their post-quantum cryptography transition deadline to 2029 last week. It was this: https://t.co/dQtmTK9pdz
Older Pay-to-Public-Key-Hash addresses are most exposed. SegWit and Taproot addresses offer partial cover – the public key isn’t broadcast until spending – but that protection evaporates the moment funds move. NIST finalized its first post-quantum cryptography standards in 2024, establishing lattice-based and hash-based signature schemes as the baseline framework. Bitcoin has not adopted any of them yet.
That gap – between available cryptographic tools and Bitcoin’s actual protocol, is the structural problem Armstrong is positioning Coinbase to help close.
What Armstrong’s Personal Oversight Actually Means – and Why Coinbase’s Institutional Weight Changes the Calculation
Armstrong’s commitment is not a press release pledge. According to reporting on the initiative, Coinbase has established a Quantum Advisory Council that includes Bitcoin Core developers, with the explicit mandate to develop migration standards before cryptographically relevant quantum computers arrive.
Coinbase CSO Philip Martin described the situation as an “urgent problem” requiring industry consensus – and noted that post-quantum cryptography exists, but Bitcoin lags other chains in adopting it.
Advertisement
The latest quantum papers from Google and Caltech are an important signal for the industry. Timelines are still debated, but the time to act is now. The good news: post-quantum cryptography exists. This is a solvable problem, and many chains already have roadmaps. Bitcoin needs…
That distinction matters. This is not Coinbase upgrading its own infrastructure in isolation – a task any well-resourced exchange could accomplish internally.
The Advisory Council structure is designed to feed into the Bitcoin Improvement Proposal process, the community-consensus mechanism through which any protocol-level cryptographic change must pass. Coinbase, through its engineering resources and developer relationships, is positioning itself to draft and test BIPs specifically aimed at post-quantum transitions.
The institutional logic is transparent – and legitimate. Sovereign wealth funds and ultra-long-horizon institutional allocators weigh generational risk differently than retail traders.
Advertisement
Investor Kevin O’Leary has explicitly flagged quantum uncertainty as a factor that could deter institutional Bitcoin allocations.
By addressing a 10-to-20-year risk today, Coinbase is signaling custodial seriousness to exactly the capital it wants to attract. Coinbase’s recent regulatory positioning follows the same pattern: institutional-grade engagement on foundational issues before the pressure becomes acute.
JUST IN: Kevin O’Leary aka Mr. Wonderful says that institutions do not want to own more than 3% of Bitcoin in their portfolios because of the risk of quantum computing. pic.twitter.com/xJYLZlCvvb
MicroStrategy’s Michael Saylor is contributing to quantum resistance efforts alongside Armstrong – which adds significant Bitcoin treasury credibility to what might otherwise read as an exchange-driven initiative.
Advertisement
Jameson Lopp of Casa, who has tracked this risk closely, has estimated that full network migration to quantum-safe addresses will require years of coordination across wallets, custodians, and users. Armstrong’s involvement compresses none of that timeline on its own.
What it does is add institutional momentum to a process that previously lacked it.
Cambodia’s parliament passed its first cybercrime law on April 3, 2026, targeting online scam centres directly.
Convictions carry prison terms of up to 10 years and fines reaching $250,000 for gang-related scam operations.
Cambodia extradited two high-profile figures to China amid a broader crackdown on senior scam network leaders.
Britain sanctioned Cambodia’s largest fraud complex and a crypto marketplace used to trade stolen personal data.
Cambodia’s cybercrime law marks a turning point in the country’s fight against online fraud operations. The parliament passed the legislation on Friday, April 3, 2026, making it the first law specifically targeting scam centres.
These centres have cost international victims billions of dollars. The move follows growing global pressure on Southeast Asian governments to act against the illicit operations embedded across the region.
Parliament Approves Strict Penalties for Online Scam Operators
The new law sets out prison terms of two to five years for those convicted of online scams. Fines can reach up to $125,000 for individual offenders.
Gang-related scams or cases involving multiple victims carry heavier sentences of up to 10 years. Fines in such cases can go as high as $250,000.
Justice Minister Keut Rith described the law as a tool to strengthen ongoing enforcement efforts. He stated the law aimed to enhance the “cleaning operation” taking place across the country.
Advertisement
He also stressed that it would ensure the centres do not return after the crackdown. The law will proceed to Cambodia’s king for final signature before taking full effect.
Rith further explained the reach of the problem during his remarks to reporters. He said the issue had also affected the economy, tourism, and investment in Cambodia.
He described the law as being “strict like the fishing net, strict to ensure we don’t have the online scams anymore in Cambodia.” Those words captured the government’s stated intent to pursue a thorough and lasting enforcement effort.
The law also covers penalties for money laundering, data collection on victims, and scammer recruitment. Previously, Cambodia had no dedicated legislation for targeting scam operations.
Advertisement
Authorities had relied on charges such as aggravated fraud and recruitment for exploitation. This new legislation addresses that legal gap directly.
Recent Arrests and Extraditions Signal Broader Crackdown
Cambodia’s enforcement actions have extended beyond legislation in recent months. On Wednesday, the government extradited Li Xiong to China.
Li Xiong was a former leader at a Cambodian financial conglomerate accused of laundering money for criminal organisations. The extradition reflects a shift toward holding senior figures accountable.
In January, Chinese-Cambodian businessman Chen Zhi was arrested in Cambodia and also extradited to China. Chen Zhi faced accusations of running a brutal online scam and money laundering operation.
Advertisement
His arrest marked a dramatic reversal for a once-prominent business figure. The case drew international attention to Cambodia’s ties with transnational crime networks.
On Thursday, Britain sanctioned operators of what it described as Cambodia’s largest fraud complex. The UK also targeted a crypto marketplace used to trade stolen personal data.
Britain called it part of a fast-growing network of scam centres across Southeast Asia. Workers in these compounds are reportedly confined and forced to commit fraud.
Cambodian officials say the current campaign is broader than previous efforts. Hundreds of sites are being closed, and senior figures are being detained.
Advertisement
The government had long played down the existence of these compounds. That position has now clearly changed.
An imposter X account masqueraded as Jonathan the tortoise’s veterinarian to announce a fabricated death
Major publications including BBC, Daily Mail, and USA Today fell for the deception, which garnered 2 million views
Cryptocurrency donations were being requested through the fraudulent account
The governor of Saint Helena personally verified Jonathan was alive during a nighttime check
Cryptocurrency scam losses reached an unprecedented $17 billion in 2025
An elaborate social media hoax declaring the death of the planet’s oldest living terrestrial animal transformed into a cryptocurrency fraud scheme that managed to deceive numerous prominent international news organizations.
Jonathan the Tortoise is alive and well 🐢
• He’s ~193 years old — the longest-living land animal on Earth
• A suspected crypto scammer went viral on April Fools Day pretending to be his vet
Jonathan, a Seychelles giant tortoise aged 194 years who resides on Saint Helena island, became the subject of false death reports earlier this week following a deceptive X account that disseminated the fabricated news to millions of users.
The fraudulent profile adopted the name and credentials of Joe Hollins, Jonathan’s actual veterinary doctor. The account expressed being “heartbroken” while announcing that Jonathan had “passed away peacefully.”
Within a short timeframe, the message accumulated two million impressions. Multiple prestigious news organizations, including the BBC, Daily Mail, and USA Today, ran articles declaring Jonathan’s demise based solely on this account’s claims.
The reality: the authentic Joe Hollins maintains no presence on X whatsoever. He verified that the announcement was entirely fraudulent.
Advertisement
“Jonathan the tortoise is very much alive,” Hollins told USA Today. “I believe on X the person purporting to be me is asking for crypto donations… it’s a con.”
Investigation revealed the counterfeit account originated from Brazil rather than Saint Helena.
How the Truth Came Out
Nigel Phillips, Saint Helena’s governor, was preparing to retire for the evening when international messages began pouring in. He personally ventured outside during nighttime hours to inspect the tortoise’s condition firsthand.
Jonathan the Giant Tortoise’s death has been revealed to be a hoax, and the big guy is alive and well at the age of 193.
A crypto scammer created an account impersonating his caretaker and spread misinformation to several media outlets. pic.twitter.com/ybEonk8fDJ
Phillips discovered Jonathan precisely where expected — resting beneath a tree within his enclosure.
“Jonathan is asleep under a tree in the paddock,” Phillips told The Guardian. He verified the animal was “very much alive.”
The following Thursday morning, Phillips addressed the situation with humor on social platforms. He referenced Mark Twain, stating the “report of my death was an exaggeration.”
The Friends of the British Overseas Territories published an official statement highlighting that the fraudulent account had recently modified its username while actively requesting cryptocurrency contributions.
Guinness World Records acknowledged the news with a relieved “phew.”
Advertisement
Jonathan’s Condition
Notwithstanding the digital commotion, Jonathan maintains excellent health considering his advanced age. While he has experienced vision loss due to cataracts and no longer possesses his olfactory sense, his appetite remains robust and he continues to be physically active.
His residence at Plantation House, which serves as the governor’s official home, is shared with three companion tortoises: Emma, David, and Fredrik.
Throughout his remarkable lifespan, Jonathan has witnessed eight British monarchs, survived two global conflicts, and experienced the complete evolution of the digital era.
News organizations that initially published the death reports have subsequently issued retractions.
Advertisement
This deception represents a broader pattern of cryptocurrency fraud employing impersonation strategies. Blockchain analytics company Chainalysis documented that crypto scam losses achieved a record-breaking $17 billion throughout 2025.
Individual scam payments surged by 253% to an average of $2,764, fueled by artificial intelligence-enhanced impersonation techniques and progressively sophisticated criminal operations.
Block confirms its Bitcoin faucet launches April 6, allowing users to collect free satoshis online.
The original Bitcoin faucet, created in 2010, distributed roughly 19,700 BTC before closing in 2012.
Block cut 40% of its workforce to refocus on Bitcoin, using AI-driven workflows to sustain operations.
Block’s product line now includes Cash App, Bitkey hardware wallet, and Proto Bitcoin mining systems.
Bitcoin faucet is making a notable comeback, and Jack Dorsey’s Block is driving the effort. The company has confirmed Monday, April 6, as the official launch date.
Users will collect satoshis for free, closely mirroring the original model from 2010. Block currently holds 8,883 BTC, valued at around $594 million, on its balance sheet.
The revival reflects the firm’s continued focus on Bitcoin education and broader adoption.
The Origins and Evolution of Bitcoin Faucets
The original Bitcoin faucet launched in 2010, created by developer Gavin Andresen. His goal was straightforward: educate newcomers and promote adoption of the emerging digital currency.
Each Bitcoin address could claim 5 BTC at the time by solving a basic CAPTCHA. Those coins would be worth more than $330,000 in today’s market, had early recipients held them.
Advertisement
The site ran for about two years before shutting down in 2012. Over that period, it distributed roughly 19,700 BTC to participants around the world.
Block’s Bitcoin-focused account recently confirmed the return of this concept with a brief post: “The bitcoin faucet is back. 04.06.26 From btc.day.” The date in the post corresponds directly to the Monday launch schedule.
Since the original faucet closed, others have continued the model across various platforms. Modern faucets now often support multiple cryptocurrencies beyond Bitcoin alone.
Many rely on advertising revenue and microwallets to deliver small rewards consistently to users. Reputable platforms offer a beginner-friendly path into crypto, though caution around scam faucets remains necessary.
Advertisement
Block’s version stands apart due to its institutional resources and Bitcoin-only focus. The firm’s substantial BTC balance sheet provides a solid foundation for sustaining the program.
Free satoshis lower the entry barrier for newcomers exploring the space for the first time. The launch directly continues the educational mission that Andresen put in motion over 15 years ago.
Block’s Internal Shift and Expanding Bitcoin Products
Block recently restructured by cutting more than 4,000 jobs, approximately 40% of its total workforce. Dorsey described the move as a necessary step to refocus on core Bitcoin initiatives.
The company now relies on AI-driven development workflows to maintain output with leaner teams. Automated agents actively support reduced engineering staff across multiple product lines.
Advertisement
Dorsey and board director Roelof Botha back what they describe as a mini-AGI vision for Block. Their position is that AI can effectively replace several layers of traditional corporate coordination.
Smaller, focused teams can then operate more efficiently than larger conventional organizations. Block sees this internal model as a competitive advantage moving forward.
Block’s product line now extends well beyond Cash App’s peer-to-peer payment features. Bitkey is a self-custody hardware wallet for users who prefer direct control over their own Bitcoin.
Proto offers a range of Bitcoin mining systems for individuals looking to join the network. Together, these products reinforce Block’s position as a full-service Bitcoin company.
Advertisement
The Bitcoin faucet launch ties directly into this expanding product ecosystem. New users who receive free satoshis may later turn to Bitkey for secure storage solutions.
Others could explore Proto as a natural pathway into Bitcoin mining. The April 6 launch connects these offerings through a shared and accessible onboarding strategy.


 NewsBeat2 days ago
 Business1 day ago
 Fashion16 hours ago
 Crypto World3 days ago
 Tech5 days ago

 Tech5 days ago
 Sports4 days ago
 Business2 days ago
 Fashion6 days ago
 Tech4 days ago
 Tech6 days ago
 Tech4 days ago
 Fashion5 days ago
 Politics5 days ago
 Crypto World4 days ago
 Tech5 days ago
 Tech4 days ago
You must be logged in to post a comment Login