
Crypto World
Pippin (PIPPIN) Enters Crypto’s Top 100 Club After Soaring 30% in a Day: More Room for Growth?
“Really nice chart, pure strength,” one popular analyst stated.
The meme coin pippin (PIPPIN) once again defied the ongoing bearish environment in the cryptocurrency market, with its price rallying by roughly 30% over the past 24 hours.
It has become a point of interest for well-known analysts who believe further short-term gains could be forthcoming.
Rising Through the Ranks
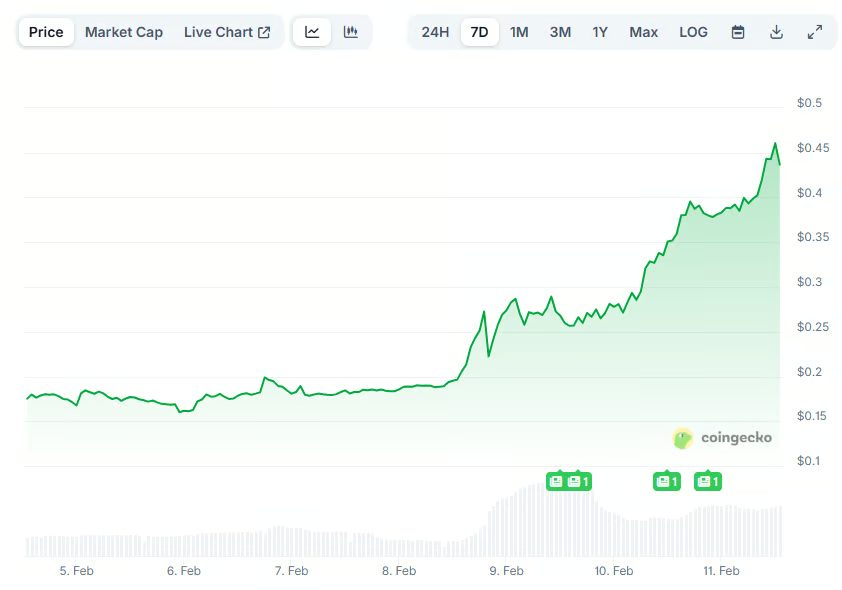
Earlier today (February 11), PIPPIN’s valuation climbed to as high as $0.46, marking the highest level since the end of January. Currently, it trades at around $0.44 (per CoinGecko’s data), representing a whopping 144% spike on a weekly scale.
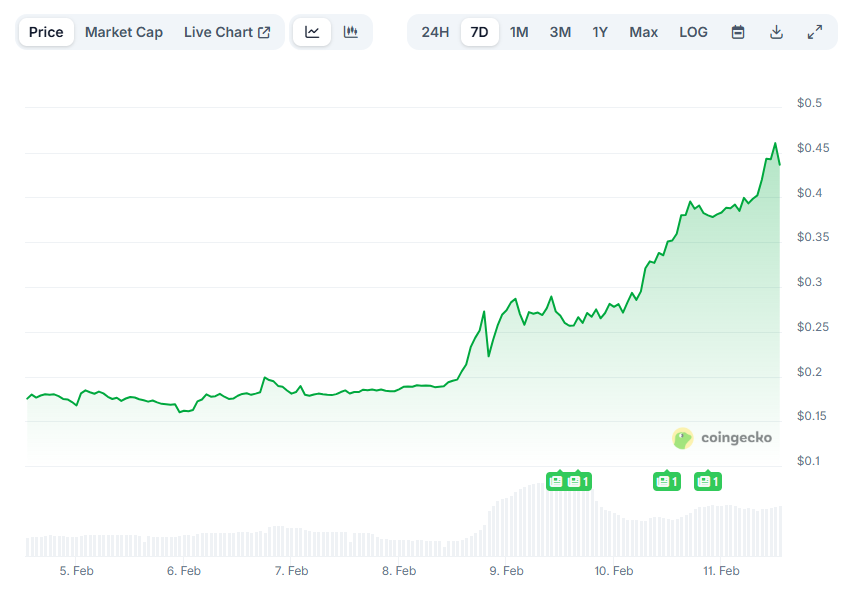
Its market capitalization soared well above $400 million, making PIPPIN the 100th-largest cryptocurrency. Over the past few weeks, it flipped Pudgy Penguins (PENGU), dogwifhat (WIF), and FLOKI (FLOKI) and now stands as the eighth-biggest meme coin. The undisputed leader in the realm remains Dogecoin (DOGE), whose market cap exceeds $15 billion.
According to the analyst who goes by the X moniker Sjuul | AltCryptoGems, PIPPIN has more fuel to post additional gains, setting the next target at around $0.50.
“Really nice chart, pure strength! Extremely well-respected support and resistance levels, and full ripping after that deviation! If I smell this right, resistance should be next,” he said.
Earlier this week, the market observer Satori also put PIPPIN on their watchlist, claiming “a much stronger breakout” might be on the horizon.
Investors Should Beware
While the asset has undoubtedly turned into one of crypto’s sensations in the past few days, those planning to invest in it must tread lightly. First, meme coins are notorious for their high volatility, meaning PIPPIN can make a sudden move and crash by double digits in a short period.
You may also like:
Second, some analysts on X have warned that the token is primarily driven by speculation, whereas its utility and use cases are questionable (to say the least). Critics like Diane De crypto went even further, calling PIPPIN “the biggest money laundering event happening right in front of your eyes.”
The asset’s Relative Strength Index (RSI) can also be interpreted as a warning sign for investors. The technical analysis tool measures the recent speed and magnitude of the latest price changes, and traders often use it to spot potential reversal points.
It ranges from 0 to 100, and ratios above 70 indicate PIPPIN is overbought and could be due for an imminent pullback. On the contrary, anything beneath 30 might be viewed as a buying opportunity. Currently, the RSI stands at approximately 72.

SECRET PARTNERSHIP BONUS for CryptoPotato readers: Use this link to register and unlock $1,500 in exclusive BingX Exchange rewards (limited time offer).

RAVE crypto crashed over 44% to nearly $10 earlier today before backpedalling on some of its losses as investors bought the dip.
Summary
- RaveDAO surged over 5,300% to a $19.54 all-time high before crashing nearly 45% to $10, as profit-taking followed a massive short squeeze.
- The token has since rebounded nearly 50% to around $15, with rising futures open interest and improving funding rates signaling strong bullish positioning.
- Exchange outflows and bullish technical indicators suggest RAVE could attempt another rally toward a new high above $20.
According to data from CoinGecko, RaveDAO (RAVE) price skyrocketed over 5,300% this week to an all-time high of $19.54 on Wednesday, becoming the best-performing crypto asset among the top 100 cryptocurrencies across daily, weekly, and monthly timeframes.
The token price rose due to a massive short squeeze triggered by a sudden surge in social media engagement and speculative retail interest. As prices rose higher, short sellers were forced to liquidate their positions, which added further fuel to the upward momentum and created a feedback loop of buying pressure.
It was also supported by the recent listing of RAVE on several secondary exchanges, which significantly boosted liquidity and accessibility for new traders.
Following the sharp rally, the token fell nearly 45% to near $10 as investors booked profits following the massive surge. It is quite common for investors to book some profits, especially after such an unprecedented vertical move that left the asset in overbought territory.
As of press time, the token has rebounded by nearly 50% back to $15, raising eyebrows over whether bulls are attempting to push the token to a new all-time high.
A look at the token futures market seems to suggest that market conviction remains incredibly high despite the volatility. Notably, the total futures open interest of the token rose over 30% to $470 million in the past 24 hours. This suggests that a majority of traders are leaning towards bullish bets, likely expecting the price to recover amid recent U.S. Iran war ceasefire news, which has improved overall market sentiment.
At the same time, the weighted funding rate of the token is exiting the red zone, a sign that the extreme bearishness of short sellers is fading and long positions are becoming more attractive again.
On the spot market, nearly over $7 million was withdrawn from exchanges over the past day. This means that investors were likely moving their holdings to their cold wallets, likely expecting further price appreciation and intending to hold for the long term.
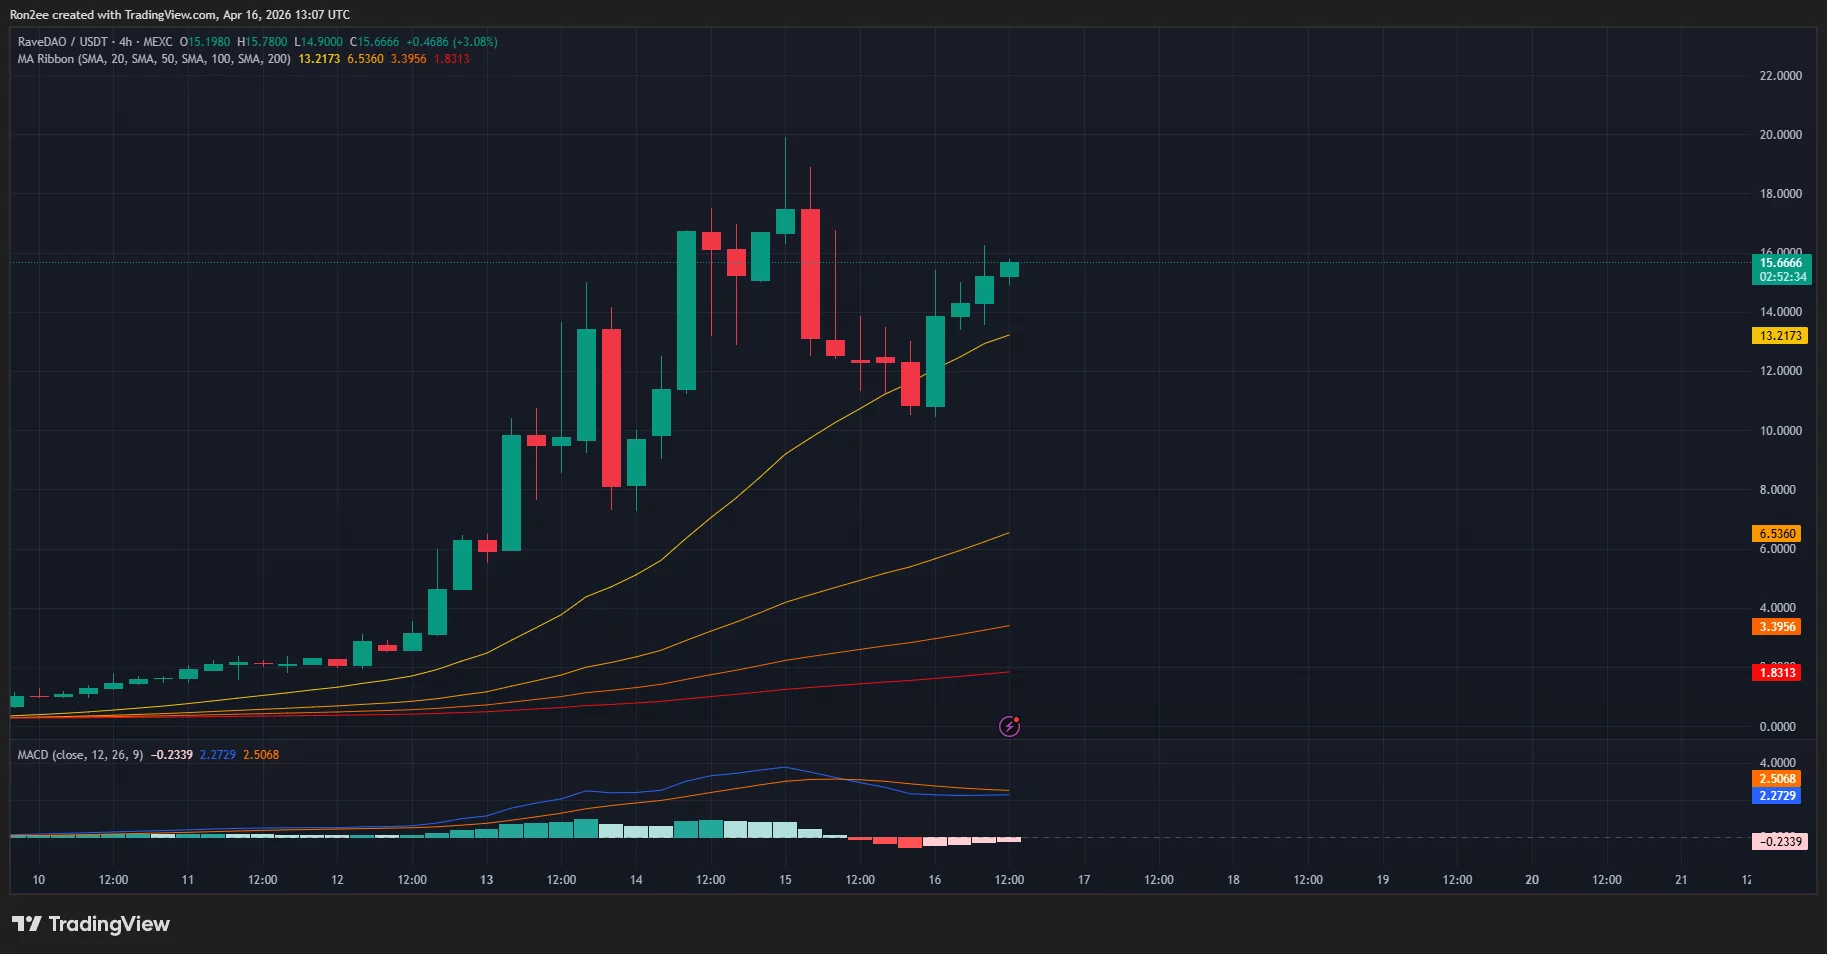
Amidst these developments, its price action charts also seem to hint that the token is preparing for its next height, potentially to a new all-time high above $20.
On the 4-hour chart, RaveDAO price was trading above all of the simple moving averages. This means the immediate trend remains firmly bullish. At the same time, the MACD lines are drawing closer to a bullish crossover, which would confirm that the temporary correction has ended and the next leg of the rally is beginning.

Disclosure: This article does not represent investment advice. The content and materials featured on this page are for educational purposes only.

Key Takeaways
- Abbott shares plunge 4.34% even as revenue surpasses forecasts and earnings hold steady
- Operating margins compress significantly as expenses outpace revenue expansion
- Company slashes annual earnings forecast, sparking investor concerns
- Exact Sciences acquisition strengthens oncology portfolio while pressuring near-term profits
- First-quarter results exceed expectations, yet margin weakness drives stock decline
Shares of Abbott Laboratories (ABT) tumbled in pre-market hours despite delivering robust first-quarter revenue figures and maintaining steady earnings. The healthcare giant’s decision to lower its full-year profit outlook coupled with deteriorating operating margins spooked investors, raising red flags about the company’s ability to maintain profitability. Trading at $97.10, the stock shed 4.34% as sellers dominated following the earnings announcement.
First Quarter Results Show Solid Top-Line Growth
Abbott Laboratories posted first-quarter sales of $11.16 billion, surpassing Wall Street projections by 1.3%. The healthcare company achieved 7.8% year-over-year sales growth, demonstrating consistent performance across its diverse healthcare divisions. Organic growth trends remained measured, suggesting the underlying business expansion progressed at a sustainable pace.
On the earnings front, Abbott reported adjusted earnings of $1.15 per share, perfectly aligning with analyst forecasts. This represented an improvement from the $1.09 per share recorded in the comparable quarter last year, showing incremental profit gains. However, meeting expectations precisely without upside failed to generate enthusiasm among market participants.
The diversified healthcare manufacturer operates across multiple segments including diagnostics, medical devices, nutritional products, and established pharmaceuticals. Ongoing innovation initiatives and market expansion strategies have supported consistent quarterly revenue growth. Yet the company’s five-year average annual revenue growth of just 3.9% trails more dynamic competitors in the healthcare space.
Profitability Challenges and Guidance Reduction
Abbott disclosed an adjusted operating margin of 12% for the quarter, representing a substantial decline from the 16.3% margin achieved one year earlier. Expense growth exceeded sales growth, undermining operational efficiency throughout the period. This margin deterioration sparked concerns regarding the company’s cost management capabilities and economies of scale.
Management also trimmed its full-year adjusted earnings per share guidance to a midpoint of $5.48. This downward revision represented a 3.4% decrease compared to previous forecasts, suggesting more conservative internal assumptions. The guidance cut proved instrumental in driving the negative market response to otherwise solid quarterly results.
Examining the longer-term trend, Abbott’s operating margin has contracted by 6.2 percentage points over the past five years, indicating persistent profitability headwinds. Annual earnings per share growth has averaged merely 3.8%, tracking closely with the company’s moderate revenue trajectory. These metrics underscore Abbott’s struggle to achieve meaningful operating leverage despite its considerable scale.
Growth Initiatives and Future Projections
The company recently finalized its purchase of Exact Sciences, bolstering its capabilities in cancer diagnostics. This strategic transaction adds a promising high-growth business line expected to accelerate future sales. However, the acquisition simultaneously introduces short-term earnings dilution, which factored into the revised guidance framework.
Abbott continues investing in medical technology innovation through strategic partnerships and clinical research in cardiovascular health and diabetes management. Recent product trials have demonstrated enhanced clinical outcomes, reinforcing the company’s relevance in evolving healthcare markets. These investments lay groundwork for gradual improvement in growth trajectories.
Wall Street analysts project Abbott’s revenue will expand by 11.1% over the coming twelve months, suggesting accelerating momentum ahead. Forecasted earnings per share growth of 8.5% indicates expectations for profitability recovery. Nevertheless, immediate margin pressures and the reduced guidance continue to create headwinds for investor sentiment in the near term.

AllUnity, a regulated European stablecoin issuer, is expanding its euro-pegged stablecoin, EURAU, across major decentralized exchanges (DEXs).
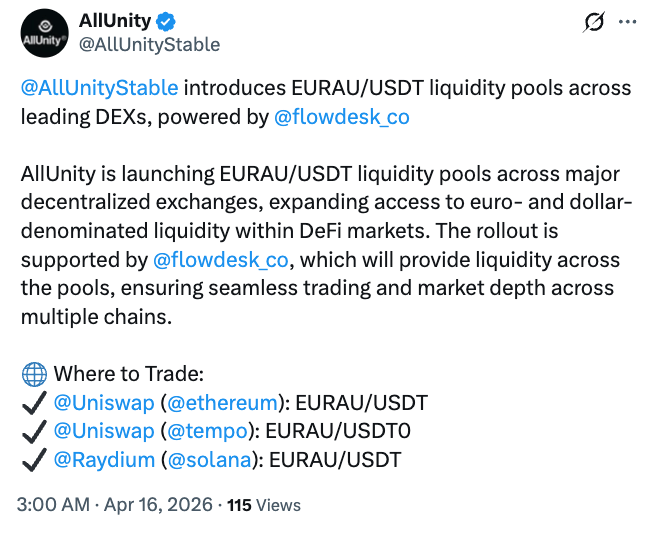
The company announced Thursday that its EURAU stablecoin is entering liquidity pools across major DEXs, including Uniswap, currently the largest decentralized exchange by trading volumes.
The rollout includes two EURAU trading pairs, one against Tether USDt (USDT) on Ethereum, and another against USDT0 — an omnichain version of USDT — on the Tempo blockchain. It also includes the EURAU/USDT pair on Solana via the Raydium DEX.

AllUnity’s DEX push comes as uncertainty persists over how far decentralized finance (DeFi) falls within the scope of the European Union’s Markets in Crypto-Assets Regulation (MiCA) regime.
While DeFi is generally considered outside the scope of the framework, the European Central Bank last month questioned whether decentralized autonomous organizations are decentralized enough to remain outside MiCA’s regulatory perimeter.
AllUnity built EURAU under BaFin licence
AllUnity operates as a MiCA-compliant stablecoin issuer after obtaining an Electronic Money Institution license from the German Federal Financial Supervisory Authority (BaFin) in July 2025.
AllUnity launched EURAU on July 31, 2025. The token remains small by market capitalization compared with the largest euro stablecoins.

AllUnity has been expanding the presence of its EURAU stablecoin across exchanges, with listings on centralized exchanges (CEXs) such as Bullish as well as decentralized ones like Aerodrome. Aerodrome became the first DEX integration for EURAU in December 2025.
Dollar stablecoins still dominate
The MiCA framework, which entered into full force in late 2024, has often been seen as a tool to address the dominance of stablecoins pegged to the US dollar.
Some major issuers, including Tether, have openly criticized the framework and declined to seek compliance in the EU, citing concerns over its requirements, which led to some compliant exchanges delisting its USDT stablecoin.
Some banking officials have since said MiCA may not be sufficient to address the dominance of US dollar-pegged stablecoins, which still account for 97% of the $316 billion market globally, according to CoinGecko.
Related: Bank of France calls for tougher MiCA limits on stablecoin payments
As AllUnity’s DEX push also involves major US dollar stablecoins, it remains unclear how regulators will respond to these developments.
“Expanding EURAU liquidity across DEXs is an important step in building a robust and accessible euro liquidity layer,” AllUnity’s executive Rupertus Rothenhäuser said, adding:
“We’re enabling seamless euro — dollar trading, empowering institutions and liquidity providers to participate in deep, efficient markets.”
Cointelegraph contacted AllUnity for comment regarding potential conflicts with the EU regulation but did not receive a response at the time of publication.
Magazine: How crypto laws changed in 2025 — and how they’ll change in 2026
Key Highlights
- First quarter revenue reached 129.1 billion yuan, representing a 52.5% year-over-year increase and surpassing analyst forecasts of 108.16 billion yuan.
- Net profit totaled 20.74 billion yuan, marking a 48.5% rise and exceeding the consensus estimate of 16.94 billion yuan.
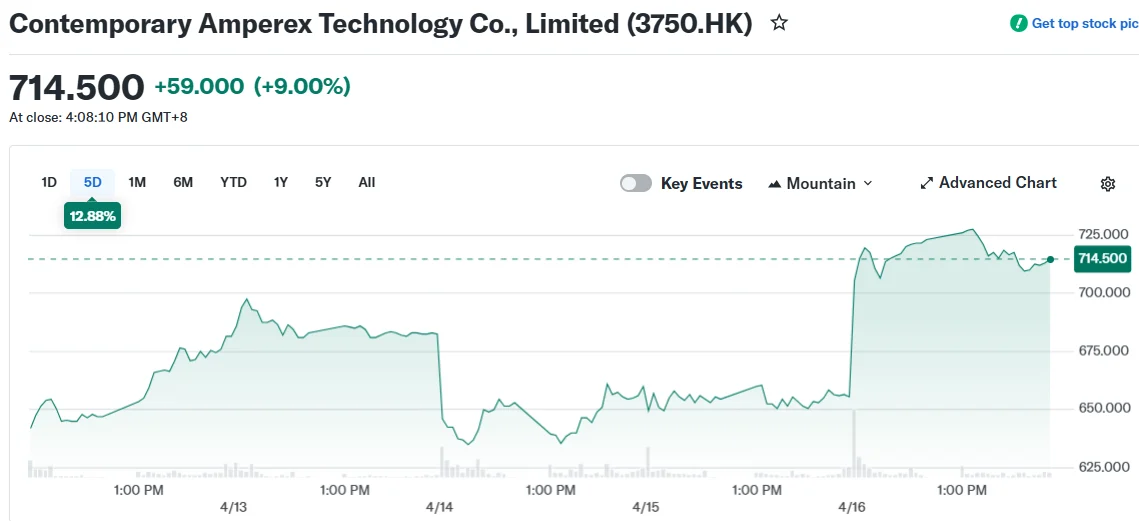
- Shares traded in Hong Kong jumped more than 10% to an all-time high of HK$724.50, while the Shenzhen-listed shares climbed 7% to 460 yuan.
- The company commands a 30% share of the worldwide energy storage system market, which experienced 79% demand expansion in 2025.
- Over the trailing 12 months, CATL shares have gained 101%, significantly outperforming the Hang Seng Index’s 23% advance.
Contemporary Amperex Technology (CATL), the global leader in electric vehicle battery manufacturing, delivered first-quarter results on Thursday that significantly exceeded Wall Street projections. The impressive performance propelled the company’s shares to unprecedented peaks across both trading venues.
Quarterly revenue totaled 129.1 billion yuan ($18.93 billion), representing a 52.5% jump compared to the corresponding quarter last year. Wall Street analysts had projected revenue of approximately 108.16 billion yuan, based on FactSet consensus estimates.
Profit attributable to shareholders reached 20.74 billion yuan—reflecting a 48.5% year-over-year expansion. Market expectations had been centered around 16.94 billion yuan.

Operating profit for the period stood at 26.7 billion yuan. The company’s earnings per share increased to 4.58 yuan from 3.18 yuan in the prior-year quarter.
CATL’s Hong Kong-traded shares soared more than 10% during Thursday’s trading session, touching a record high of HK$724.50. Meanwhile, the company’s Shenzhen-listed shares advanced as much as 7% to reach 460 yuan, also establishing a new all-time peak.
The broader Hong Kong market also posted strong gains. The Hang Seng Index advanced 1.7%, while mainland China’s CSI 300 rose 1.1%.
Diversification Beyond Electric Vehicles
CATL counts Tesla among its major automotive clients. The company attributed the quarter’s robust growth to expansion across its primary battery operations and sustained worldwide appetite for electrification solutions.
Chinese electric vehicle sales have faced headwinds in 2026 after government incentive programs concluded at year-end. However, CATL has been establishing a stronger foothold in an alternative energy sector.
Energy storage systems (ESS)—large-scale batteries designed to capture excess electricity for future deployment—are becoming increasingly significant. Worldwide ESS demand soared 79% in 2025, according to data from SNE Research. CATL controlled a 30% portion of the global ESS market by the conclusion of 2025.
The continuing geopolitical tensions involving Iran have amplified expectations for energy storage demand, as these developments may accelerate investments in power infrastructure and alternatives to conventional energy distribution networks.
Shares Double Over 12-Month Period
CATL stock has skyrocketed 101% throughout the past year. By comparison, the Hang Seng Index has advanced 23% during the identical timeframe.
This performance differential is striking. While the broader Hong Kong equity market has delivered respectable returns, CATL has essentially quadrupled that pace.
Thursday’s record closing prices extend an impressive winning streak for the shares. The company achieved simultaneous all-time highs on both its Hong Kong and Shenzhen listings within the same trading day.
Quarterly earnings per share registered at 4.58 yuan, climbing from 3.18 yuan in the year-ago period.
The company chose not to issue forward-looking guidance in its earnings announcement, though the quarter’s actual results substantially exceeded analyst projections on both revenue and profitability measures.
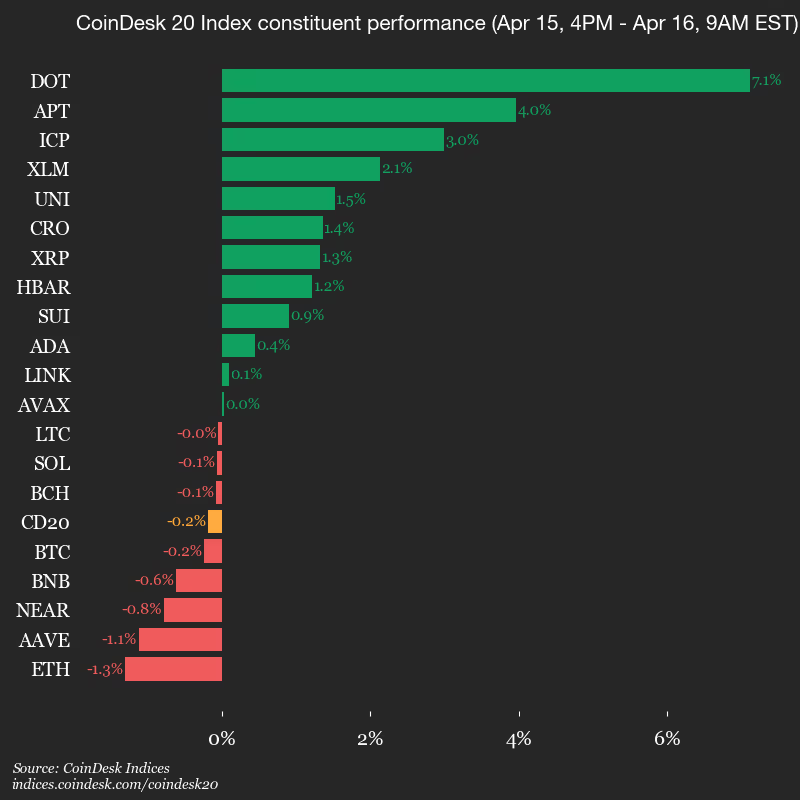
CoinDesk Indices presents its daily market update, highlighting the performance of leaders and laggards in the CoinDesk 20 Index.
The CoinDesk 20 is currently trading at 2083.34, down 0.2% (-3.93) since 4 p.m. ET on Wednesday.
Twelve of 20 assets are trading higher.

Leaders: DOT (+7.1%) and APT (+4.0%).
Laggards: ETH (-1.3%) and AAVE (-1.1%).
The CoinDesk 20 is a broad-based index traded on multiple platforms in several regions globally.
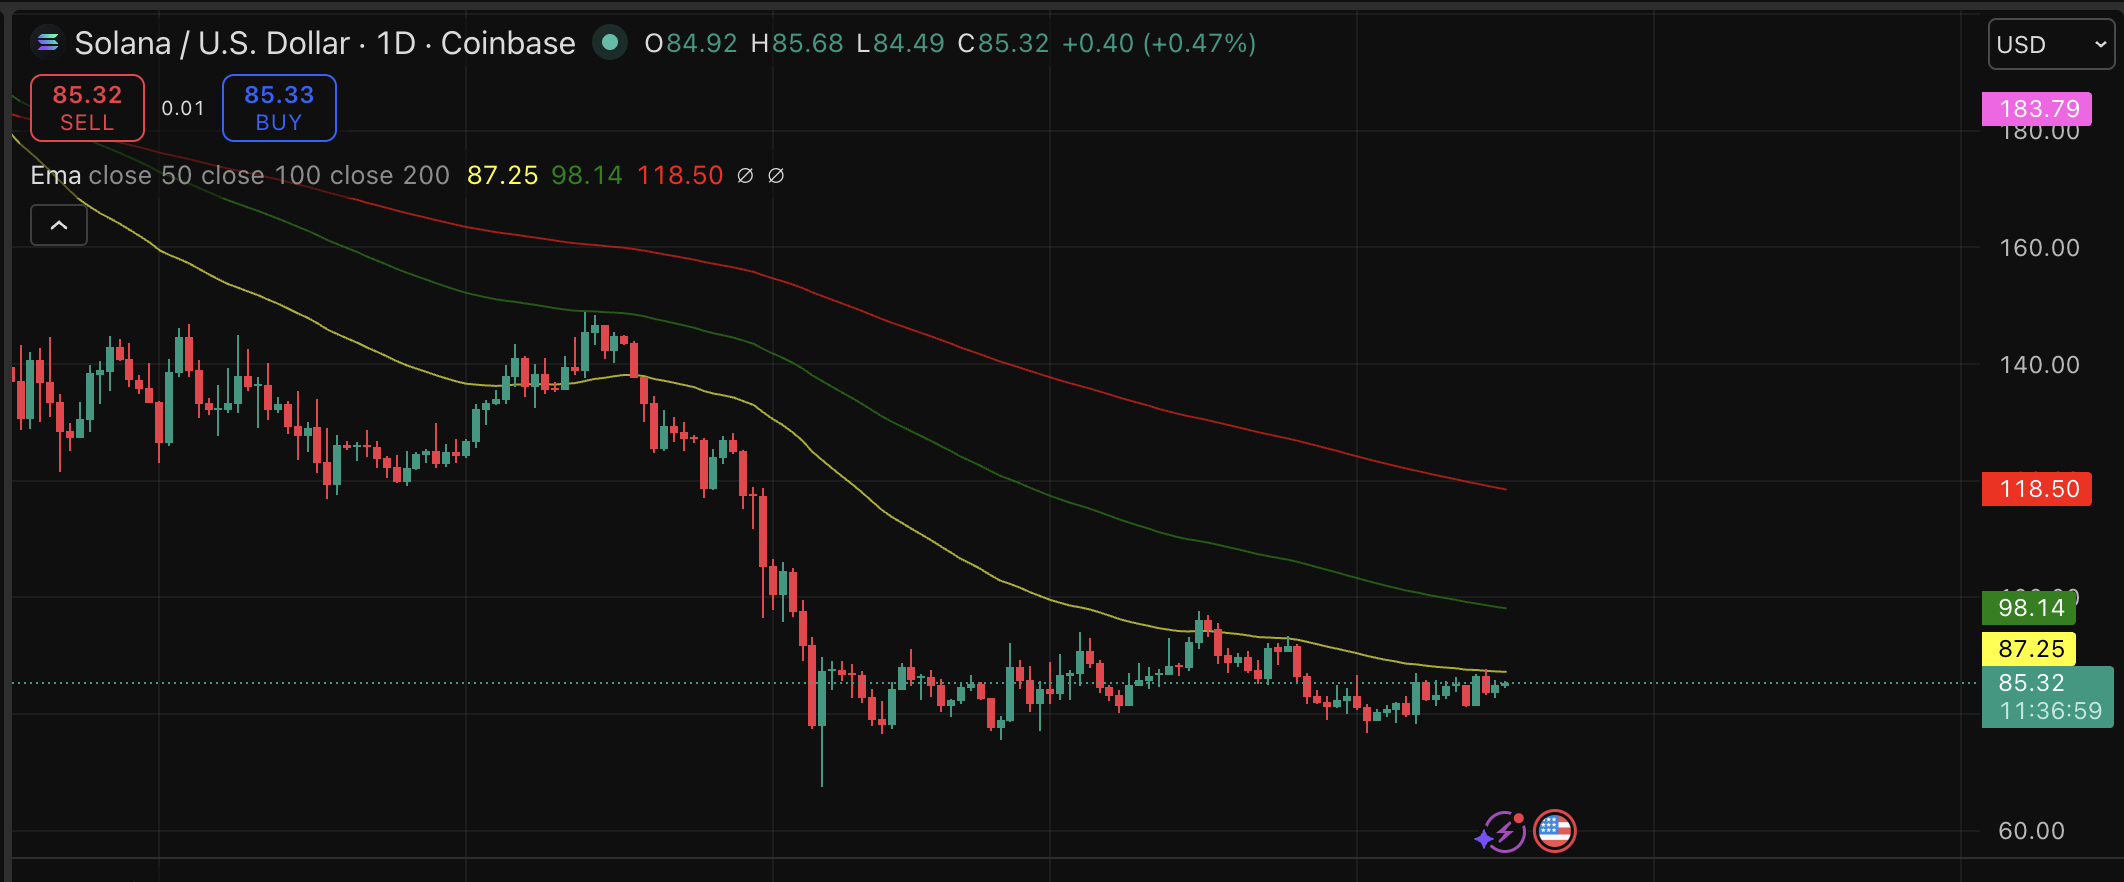
Solana’s official X account posted a single word last night, “XRP,” and the internet promptly lost its mind. Solana itself is currently trading at a $85 price range in a muted price reaction that stands in sharp contrast to the social prediction the post triggered.
The post paired that lone word with a four-second cinematic animation of the Solana logo, no caption, no thread, no explanation. Millions of views followed within hours. The XRP community declared a “flip the switch” moment; Solana’s account fanned the flames with replies including “time to flip the switch” and “we signed 589 NDAs”. The latter a deliberate nod to one of XRP’s most enduring inside jokes.
Against this backdrop of social spectacle, SOL’s underlying technicals tell another story, one worth parsing before drawing any conclusions.
Discover: The best pre-launch token sales
Solana Price Prediction: Break $90 Resistance Now?
SOL has traded in a tight 24-hour range between $84 and $85. The price action is technically compressed. Our short-term model targets $90 as the critical resistance for any near-term recovery, with tomorrow’s range pegged at $84–$86.
SOL holds above its 10- and 20-day EMAs, tentatively constructive, but remains pinned below the 50-, 100-, and 200-day EMAs, all of which are bearish on the daily chart.

If SOL can clear $86 on sustained volume, it could open a path toward $88–$90 resistance. For now, consolidation between $82 and $86 is the most likely scenario, with the contracting triangle on the hourly chart resolving directionally within days.
The XRP tweet generated attention, but not volume. Until SOL clears $86 with conviction, the path of least resistance remains sideways.
Discover: The best crypto to diversify your portfolio with
LiquidChain Breaking Social as Solana Tests Key Levels
SOL consolidating below multi-month EMAs is precisely the environment where traders start asking whether large-cap exposure still offers asymmetric upside, or whether that window has already closed at a $48B market cap.
The XRP angle adds narrative heat, but narrative alone doesn’t move price. That asymmetry question is worth taking seriously. For context on where XRP itself fits into the current macro picture, recent XRP price analysis highlights the regulatory tailwinds still in play.
One early-stage project drawing attention in this environment is LiquidChain ($LIQUID), a Layer 3 infrastructure protocol positioning itself as the cross-chain liquidity layer for the BTC, ETH, and SOL ecosystems simultaneously.
A new layer emerges. Only a few see it first. — LiquidChain (@getliquidchain) March 24, 2026
The future is LiquidChain  ⟁https://t.co/vqvBcdSj94 pic.twitter.com/R7ZeZ0NPGl
The core proposition: a Unified Liquidity Layer that fuses Bitcoin, Ethereum, and Solana liquidity into a single execution environment, with Deploy-Once Architecture allowing developers to build once and access all three networks.
The presale has raised $675K at a current price of $0.0145, with more than 1600% APY staking bonus. Verifiable features include Single-Step Execution and Verifiable Settlement, infrastructure-layer tooling aimed at the fragmentation problem that has dogged multi-chain development for years.
Research LiquidChain’s presale structure before the next price increase.
The post Solana Price Prediction: SOL Twitter Dropped XRP Bomb appeared first on Cryptonews.


- BNB price hovers near $620 as bulls target a fresh short-term rally.
- The 35th quarterly burn has reduced BNB supply to 134.7 million.
- A shift in macro and geopolitical conditions could bolster BNB and other altcoins.
BNB price traded to highs of $630 on Wednesday, recovering to intraday highs after earlier moves across crypto dented bulls’ plans.
The rejection at the multi-week peak means the Binance Coin’s value is back near the $620 mark, where buyers are looking to pile in as the BNB Foundation reveals its second quarterly burn of 2026 has cut the native token supply to approximately 134.7 million.
Could this supply squeeze help BNB price higher, or are short-term headwinds too strong for bulls?
BNB supply drops amid quarterly burn
According to the BNB Foundation, the 35th quarterly burn has permanently removed 1,569,307.34 BNB tokens valued at $1.02 billion from circulation.
This means the total supply has dropped further, with the metric now at 134,786,916.53 and reinforcing the coin’s deflationary mechanism.
On a bullish note, what this burn does is to advance BNB toward the 100 million token target.
More than 40% of the initial supply has now been eliminated since BNB’s launch, with regular removals introduced in 2021. In January this year, Binance marked the 34th burn, which removed 1.37 million BNB worth $1.29 billion at the time.
Surging on-chain metrics, such as all-time high daily active users and dApp usage, have directly boosted the burn’s scale amid growth in real-world assets, DeFi, gaming, and layer-2 ecosystems.
$16,600,000,000 in tokenized assets on BNB Chain, making it a new ATH.
According to @tokenterminal 👇 https://t.co/gFwSsV9Kis
— BNB Chain (@BNBCHAIN) April 9, 2026
BNB price analysis
While BNB exploded in 2025, the past several months have seen the ecosystem token struggle with downside pressure. Controversial headlines and fear, uncertainty, and doubt (FUD) around Binance and its founder, Changpeng Zhao, have contributed to the downtrend since the highs of $1,300.
Notably, the 54% dip from the ATH of $1,370 on October 13, 2025, aligned with overall losses for Bitcoin and Ethereum.
Macroeconomic and geopolitical headwinds have largely capped BTC, with the latest uptick stalling around $76,000.
Currently, BNB price lingers near $620, slightly off highs seen after the burn and in line with Bitcoin’s retest of the $74k level.
Despite this outlook, a double-bottom formation at the $600 support zone points to bullish reversal prospects for BNB. Positive momentum indicators and fresh flows could strengthen this picture.
If Bitcoin rides macro and geopolitical tailwinds to a new year-to-date peak, BNB could test resistance at $800.
The supply zone coincides with the 50-week moving average; breaching it could propel prices to the $1,000-$1,200 hurdle.
However, a close below $600 risks awakening more bears.
If this mirrors a broader crypto downturn, the next support level could be around $530.

Momentum is building in Washington for the long-awaited CLARITY Act, with JPMorgan (JPM) pointing to signs that negotiations may be nearing a breakthrough.
JPMorgan said discussions among lawmakers and regulators suggest the legislation is close to completion, with only a small number of issues still unresolved in a Wednesday report.
One senior policy official noted that the list of contentious items has narrowed from roughly a dozen to just “2–3 issues,” while debate around stablecoin rewards is now “in a good place.”
The CLARITY Act is designed to define how digital assets are regulated in the U.S., including how oversight is divided between agencies such as the Securities and Exchange Commission (SEC) and the Commodity Futures Trading Commission (CFTC). It also addresses how stablecoins and decentralized finance platforms should be treated under existing financial rules.
Lawmakers involved in the discussions struck an optimistic tone. A Senate staffer familiar with the process said the draft legislation is “very close,” with remaining questions around areas like DeFi oversight and token classification potentially resolved in the near term, according to the report.
One of the most closely watched debates centers on whether stablecoin issuers should be allowed to offer yield-like rewards to users. The issue has drawn pushback from banks, which argue such features could replicate deposit-taking without the same regulatory safeguards.
The latest proposals could find support from both crypto firms and traditional financial institutions, according to JPMorgan.
Still, the path forward is not without risk. The final legislative text has yet to be released and no formal vote has been scheduled. Timing is also a factor, with some policy experts warning that delays could push the bill into a more uncertain political environment.
JPMorgan noted that the outlook for the 2026 midterm elections remains mixed, with expectations that Democrats could regain control of the House of Representatives. If that scenario plays out, crypto legislation could lose priority, potentially slowing further progress.
For now, the direction of travel appears clear. As one policy advisor put it, “there is no such thing as a perfect bill,” underscoring willingness among stakeholders to compromise in order to establish a workable framework.
If passed, the CLARITY Act would mark a major step toward integrating digital assets into the U.S. financial system, providing rules that industry participants have sought for years.


Taiwan Semiconductor Manufacturing Company reported strong first-quarter earnings on Thursday, as steady demand for artificial intelligence chips pushed both revenue and profit to record levels.
Summary
- Taiwan Semiconductor Manufacturing Company posted a 58% jump in Q1 profit to a record NT$572.48 billion, beating estimates as AI chip demand stayed strong.
- Revenue rose 35% year over year, with Nvidia-led demand driving growth and pushing advanced chips to dominate the sales mix.
- TSMC expects over 30% revenue growth in 2026 and plans higher capex as capacity remains tight amid persistent AI demand.
The world’s largest contract chipmaker posted net income of $18.2 billion for the three months ended March, up 58% from a year earlier and ahead of expectations. The result extended its streak of record profits to a fourth consecutive quarter. It also marked its eighth straight period of double-digit growth.
According to LSEG SmartEstimates, which weigh forecasts from consistently accurate analysts, Taiwan Semiconductor Manufacturing Company beat expectations on both revenue and profit.
The company reported revenue of about $35 billion, ahead of the expected $34.8 billion, while net income came in at around $18.2 billion, surpassing estimates of roughly $17.3 billion. On a yearly basis, revenue rose 35% to about $35 billion, in line with the preliminary figure disclosed earlier.
As Asia’s largest listed technology firm, TSMC manufactures chips used across a wide range of industries, from consumer electronics to hyperscale data centers. It has seen strong demand from major clients such as Apple and Nvidia, with the latter now its largest customer due to rising demand for AI processors.
Chief Executive C.C. Wei said “AI-related demand continues to be extremely robust,” adding that rapid advances in artificial intelligence are driving more computing needs and, in turn, higher semiconductor demand. He also pointed to strong customer signals that support expectations for a multi-year growth cycle tied to AI.
TSMC now expects full-year 2026 revenue to grow by more than 30% in U.S. dollar terms, slightly above its earlier outlook. For the second quarter, it forecast revenue between $39 billion and $40.2 billion, implying about 10% sequential growth.
The upbeat guidance comes despite concerns over supply chain risks linked to the Middle East conflict, which could affect energy supplies and key materials such as helium and hydrogen. Executives said they do not expect any near-term disruption, noting the company maintains safety inventories and sources critical inputs from multiple suppliers.
Advanced chips lead revenue mix
High-performance computing, which includes AI and 5G applications, remained the main driver of sales, accounting for 61% of total revenue in the first quarter.
Advanced chips, defined as 7-nanometer or below, made up around 74% of wafer revenue. Within that, 3-nanometer chips contributed 25%, highlighting a rapid shift toward more advanced nodes. Smaller process nodes allow for more compact transistor designs, improving both performance and energy efficiency.
To keep up with demand, TSMC is expanding its manufacturing footprint. The company confirmed plans to add a new advanced fabrication plant in Tainan, Taiwan, while also scaling 3-nanometer capacity across Taiwan, the United States, and Japan. Its U.S. expansion forms part of a broader $165 billion investment in Arizona.
William Li, senior analyst at Counterpoint Research, said demand for AI chips has effectively pushed TSMC’s production capacity to its limits.
“Demand still significantly outpaces supply and isn’t showing any major sign of slowing down,” Li said, adding that tight capacity conditions are likely to persist through 2026.
External analysts echoed similar views, noting that TSMC’s facilities are operating at high utilisation levels as AI workloads continue to drive orders.
The company reiterated that capital expenditure for 2026 will be at the upper end of its previously guided $52 billion to $56 billion range, as it accelerates expansion to meet sustained demand.
Crypto World
Chainlink price approaches bullish SMA crossover as whales accumulate, will it breakout?
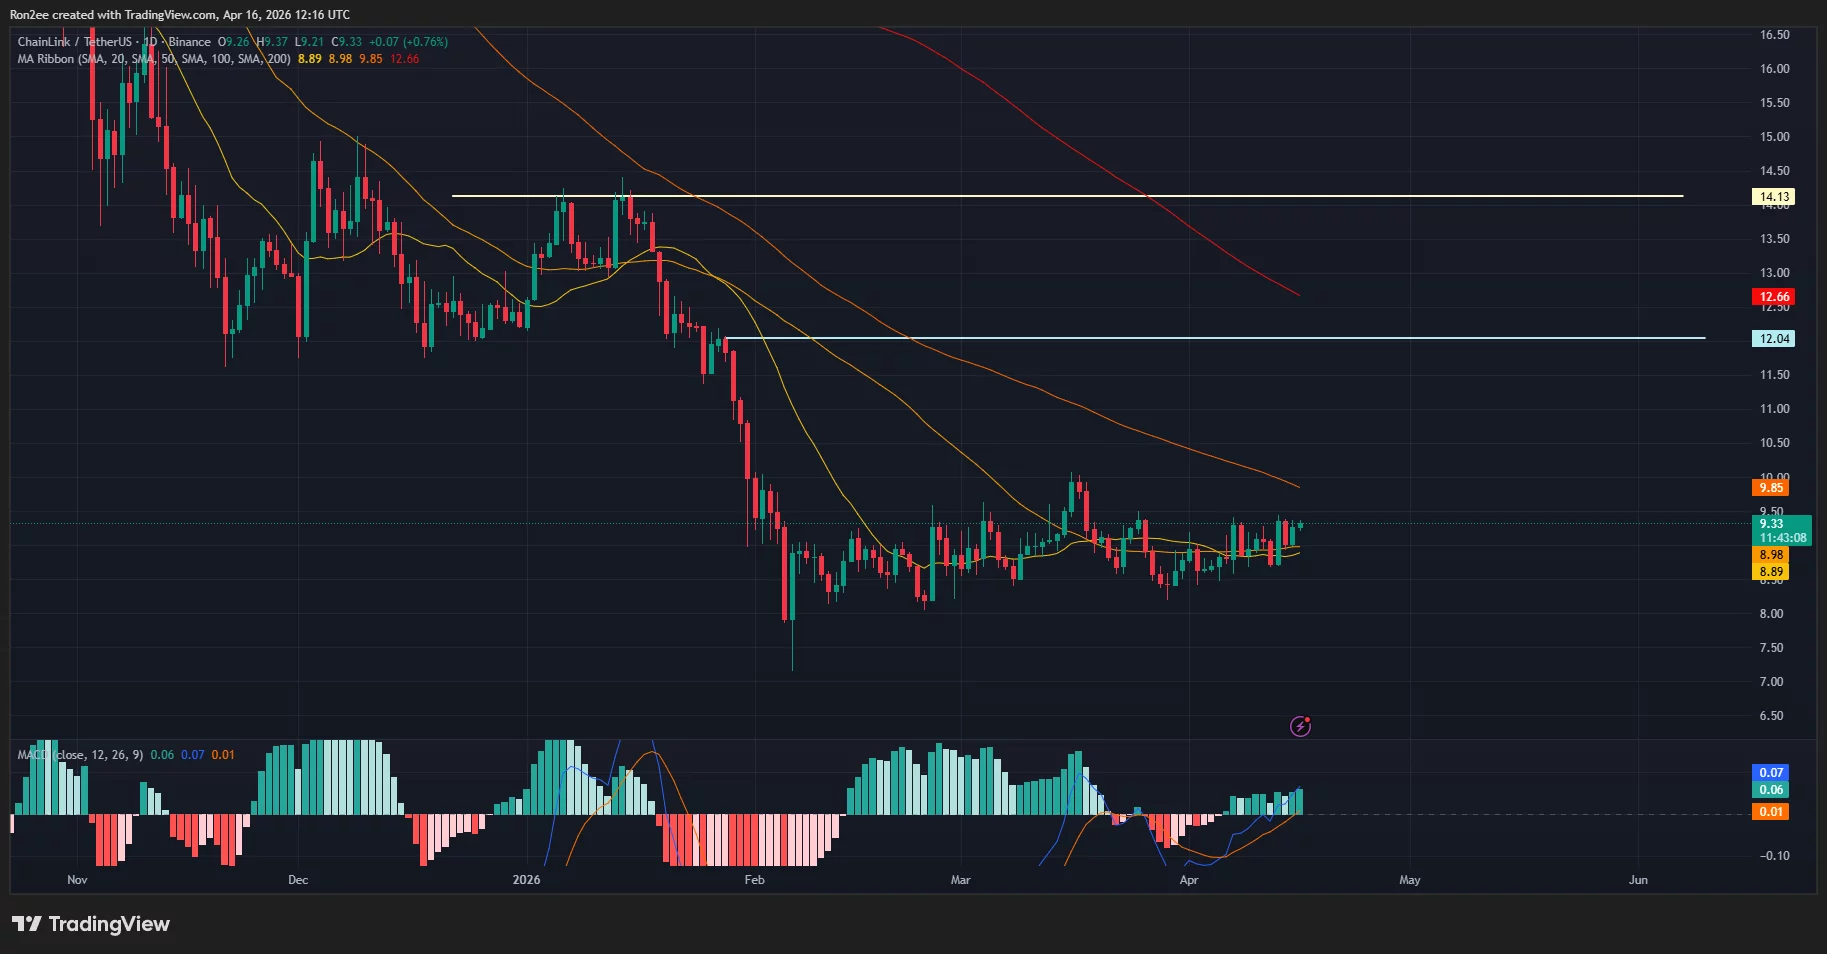
Chainlink price has remained confined in the consolidation range between $8 and $10 since early February this year as market participants weigh broader macroeconomic uncertainty against the protocol’s growing fundamental utility.
Summary
- Chainlink price remains range-bound between $8 and $10 after dropping over 40% from its January high, with technical indicators hinting at a potential breakout.
- A bullish SMA crossover, along with rising RSI and MACD, suggests momentum is building, with upside targets at $12 and $14 if resistance breaks.
- Partnerships, whale accumulation, and growing LINK reserves are tightening supply and could act as key catalysts for a sustained rally.
According to data from crypto.news, the Chainlink (LINK) price fell over 40% from its January high of $14.12 to a yearly low of $7.93 in February. It has since entered into a consolidation phase between the $8 and $10 range as liquidity remains fragmented across the decentralized finance sector.
Despite the recent stagnation, a look at charts reveals several conditions that are close to completion that could potentially empower the token to exit from consolidation and potentially spark a sustained rally.
On the daily chart, Chainlink price appears to be approaching a bullish crossover between the 50-day SMA and the 100-day SMA. Such a crossover, which indicates strengthening medium-term momentum, has previously been a precursor to significant parabolic moves.

In Chainlink’s case, a crossover could lead its price to climb as high as $12, which represents the next key psychological resistance level. A strong breakout from this range with supporting trading volume could push prices all the way up to its year-to-date high of $14.
Momentum indicators like the MACD and the RSI lines both seem to suggest that a bullish reversal is already underway, as both of these metrics were pointed upward.
However, on the flip side, a drop below $9 support could shift the trajectory towards the next floor at $8, which forms the ultimate demand zone for bulls.
There appear to be a few key catalysts that could help Chainlink price sustain this newfound momentum.
First, the most significant catalyst for Chainlink’s price this week is its partnership with SIX Group, the operator of Swiss and Spanish stock exchanges. SIX is now delivering real-time equity pricing for blue-chip stocks worth approximately €2 trillion directly to smart contracts via Chainlink.
The integration makes regulated financial data accessible to over 2,600 blockchain applications, reinforcing Chainlink’s role as the standard for institutional tokenization.
Second, on-chain data reveals whales have been accumulating the token while absorbing the supply of the token in a manner that often precedes a supply shock rally. Last week, whale wallets added approximately 3.30 million LINK tokens.
Furthermore, whales recently moved 265,132 LINK worth $2.38 million off exchanges, thus reducing the risk of these assets being sold on the open market.
Third, the Chainlink Reserve, a specialized vault for protocol revenue, continues to grow and currently holds over 3 million LINK tokens as protocol fees are automatically converted to the native token. This mechanism effectively tightens the circulating supply by locking up tokens as the network achieves greater adoption.
Disclosure: This article does not represent investment advice. The content and materials featured on this page are for educational purposes only.

RAVE crypto defends $10 support, can bulls push to a new high?

Alex Manninger: Ex-Arsenal goalkeeper dies after car hit by train

Bigger checks, fewer bets: Seattle startup deal count drops to lowest level since 2020

Why Israel is blocking foreign journalists from entering

Bitcoin: We’re Entering The Most Dangerous Phase

Alan Cumming Brands Baftas Ceremony A ‘Triggering S**tshow’

Learn How Rich People Hide Money (Not Show It!) | Powerful Financial Advice | Warren Buffett’s Rule

Ripple CEO Goes To Washington #crypto #cryptocurrency #xrp #bitcoin #cryptonews

Make Money in Financial Markets without Trading
-

 Politics6 days ago
US brings back mandatory military draft registration
-
 Sports6 days ago
Man United discover Nico Schlotterbeck transfer fee as defender reaches Dortmund agreement
-

 Fashion6 days ago
Weekend Open Thread: Veronica Beard
-

 Politics6 days ago
Malcolm In The Middle OG Turned Down ‘Buckets Of Money’ To Appear In Reboot
-

 Politics4 days ago
World Cup exit makes Italy enter crisis mode
-

 Business6 days ago
Tesla Model Y Tops China Auto Sales in March 2026 With 39,827 Registrations, Beating Cheaper EVs and Gas Cars
-

 Crypto World3 days ago
The SEC Conditionalises DeFi Platforms to Be Avoided for Broker Registration
-

 Crypto World3 days ago
SEC Signals Exemption for Crypto Interfaces From Broker Registration
-

 News Videos1 day ago
Secure crypto trading starts with an FIU-registered
-
 NewsBeat4 days ago
Pep Guardiola and Gary Neville agree over Arsenal title problem that benefits Man City
-

 Business5 days ago
Ireland Fuel Protests Enter Day 5 as Blockades Spark Shortages and Government Prepares Support Package
-

 Business6 days ago
OpenAI Halts Stargate UK Data Centre Project Over Energy Costs and Copyright Row
-

 Politics6 days ago
LBC Presenter Mocks Trump Over Iran War Failures
-

 Crypto World6 days ago
Federal judge blocks Arizona from bringing criminal charges against Kalshi
-

 NewsBeat2 days ago
Trump and Pope Leo: Behind their disagreement over Iran war
-

 Crypto World2 days ago
SEC Proposes Certain Crypto Interfaces Don’t Need to Register as Brokers
-
 NewsBeat4 days ago
JD Vance announces ‘no agreement’ with Iran over nuclear weapons fear
-

 Tech7 days ago
A version of Windows 10 released a decade ago is now eligible for additional security patches
-

 Business6 days ago
IMF retains floor for precautionary balances at SDR 20 billion
-

 Business6 days ago
Former Liverpool CEO eviscerates FIFA for World Cup ticket pricing
You must be logged in to post a comment Login